David Mercer B.Eng ( hon ) CEM CMVP Engineering Lead ... Lead Energy & Carbon Services Golder...
80
David Mercer B.Eng (hon) CEM CMVP Engineering Lead Energy & Carbon Services Golder Associates
Transcript of David Mercer B.Eng ( hon ) CEM CMVP Engineering Lead ... Lead Energy & Carbon Services Golder...

David Mercer B.Eng (hon) CEM CMVPEngineering Lead
Energy & Carbon ServicesGolder Associates

Workshop Agenda
Ice-breaker: Barriers & Drivers
1.Energy Audit Basics2.Instrumentation for Audits3.Energy Assessment
� Utility Bills� Demand Analysis� Load Inventory� EMOs
4.Assessing the Business Case5.Reporting Guidelines

Defining Energy Management
“The judicious and effective use of energy to maximise profits (minimise costs) and enhance competitive positions.”
Capehart, Turner & Kennedy. Guide to Energy Management (2nd ed.) 1997

Defining Energy Management

Barriers & Drivers
� Write down the top 3 “Barriers” to EE in your organization
� Do the same for “Drivers”� 3 minutes

Barriers & Drivers
Barriers
� Time� Resources� Politics� Culture� Fear
Drivers
� Financial� Legislation� Clients� “Green” Issues

Energy Audit Basics
� The Energy Balance� Defining the audit type
� 10-step audit process� Pre-audit data & information required
� Planning your site visits

Energy Audit BasicsThe Energy Balance
� Draw from the 1st Law of Thermodynamics� The Law of Conservation of Energy
� We can account for energy as it is neither created nor destroyed in the systems we operate
� What comes in = What goes out� The challenge lies in defining the system and
measuring the ins and outs

Energy Audit BasicsThe Energy Balance
Energy Audit BasicsDefining the Audit type
� Type 1: Preliminary Audit
� Brief review of utility bills
� Brief review of operating data
� Minimal interviews
� Walk-through
� Identify major areas of opportunity
� Quick cost/benefit analysis
� Brief report

Energy Audit BasicsDefining the Audit type
� Type 2: General Audit� Builds on Type 1� Analysis includes historical utility invoices� Look at tariff structure & alternatives� Includes profile analysis and sub-meter data� More detailed evaluation of EMOs� In-depth interview with staff� Detailed cost/benefit analysis using site’s criteria� Thorough reporting

Energy Audit BasicsDefining the Audit type
� Type 3: Investment Grade Audit� Builds again on Type 2� Model of energy-use characteristics of facility and all
EMOs identified� Model calibrated against actual utility data to give real
savings baseline� Complete understanding of all energy using systems� Utility data is supplemented by profile data and
detailed sub-meter data� Comprehensive financial reporting

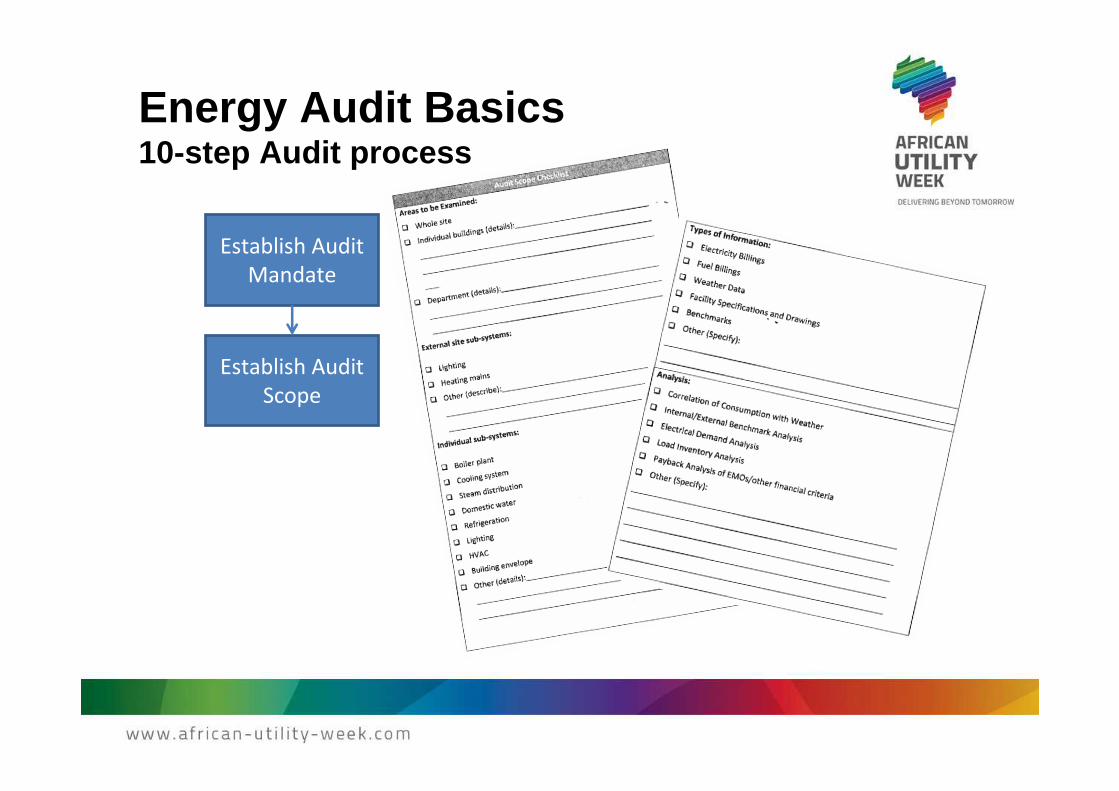
Energy Audit Basics10-step Audit process
Establish Audit
Mandate
Establish Audit
Scope
Walk-throughAnalyse usage
patterns
Energy Usage
Inventory
Identify
OpportunitiesCost / Benefit
Reporting
Analyse Costs
and
Consumption
Compare
Performance

Energy Audit Basics10-step Audit process
Establish Audit
Mandate
Energy Audit Basics10-step Audit process
Establish Audit
Mandate
Establish Audit
Scope

Energy Audit BasicsPre-Audit Data & Information Required
� Departmental contact details� Historical energy and water bills, 12 months min.
� Historical production data, as above� Layout drawing, process flows, departments
� Operating schedule, shift patterns� Any previous studies undertaken
� Demand profiles, load inventories, etc.
� Risk assessment & PPE requirements

Energy Audit BasicsPlanning your site visits
� Develop an Audit Plan� Include audit mandate and scope� Departments and timelines for site-work� Audit team contact details� Reporting timeline
� Co-ordinate with O&M personnel� Inception meeting� Confirm Plan, availability, schedules, PPE/risk issues
� Decide what instrumentation is required

Instrumentation for Audits
� Electricity Measurement� Temperature Measurement
� Humidity Measurement� Air Flow Measurement
� Air Leakage Detection� Combustion Analysis
� Other� Camera, torch, tape-measure, toolkit, duct-tape, PPE

Instrumentation for AuditsElectricity Measurement

Instrumentation for AuditsTemperature Measurement

Instrumentation for AuditsHumidity Measurement

Instrumentation for AuditsAir-flow Measurement

Instrumentation for AuditsAir Leak Detection

Instrumentation for AuditsCombustion Analysis

Energy Assessment
� Utility Bills� Demand Analysis
� Electrical Load Inventory� EMOs

Energy AssessmentUtility Bills

Energy AssessmentUtility Bills (ITOU Ethekwini 2012-13)

Energy AssessmentUtility Bills
� 220% Increase in 48 months

Energy AssessmentUtility Bills
� Energy Charge: Is time dependant as well as seasonally differentiated
� Network Demand Charge: Based on the Actual Demand (kVA)� Network Access Charge: Based on the highest maximum demand
that the customer expects the municipality to be in a position to supply
� Service Charge: A fixed charge and is charged on a monthly basisper point of supply
� Voltage Surcharge: A percentage levied on the sum of all costs with the exception of the service charge

Energy AssessmentUtility Bills – Usage over Time

Energy AssessmentUtility Bills – Usage versus Cost
Utility Usage kWh Cost, R
Electricity 8 130 200 kWh 8 130 200 3 821 119
FFS Oil 1 093 984 litres 11 423 930 3 834 280
Coal 3 513 tonnes 25 864 230 2 654 417
Total 45 418 360 10 309 816

Energy AssessmentUtility Bills – Usage versus Production

Energy AssessmentUtility Bills – Benchmarking
� A methodology to improve energy performance� Comparison to some “Standard”
� Investigate differences between existing and “Standard” values
� Driving action to improve� Easy to comprehend
� GJ / hl� kWh / tonne� kWh / m2 (Floor area or fabric produced, for example)

Energy AssessmentUtility Bills – Benchmarking

Energy AssessmentUtility Bills
QUESTIONYou find you are able to replace a 50kW fan requirement with a 5kW equivalent by reducing process air flow requirements. What are the Rand savings, given the following data:
Annual running hours: 8760 hoursMotor efficiency (both fans) 90%MD Charge R 9.00 per kW per monthActive Energy Charge R 0.05 per kWh
SOLUTIONDemand Saving: (50kW-5kW) x (R 9/kW/month) x (12 months/year) / 90% = R 5 400Energy Saving: (50kW-5kW) x (R 0.05/kWh) x (8760 hours/year) / 90% = R 21 900
TOTAL SAVING: = R 27 300

Energy AssessmentDemand Analysis
� Obtaining the Profile� Refer to equipment list� Clip-on Ammeter readings (needs repetition)� Multi-channel logger� Periodic utility meter readings� Dedicated metering systems� BEMS

Energy AssessmentDemand Analysis
� Analysing the Profile� Required knowledge of the facility� Mark scheduled events on the profile (breaks, shifts)� Correlate those events with:
� Demand increase� Demand decrease� Peaks� PF
� Reconcile with utility bills� Focus on unknown patterns

Energy AssessmentDemand Analysis – Savings Examples
� Daily scheduling to reduce Peak Demand (MD)� High night load� High idling loads during breaks� Loads cycling on/off frequently during out-of-hours periods� Start-up and shut-down procedures� Reconcile profile against recorded MD to control infrequent loads� Power Factor issues

Energy AssessmentDemand Analysis

Energy AssessmentDemand Analysis

Energy AssessmentElectrical Load Inventory
� Objectives� Establish WHERE electricity is used� Establish HOW MUCH electricity is used� Establish HOW FAST it is being used� Allows reconciliation to usage data� Can be used to form a baseline� Identifies priority areas and areas of wastage

Energy AssessmentElectrical Load Inventory
Date-entry
item
Units Description Example
(Compressor)
Quantity Number The quantity of this item on site 1
Unit Load kW The load or one of this item 50
Total kW kW Quantity x Unit Load 50
Hours/Period Hours Estimated hours of use PER PERIOD 400
kWh/Period kWh Total kW x Hours/Period 20 000
On-peak Y/N Is this load “on” during the peak MD
period indicated in the profiles?
Y
Diversity 0-1 The fraction of the Unit Load that this
contributed to the peak demand
1
Peak kW kW Total kW x Diversity (if On- peak = Y) 50

Energy AssessmentSample Electrical Load Inventory
Load Qty Unit
kW
Total
kW
Div Peak
kW
Hours kWh
Lights: Fluorescent 4 0.17 0.68 1.00 0.66 300 198
Lights: Incandescent 24 0.10 2.40 0.90 2.16 100 240
Lights: Metal Halide 21 0.47 9.77 1.00 9.77 420 4 101
Compressor (60Hp) 1 50.00 50.00 1.00 50.00 400 20 000
Pump (20Hp) 1 16.00 16.00 0.75 12.00 400 6 400
Microwave 1 0.75 0.75 0.10 0.08 2 2
Coffee-machine 2 1.50 3.00 1.00 3.00 200 600
TOTAL - - 82.58 - 77.66 31 541

Energy AssessmentThermal Load Inventory Examples
Energy Flow Type Example Equipment / Function
Conduction Walls, Windows Building structure
Air flow – Sensible General Extraction Exhaust & make-up air systems,
combustion air intake
Air Flow – Latent Dryer Extraction Laundry exhaust, Stenter extract
Hot/Cold Fluid Warm water to drain DHW, process cooling water
Pipe heat loss Steam lines Any hot pipe, steam, DHW, condensate
Tank heat loss Hot process tanks Storage and holding tanks
Refrigeration
system outputs
Cold Storage Coolers, freezers, process cooling, AC
Steam leakage &
vents
Steam vents Boiler plant, steam distribution, steam
appliance

Energy AssessmentEnergy Management Opportunities (EMOs)
� Motors, Pumps, Fans� Compressed Air
� Refrigeration� Steam Systems
� Combustion Systems (Boilers)

Energy AssessmentWhy a Systems Approach?
M
TX
Distribution
Motor
Bearing
Pump
ThrottlePipe network

Energy AssessmentWhy a Systems Approach?
Component Losses Typical %
Efficiency
kWh cost at
output
Utility Meter Negligible 100 0.60
Distribution, TX Resistance and TX losses 96 0.63
Motor Resistance, Friction, Magnetic 85 0.74
Bearing Friction 98 0.75
Pump Fluid and mechanical friction 60 1.25
Valve Throttling losses 70 1.79
Piping Network Fluid friction 60 2.98
Overall efficiency and cost ratio 20 5:1

Energy AssessmentWhy a Systems Approach?
� Start at the end-user FIRST� Step 1: Match usage to requirements
� What is being done and why?� What energy is/should be consumed?
� Step 2: Maximise system efficiencies� Is the deign principle correct?� Can it be done more efficiently?
� Step 3: Optimise energy supply� Heat recovery, Cogen, Renewables, Fuel switch…

Energy AssessmentEMOs – Motors, Pumps, Fans
� HEMs� Suitable for highly loaded motors� Justification only on new or replacement motors� On 8,000 hours per annum operation, marginal
payback just over a year

Energy AssessmentEMOs – Compressed Air
� Motor Controllers (fixed-speed)� Constant speed & light load� Reduce the fall in efficiency at loads below 50%
(where Iron losses predominate)� Regulate the voltage at the motor terminals to provide
just sufficient magnetising force� Iron losses are reduced� Efficiency and power factor are improved� Absorb power due to voltage drop across thyristors� Applicable to conveyors, escalators, lightly-loaded
mills, etc.

Energy AssessmentEMOs – Motors, Pumps, Fans
� Frequency Inverter Controls (VSD)� Variable speed opportunities� Wherever the motor output will vary� Especially pumps and fans� Savings greatest when system friction losses
predominate� Payback lower (but still good)
� if static delivery head is main component� or if pressure is not allowed to float
� Case Study:

Energy AssessmentVSD Case Study

Energy AssessmentVSD Case Study

Energy AssessmentEMOs – Compressed Air
� End Users� Air-using plant must be isolated outside normal working hours
� Use the lowest possible operating pressure
� 10% reduction in pressure = 5% saving
� If a number of large users are defined as using low pressure air, install two separate systems
� Substitute end user equipment for alternative not dependant on air
� Air agitation, blowing, cleaning!
� Use efficient drying nozzles

Energy AssessmentEMOs – Compressed Air
� Distribution� Minimise pressure-drop across the system� Eliminate condensate (rust)
� Leakage� Typically 30 - 35% of full load usage (up to 80%)� Regular maintenance required to identify and repair
leaks� Identify and tag leaks at the weekend when shops are
quiet� Compressor no-load testing

Energy AssessmentEMOs – Compressed Air

Energy AssessmentEMOs – Compressed Air
� Compressor Control� Do not run screw compressors at low-loads in
modulating control
� When the offload time permits, stop the motor as soon as possible, using run-on timing if poss.
� Use set-point pressure control rather than cascade
� Minimise pressure settings
� Consider a variable speed drive for very variable loads. Switch off, or consider a smaller machine for weekends

Energy AssessmentEMOs – Refrigeration
� Cooling Loads� Understand the cooling loads� Ask the fundamental questions:
� Can product be at 5C instead of 4C ?� Can we re-schedule certain cooling loads ? � Is the cooling medium as warm as possible ?
� A 10C increase in condensing temp. will increase costs by 2- 4%
� A 10C reduction in evaporating temp. will increase costs by 2-4%

Energy AssessmentEMOs – Refrigeration
� Free Cooling� Product free cooling
� Brewery wort cooler (paraflow)
� Dairy pasteuriser
� Ambient free cooling� Product ambient cooling
� Water recovery systems (can pasteuriser & homogeniser)
� Barriers to free cooling� Seasonality
� Contamination
� Time Matching / Scheduling

Energy AssessmentAmbient Free Cooling: Soft Drinks Pasteuriser
Steam
Chilled Water(high summer only)
Product 15OC
Product Out 25OC (max)

Energy AssessmentEMOs – Steam Systems
� Insulation� 1 un-lagged valve ~ 1m of bare pipe� 1 un-lagged flange ~ 0.5m of bare pipe

Energy AssessmentEMOs – Steam Systems
� Reduce steam usage in process� minimise temperature � minimise quantity
� Improve routines of equipment operators� start/warm up equipment as late as possible � fully load and run for minimum time to carry out production� shut down when no longer required
� Reduce steam losses� close steam trap bypasses� isolate steam lines when no required� repair steam leaks� repair faulty steam traps

Energy AssessmentEMOs – Condensate Systems
-
5
10
15
20
25
10 30 50 70 90 110 130
Condensate Return Temperature Deg.C
% Boiler Fuel Saved
100%
75%
50%
25%

Energy AssessmentEMOs – Combustion Systems
Fire tube
Water level
Third pass
Second pass
Burner
Flue
Steam out
3-pass ‘Wetback’ Package Boiler

Energy AssessmentEMOs – Combustion Systems
boundary
b
Steam
Feedwater
SystemFlue gas
QC
Air
Fuel
Blowdown

Energy AssessmentEMOs – Combustion Systems
� Calculation of Efficiency• Analytical (Direct) method
• Approximate (Indirect) method• Gas analyser (O2 / CO2 and CO)• Thermocouple• Charts or Tables• BS 845

Energy AssessmentEMOs – Combustion Systems
Excess AirNatural Gas : 10-15%Heavy Fuel Oil : 20-25%Coal: 40-55%
Carbon Monoxide<250ppm

Energy AssessmentEMOs – Combustion Systems
• Flue Gas Losses• Decrease excess air
• Reduction of XS air by 15% = 1% efficiency improvement
• Clean boiler tubes• Reduce stack temperature by 20C = 1% efficiency improvement
• Incomplete Combustion• Increase excess air• Improve fuel combustion conditions• Service burner

Assessing the Business Case
� Objectives� To “sell” projects to higher management� Ensure optimum benefits from investments� Minimise risk� Basis for future performance appraisals� Build credibility

Assessing the Business CaseBenefits and Costs
Benefits
� Direct energy savings� Indirect energy savings� Maintenance savings� Reduced environmental impact� Comfort improvements� Productivity increases� Health benefits
Costs
� Direct implementation cost� Direct energy costs� Indirect energy costs� Maintenance costs

Assessing the Business CaseInvestment Criteria
� NPV� IRR
� Simple PaybackSPP (years) = Capital Cost / Annual Savings
� ROI / ROCEROI (%) = Total (project life) Savings – Project Cost X 100
Project Cost project life

Assessing the Business CaseInvestment Criteria – Cash Flow Table
Cash flow table for purchase of new boiler
Capital R100 000 90% on delivery and 10% retainer due on year 1
Savings R48 000 R24K in first year, full amount in all remaining years
(Values in R’000s)
Year 0 1 2 3 4 5
Costs (90) (10) 0 0 0 0
Savings 0 24 48 48 48 48
Net Cash (90) 14 48 48 48 48
Net Value (90) (76) (28) 20 68 116

Assessing the Business CaseInvestment Criteria – Discount Factors

Assessing the Business CaseNPV – Calculation
Year 0 1 2 3 4 5
Net cash flow R000s (90) 14 48 48 48 48
Discounted cash flow at 10% discount rate can be found as follows:
Year 0 1.0 x (90) = (90)
Year 1 0.909 x 14 = 12.73
Year 2 0.826 x 48 = 39.65
Year 3 0.751 x 48 = 36.05
Year 4 0.683 x 48 = 32.78
Year 5 0.620 x 48 = 29.76
NPV = the sum of these values = 60.97
Compare with simple Net Value = 116

Assessing the Business CaseIRR – Calculation
� The IRR is the discount factor at which the NPV of the project equals Zero
� For the example project, the IRR = 30.4%
Discount, % NPV
10 60.97
20 25.21
25 11.88
30 0.75
31 -1.12
35 -8.67

Reporting GuidelinesTips
� Know your reader� Use simple, clear language
� Avoid unnecessary jargon� Ensure grammatical correctness
� Present information graphically� Make recommendations clear
� Explain any assumptions� Be accurate & consistent

Reporting GuidelinesStructure Guidelines
Executive Summary
� Summarise the key findings� Key charts� Recommended EMOs� Cost, savings and financial
case� Any special information
relating to implementation
Technical Sections
� Detailed audit findings� Mandate, scope and
methodology� Facility description� Process overview� Assumptions� Calculations� Audit recommendations in
detail� Appendices

Workshop Review
1. Energy Audit Basics2. Instrumentation for Audits3. Energy Assessment
� Utility Bills� Demand Analysis� Load Inventory� EMOs
4. Assessing the Business Case5. Reporting Guidelines

Further Sources of Information
http://www.carbontrust.com/resourceshttp://www.spiraxsarco.com/za/resources/calculators.asphttp://www.iea.org/textbase/pm/?mode=pmhttp://www.sugartech.co.za/psychro/index.phphttp://www.allchemi.com/eng/refregerants/appendix6.html
For information on CEM, CEA, CMVP and other AEE accredited courses:http://www.saee.org.za/training_certified.aspx