David M. Auslander - P C Tex
39
L A T E X Graphics and Tables David M. Auslander Mechanical Engineeering University of California at Berkeley September 15, 2007
Transcript of David M. Auslander - P C Tex
LATEX Graphics and Tables
David M. Auslander
Mechanical EngineeeringUniversity of California at Berkeley
September 15, 2007
GraphicsGraphics on ComputersGraphics and LATEX
Floating Placement
Tables

NOTE: This slide set has been done using LATEX (documentclass:beamer). Where appropriate, the LATEX code for each slide willfollow the slide.This is accomplished through the use of the “verbatim”environment,
\begin{verbatim}% stuff printed literally ...\ end{verbatim} % The space after \ is so% the end-verbatim command is not executed!
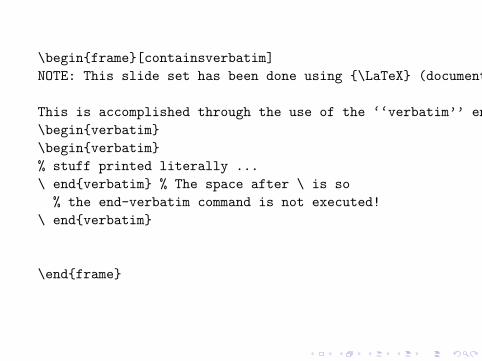
\begin{frame}[containsverbatim]NOTE: This slide set has been done using {\LaTeX} (documentclass: beamer). Where appropriate, the {\LaTeX} code for each slide will follow the slide.
This is accomplished through the use of the ‘‘verbatim’’ environment,\begin{verbatim}\begin{verbatim}% stuff printed literally ...\ end{verbatim} % The space after \ is so% the end-verbatim command is not executed!
\ end{verbatim}
\end{frame}

Graphical Representations
I Bit Mapped
I Vector
I Hybrid (mix of bit mapped and vector)

LATEX Code
\begin{frame}{Graphical Representations}\begin{itemize}\item Bit Mapped\item Vector\item Hybrid (mix of bit mapped and vector)
\end{itemize}\end{frame}

Bit Mapped Graphics
Bit mapped graphicsrepresent each pixel ofthe image explicitly.
The pelican looks OK,but enlarging its headshows the pixelation.Common file types forbit-mapped files: jpg,bmp, tif, png

LATEX Code
\begin{columns}\column{1.5in}Bit mapped graphics represent each pixel of the image explicitly.\vspace{0.2in}The pelican looks OK, but enlarging its head shows the pixelation.
Common file types for bit-mapped files: jpg, bmp, tif, png\column{1.5in}\includegraphics[height=2.5in]{Pelican.pdf}\column{1.5in}\includegraphics[height=2.5in]{PelicanCropped.pdf}\end{columns}

Vector (Object) Graphics
Vector graphics give instructions on how to draw the figure soimages match the resolution of the display (or printer) regardless ofcropping.
0 0.5
1 1.5
2 2.5
3 3.5
4 4.5
5
0 0.1 0.2 0.3 0.4 0.5 0.6 0.7
Po
sitio
n(r
ev)
Time (sec)
Position0
Setpoint0
-0.05 0
0.05 0.1
0.15 0.2
0.25
0 0.1 0.2 0.3 0.4 0.5 0.6 0.7
Act
ua
tion
Time (sec)
Actuation0
-0.01 0
0.01 0.02 0.03 0.04 0.05 0.06 0.07
0 0.1 0.2 0.3 0.4 0.5 0.6 0.7
Err
or
(re
v)
Time (sec)
Error0
-4-3.5
-3-2.5
-2-1.5
-1-0.5
0
0 0.1 0.2 0.3 0.4 0.5 0.6 0.7
Po
sitio
n(r
ev)
Time (sec)
Position1
Setpoint1
-0.2
-0.15
-0.1
-0.05
0
0.05
0 0.1 0.2 0.3 0.4 0.5 0.6 0.7
Act
ua
tion
Time (sec)
Actuation1
-0.06-0.05-0.04-0.03-0.02-0.01
0 0.01
0 0.1 0.2 0.3 0.4 0.5 0.6 0.7
Err
or
(re
v)
Time (sec)
Error1
0 0.5
1 1.5
2 2.5
3 3.5
4 4.5
5
0 0.1 0.2 0.3 0.4 0.5 0.6 0.7
Po
sitio
n(r
ev)
Time (sec)
Position0
Setpoint0
-0.05 0
0.05 0.1
0.15 0.2
0.25
0 0.1 0.2 0.3 0.4 0.5 0.6 0.7
Actu
atio
n
Time (sec)
Actuation0
-0.01 0
0.01 0.02 0.03 0.04 0.05 0.06 0.07
0 0.1 0.2 0.3 0.4 0.5 0.6 0.7
Err
or
(re
v)
Time (sec)
Error0
-4-3.5
-3-2.5
-2-1.5
-1-0.5
0
0 0.1 0.2 0.3 0.4 0.5 0.6 0.7
Po
sitio
n(r
ev)
Time (sec)
Position1
Setpoint1
-0.2
-0.15
-0.1
-0.05
0
0.05
0 0.1 0.2 0.3 0.4 0.5 0.6 0.7
Actu
atio
n
Time (sec)
Actuation1
-0.06-0.05-0.04-0.03-0.02-0.01
0 0.01
0 0.1 0.2 0.3 0.4 0.5 0.6 0.7
Err
or
(re
v)
Time (sec)
Error1
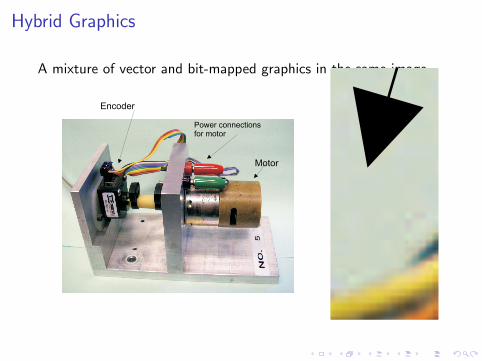
Hybrid Graphics
A mixture of vector and bit-mapped graphics in the same image.
Encoder
Motor
Power connections
for motor
Encoder
Motor
Power connections
for motor
Placing Graphics in a Document
I ‘includegraphics’ is the basic command for getting graphicsinto LATEX documents
I The package ‘graphicx’ must be used to support it(‘usepackage’)
I Will place the figure at the indicated point in the document
I Has a variety of options for sizing and placement of graphics
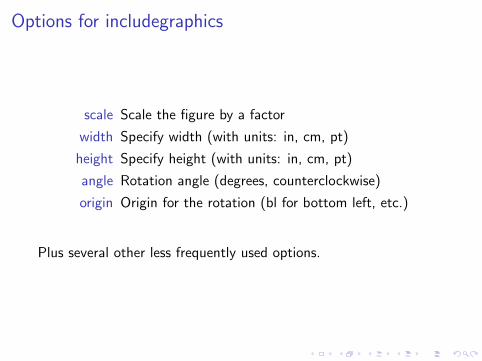
Options for includegraphics
scale Scale the figure by a factor
width Specify width (with units: in, cm, pt)
height Specify height (with units: in, cm, pt)
angle Rotation angle (degrees, counterclockwise)
origin Origin for the rotation (bl for bottom left, etc.)
Plus several other less frequently used options.

LATEX Code
\begin{description}\item[scale] Scale the figure by a factor\item[width] Specify width (with units: in, cm, pt)\item[height] Specify height (with units: in, cm, pt)\item[angle] Rotation angle (degrees, counterclockwise)\item[origin] Origin for the rotation (bl for bottom left, etc.)
\end{description}\vspace{0.25in}Plus several other less frequently used options.
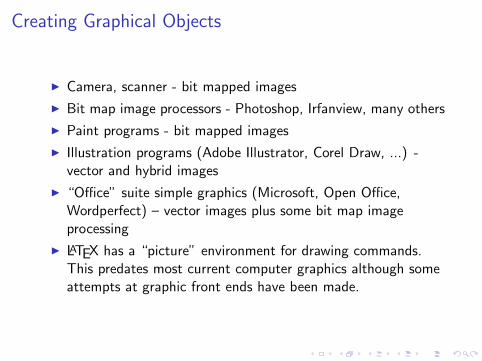
Creating Graphical Objects
I Camera, scanner - bit mapped images
I Bit map image processors - Photoshop, Irfanview, many others
I Paint programs - bit mapped images
I Illustration programs (Adobe Illustrator, Corel Draw, ...) -vector and hybrid images
I “Office” suite simple graphics (Microsoft, Open Office,Wordperfect) – vector images plus some bit map imageprocessing
I LATEX has a “picture” environment for drawing commands.This predates most current computer graphics although someattempts at graphic front ends have been made.

LATEX and Postscript
I LATEX and Postscript grew up together. LATEX depends verymuch on Postscript
I Three abstraction levels:
Postscript Description language that is very close to theactual device that puts ink to paper (or pixels toscreen)
Tex Intermediate level to describe basic typographyLATEX High level, describes document structure
I LATEX produces Postscript output for printing and uses it forgraphics input

LATEX Code
\frametitle{{\LaTeX} and Postscript}\begin{itemize}\item {\LaTeX} and Postscript grew up together. {\LaTeX} depends very much on Postscript\item Three abstraction levels:\begin{description}\item[Postscript]Description language that is very close to the actual device that puts ink to paper (or pixels to screen)\item[Tex]Intermediate level to describe basic typography\item[{\LaTeX}]High level, describes document structure
\end{description}\item {\LaTeX} produces Postscript output for printing and uses it for graphics input
\end{itemize}

EPS versus PDF in LATEX
I EPS — encapsulated postscript. Pure PS but designed forsingle-page items with bounding information
I Early LATEX required EPS for all graphics; produced a deviceindependent output (DVI) and then postscript
I PDF — portable document format, also from Adobe (inventorof Postscript)
I It is possible to produce PDF output from EPS-based LATEX
I But, hyper-reference information as in the table-of-contents islost
I PDF-LATEX was developed to preserve structuralcross-reference information
I PDF-LATEX requires graphics files in PDF (or JPEG or PNGfor bit-mapped files but I don’t know how portable LATEX fileswith JPEG/PNG are)

Creating EPS and/or PDF Graphics Files: “Laundering”Graphics Files
I Graphics rarely starts as either EPS or PDF
I Other programs are often needed to get them into EPS orPDF form
I For EPS, in Windows I use Corel Draw (not free) or OpenOffice Draw (free) for converting as well as creating newgraphics — many others would work also
I Clipboard transfer can get almost any graphic into one ofthese programs
I For PDF-Windows, more of a problem! Print-to-PSD can beused from almost any application (natively, with Acrobat (notfree) or other programs (some free))
I PDF creation is usually aimed at full page. White space mustbe removed. Adobe Acrobat can do that. OO-Draw can alsodo it, but awkwardly. I don’t know of others.

Exercise
1. Start with a file of random text (about 10 pages worth). Usingdocument class ‘report’ divide it up into chapters and sections.
2. Use ‘includegraphics’ to add a graphics file (remember to\usepackage{graphicx})
3. Use options to change its size (including very big and verysmall)
4. Move it around, top of page, middle, bottom
5. Add several more graphics. Put them close together, far apart.

LATEX Code
\begin{enumerate}\item Start with a file of random text (about 10 pages worth). Using document class ‘report’ divide it up into chapters and sections.\item Use ‘includegraphics’ to add a graphics file (remember to
\verb!\usepackage{graphicx}!)\item Use options to change its size (including very big and very small)\item Move it around, top of page, middle, bottom\item Add several more graphics. Put them close together, far apart.
\end{enumerate}

Floating Objects in a Document
I As last exercise shows, it is very difficult to do manual figureplacement for any significantly sized document (over 2 pages!)
I LATEX handles this with “floats”
I Floats are typographical objects that fit on a single page anddo not have critical placement requirements
I Most common: figures, tables

Where Does LATEX Put Floating Objects?
I Be prepared to give up control of where your figures will go!
I LATEX will put them “where it thinks best”
I You have some influence, but not control
I Given its druthers, LATEX likes to put floats at the top andbottom of pages
I If there are a lot of them, LATEX will fill a page with floats
I The float can be placed ahead of where it is located in thetext — probably the most annoying placement issue
I This works very well for reports, articles, papers, books, butnot for brochures, flyers, newsletters, etc., where floatplacement is an important design decision

Parts of a FloatA typical float:
\begin{figure}[h]\centering\includegraphics[height=3.0in]{CVI-NewProject.pdf}\caption{\label{fig:newproject}‘New Project’ Initial Dialog}\end{figure}
I Float options, ‘h’ in this case for ‘here’, give placementpreference
I Centering causes the float object to be horizontally centeredI Figure floats most commonly are graphics files but they don’t
have to be. Anything can be put inside the figureenvironment.
I ‘Caption’ places the caption and also does automatic figurenumbering (will be above or below the graphic depending onwhere you put it)
I ‘Label’ provides for a cross-reference

Float Placement Options
t Put the figure at the top of a page
b ... bottom
p on a page of all floats
h here
! add this to try to force a preference
default Most say ‘tbp’ but some say the default is ‘htbp’ (??)
I Figures will be kept in order (can cause problems if one isespecially large)
I Figure numbers will be assigned automatically
I Refer to a figure with the command:\ref{fig:newproject} where the argument is a label

Types of Floating Objects
I Most LATEX documents get by with just Figures and Tables
I Custom floats can be defined for other types of floatingobjects
I Use the package “float”
I Set up the names, etc. ...
\floatstyle{ruled} % Caption style\newfloat{program}{thp}{lop}% float name; placement options; file extension
\floatname{program}{Program}% name to use with numbering (Program 1)

Exercise
Redo the previous exercise using floats for figure placement.

Tabular Information
I Needed for a wide variety of circumstances
I LATEX can produce excellent tables, but uses quite a bit ofsyntax to do it!
I Any valid LATEX commands can be used for cell contents(although plain text is most common)
I The standard table environment (‘tabular’) can only handletables that fit on a single page
I Tables can be put inside floats or not, as needed
I There are packages to handle long tables with similar syntax(but they can’t be floated, at least, not easily)

Defining Columns
I Columns are defined as arguments to the tabular environment
I For simple tables, column widths are set automatically basedon the widest item in that column
I For these types of tables the justification for the column andwhether the columns should be separated by lines is all thatneeds to be specified:
\begin{tabular}{| c | l | r |}
I This specifies three columns, separated by lines (the barcharacter,|; use two bars, ||, for double lines), center, leftand right justified, respectively

Adding Content
I Items in a row are separated with ampersands; rows are endedwith double backslash
I Here’s a simple table based on the column specification fromthe previous slide:
City Population, 1790 Population, 1990New York 33,131 7,322,564Baltimore 18,320 736,014
Richmond (VA) 3,761 203,056
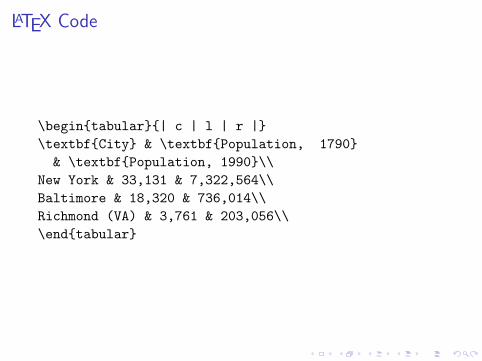
LATEX Code
\begin{tabular}{| c | l | r |}\textbf{City} & \textbf{Population, 1790}& \textbf{Population, 1990}\\
New York & 33,131 & 7,322,564\\Baltimore & 18,320 & 736,014\\Richmond (VA) & 3,761 & 203,056\\\end{tabular}

Adding Horizontal Lines
This needs some added horizontal lines ...City Population, 1790 Population, 1990
New York 33,131 7,322,564Baltimore 18,320 736,014
Richmond (VA) 3,761 203,056

LATEX Code
This needs some added horizontal lines ...\vspace{0.5in}\begin{tabular}{| c | l | r |}\hline\textbf{City} & \textbf{Population, 1790}& \textbf{Population, 1990}\\
\hline \hlineNew York & 33,131 & 7,322,564\\Baltimore & 18,320 & 736,014\\Richmond (VA) & 3,761 & 203,056\\\hline\end{tabular}

Text Wrapping in Tables
I LATEX will not wrap text in tables unless the width of thecolumn is explicitly specified — the table will just go off theright margin!
I Instead of c, l or r, use p{width}, m{width}, or b{width} forvertical alignment as:
p Vertical alignment at the top
m Middle
b Bottom

Table With Text Wrap
Here’s what that table looks like with text wrap in columns twoand three:
City Population,1790
Population,1990
New York 33,131 7,322,564Baltimore 18,320 736,014
Richmond (VA) 3,761 203,056

LATEX Code
Here’s what that table looks like with text wrapin columns two and three:\\[0.5in] % the \\ adds a line break% to avoid text wrapping around the side of the table\begin{tabular}{| c | p{0.8in} | p{0.8in} |}\hline\textbf{City} & \textbf{Population, 1790}& \textbf{Population, 1990}\\
\hline \hlineNew York & 33,131 & 7,322,564\\Baltimore & 18,320 & 736,014\\Richmond (VA) & 3,761 & 203,056\\\hline\end{tabular}

Floating Tables
I Tables are a predefined floating environment
I Use ‘table’ instead of ‘figure’
I Everything else is the same including captions, tablenumbering, cross-referencing

Tables, More
I There are several more things that can be done with tables:
I Multi-column and multi-row spanning
I Special formatting between rows (favorite example – lining updecimal points)
I Table width control
I Long tables (more than a page)

Exercise 1
Add the following table to the document you’ve been workingwith. Use it plain and within a float environment.
Item Credit Number Total CreditAssigned reading (weekly) 1 14 14Small reports 2 7 14Regular reports 10 5 50Project report 1 20 20Exam 10 2 20
Total 118Grading Matrix

Exercise 2
Add a column at the right for comments and provide for text wrapin that column. Make up some comments to put there and thencontinue as in Exercise #1.