David Jones financial analysis
19
David Jones Financial Statement Analysis 2008-2010 FNCE90055 Assignment 1 Tutor: Warren Mckeown Prepared by: Yu Shen(301448) Johnson Kee (289377) Huu-Phuc Truong (384083) Natissja Alias (202664)
-
Upload
natissjaalias -
Category
Documents
-
view
174 -
download
4
description
Assignment for Financial Decision Making subject
Transcript of David Jones financial analysis

David Jones Financial Statement Analysis 2008-2010 FNCE90055 Assignment 1 Tutor: Warren Mckeown
Prepared by:
Yu Shen(301448)
Johnson Kee (289377)
Huu-Phuc Truong (384083)
Natissja Alias (202664)

David Jones Financial Report Analysis• 2011 1
1. Cash Flow Statement Analysis Mature age or growth age
Figure 1. Cash flow trend 2008-2010
In financial year (FY) 2008-2010, positive and relatively stable cash flows from
operating activities (OCF) suggest David Jones (DJ) is in a maturity stage as it shows a
positive and stable OCF. OCF remained approximately the same in FY08-10 except a
slight decrease in FY09, which was presumably caused by the global financial crisis
(GFC) and store renovations.
Outgoing cash flow from investing activities (ICF) decreased enormously in
FY07-08 with a decrease of $464,018,000 causing ICF to rise sharply. Nevertheless,
there is a relatively slight increase in FY09-10, but it is still significantly less than in
FY07-08. Also, ICF is predominantly negative. Together, ICF may suggest either late
growth or early maturity.
-‐600000
-‐500000
-‐400000
-‐300000
-‐200000
-‐100000
0
100000
200000
300000
400000
2006 2007 2008 2009 2010
Net cash )low ($000)
Year
CASH FLOWS FROM OPERATING ACTIVITES CASH FLOWS FROM INVESTING ACTIVITIES
CASH FLOWS FROM FINANCING ACTIVITIES

David Jones Financial Report Analysis• 2011 2
Negative cash flow from financing activities (FCF) also suggests the maturity
phase. Mainly because FY05-10 FCF is predominantly negative except for FY07.
Together, DJ’s cash flow from operating, investing and financing activities
suggest that it is in late growth or early maturity. Thus DJ could be considered as either
a successful mature firm or a firm that is still growing modestly.

David Jones Financial Report Analysis• 2011 3
2. ROA Analysis Table 1. ROA calculations for FY09 and FY101
!"# = !"#$%&'() !"#$%& × !"#$%&'#
!"# = !"#$!"#$% ×
!"#$%!"#$%&# !"!#$ !""#$"
2009 2010
EBIT 225651000 249177000
Sales 1985490000 2053087000
Average total assets
1527102000+ 11246740002
= 1325888000
1194921000 + 11246740002
= 1159797500
Operating margin
2256510001985490000
= 0.1137
2491770002053087000
= 0.1214
Total asset turnover
19854900001325888000
= 1.4975
20530870001159797500
= 1.7702
ROA 0.1702 !" 17.02% 0.2148 !" 21.48%
Percentage change in ROA
!"#$"%&'(" !ℎ!"#$ !" !"# = !"#!"#"! !"#!""#!"#!""#
!"#$"%&'(" !ℎ!"#$ !" !"# = !.!"#$! !.!"#$!.!"#$
!"#$"%&'(" !ℎ!"#$ !! !"# = 0.2620 !" 26.2%
1 Figures used are the adjusted figures from the latest annual report available.

David Jones Financial Report Analysis• 2011 4
Return on assets (ROA) can be disaggregated into operating margin and total
asset turnover. Operating margin reflects the profitability of every dollar of sales made
while turnover reflects the efficiency with which the firm utilizes its assets in the
revenue generating process. Together, ROA reflects the profitability of the firm and its
operating efficiency. DJ’s increase in ROA of 17.02% in FY09 to 21.48% in FY10
suggests improved operating efficiency. By disaggregating ROA, it becomes apparent
that its increase is due to improved turnover, which increased by 18.21%2.
2 Turnover increase is is approximately three times the increase in operating margin of 6.87%

David Jones Financial Report Analysis• 2011 5
3. ROE Analysis Table 2. ROE calculations for FY09 and FY103
!"# = !"#$
!"#$%&# !"#$%!!!"#$%&
2009 2010
NPAT 156522000 170766000
Average owners’ equity
6172479000 + 6848420002
= 651044500
684842000 + 7442380002
= 714540000
ROE 0.2404 !" 24.04% 0.2390 !" 23.90%
Percentage change in ROE
!"#$"%&'(" !ℎ!"#$ !" !"# = !"#!"#"! !"#!""#!"#!""#
!"#$"%&'(" !ℎ!"#$ !" !"# = !.!"#$!!.!"#"!.!"#"
!"#$"%&'(" !ℎ!"#$ !" !"# = −0.0058 !" − 0.58%
Return on equity (ROE) reflects the profitability of utilizing shareholders’
equity. ROE is expressed as a percentage of after-tax net profits on average
shareholders’ equity. DJ suffered a decrease of 0.58% in ROE from FY09 to FY10. This
is a relatively small amount – most likely attributable to the 9.75% increase in average
shareholders’ equity relative to the 9.1% increase in NPAT. This suggests that the more
proportionate increase in shareholders equity compared to NPAT resulted in a decrease
3 Figures used are the adjusted figures from the latest annual report available.

David Jones Financial Report Analysis• 2011 6
in ROE. The decrease in ROE can also be explained using leverage ratios4. Capital
structure leverage ratio dropped from 2.0366 times in FY09 to 1.6231 times in FY10.
This is due to the increase in shareholder equity (9.75%) relative to the decrease in total
assets (-12.53%).
4 ROE can be disaggregated into ROA and leverage

David Jones Financial Report Analysis• 2011 7
4. Return on Accounts Receivable and Payable Analysis Table 3. Accounts receivable turnover and days in accounts receivable outstanding calculations for FY09 and FY10
!""#$%&' !"#"$%&'(" !"#$%&'# = !"!"#
!"#$%&# !""#$%&' !"#"$%&'("
!"#$ !""#$%&' !"#"$%&'(" !"#$#%&'(&) = 365
!""#$%&' !"#"$%&'(" !"#$%&'#
2009 2010
Sales 1985490000 2053087000
Average accounts receivable
22309000+ 4149800002
= 218644500
22750000+ 223090002
= 22529500
Accounts receivable turnover
9.0809 91.1288
Days in accounts receivable
outstanding 40.19 4.01
!"#$"%&'(" !ℎ!"#$ !" !""#$%&' !"#"$%&'(") !!"#$%&" = !"#!"#"!!"#!""# !"#!""#
!"#$"%&'(" !ℎ!"#$ !" !""#$%&' !"#"$%&'(") !"#$%&'# = !".!"##!!.!"!#!.!"!#
!"#$"%&'(" !ℎ!"#$ !" !""#$%&' !"#"$%&'!"# !"#$%&'# = 9.035 !" 903.5%

David Jones Financial Report Analysis• 2011 8
Management of accounts receivables has shown an extraordinary performance
on increasing accounts receivable turnover and days in accounts receivable outstanding.
Accounts receivable turnover increased 900% from FY09-10. FY10 was significantly
higher, because from FY08-09, accounts receivables decreased tremendously.
Consequently, average accounts receivable for FY09 was much higher than for FY10.
From FY09 onwards, DJ has improved its management of collecting accounts
receivables as reflected in reduced days in accounts receivables outstanding. While DJ
took about 40 days to collect receivables in FY09, it took only about 4 days in FY10,
indicating a tenfold improvement. The large decrease in accounts receivable and thus,
an increase in the turnover, was primarily due to the introduction of the DJ/American
Express (Amex) storecard. By doing so DJ was able entrust $374.3 million worth of
primarily debt-funded receivables to Amex.

David Jones Financial Report Analysis• 2011 9
Table 4. Accounts payable turnover and days in accounts payable outstanding calculations for FY09 and FY10
!""#$%&' !"#"$%& !"#$%&'# = !"#$ℎ!"#"
!"#$%&# !""#$%&' !"#"$%&
!"#$ℎ!"#" = !"#$"% !"#$"%&'( − !"#$%%$%# !"#$"%&'( + !"#$
!"#$ !""#$%&' !"#"$%& !"#$#%&'(&) = 365
!""#$%&' !"#"$%& !"#$%&'#
2009 2010
Purchases
224843000
- 257288000 + 1199344000
1186899000
282346000
- 244843000 + 1237358000
1274861000
Average accounts payable
244102000+ 2746080002
= 259355000
244529000+ 2441020002
= 244315500
Accounts payable turnover 4.5763 5.2181
Days in accounts payable
outstanding 79.76 69.95
!"#$"%&'(" !ℎ!"#$ !" !""#$%&' !"#"$%& !"#$%&'# = !"#!"#!!!"#!""# !"#!""#
!"#$"%&'(" !ℎ!"#$ !" !""#$%&' !"#"$%& !"#$%&'# = !.!"#"!!.!"#$ !.!"#$
!"#$"%&'(" !ℎ!"#$ !" !""#$%&' !"#"$%& !"#$%&'# = 0.1402 !" 14.02%

David Jones Financial Report Analysis• 2011 10
Turnover for accounts payable has increased 14.02% in FY09-10, which
indicated DJ has paid outstanding invoices quicker. This might benefit DJ due to early
payment discounts. However, this does not help to realize a stronger net OCF because
more cash is used to pay suppliers.

David Jones Financial Report Analysis• 2011 11
5. Liquidity and Solvency Analysis Table 5. Working capital, current ratio, and quick ratio calculations for FY10
!"#$%&' !"#$%"& = !"##$%& !""#$" − !"##$%& !"#$"!"%"&'
!"#!"#$ !"#$% = !"##$%& !""#$"
!"##$%& !"#$"!"%"&'
!"#$% !"#$% = !"#ℎ !"#$%&!"' !"#ℎ !"#$%&'!()* + !""#$%&' !"#"$%&'("
!"##$%& !"#$"!"%"&'
Current assets 328084000
Current liabilities 313300000
Cash (incl. cash equivalents) 17594000
Accounts receivable 22750000
Working capital 14784000
Current ratio
328084000313300000
= 1.0472
Quick ratio
40344000313300000
= 0.1288
The quick ratio of 0.12877 in FY10 is considerably low due to DJ’s low net cash
flows and low accounts receivables. DJ’s low cash flows were due payment of
dividends and investments into PPE in cash without any borrowings. The low accounts
receivables were a result of the improved management of collecting receivables and

David Jones Financial Report Analysis• 2011 12
transferal of largely debt-funded receivable to Amex. While this ratio may seem
worrying in terms of liquidity, DJ’s size and historical performance suggests that this
would pose little threat to the company. However, it is still something that the firm
needs to monitor.
DJ’s current ratio of above 1 is indicative of adequate liquidity as current
liabilities are covered by current assets 1.04 times over. Also, the current ratio is below
1.5, which signals that DJ has utilized assets productively. However, it is important to
note some issues in interpreting current ratio because a decrease of both current assets
and liabilities when current ratio exceeds 1 will lead to a higher ratio, which could be
misleading. Also, inventories, a major part of the current assets, are evaluated at cost
price. However, inventory is often sold at a profit. Thus, current assets and current ratio
would most likely be understated. Hence, when measuring liquidity, working capital
provides useful information, as the issues mentioned above do not affect it. DJ’s
working capital of $14,784,000 indicates sufficient liquidity to meet its short-term
obligations, if necessary. Together, working capital and current ratio suggest adequate
liquidity.
David Jones Financial Report Analysis• 2011 13
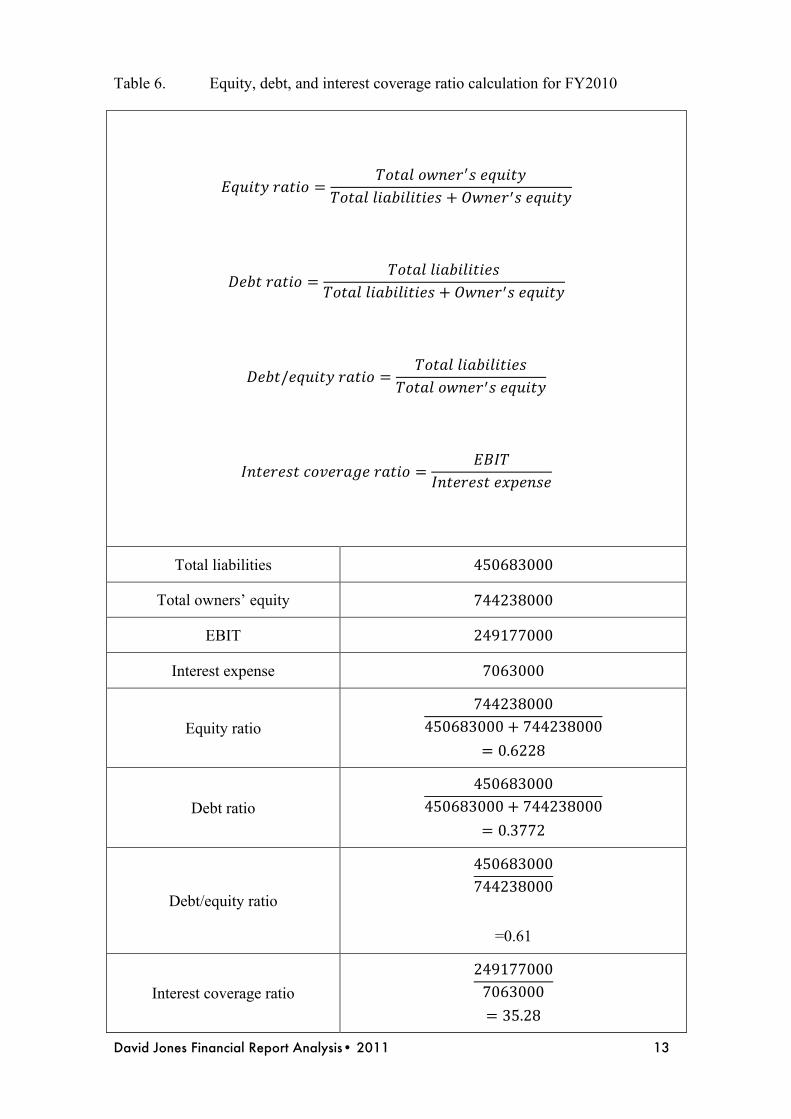
Table 6. Equity, debt, and interest coverage ratio calculation for FY2010
!"#$%& !"#$% =!"#$% !"#$!!! !"#$%&
!"#$% !"#$"!"%"&' + !"#$!!! !"#$%&
!"#$ !"#$% =!"#$% !"#$"!"%"&'
!"#$% !"#$"!"%"&' + !"#$!!! !"#$%&
!"!"/!"#$%& !"#$% =!"#$% !"#$"!"%"&'
!"#$% !"#$!!! !"#$%&
!"#$%$&# !"#$%&'$ !"#$% =!"#$
!"#$%$&# !"#!$%!
Total liabilities 450683000
Total owners’ equity 744238000
EBIT 249177000
Interest expense 7063000
Equity ratio 744238000
450683000+ 744238000
= 0.6228
Debt ratio 450683000
450683000+ 744238000
= 0.3772
Debt/equity ratio
450683000744238000
=0.61
Interest coverage ratio 2491770007063000
= 35.28

David Jones Financial Report Analysis• 2011 14
The debt/equity ratio of 0.61 suggests that on every dollar of equity comes 0.61
dollar of debt. This indicates that DJ has a good solvency as total liabilities are covered
using only 61% of its equity. This implies a low long-term solvency risk. The equity
ratio of 0.6228 also implies a good solvency because more than 50% of the assets are
financed with equity. This suggests lower risks to lenders, thus resulting in lower
interest rates for DJ’s borrowings. Thus, DJ is more likely to meet interest payments.
Consequently, lower interest rates lead to a higher interest coverage ratio, which is
another measure of solvency, because of the lower interest expenses.

David Jones Financial Report Analysis• 2011 15
6. Business Strategy Analysis
DJ’s strategy in FY09-12 is to grow shareholder returns in a sustainable manner.
Through the FY09-FY12 Strategic Plan, there are four main “vehicles” which have been
used to increase the NPAT by 5-10% p.a., which should subsequently increase equity
available to be redistributed as dividends to shareholders:
1. Increase in higher margin categories: Increased the gross profit margin from
39.5% in FY08 to 39.6% in FY09 and from 39.6% in FY09 to 39.7% in FY10.
This has been predominantly achieved by refurbishing 11-14 high value stores5.
2. Opening 4-8 high value new stores: This is to capture the growing customer
base in areas with strong demographics. This increased NPAT (14.8% from
FY07 to FY08 and 9.1% from FY08 to FY09), ultimately helping DJ increase
gross profit margin also. In FY09, agreements were entered to open 4 new
stores6.
3. Delivering costs of doing business (CODB) improvements: By reducing
CODB, costs of goods sold should fall accordingly. This would improve EBIT7,
thus, leading to a higher NPAT. CODB for FY10 was 29.8%, an improvement
of 50 basis points from FY09 (30.3%). This was on top of an improvement of 90
basis points from the FY08 CODB (31.2%).
5 E.g. the Kotara store in the hunter region of NSW and the Bourke St Mall Melbourne Flagship store. 6 Sunshine Plaza (Sunshine Coast, QLD), Whitford (Perth, WA), Macquarie Centre (Sydney, NSW) and Pacific Fair (Gold Coast, QLD). 7 EBIT increased by 9.44% in FY09 to FY10
David Jones Financial Report Analysis• 2011 16
4. Launch of DJ/Amex storecard in time for Christmas FY08: The alliance
announced in Feb 08 caused a significant decrease in accounts receivable
because DJ was able to transfer $374.3 million of accounts receivable to Amex.
Dividends paid on ordinary shares, which by 3.7% in FY08 and 7.14% in FY09,
suggests that DJ is achieving their goal. Also, despite having high capital expenditure in
FY09 due to the store refurbishments, DJ was actually paying high dividends to its
shareholders, suggesting availability of substantial free cash flow.

David Jones Financial Report Analysis• 2011 17
7. Earnings Management Analysis
Figure 2. Percentage changes from FY068
As figure 2 above shows, DJ’s market share price has not mirrored typical
performance indicators such as sales, gross profit, EBIT, and NPAT. This discrepancy
can be explained in two ways: (i) the use of earnings management and (ii) the GFC.
8 Calculated as percentage changes of a given year from FY06. E.g. Percentage change of EBIT FY08 from FY06 was calculated by subtracting EBIT FY06 from EBIT FY08 and then dividing this result by EBIT FY06.
-‐60.00%
-‐40.00%
-‐20.00%
0.00%
20.00%
40.00%
60.00%
80.00%
100.00%
120.00%
140.00%
2006 2007 2008 2009 2010
Percentage change from
FY06
Financial year
Sales Gross proGit EBIT NPAT Total Assets
Total Liabilities Net Assets Market share price ROA ROE

David Jones Financial Report Analysis• 2011 18
While there has been insufficient evidence to argue that DJ has utilized earnings
management, one factor suggests that earnings management might have been used to
achieve steeper increases in NPAT relative to sales performance. DJ’s re-owning of its
flagship Sydney and Melbourne CBD stores in FY06 eliminated $30 million rental
expenses in FY09 and estimated rental expenses of $61 million p.a. in 20 years. This
increased the NPAT due to reduced rental expenses by capitalizing those assets.
However, externalities offer a more plausible explanation for the discrepancy
between share price and NPAT. Market share price is influenced by external factors
such as market expectations of future earnings, natural disasters, global politics and
global financial market situations. Thus, GFC caused the drop in DJ’s share market
price from $4.66 in FY07 to $3.00 in FY09 in spite of a steady increase in NPAT during
FY07 to FY09. In addition, market expectations may have speculated higher NPAT than
DJs actual NPAT. This may have caused the share price of DJ to drop from FY07-09.
However, during Australia’s recovery from the GFC around FY10, expectations of
rising consumer expenditure along with the low share price of $3.00 enticed more
investors to invest with DJ, thus driving market prices up sharply to $4.60. This rise in
share price occurred regardless of modest performance in sales.