
Landry howto tellourorganicstory_communicationsandmarketingworkshop_ea

Dave Landry On Swing Trading, OverA Decade Later From The Greatest Bull To A Very Impressive Bear It’s been over 10 years since I wrote my first book, Dave Landry on Swing Trading. The book was written at the end of the greatest bull market in history. Nine years later, we experienced one of the worst bear markets in history. Considering these abrupt changes plus the fact that I still field quite a few questions about the book, I thought it would be agood time to look at how my approach has changed. The good news is, the patterns still work and trend following is alive and well. In fact, I’m still using virtually all of the patterns from my first book. There are a few caveats though. It’s not as easy as it once was. Moves now take time to develop and you can no longer trade in a “textbook” fashion any more. Let’s take a look at these and other subtle but important changes. How I’ve Changed Before we get into what’s changed with my book and the markets, I think it’s important for me to discuss how I’ve changed. No, I’m not talking about the increased number of gray hairs and my larger girth. I referring to my approach to the markets. Although my wife Marcy will argue that in my case age doesn’t guarantee maturity, I do think I have at least matured as a trader. I’ve learned more and more that the real money is in longer-term trends. Although I’ve always been willing to stay with a position as long as it moves in my favor, I’ve become more and more patient in recent years. I’m willing to give stocks more room to breathe and more time to work. I’m also willing to do nothing as long as that’s what the market is suggesting that I should do. Part of this newer patience is my realization where the real money is and part of it is changing market conditions. Trends don’t show up every day. And when they do, they take time to develop. Keep in mind there’s nothing wrong with super active trading. I admire those that can do it. It’s just not my style. I’d rather ride out a longer term trend than “chase my own tail” by trying catch every zig and zag. One thing that hasn’t changed is my goals. My goal on each and every trade is to pick only those stocks (and other markets) that I think have the potential to make a quick short-term move but also have the potential for a longer-term homerun. Now that we know how I’ve changed, let’s look at what’s changed since the book was published. When in Doubt, Get Out If I could only take one line out of the book, “When in doubt, get out” would be it. Within the context of the raging bull market, you were foolish to stick with any position that wasn’t initially moving in your favor. Nowadays, trends take time to ensue. You have to be willing to give positions time to work. It also seems that even on your biggest winners, you have to be willing to take a little heat (i.e. initial losses).

5% Max Per Risk My publisher encouraged me to put a maximum risk amount per trade. I initially submitted 10% and then later agreed to 5%. Again, within the context of the greatest bull market in history, since most positions moved in your favor anyway, I figured 5% would probably work. Nowadays, many stocks move well over 5% in a matter of minutes and often not in the intended direction. Therefore, that rule should be ignored. In fact there is no fixed percentage that you should apply to all stocks. If a stock bounces around 10% a day, then your stop has to be well outside that range. Otherwise, you will certainly be stopped out on noise along. Keep in mind that with larger stops, you have to adjust the amount of shares traded to keep risk in line. See articles under lessons at www.davelandry.com for more on this.

Enter Right About The Prior Day’s High Within the context of the great bull market, you wanted to be in a position as quickly as possible. It was a “snooze ya lose” situation. Now, stocks often fake out above the prior day’s high (for longs) and then sell off hard. Therefore, I have become more and more liberal with my entries. I often place them well above the prior day’s high and/or above multiple highs. This helps to ensure, but of course not guarantee, that I avoid false moves. In fact, in the service (email me if you need archives) we have avoided many losing trades over the past several years (and especially last few years!) by giving entries a little “wiggle room.” Below is one of them. Notice that a textbook entry would have resulted in a loss whereas a “wiggle room” entry would have avoided a loss. For more on entries, see “How to Enter a Trade” under lessons and also see the webcasts.
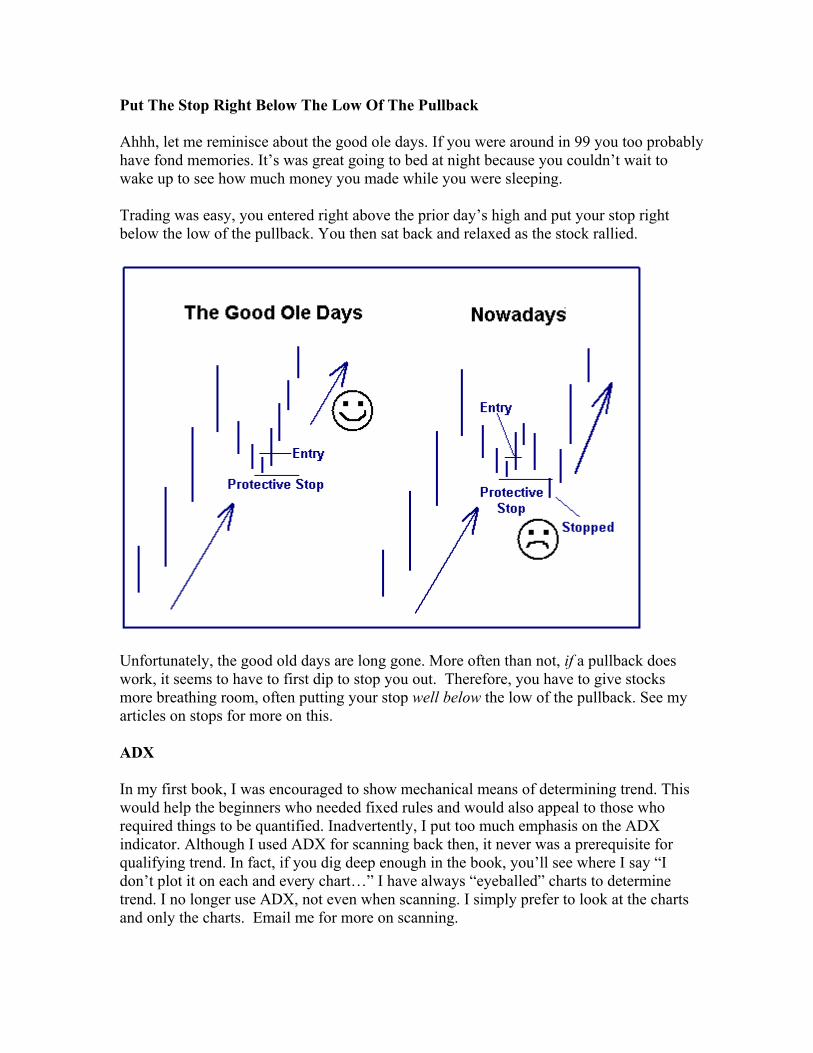
Put The Stop Right Below The Low Of The Pullback
have fond memories. It’s was great going to bed at night because you couldn’t wait to wake up to see how much money you made while you were sleeping. Trading was easy, you entered right above the prior day’s high and put your stop right below the low of the pullback. You then sat back and relaxed as the stock rallied.
Unfortunately, the good old days are long gone. More often than not, if a pullback does work, it seems to have to first dip to stop you out. Therefore, you have to give stocks more breathing room, often putting your stop well below the low of the pullback. See my articles on stops for more on this. ADX In my first book, I was encouraged to show mechanical means of determining trend. This would help the beginners who needed fixed rules and would also appeal to those who required things to be quantified. Inadvertently, I put too much emphasis on the ADX indicator. Although I used ADX for scanning back then, it never was a prerequisite for qualifying trend. In fact, if you dig deep enough in the book, you’ll see where I say “I don’t plot it on each and every chart…” I have always “eyeballed” charts to determine trend. I no longer use ADX, not even when scanning. I simply prefer to look at the charts and only the charts. Email me for more on scanning.
Ahhh, let me reminisce about the good ole days. If you were around in 99 you too probably

Focusing On Price Movement Vs. Percentage Movement Short-term traders tend to focus on the amount of points they can “pull out” of a market. They’re not so much concerned with the percentage move. A point is a point to them. They tend to generally focus on higher priced stocks because they move around more on a point basis. When my book was published, I was much more short-term oriented. I too was concerned with “pulling points” out of the market vs. percentage gains. As I’ve become longer-term oriented, I find myself more concerned with percentage moves than points. Although I still prefer somewhat higher priced stocks (especially for shorts), I have loosened my parameters here and am willing to now consider stocks in the single digits. Part of this is my changing my investment horizon, looking for percent gains vs. point gains and part of this is a function of the lingering bear market---there just aren’t that many higher priced stocks left. At the time this is being published, my minimum price in my scans is set to $6 per share. Mechanical Market Timing Systems In the early 90s, I spent many years researching mechanical systems, especially for market timing. I figured since I had a degree in computer science, I might as well use it. I assumed that there had to be a way to mechanize trading. And, if I looked hard enough, I would find the “holy grail.” Since there are those who will only believe something if it is quantified, I was encouraged to put some of my mechanical systems research into the book. I’ve been a 100% discretionary trader for years. I no longer try to mechanize things. I’ve learned that there is no “holy grail” and commonsense is more often than not, you’re best friend. I found that mechanical systems are great within a certain context of the market. However, conditions change and so must the trader. As an example, the Volatility Index (VIX) used to be a great predictor of stock prices and then it just seemed to stop working for a few years. I later discovered that this could be attributed to a large degree of leverage funds using spreads. This greatly compressed the volatility of the market. Although I don’t run the systems any more, I do occasionally take a “peek” at the VIX. I would venture to say that the VIX systems are once again working now that volatility has increased. This increase in volatility could possibly be due to a de-leveraging of the aforementioned spreaders. I haven’t run the numbers on the other systems either. However, I would venture to say that they’ve probably had some period of spectacular returns followed by extended periods of under performance. Keep in mind that I am not taking a shot at those who use and develop mechanical systems. It’s just that after many years of research, I’ve come to the realization that it’s just not for me. I think markets change and traders must adapt. I think that we can use our heads to make much better decisions than a computer.

Micro Patterns Again, within the context of a raging bull market, most all patterns worked. At that time, I was experimenting with “micro” patterns—smaller versions of classics such as cup and handles, double bottoms, etc… Although I still pay attention to these micro patterns, I no longer trade directly off of them. I prefer to stick with my main patterns and combine them with bigger picture technical analysis. This is not to say that micro versions of technical analysis no longer work. It’s just that I’m more and more focused on capturing longer-term moves therefore, I focus mostly on bigger picture patterns. In Summary Market conditions change and so must the trader. Although my patterns published 9 years ago still work, the trader must adapt the application of them to current conditions. Traders also change. For me, this meant learning to focus more and more on where the real money is. Further, I’ve learned to be more patient.

DAVE LANDRYON SWING TRADING
3 3 3 3 3 3 3 3 3 3 3 3 3 3 3 3 3 3 3 3 3 3 3 3 3 3 3 3 3 3 3

Copyright © 2002, David S. Landry
ALL RIGHTS RESERVED. No part of this publication may be reproduced, stored in a retrievalsystem, or transmitted in any form or by any means, electronic, mechanical, photocopying,recording, or otherwise, without the prior written permission of the publisher and the author.This publication is designed to provide accurate and authoritative information in regard to thesubject matter covered. It is sold with the understanding that the authors and the publisher are notengaged in rendering legal, accounting, or other professional service.
Authorization to photocopy items for internal or personal use, or for the internal or personal useof specific clients, is granted by Sentive Trading, LLC, provided that the U.S. $7.00 per page feeis paid directly to Sentive Trading, LLC, P.O. Box 298 Abita Springs, LA, 70420. 1-985-898-4993.
ISBN 1-893756-09-2
Ebook created in United States of America


DAVE LANDRYON SWING TRADING
3 3 3 3 3 3 3 3 3 3 3 3 3 3 3 3 3 3 3 3 3 3 3 3 3 3 3 3 3 3 3
David Landry
Sentive Trading, LLC

To Marcy, for believing in meeven when I didn’t believe in myself.

CONTENTS3 3 3 3 3 3 3 3 3 3 3 3 3 3 3 3 3 3 3 3 3 3 3 3 3 3 3 3 3 3 3
PREFACE xi
ACKNOWLEDGMENTS xiii
INTRODUCTION 1
SECTION ONE THE BASICS OF SWING TRADING 5
Chapter 1 DRAWDOWN: THE TRADER’S WORST ENEMY 7
Chapter 2 LANDRY’S RULES AND MONEY MANAGEMENTFOR THE SWING TRADER 11
Chapter 3 TREND QUALIFIERS 17
Chapter 4 STOCK SELECTION 29
Chapter 5 PULLBACKS 33
SECTION TWO MORE SWING TRADING PATTERNS 59
Chapter 6 FAKEOUTS AND FALSE MOVES 61Trend Knockouts 62Double Top Knockout (DT-KO) 68Trend Pivot (False Rally) Pullbacks 75
vii

Chapter 7 BOW TIES 83
Chapter 8 MICRO PATTERNS 93High-Level Micro Double Bottom 93High-Level Micro Cup and Handle 100
SECTION THREE VOLATILITY 109
Chapter 9 FINDING EXPLOSIVE MOVES:AN ADVANCED LESSON IN SWING TRADING 111
SECTION FOUR MARKET TIMING 123
Chapter 10 MARKET TIMING FOR SWING TRADING 125Discretionary Analysis 125Oscillator Swing System 129TRIN Reversals 133CVR III—Modified 138
SECTION FIVE OPTIONS 159
Chapter 11 A FEW WORDS ABOUT USINGOPTIONS WITH SWING TRADES 161
SECTION SIX PSYCHOLOGY 165
Chapter 12 TRADER’S PSYCHOLOGY 167
Chapter 13 LESSONS LEARNED 173
SECTION SEVEN PUTTING THE PIECES TOGETHER 183
Chapter 14 NIGHTLY PREPARATION 185
Chapter 15 MORE EXAMPLES 191Money-Management Examples 191Trend Qualifiers and Setup Examples 195
Chapter 16 MORE THOUGHTS 203
Chapter 17 READY, SET, WAIT! 207
Chapter 18 CLOSING THOUGHTS 209
viii Contents

APPENDIX 211Formulas 211Glossary 212Shorting Stocks: The Art of Playing Both Sides of the Market 220Capturing Trends with the ADX 224
Contents ix


PREFACE3 3 3 3 3 3 3 3 3 3 3 3 3 3 3 3 3 3 3 3 3 3 3 3 3 3
I have a confession. I am a trading-method “junkie.” I buy, or at least usedto buy, every book on trading published. When a book would arrive, I’dtake the phone off the hook, pull down the shades and was not to be dis-turbed. I’d tear into it like an addict long overdue for a fix. When I’d readthe introduction about how great the book was going to be, I’d feel mypulse quicken as I thought of how much money I’d make applying the con-cepts.
Then, slowly but surely, I’d feel myself let down as none of the promisesmaterialized. Authors had methods that were extremely complex and dif-ficult to understand. Further, they were purposely vague. And worse,many, at the end of the book, would assure me that if I spent anotherthousand or so on a trading course, then I’d really get the concepts.
When Larry Connors, CEO of TradingMarkets.com and M. Gordon Pub-lishing, approached me to do a book, I told him, “Great! I’ve got thesetheories.” After a moment of uncomfortable silence, Larry suggested,“Why don’t you write about exactly what you do in a clear, concise man-ner? After all, this is what you do on the website and what people havecome to expect from you.”
At this point, it hit me. I was on the verge of writing a book long on the-ory and short on substance. A book not unlike the trading books Iloathed.
xi

I began to think, what type of book would I want to buy? With thatthought in my head, I began writing about my exact techniques I use dayin and day out in my trading and market analysis. These techniques arenot rocket science. If you’re looking for a book with complex magic for-mulas, then you’ll surely be disappointed. However, if you’re interestedin a simple, straightforward approach to swing trading, then this book isfor you.
xii Preface

ACKNOWLEDGMENTS3 3 3 3 3 3 3 3 3 3 3 3 3 3 3 3 3 3 3 3 3 3 3 3 3 3
In markets, many often come to the same conclusion through observationand experience. Over the years, I’ve come up with many “discoveries” onlyto later find out that others have come to the same conclusion years prior. Ihave strived to give credit where credit is due to those who have influencedme. For those of you who have come to similar conclusions and are not rec-ognized, I can assure you, it’s simply an oversight and I apologize.
The following people have had a material impact not only on this book,but also on me, as well as my life. Words alone cannot thank themenough.
Me being where I am was set off by a chain of events six years ago, achain of events started by Joe Calandro who convinced me that my re-search was worthy.
To Larry Connors, for teaching me how to think “conceptually correct”when it comes to the markets. Also, for pushing me to excel and forcingme to recognize untapped talent, and for providing me with numerousopportunities.
To Jeff Cooper, for teaching me how to read charts and for showing meyou can make a living trading stocks on a short-term basis. To those ofyou familiar with Jeff’s works, you’ll notice his influence throughout thismanual.
To my futures broker, Rob Lingle, for giving me the same respect givento large traders back when I was just getting started.
xiii

To Ken Brown, for teaching me to approach trading as a business and for making me aprincipal in his firm.
To my parents, Anna Marie and Sentive Joseph (S.J.) Landry, for putting up with meand all my endeavors over the years.
To my stepdaughter Suzie, for making me “daddy.” And to my daughter Isabelle, foralways greeting me with a big smile and open arms even on days when I violate myrisk-loss parameters. Both of you bring so much joy to my life.
To Greg Che, for his help with this manuscript and for helping me feel confident dur-ing adverse market conditions.
The following people were instrumental in creating this book. Without them, it wouldnever have happened. First and foremost, to the staff of M. Gordon Publishing espe-cially Danilo Torres and Andy Splichal for their work in getting this book published.Thanks also to my editor Judy Brown of Brown Enterprises and proofreaders JimJohnson, Duke Heberlein, Jason Meyer and Marianne Winfield.
To John Del Gaudio for giving me the perspective of an aspiring, novice trader and fornot letting me gloss over anything.
xiv Acknowledgments
INTRODUCTION3 3 3 3 3 3 3 3 3 3 3 3 3 3 3 3 3 3 3 3 3 3 3 3 3 3
Natural ebbs and flows of markets occur over time. Markets often thrust,rest and thrust again. Many times these thrusts can be substantial but, un-
“digest” their gains. The intermediate-term trader is willing to sit throughthese periods for weeks to months. On the other hand, the nimble swingtrader carefully picks his spots and is able to capture the crux of a market’smove without the excessive risks of longer-term market exposure.
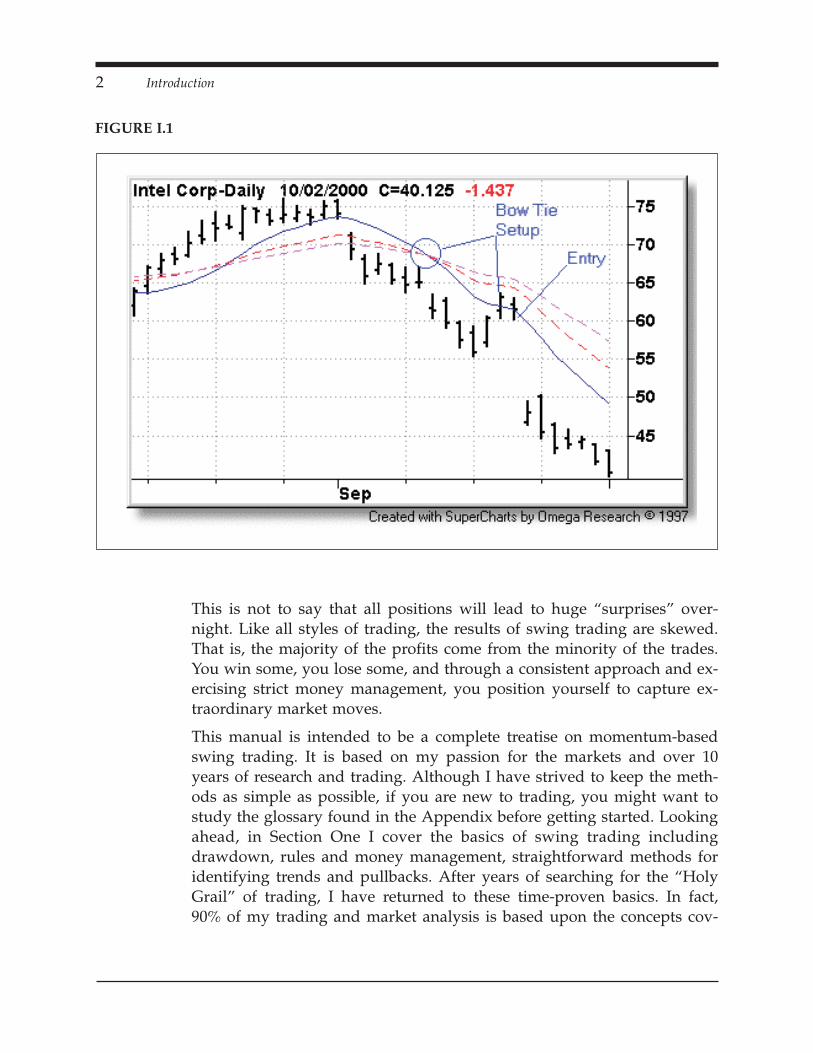
At the other end of the spectrum from the intermediate-term trader is thedaytrader. Daytraders avoid carrying positions overnight for fear of largeadverse market moves. However, as professional trader Jeff Cooperstates, “Surprises often happen in the direction of the trend.” I’ll take thisone step further and say that surprises happen in the direction of thetrend over several days. And, by holding positions for two to seven days,substantial market moves can often be captured. The exact reason thatdaytraders do not take positions home—for fear of overnight sur-prises—is the exact reason that I do swing trading. Referring to Figure I.1of Intel (INTC), notice that the stock had rolled over and had began todowntrend. Also notice that it set up and triggered an entry as a Bow Tie(explained in detail in Chapter 7) the same day they announced (after theclose) that they would have an earnings shortfall. The stock implodesovernight and trades lower over the next seven days.
1
fortunately, the moves are often short lived. In fact, like much of life andbusiness, the Pareto principle (i.e. the 80/20 rule) applies. 80% of a market'susually occur in only 20% of the time. The rest of the time markets consolidate to
This is not to say that all positions will lead to huge “surprises” over-night. Like all styles of trading, the results of swing trading are skewed.That is, the majority of the profits come from the minority of the trades.You win some, you lose some, and through a consistent approach and ex-ercising strict money management, you position yourself to capture ex-traordinary market moves.
This manual is intended to be a complete treatise on momentum-basedswing trading. It is based on my passion for the markets and over 10years of research and trading. Although I have strived to keep the meth-ods as simple as possible, if you are new to trading, you might want tostudy the glossary found in the Appendix before getting started. Lookingahead, in Section One I cover the basics of swing trading includingdrawdown, rules and money management, straightforward methods foridentifying trends and pullbacks. After years of searching for the “HolyGrail” of trading, I have returned to these time-proven basics. In fact,90% of my trading and market analysis is based upon the concepts cov-
2 Introduction
FIGURE I.1

ered here. In Section Two I discuss more specific setups for swing trad-ing. These include Fakeouts and False Moves, which allow the swingtrader to take advantage of traders who have been knocked out or aretrapped on the wrong side of the market; Bow Ties, which seek to cap-ture a transition in the trend without the pitfalls associated with top andbottom picking; and Micro Patterns, which are smaller, yet quite often ef-fective, versions of classical technical analysis patterns. In Section Three,Volatility, I’ll show how volatility can be combined with basic and ad-vanced concepts discussed in the manual to capture large moves instocks. In Section Four, Market Timing, I show how to combine the pat-terns, setups and concepts discussed in the manual with the overall mar-ket. I’ll also show three swing-trading systems developed for the indexfutures. By implementing these techniques, you will stack the odds inyour favor by trading on the correct side of the market. In Section Five,Options, I will show how the swing trader can use options to help con-trol risks and maximize profits. In Section Six, Psychology, I will discusshow to recognize and avoid the psychological pitfalls associated withtrading. I will also discuss lessons learned through my own experienceand those of others. Finally, in Section Seven, I will tie everything to-gether by discussing nightly preparation, as well as providing numerousexamples and some additional thoughts on swing trading. In the Appen-dix I provide all the formulas mentioned throughout the manual alongwith a primer on shorting stocks for those new to trading.
Introduction 3

SECTION ONE
THE BASICS OFSWING TRADING3 3 3 3 3 3 3 3 3 3 3 3 3 3 3 3 3 3 3 3 3 3 3 3 3 3 3 3 3 3 3
5


CHAPTER 1
DRAWDOWN: THETRADER’S WORST ENEMY3 3 3 3 3 3 3 3 3 3 3 3 3 3 3 3 3 3 3 3 3 3 3 3 3 3
You cannot get ahead while you are getting even.
—Dick Armey
All the setups and concepts in this manual, or any trading manual for thatmatter, are completely worthless without following general rules and propermoney management. This can best be demonstrated through the study ofdrawdown.
Drawdown is simply the amount of money you lose trading, expressedas a percentage of your total trading equity. If all your trades were profit-able, you would never experience a drawdown. Drawdown does notmeasure overall performance, only the money lost while achieving thatperformance. Its calculation begins only with a losing trade and contin-ues as long as the account hits new equity lows.
Maximum Drawdown or Peak-to-Trough Drawdown is the largest per-centage drop in your account between equity peaks. In other words, it’show much money you lose until you get back to breakeven. If you beganwith $10,000 and lost $4,000 before getting back to breakeven, your maxi-mum drawdown would be 40%. Keep in mind that no matter how much
7

TABLE 1.1
Notice that as losses (drawdown) increase, the percent gain necessary torecover to breakeven increases at a much faster rate.
you are up in your account at any given time—100%, 200%, 300%—a100% drawdown will wipe out your trading account.
Recovering from a drawdown can be extremely difficult and illustrateswhy money management is so important. Those new to trading believethat if they lose 10%, they will be back to breakeven on the first 10%gain. Unfortunately, this is not true. In order to make back a 10% loss,you must make at least 11.11% on your remaining equity. Even worse isthat as the drawdowns deepen, the recovery percentage begins to growgeometrically. For example, a 50% loss requires a 100% return just to getback to breakeven. This is illustrated in Table 1.1 and Figure 1.1 below. Istrongly urge you to make a copy of these figures and paste them nearyour trading desk.
Professional traders and money mangers are well aware of how difficultit is to recover from drawdowns. Those who succeed long term have theutmost respect for risk. They get on top and stay on top, not by beinggunslingers and taking huge risks, but by controlling risk through propermoney management. Sure, we all like to read about famous traders whoparlay small sums into fortunes, but what these stories fail to mention isthat many such traders, through lack of respect for risk, are eventuallywiped out.
8 Chapter 1
% Loss ofCapital
% of GainRequired toRecoup Loss
10% 11.11%20% 25.00%30% 42.85%40% 66.66%50% 100%60% 150%70% 233%80% 400%90% 900%
100% broke

Drawdown: The Trader’s Worst Enemy 9
FIGURE 1.1
Percent loss (drawdown) vs. percent to recover. Notice that the percent to recover (top line)grows at a geometric rate as the percent loss increases. This illustrates the difficulty ofrecovering from a loss and why money management is so important.


CHAPTER 2
LANDRY’S RULES ANDMONEY MANAGEMENTFOR THE SWING TRADER3 3 3 3 3 3 3 3 3 3 3 3 3 3 3 3 3 3 3 3 3 3 3 3 3 3
1. Treat Trading as a Business—Most people wouldn’t dream of startinga business without everything necessary. Yet, many, while trying tobecome successful traders, cut corners when it comes to equipment.Make sure you create an infrastructure that supports your business onan ongoing and emergency basis. This includes buying the best com-puters, data and charts you can afford.
2. Do Your Homework—In trading, you are competing against some ofthe brightest minds in the world. Therefore, you must be willing toput in the necessary hours to be prepared.
3. Manage Yourself—In trading, you are responsible for all of your deci-sions. Make sure you are making them with a clear mind. Don’t tradeif you are sick, distracted, during major life events or if you are simplynot prepared.
11

4. The Trend Is Your Friend—Market moves often last much longer andgo much further than most are willing to admit. Trying to pick topsand bottoms is a loser’s game.
5. Limit Losses—As soon as a position is initiated, you should have aprotective stop right below the recent support (for longs), or above re-cent resistance (for shorts). For purposes of the setups outlined in themanual, this will usually be below the lowest bar of the setup (forlongs) or the highest bar of the setup (for shorts). If this is greater than5% of the stock’s value, risk no more than 5%.
Swing trading often produces many small gains with only an occa-sional home run. Therefore, protective stops must be used on alltrades. Getting careless on just one trade can erase many winners.
6. No Tickie, No Tradie—Swing trading involves identifying short-termsupport and resistance and where a market will likely re-assert itself. Itis not about fading the market by picking tops and bottoms. There-fore, wait for follow-through before attempting to enter a trade.
For instance, suppose a market is in rally mode and begins to sell off;chances are the next move will be a resumption of the originaluptrend. However, until that uptrend begins to resume, positionsshould not be initiated. For longs, this means waiting for the market toturn back up, and for shorts, it means waiting for the market to turnback down.
12 Chapter 2

7. Take Partial Profits Quickly—On most swing trades, the profits willbe small and have the potential to quickly erode. Therefore, as soon asyour profits (a) are equal to or greater than your initial risk (b), you shouldlock in half of your profits and move your protective stop on your remainingshares to breakeven (c) (near your original entry).
Locking in half of your profits and moving your stop to breakevenwhen your profits are greater than or equal to your initial risk willhelp to generate income for your account. This income will help to
Landry’s Rules and Money Management for the Swing Trader 13
pay for the inevitable small losses associated with swing trading. Fur-ther, barring overnight gaps, this gives you, at worst, a breakeventrade and a chance at a home run on the remaining position. LarryConnors, in Connors On Advanced Trading, has dubbed this simple, yeteffective, form of money management “2-for-1 Money Management.”We will walk through several examples of this concept under Chapter15, More Examples.
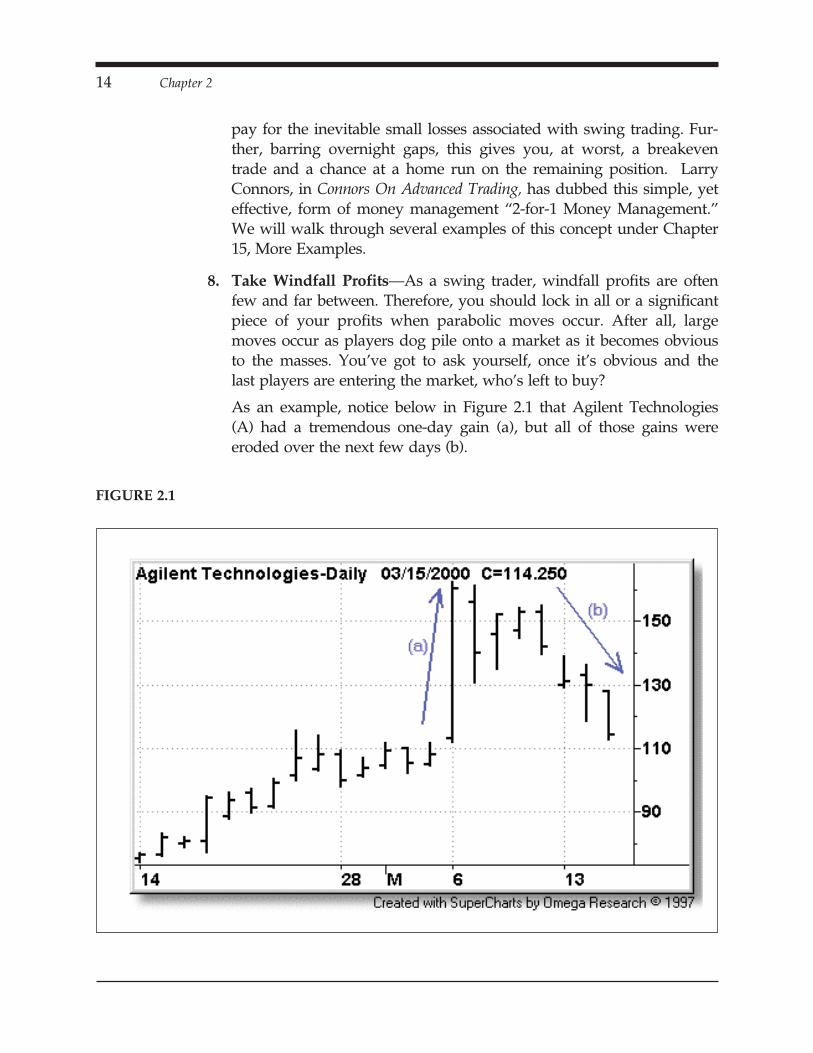
8. Take Windfall Profits—As a swing trader, windfall profits are oftenfew and far between. Therefore, you should lock in all or a significantpiece of your profits when parabolic moves occur. After all, largemoves occur as players dog pile onto a market as it becomes obviousto the masses. You’ve got to ask yourself, once it’s obvious and thelast players are entering the market, who’s left to buy?
As an example, notice below in Figure 2.1 that Agilent Technologies(A) had a tremendous one-day gain (a), but all of those gains wereeroded over the next few days (b).
14 Chapter 2
FIGURE 2.1

Never, never, never allow the above to happen to you. Not only isthis financially debilitating, but it’s also psychologically debilitating.
9. Trade in Liquid and Active Markets—As swing traders, we are look-ing for an immediate short-term move. We don’t have the luxury ofwaiting around until a large price-move takes place. Therefore, themarkets we trade in must be liquid and active so we can move in andout with ease and, hopefully, capture short-term fluctuations. Tradingin thin and dull markets can be costly and will likely chew you up, asmost short-term trading profits are small. We’ll expand upon this con-cept in Chapter 4, Stock Selection, and Section Three, Volatility.
10. Stack the Odds in Your Favor—In trading, the more pieces of thepuzzle that fit together, the better. This means determining an overallmarket bias (if any), trading the strongest stocks in the strongest sec-tors (or weakest stocks in the weakest sectors for shorts) and combin-ing bigger picture technical patterns and studying the volatility of thestock. We’ll expand upon these concepts throughout this manual.
11. Keep Position Size Within Reason—Swing trading is a game of prob-abilities. You win some, you lose some, and hopefully, through a con-sistent approach, you make money overall. Swing trading is not abouttrying to hit “home runs” by taking excessive risk on any one position.In fact, you should never take a position large enough to have a mate-rial impact on your trading account should—or more likely, when—aprice shock occurs. In general, you should not risk more than 2% ofyour account value on any given trade.
12. Never Add to a Losing Position!—If you are wrong, then admit itand move on. Averaging down—that is, adding to losing positions—isa loser’s game.
13. Enter the Entire Position at Once—In swing trading we are in themarket for a short period of time and looking for a swift move. Unlikethe longer-term player who has the luxury of building positions overtime and at an average price while waiting for the market to move,the swing trader is looking for an immediate move. In most cases, youshould be looking to lock in profits and tighten stops as the marketmoves in your favor—not add to positions.
If you must pyramid, then do it quickly as the position moves in yourfavor, and make sure it looks like an actual pyramid. In other words,only add to profitable positions and establish your largest position
Landry’s Rules and Money Management for the Swing Trader 15
first. A 3-2-1 is a good ratio for establishing positions. For instance, ifyour position size is 500 shares, then enter 300, then 200, then 100,provided, of course, that the market is moving in your favor whileadding to the position.
14. Remain Consistent—Successful traders find a formula and stick to it.Swing trading is no different. You must find an approach that worksfor you and apply it in a consistent methodical manner. In addition tobeing consistent in your approach, you must also be consistent in yourmoney-management techniques. This involves keeping position sizewithin reason, using initial protective stops, taking profits and trailingstops.
15. When In Doubt, Get Out—In swing trading, we are looking for animmediate short-term move. If the market doesn’t move immediately,then there’s no need to remain in the market—even if you’re notstopped out. The longer you are in a market that is not moving inyour favor, the more you are exposing yourself to a potential adversemove. In most cases, you’re better off exiting the position and waitingfor the market to set up again. A good rule of thumb here is to exitpositions that aren’t profitable within one to two days.
16. Know When to Say When—Be willing to stop trading and re-evaluatethe markets, yourself and your methodologies when you encounter astring of losses. The markets will always be there. Gann said it best:“When you make one to three trades that show losses, whether they be largeor small, something is wrong with you and not the market. Your trend mayhave changed. My rule is to get out and wait. Study the reason for yourlosses. Remember, you will never lose any money by being out of the market.”
17. Re-eead Rule #5!
16 Chapter 2

CHAPTER 3
TREND QUALIFIERS3 3 3 3 3 3 3 3 3 3 3 3 3 3 3 3 3 3 3 3 3 3 3 3 3 3
The trend is your friend.
—truest market adage
Most of the methods in this manual involve first identifying stronglytrending markets. In this chapter we will look at how to define a trend.
WHAT IS A TREND?Quite simply, an uptrend is a series of higher prices over time. If a stockwas at $50 per share a month ago and is now trading at $100 per share,it’s obviously in an uptrend. When looking at a bar chart, it is a series ofhigher highs and higher lows.
17

A downtrend is quite simply a series of lower prices over time. If a stockwas trading at $100 per share a month ago and is now trading at $50 pershare, then it is obviously in a downtrend. When looking at a bar chart, itis a series of lower highs and lower lows.
MEASURING TREND
ADX (Average Directional Movement Index)
Developed by Welles Wilder, the ADX is used to measure the strength ofa market but not its direction. The higher the reading, the stronger thetrend, regardless of whether it is up or down. The direction of the marketis suggested by two components that make up the ADX: the Positive Di-rectional Movement Index (+DMI) and the Minus Directional MovementIndex (–DMI). In general, an ADX reading of 30 or higher with +DMI >–DMI denotes a strong uptrend. Referring to Figure 3.1 of Veritas Soft-ware, notice at point (a) the ADX reading was greater than 30 and the+DMI was above the –DMI suggesting an uptrend was developing.
18 Chapter 3
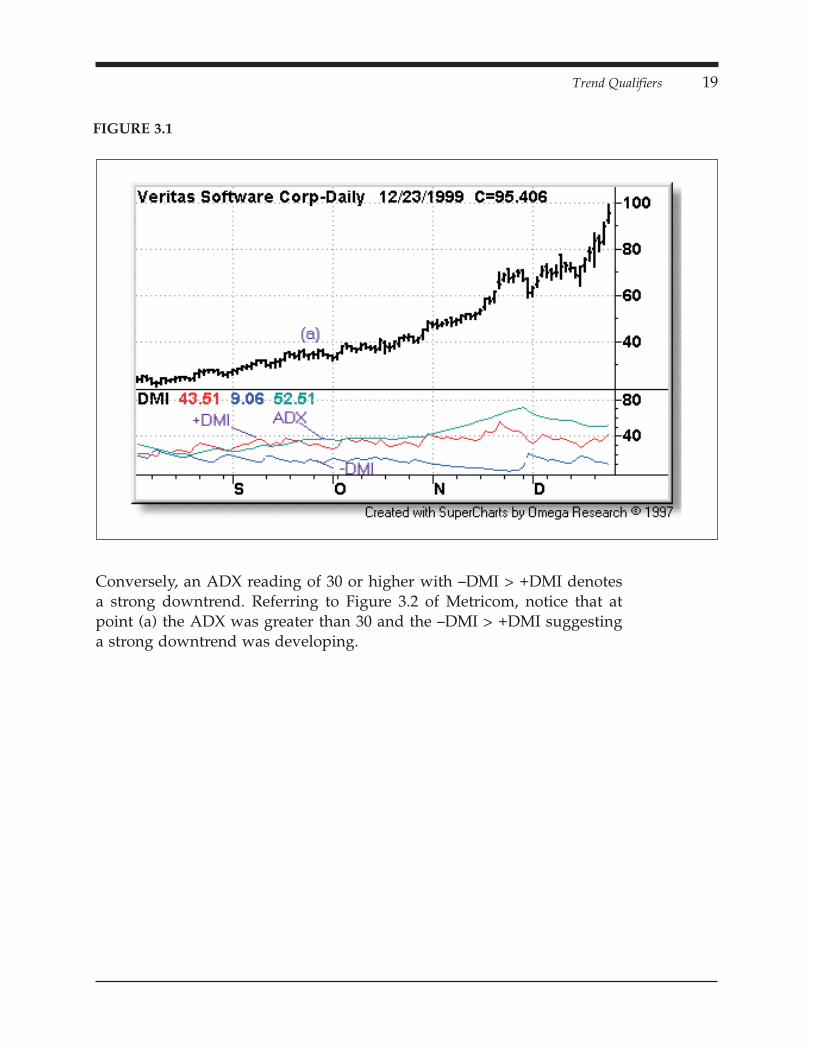
Conversely, an ADX reading of 30 or higher with –DMI > +DMI denotesa strong downtrend. Referring to Figure 3.2 of Metricom, notice that atpoint (a) the ADX was greater than 30 and the –DMI > +DMI suggestinga strong downtrend was developing.
Trend Qualifiers 19
FIGURE 3.1

Details on how ADX and DMI are calculated are provided in the Appen-dix. For purposes of this manual, all you need to know is that ADX >=30 and +DMI > –DMI suggests an uptrend and ADX >= 30 and –DMI >+DMI suggests a downtrend.
DEVELOPING AN EYE FOR TRENDMany are obsessed with finding exact formulas to define trend. They getcaught up in precise measurements. For instance, they won’t trade a mar-ket because the ADX is less than X or the RS isn’t greater than Y. Thetruth is, like trading in general, there are no exacts when it comes tomeasuring trend.
This is not to say that trend indicators such as ADX do not have theirplace. These standardized indicators are very useful when running com-puter scans on thousands of stocks. In addition, to those newer to trad-ing, these indicators can help take away some of the guesswork.
20 Chapter 3
FIGURE 3.2

So how should trends be measured? The good news is that determiningtrend does not have to be complex. With a little experience, you’ll findthat a simple “eyeballing” of a chart will give you a much better idea ofthe trend than any precise computerized method.
TREND QUALIFIERSThere are certain clues that a trending market will leave behind. I havedubbed these “Trend Qualifiers.” With a little practice, you’ll be able toquickly glance at a chart, recognize these patterns and know instinctivelywhether or not a market is in a strong trend.
Base Breakouts—A base breakout is when a wide-range bar that goeshigher occurs after a sideways market movement. When a stock goessideways, it suggests the buyers and the sellers agree on price. When thestock breaks out of this base, the buyers have gained control with thelikelihood that the trend is developing.
Trend Qualifiers 21

Gaps in the direction of the trend—A gap occurs when a stock opensabove the prior day’s high (a gap higher) or opens below the prior day’slow (a gap lower). When a stock gaps in the direction of the uptrend, itsuggests strong demand for the stock as buyers are bidding up the stockbefore it opens. Note in the diagram below that the lows of the gapdays are also greater than the prior day’s high. This indicates even morestrength.
Laps in the direction of the trend—A lap occurs when a stock opensgreater than the prior day’s close but less than the prior day’s high.While not as strong as a gap, a lap in the direction of trend suggests de-mand for the stock.
22 Chapter 3
New Highs—A stock must hit new highs if it is in an uptrend. Atwo-month calendar high (approximately 43 trading days) is a good ruleof thumb to use here.
New Lows—A stock must hit new lows if it is in a downtrend. Atwo-month calendar low (approximately 43 trading days) is a good ruleof thumb to use here.
Percentage Moves—how much a stock has risen or fallen over a givenperiod of time. For instance, a stock that goes from $50 to $100 in amonth is up 100%. Obviously, though, it doesn’t take a mathematicsPh.D. to determine that stocks making such moves are in uptrends.
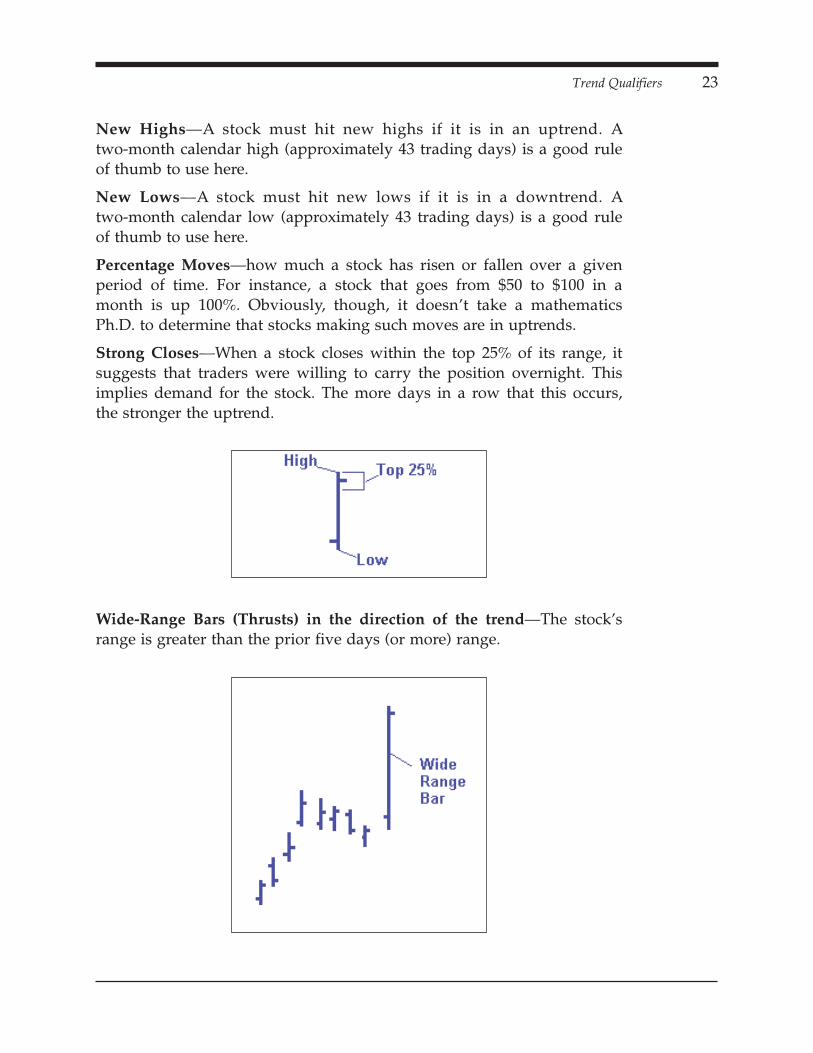
Strong Closes—When a stock closes within the top 25% of its range, itsuggests that traders were willing to carry the position overnight. Thisimplies demand for the stock. The more days in a row that this occurs,the stronger the uptrend.
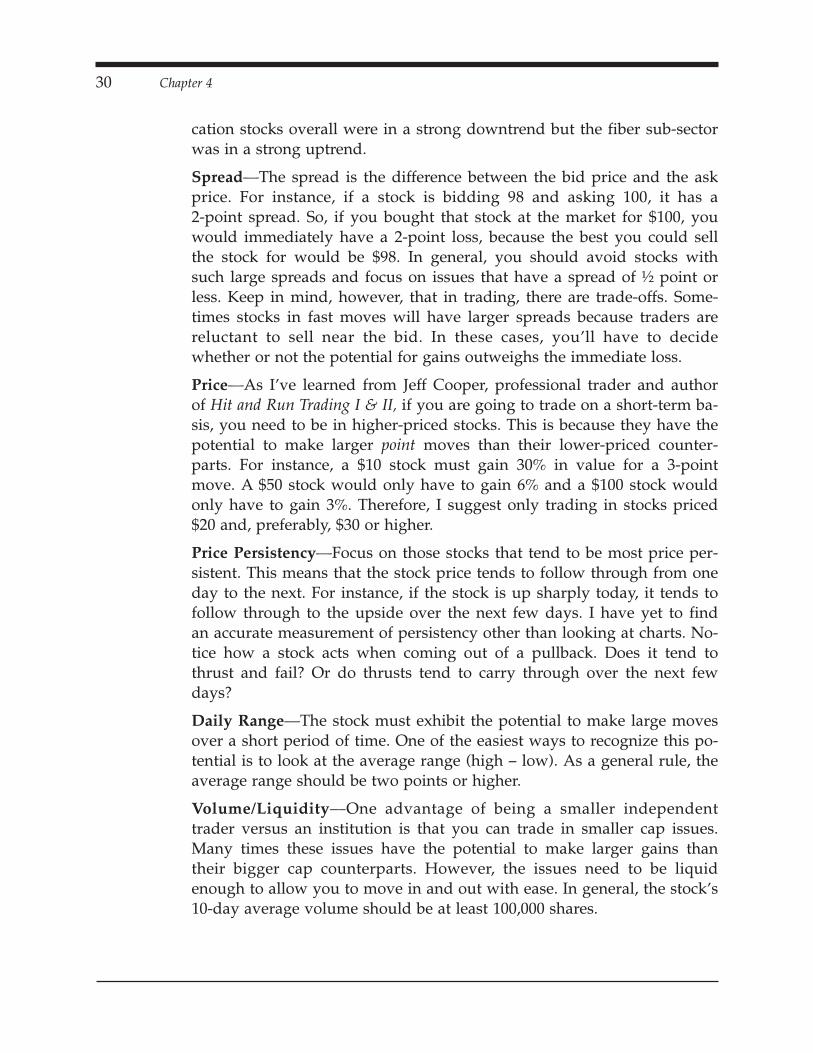
Wide-Range Bars (Thrusts) in the direction of the trend—The stock’srange is greater than the prior five days (or more) range.
Trend Qualifiers 23

Here’s an example of a stock that shows multiple Trend Qualifiersthroughout a 90-day period. The trend was easily determined early on bythe base breakout. The stock then proceeded to show strong trendingcharacteristics.
MOVING AVERAGESMoving averages are also helpful when determining trend. I like to use a10-day simple moving average (SMA), 20-day exponential moving aver-age (EMA) and 30-day EMA. The 10-day SMA gives me a true represen-tation of price over the last two weeks (10 trading days). The 20- and30-period EMAs give a rough representation of performance over the lastmonth and six weeks, respectively. I like the exponential averages for
24 Chapter 3
FIGURE 3.3
Alexion Pharmaceuticals (ALXN) rises over 700% in 10 weeks. During that period, it broke out froma base, made new two-month highs (NH), had strong closes and gaps and wide-range bars (WRB) inthe direction of the uptrend.

these longer periods as they are front-weighted and catch up to pricesfaster.
The characteristics of moving averages that I use to help me determinetrend include slope, Daylight and proper order.
SlopeSlope is quite simply the direction in which the moving averages arepointing. Positive slope suggests an uptrend, negative slope suggests adowntrend and very little slope suggests a consolidation.
Daylight
In December of 1996, I published the 2/20 EMA Breakout System inStocks And Commodities Magazine. The system essentially looks to go longafter two or more lows are greater than the 20-day EMA. Soon after itwas published, several traders contacted me to discuss how they usedand modified the system to fit their needs. One trader, Joe Sansolo,dubbed the lows being greater than the moving average “Daylight” be-cause you could see “daylight” in between the low of the bar (or highsfor downtrends) and the moving average. This daylight many timesmeans the trend is in place and beginning to accelerate.
Proper Order
In an uptrend, a faster (shorter time frames) moving average will followcloser to price than a slower (longer time frames) moving average. There-fore, when using a 10-day SMA, a 20-day EMA and a 30-day EMA, the
Trend Qualifiers 25

10-day SMA should be greater than the 20-day EMA and the 20-dayEMA should be greater than the 30-day EMA.
Notice the moving averages in Alexion Pharmaceuticals, mentioned pre-viously. There was Daylight and the moving averages were in proper or-der and had a positive slope throughout its strong uptrend.
THE TREND SHOULD BE OBVIOUSEven though we have gone to great length to describe trend, the truth is,it doesn’t have to be rocket science. Therefore, don’t get too caught up inthe specific details. In fact, if you have a young child at home, ask him orher what direction they think a chart is headed. If you don’t have anyyoung kids, think to yourself, “In which direction would a 6-year-old saythis stock is headed?”
And finally, keep in mind that markets only trend about 30% of the time.Trade that 30% and ignore the remaining 70%. This will further ensureyou are trading in the correct markets.
26 Chapter 3
FIGURE 3.4

Q&A
Q. Are there any hard fast rules when it comes to determining trend?
A. No. If the right side of the chart is higher than the left, then that is anuptrend. If the right side of the chart is lower than the left side, then itis in a downtrend. Seriously, it should be obvious.
Q. You used 10-day simple and 20-day and 30-day exponential movingaverages for stocks. Do you also use these in other markets?
A. Yes. For an index, like the Nasdaq or S&P, I like to also plot a 50-dayand 200-day simple moving average because it is well-watched by in-stitutions.
Q. Is a simple moving average better than an exponential moving aver-age or vice versa?
A. I think both have their place. I like the simple for shorter time periods,say 10 days or less, because this gives me true representation of theaverage price. Longer term, I like to use exponential moving averagesas they still give me a feel for the longer-term average price, but beingfront-weighted, tend to catch up to current prices faster.
Trend Qualifiers 27

CHAPTER 4
STOCK SELECTION3 3 3 3 3 3 3 3 3 3 3 3 3 3 3 3 3 3 3 3 3 3 3 3 3 3
As momentum swing traders, we are looking to capture explosiveshort-term market moves. We do not have the luxury of waiting around forsomething to happen. Therefore, it’s vitally important that we are trading instocks that show the most immediate potential. Obviously, as momentumplayers, trend is one of our main criteria. In addition to trend, the stocksmust be volatile, a member of the strongest sector, priced high enough andhave a reasonable spread to make short-term trading worthwhile. These,along with several other criteria for selecting stocks, are discussed below.
Trend—In general, the stocks should have an ADX reading of 30 orhigher and +DMI > –DMI for uptrends and –DMI > +DMI for down-trends. Keep in mind that no indicator guarantees that a stock is in atrend. Therefore, make sure the trend is obvious (regardless of the ADXreading) and shows characteristics described under “Trend Qualifiers.”
Sector—Trade in stocks that are members of the strongest sectors. Theold stock market adage “A rising tide lifts all boats” is as relevant to in-dividual sectors as it is to the major averages. In fact, because sectors canoften outperform and even trade counter to the overall market, the sectoraction is more important than the overall stock market.
Under ideal conditions, the overall sector should be in a strong trend.However, keep in mind that sometimes sub-sectors can trade indepen-dently of the overall sector. For instance, in mid-2000, the telecommuni-
29
cation stocks overall were in a strong downtrend but the fiber sub-sectorwas in a strong uptrend.
Spread—The spread is the difference between the bid price and the askprice. For instance, if a stock is bidding 98 and asking 100, it has a2-point spread. So, if you bought that stock at the market for $100, youwould immediately have a 2-point loss, because the best you could sellthe stock for would be $98. In general, you should avoid stocks withsuch large spreads and focus on issues that have a spread of ½ point orless. Keep in mind, however, that in trading, there are trade-offs. Some-times stocks in fast moves will have larger spreads because traders arereluctant to sell near the bid. In these cases, you’ll have to decidewhether or not the potential for gains outweighs the immediate loss.
Price—As I’ve learned from Jeff Cooper, professional trader and authorof Hit and Run Trading I & II, if you are going to trade on a short-term ba-sis, you need to be in higher-priced stocks. This is because they have thepotential to make larger point moves than their lower-priced counter-parts. For instance, a $10 stock must gain 30% in value for a 3-pointmove. A $50 stock would only have to gain 6% and a $100 stock wouldonly have to gain 3%. Therefore, I suggest only trading in stocks priced$20 and, preferably, $30 or higher.
Price Persistency—Focus on those stocks that tend to be most price per-sistent. This means that the stock price tends to follow through from oneday to the next. For instance, if the stock is up sharply today, it tends tofollow through to the upside over the next few days. I have yet to findan accurate measurement of persistency other than looking at charts. No-tice how a stock acts when coming out of a pullback. Does it tend tothrust and fail? Or do thrusts tend to carry through over the next fewdays?
Daily Range—The stock must exhibit the potential to make large movesover a short period of time. One of the easiest ways to recognize this po-tential is to look at the average range (high – low). As a general rule, theaverage range should be two points or higher.
Volume/Liquidity—One advantage of being a smaller independenttrader versus an institution is that you can trade in smaller cap issues.Many times these issues have the potential to make larger gains thantheir bigger cap counterparts. However, the issues need to be liquidenough to allow you to move in and out with ease. In general, the stock’s10-day average volume should be at least 100,000 shares.
30 Chapter 4

Volatility—Volatility is simply how much prices fluctuate over time. Thelonger-term trader has the luxury of waiting for a stock to move. Theswing trader, on the other hand, is looking for an immediate movewithin a short time frame. Therefore, he must trade in more volatile is-sues. I believe the best standardized measurement of volatility is histori-cal volatility (HV). Stocks you trade should have a HV reading of at least40% or higher. I will discuss HV in further detail in Section Three, Vola-tility.
Stock Selection 31

CHAPTER 5
PULLBACKS3 3 3 3 3 3 3 3 3 3 3 3 3 3 3 3 3 3 3 3 3 3 3 3 3 3
The simplest theory that fits the facts of a problemis the one that should be selected.
—Occam’s Razor
Although I emphasize trading with the trend, this does not mean blindlybuying a stock simply because it is in a strong uptrend. Strongly trendingmarkets are prone to correct. And, you never know when what appears tobe a correction may in fact be the end of the trend. Therefore, it’s muchwiser to wait for the correction to occur and then look to enter if (and only if)the original trend begins to re-assert itself—this is the theory and essence ofthe pullback. In my opinion, this is the single strongest way to trade.
Referring to Figure 5.1, a hypothetical pullback example, the market is ina strong uptrend (a) and begins to correct (b). Upon trend resumption (arally), an entry is triggered (c). A protective stop (d) is placed right belowthe low of the pullback (d), just in case the correction is not complete.
33
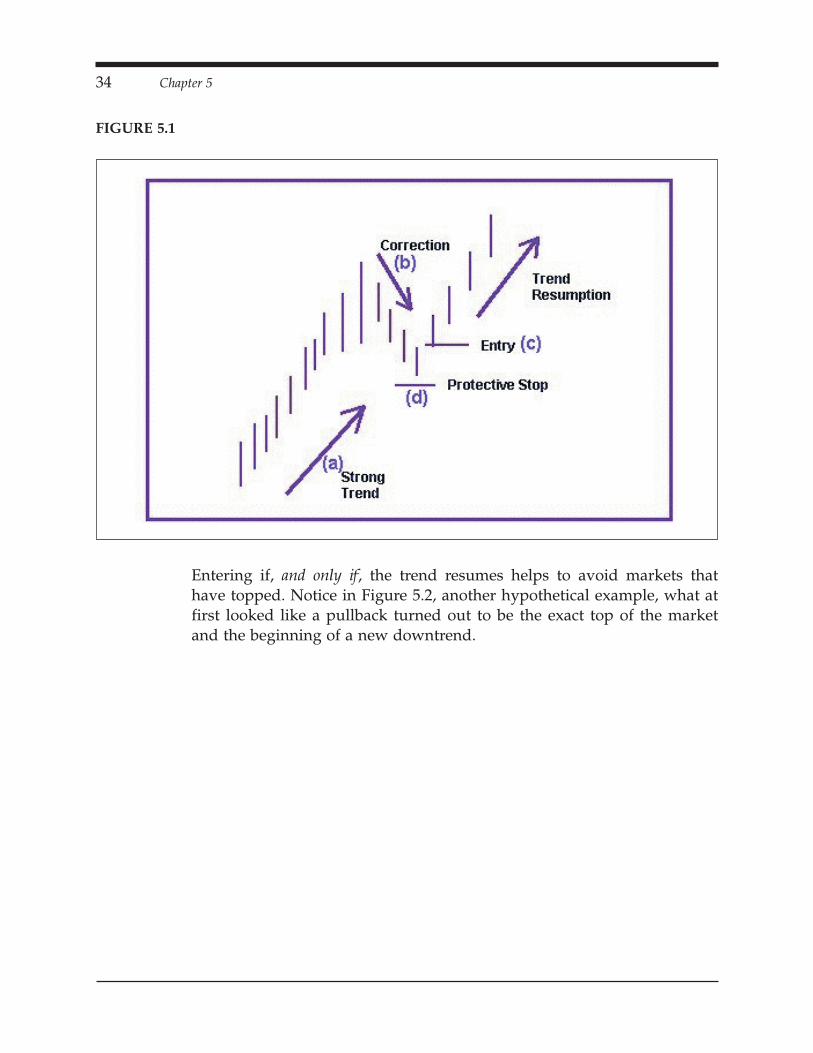
Entering if, and only if, the trend resumes helps to avoid markets thathave topped. Notice in Figure 5.2, another hypothetical example, what atfirst looked like a pullback turned out to be the exact top of the marketand the beginning of a new downtrend.
34 Chapter 5
FIGURE 5.1
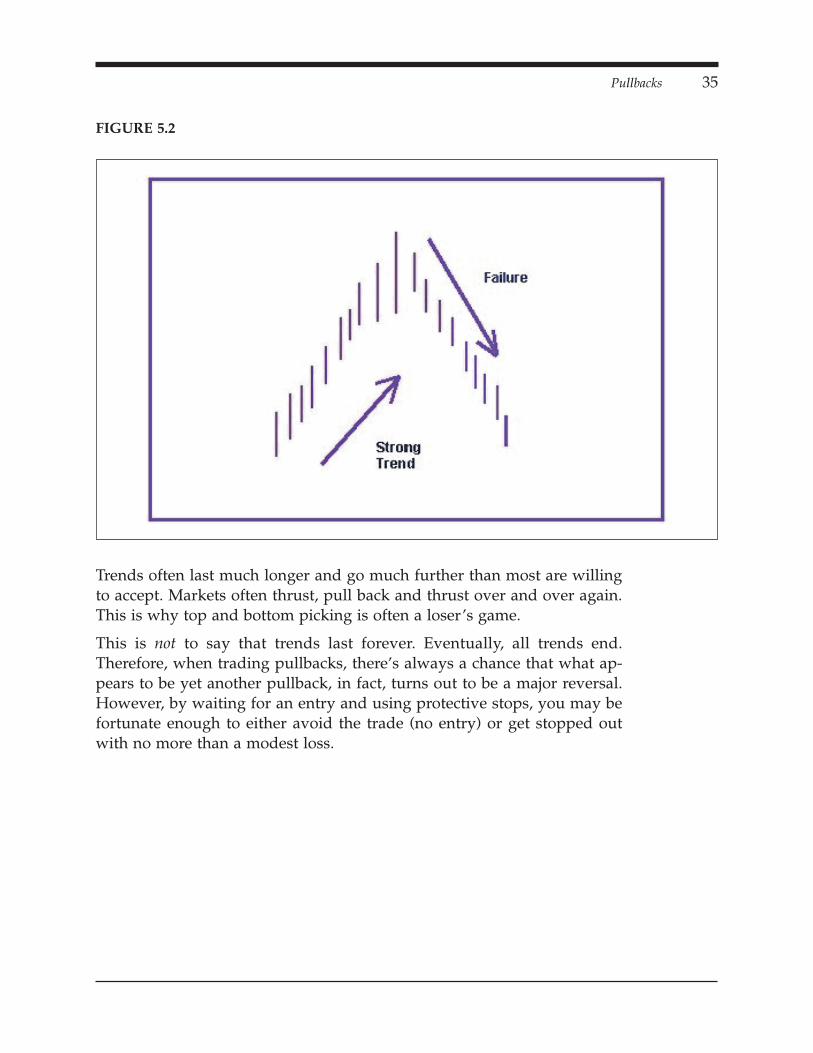
Trends often last much longer and go much further than most are willingto accept. Markets often thrust, pull back and thrust over and over again.This is why top and bottom picking is often a loser’s game.
This is not to say that trends last forever. Eventually, all trends end.Therefore, when trading pullbacks, there’s always a chance that what ap-pears to be yet another pullback, in fact, turns out to be a major reversal.However, by waiting for an entry and using protective stops, you may befortunate enough to either avoid the trade (no entry) or get stopped outwith no more than a modest loss.
Pullbacks 35
FIGURE 5.2

Infospace (INSP) provides a good real-world example. Referring to Fig-ure 5.3, notice that the stock “stair stepped” higher, over and over again,but eventually fails. One note of observation: The more times a stockpulls back and resumes its trend, the less likely the next pullback will fol-low through. Said another way, early pullbacks are superior to later pull-backs.
DEFINING A PULLBACKA pullback can be defined in terms of the trend, the new high, the widthand the depth. These are illustrated in Figure 5.4.
36 Chapter 5
FIGURE 5.3

TREND AND NEW HIGHObviously, a market must be in a trend and make a significant new highbefore a pullback can take place. Trend can be defined in terms of anADX reading of 30 or higher and +DMI > –DMI (for an uptrend) or–DMI > +DMI (for a downtrend) or by other Trend Qualifiers (Chapter3). The new high should be at least a two-month calendar high (approxi-mately 43 trading days).
WIDTHThe width is the number of bars since the last new high was made. Forinstance, a four-bar pullback has gone four days since its last new high.This is illustrated in Figure 5.5.
Pullbacks 37
FIGURE 5.4

The width should be wide enough so the market has enough time to cor-rect but not too long as to negate the market’s initial momentum.Three-to-seven bars is a good rule of thumb here. Referring to Figure 5.6,Emulex (EMLX), notice that after pulling back for eight days (a), thestock begins to drift sideways (b).
38 Chapter 5
FIGURE 5.5
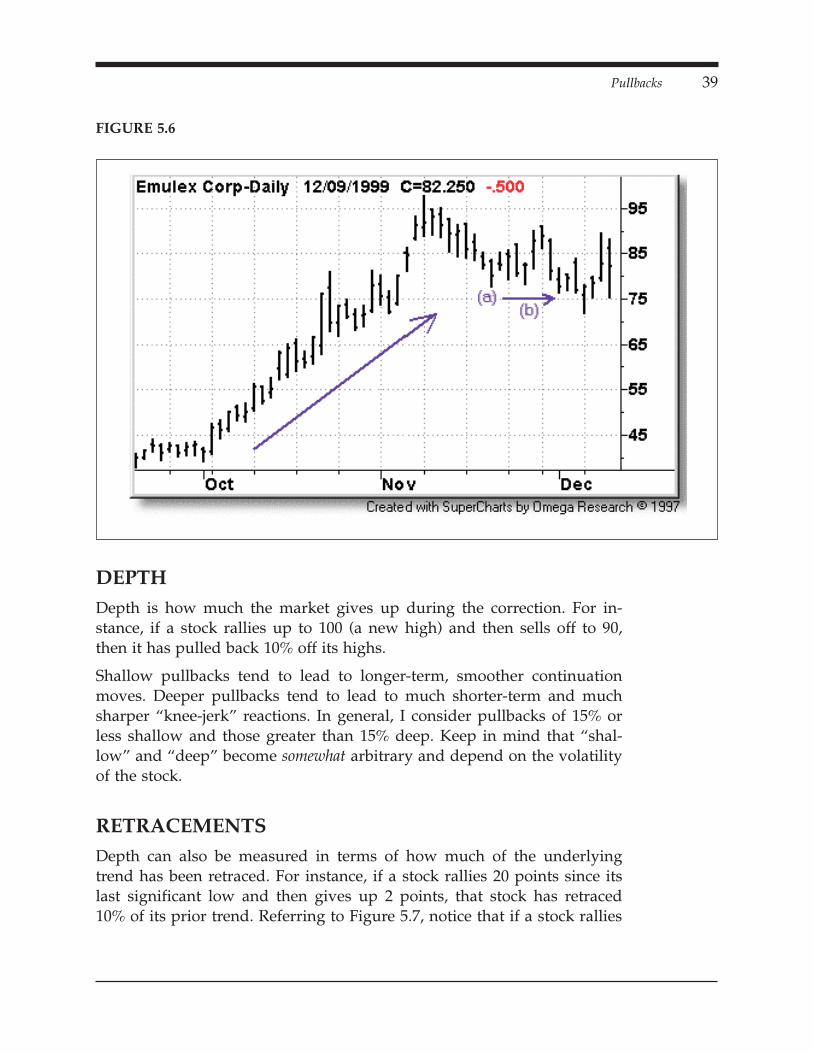
DEPTHDepth is how much the market gives up during the correction. For in-stance, if a stock rallies up to 100 (a new high) and then sells off to 90,then it has pulled back 10% off its highs.
Shallow pullbacks tend to lead to longer-term, smoother continuationmoves. Deeper pullbacks tend to lead to much shorter-term and muchsharper “knee-jerk” reactions. In general, I consider pullbacks of 15% orless shallow and those greater than 15% deep. Keep in mind that “shal-low” and “deep” become somewhat arbitrary and depend on the volatilityof the stock.
RETRACEMENTSDepth can also be measured in terms of how much of the underlyingtrend has been retraced. For instance, if a stock rallies 20 points since itslast significant low and then gives up 2 points, that stock has retraced10% of its prior trend. Referring to Figure 5.7, notice that if a stock rallies
Pullbacks 39
FIGURE 5.6
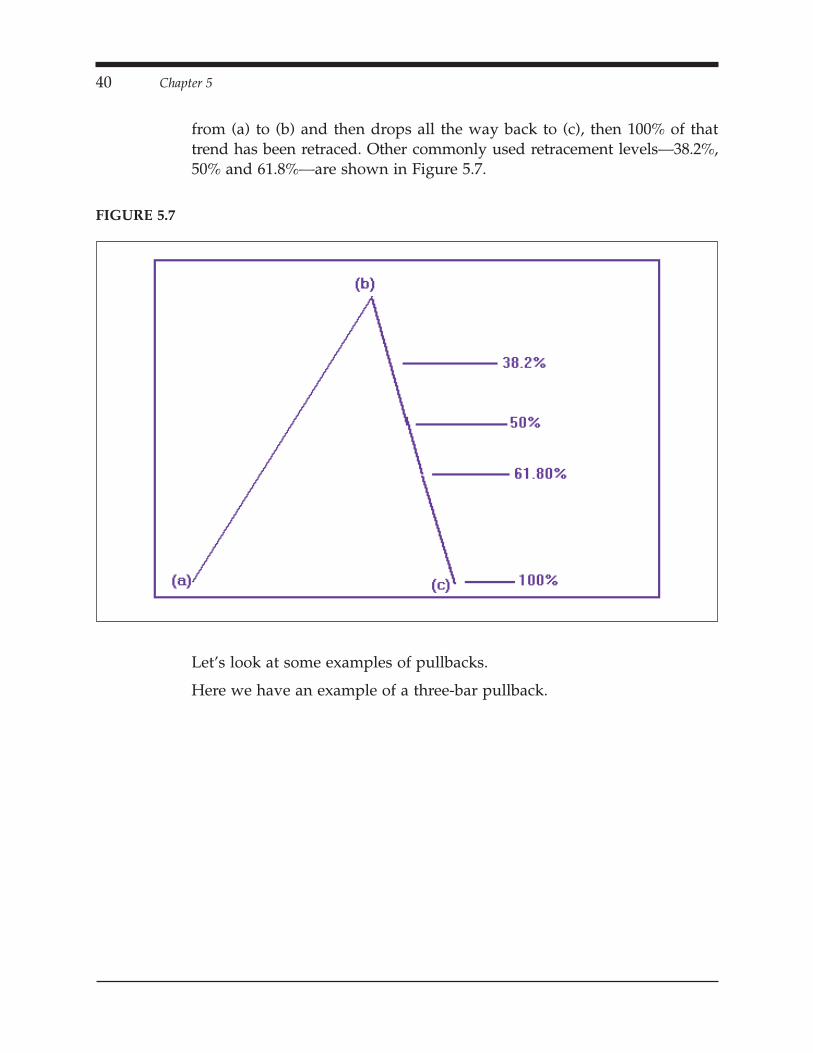
from (a) to (b) and then drops all the way back to (c), then 100% of thattrend has been retraced. Other commonly used retracement levels—38.2%,50% and 61.8%—are shown in Figure 5.7.
Let’s look at some examples of pullbacks.
Here we have an example of a three-bar pullback.
40 Chapter 5
FIGURE 5.7

1. Alexion Pharmaceuticals (ALXN) qualifies as a strongly trending stockby having an ADX reading of 60 and +DMI > –DMI (a). Other TrendQualifiers include its having tripled in value over the two months andwide-range bars (b) and strong closes (c) in the direction of theuptrend.
2. The stock makes a new two-month high.
3. It pulls back three bars (width).
4. This is 13% off the prior new high (depth) creating a fairly shallowpullback. This suggests that the stock has the potential to make a lon-ger-term continuation move. Go long tomorrow at 53 1/16, 1/16above today’s high.
5. The trend resumes as the stock trades at 53 1/16, 1/16 above the priorday’s high, and we go long.
6. A protective stop is placed at 50 15/16, 1/16 below the lowest bar inthe pullback.
7. After a slow start, the stock skyrockets over 40 points over the nextfive days.
Pullbacks 41
FIGURE 5.8

Here’s an example on the short side.
1. Motorola (MOT) qualifies as being in a downtrend by having an ADXreading of 32 and –DMI > +DMI (a). Other Trend Qualifiers includeits having lost over 40% of its value in less than two months and itshaving wide-range bars lower (b) and a gap in the direction of thedowntrend (c).
2. The stock makes a two-month low.
3. The stock pulls back 17.9% (depth) in five bars (width). Go short to-morrow at 38 1/16, 1/16 below today’s low.
4. The stock trades at 38 1/16 and we go short. A protective stop isplaced at 39 5/8, 1/16 above the highest bar in the pullback (3).
5. The downward trend resumes as the stock drops over ten points overthe next seven days.
42 Chapter 5
FIGURE 5.9
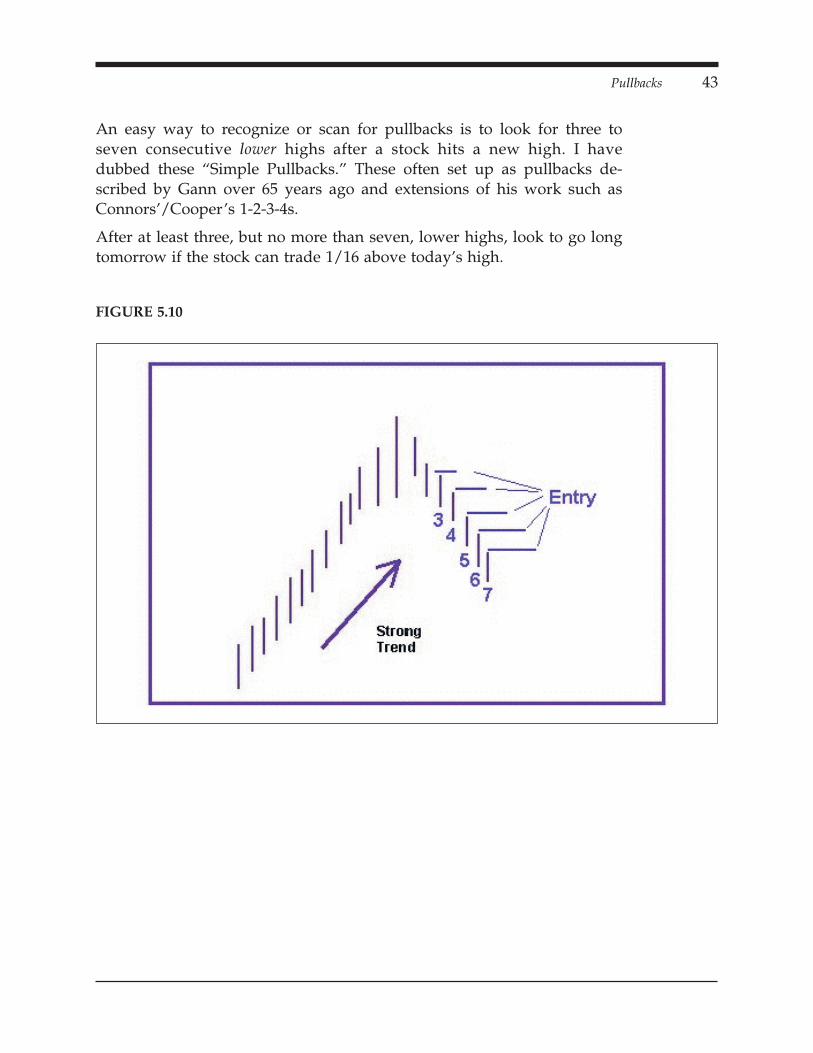
An easy way to recognize or scan for pullbacks is to look for three toseven consecutive lower highs after a stock hits a new high. I havedubbed these “Simple Pullbacks.” These often set up as pullbacks de-scribed by Gann over 65 years ago and extensions of his work such asConnors’/Cooper’s 1-2-3-4s.
After at least three, but no more than seven, lower highs, look to go longtomorrow if the stock can trade 1/16 above today’s high.
Pullbacks 43
FIGURE 5.10

Here’s an example of a four-bar Simple Pullback.
1. Transwitch (TXCC) qualifies as a strongly trending stock by having anADX of 46 and +DMI > –DMI (not shown). In addition, other TrendQualifiers include its rising over 200% in less than a month and itshaving gaps (a), (b) and (f), and its having wide-range bars, (d) and(e), and strong closes (e) in the direction of the uptrend.
2. The stock makes a new two-month high.
3. The stock makes four consecutive lower highs. Go long tomorrow at39 3/4, 1/16 above today’s high.
4. The stock gaps open to 40 11/16 (above our entry) and we go long.
5. Because the low of the formation (35 3/16) is more than 13% awayfrom our entry, we will only risk 5% of the stock’s value and place aprotective stop at 38 5/8.
44 Chapter 5
FIGURE 5.11

6. The stock resumes its uptrend and trades around 18 points higherover the next four days.
Pullbacks 45

I have observed that deeper pullbacks, say 15% or greater, of stocks instrong trends tend to create a “knee-jerk” reaction. This is based on thefact that when a stock pulls back sharply, it creates an out-of-balance sit-uation, as eager shorts jump into the market and nervous longs bail out.
Like a rubber band being stretched to extremes, the market often vio-lently “snaps back” in the direction of the longer-term trend as shortsscramble to cover and longs jump back in. Therefore, I have dubbeddeep pullbacks “Snapbacks.”
1. Open TV (OPTV) qualifies as a strongly trending stock by having anADX reading of 49 and +DMI > –DMI (not shown). In addition, otherTrend Qualifiers include its more than doubling in less than a month,its having wide-range bars with strong closes, (a) and (d), and a lap(b) and a gap (c) in the direction of the uptrend.
2. Open TV makes a new two-month high.
46 Chapter 5
FIGURE 5.12

3. The stock has a sharp 25% sell-off (depth) over four days (width). Buytomorrow at 156 1/16, 1/16 above today’s high.
4. The stock trades through at 156 1/16 and we go long.
5. Because the low of the setup (3) is more than 8% away from our entry,we will risk 5% of the stocks value and place an initial protective stopat 148 1/4.
6. The stock explodes out of the deep pullback and trades over 60 pointshigher over the next four days.
Pullbacks 47
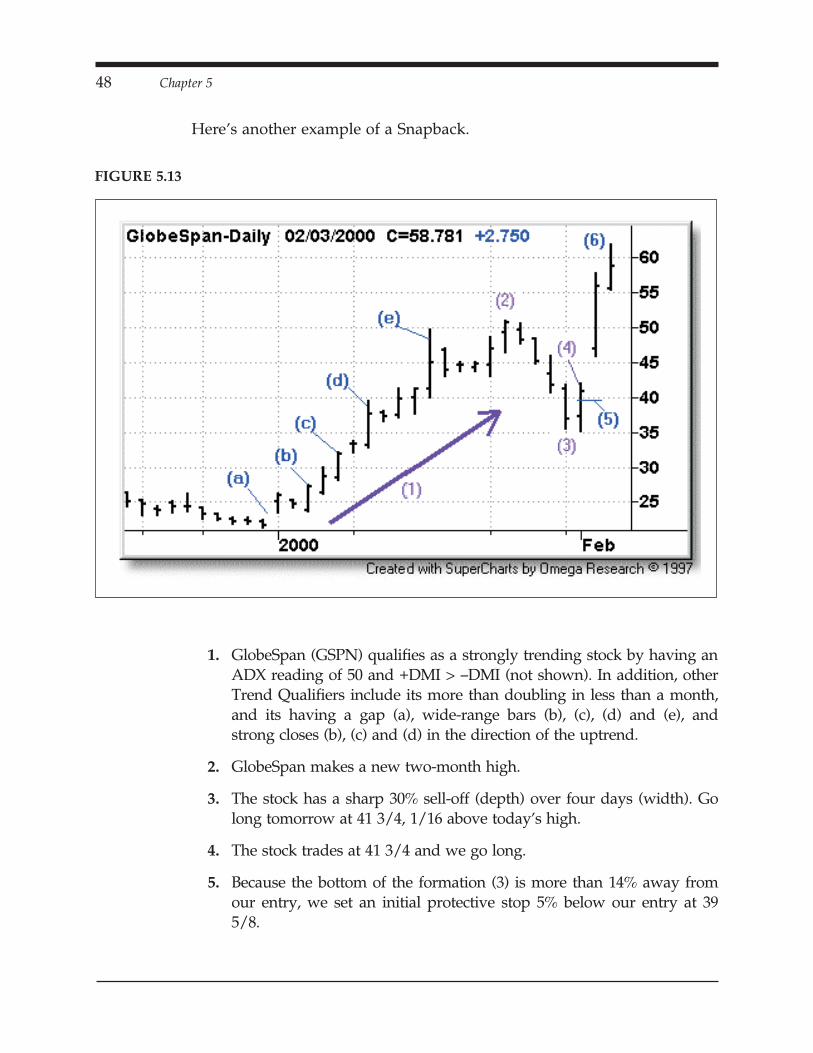
Here’s another example of a Snapback.
1. GlobeSpan (GSPN) qualifies as a strongly trending stock by having anADX reading of 50 and +DMI > –DMI (not shown). In addition, otherTrend Qualifiers include its more than doubling in less than a month,and its having a gap (a), wide-range bars (b), (c), (d) and (e), andstrong closes (b), (c) and (d) in the direction of the uptrend.
2. GlobeSpan makes a new two-month high.
3. The stock has a sharp 30% sell-off (depth) over four days (width). Golong tomorrow at 41 3/4, 1/16 above today’s high.
4. The stock trades at 41 3/4 and we go long.
5. Because the bottom of the formation (3) is more than 14% away fromour entry, we set an initial protective stop 5% below our entry at 395/8.
48 Chapter 5
FIGURE 5.13

6. The strong uptrend resumes and the stock trades 50% higher over thenext two days.
Pullbacks 49

Here’s an example of a Snapback of a stock with a low ADX but still in adowntrend.
1. Ibis Technology (IBIS) has a fairly low ADX reading of 27 (not shown),but obviously is in a downtrend after losing 60% of its value (high tolow) in less than two weeks. Other Trend Qualifiers include its havinga gap lower (a), Daylight (highs less than the moving averages) (b),negative slope in the 10-day simple, 20-day exponential and 30-dayexponential moving averages (c), a poor close on a wide-range barlower (d) and another wide-range bar lower (e).
2. The stock makes a new two-month low.
3. The stock has a sharp 35% rally (depth) over three days (width). Goshort tomorrow at 79 7/16, 1/16 below today’s low.
4. The stock trades at 79 7/16 and we go short.
5. An initial protective stop is placed at 82 7/8, 1/16 above the highesthigh of the pullback.
50 Chapter 5
FIGURE 5.14
6. The stock drops over 40 points over the next four days.
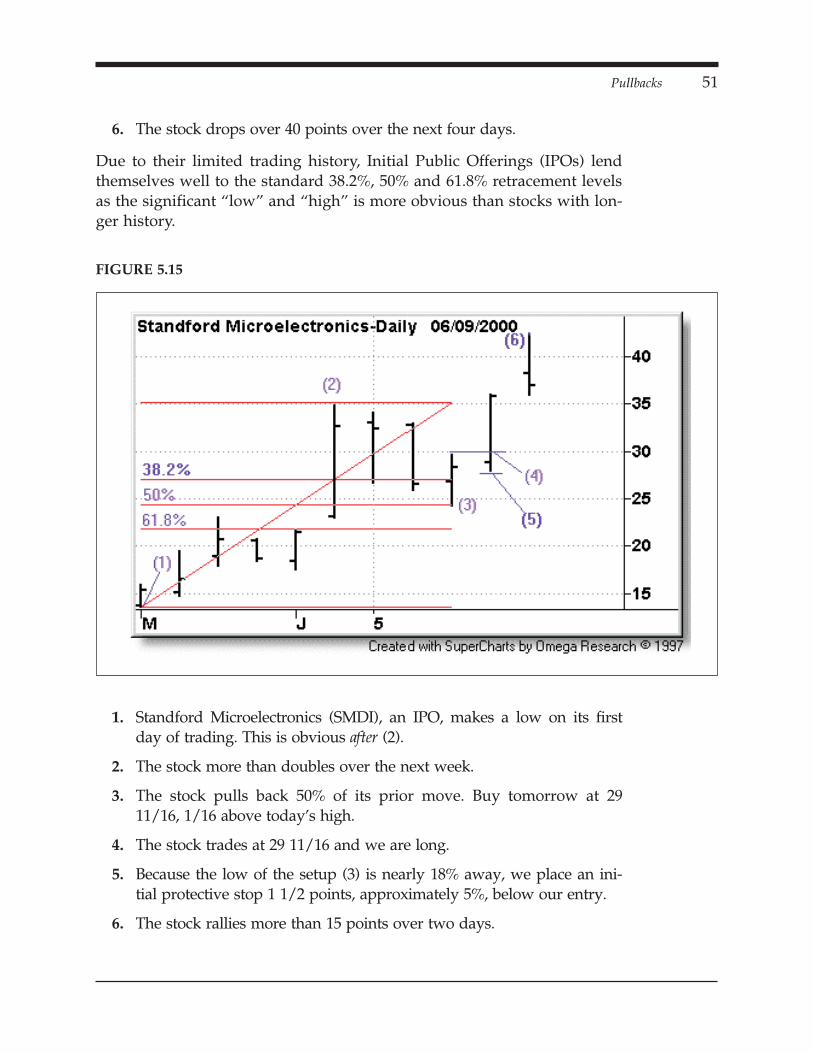
Due to their limited trading history, Initial Public Offerings (IPOs) lendthemselves well to the standard 38.2%, 50% and 61.8% retracement levelsas the significant “low” and “high” is more obvious than stocks with lon-ger history.
1. Standford Microelectronics (SMDI), an IPO, makes a low on its firstday of trading. This is obvious after (2).
2. The stock more than doubles over the next week.
3. The stock pulls back 50% of its prior move. Buy tomorrow at 2911/16, 1/16 above today’s high.
4. The stock trades at 29 11/16 and we are long.
5. Because the low of the setup (3) is nearly 18% away, we place an ini-tial protective stop 1 1/2 points, approximately 5%, below our entry.
6. The stock rallies more than 15 points over two days.
Pullbacks 51
FIGURE 5.15

Here’s another example of using retracement levels on IPOs.
1. SINA.com (SINA) makes a low the second week of trading. This is ob-vious after (2).
2. The stock runs up over 200% over the next 11 days.
3. The stock retraces 38.2%. Go long tomorrow at 29 9/16, 1/16 abovetoday’s high.
4. The stock gaps open to 30 7/16 and we go long.
5. Because the low of the setup is more than 8% away from our entry,we place a protective stop at 28 15/16 for a risk of 1 1/2 points or 5%.
6. The stock resumes its uptrend and explodes more than 20 pointshigher over the next five days.
52 Chapter 5
FIGURE 5.16

An outside day occurs when a stock trades both below the prior day’slow and above the prior day’s high. When the price drops below theprior day’s low, it attracts sellers. However, if the price reverses and ral-lies above the prior day’s high, buyers are then drawn into the market.This intraday reversal can lead to longer-term reversals. This is especiallytrue when the stock closes strongly—suggesting that the buyers won thebattle. When an outside day occurs in a pullback, it suggests that the cor-rection (pullback) is over.
Pullbacks 53

Here’s an example of an outside day in a pullback.
1. Cisco Systems (CSCO) qualifies as a strongly trending stock by havingan ADX reading of 30 and +DMI > –DMI (not shown). Other TrendQualifiers include a steady uptrend where the stock nearly doubles inless than three months.
2. A two-month high.
3. The stock makes four consecutive lower highs then sells off intradaybut reverses to close well. This action forms an outside day. Go longtomorrow at 54 7/8, 1/16 above today’s high.
4. The stock trades at 54 7/8 and we go long.
5. Because the low of the setup is more than 9% away from our entry,we risk 5% of the stock’s value and place an initial protective stop at52 1/8.
6. The intraday reversal of trend continues and the stock trades over 13points higher in eight days.
54 Chapter 5
FIGURE 5.17

Here’s an example of an outside day on the short side.
1. Digimarc Corp. (DMRC) qualifies as being a strongly trending stockby having an ADX of 38 and –DMI > +DMI (not shown) and by los-ing over 70% of its value in less than a month. Other Trend Qualifiersinclude its having wide-range bars lower (a), (b), (c) and (d), and itshaving poor closes (a) and (c).
2. A two-month low.
3. An outside day down forms after the stock pulls back three bars. Goshort tomorrow at 35 1/16, 1/16 below today’s low.
4. The stock trades at 35 1/16 and we go short.
5. Because the high of the formation is more than 18% away from ourentry, we will place a protective stop at 37 3/4 for a risk of approxi-mately 5%.
6. The trend continues from the outside day and the stock drops 15points in five days.
Pullbacks 55
FIGURE 5.18

Q&AQ. Why do pullbacks work?
A. First and foremost, you are trading with the trend. Second, you are al-lowing for the market to have a normal and often healthy correctionbefore attempting an entry. Third, you enter only if the market showssigns of the major trend resuming. Conceptually, this makes a lot ofsense.
Q. Referring to the components of a pullback: How deep is too deep?
A. A pullback is akin to the “two steps forward one step back” analogy.With that in mind, you have to question a pullback once it retracesmore than 50% of the original trend. It also depends upon the stock.The more volatile stocks, by nature, tend to have deeper corrections.
Q. Is a shallow pullback better than a deeper pullback?
A. It depends on your trading style. Shallow pullbacks tend to lead tolonger term, smoother continuation moves. Deeper pullbacks tend tolead to much shorter term and much sharper “knee-jerk” reactions.
Q. Why not wait until the old highs are exceeded (b) instead of enteringas soon as the trend begins to resume (a)?
A. You would miss the move from the pullback entry (a) to the old highs(b). Often, this can be substantial. And, in many cases, this might beall you get.
Q. Why?
56 Chapter 5
A. Once you get all the way back to the prior new high (b), those whobought at those levels previously may be looking to get out atbreakeven.
Q. Hence, a potential double top?
A. Exactly.
Q. Provided you entered during the resumption of the trend (a), wouldyou look to take profits as the old highs are approached?
A. Yes. At this juncture, the market either breaks through or fails. There-fore, you should take partial profits and tighten your stops on the restof your position. This way, if it doesn’t break through, at least youmade money on your overall position. And if it does, then you have achance at a home run on your remaining shares.
Q. You discussed that markets often “stair step” higher. How do youknow that this stair step won’t be the last?
A. You don’t. You have to keep playing the stock as if the trend will lastforever. Hopefully, you won’t get triggered on that last pullback (i.e., afalse pullback). Or, at worst, you’ll get stopped out with a modest loss.The good news is that markets often offer many opportunities beforethey eventually fail.
Q. On your retracement examples, you drew lines at 38.2%, 50% and61.8%. Were these generated by the computer?
A. Yes, but I had to manually pick the low and the high I was measuring.Retracement lines are available in most charting packages.
Q. Back to the levels, why 38.2%, 50% and 61.8%?
A. The 50% level is a logical level, as it is half of the original trend. We’reall familiar with the phrase “two steps forward, one step back.”
Q. And the 38.2% and 61.8% levels?
A. The 38.2% and 61.8% levels are based on Fibonacci Ratios.
Q. Fibonacci?
A. A Fibonacci sequence is derived by adding a series of numbers to-gether. The sum of each two numbers is added to the prior number.The process is then repeated. For instance, 1 + 1 = 2, 1 + 2 = 3, 2 + 3 =
Pullbacks 57

5 and so forth. So you end up with the sequence:1,1,2,3,5,8,13,21,34,55,89…. What’s interesting is that after about seveniterations, any number in the sequence divided by the prior number =1.618. Therefore, any prior number is the subsequent number less38.2% (1 – .618). What’s also interesting is that you can start with anytwo random numbers and these ratios will begin to show up afterabout seven iterations.
Q. Is there something magical about these numbers?
A. The numerologists believe they hold the answer to the universe asthese ratios can be found throughout nature. They point out every-thing from planetary relationships to the level of a women’s navel.Others think it was originally just a math exercise developed to teachstudents how to add.
Q. Where do you stand?
A. I always considered them hocus-pocus until I noticed Kevin Haggerty,former head of trading for Fidelity, occasionally showing retracementsin his commentary on TradingMarkets.com. I figured if someone ofhis stature watched these levels then so should I.
Q. So they are magical?
A. No. I think they have become a self-fulfilling prophecy.
Q. Anything “watched” is worth watching?
A. Exactly.
Q. You mentioned outside days in pullbacks. Hasn’t this setup alreadytriggered as a pullback?
A. Yes, it has. But, you can’t watch every single pullback to see if it willtrigger. By looking for outside days in pullbacks, you not only catchthose that triggered, but triggered from an intraday reversal.
Q. Does an outside day in a pullback work better if the stock gaps lower(for longs) before reversing to form the outside day?
A. A gap down would likely scare out more players and when it cameback, it would draw them back in. So, yes, a gap lower would proba-bly work as well, if not better.
58 Chapter 5
SECTION TWO
MORE SWINGTRADING PATTERNS3 3 3 3 3 3 3 3 3 3 3 3 3 3 3 3 3 3 3 3 3 3 3 3 3 3 3 3 3 3 3
59


CHAPTER 6
FAKEOUTS ANDFALSE MOVES3 3 3 3 3 3 3 3 3 3 3 3 3 3 3 3 3 3 3 3 3 3 3 3 3 3
We won’t get fooled again.
—The Who
Even markets in the strongest trends are prone to shakeout moves and falserallies. These markets may also form false tops that draw in eager shortsand knock out nervous longs.
The following patterns were born out of the frustration of being caughtin these shakeout moves, false rallies and false tops. From this I’velearned that no matter how strongly a market is trending, I should notenter until after some sort of correction has occurred. I’ve also learnedthat I shouldn’t try to pick a top and that a stock may still be worth trad-ing even if I’m stopped out on my first entry.
61

TREND KNOCKOUTS
While it’s a good idea to trade in the direction of the trend, I’ve learnedyou’re much better off waiting until the weak hands are knocked out ofthe market before entering yourself. The reason is, you never know whenthese traders are going to dump their positions and take you out withthem. Trend Knockouts (TKOs) identify strong trends from which theweak hands have already been knocked out. By placing your order abovethe market, you have the potential to capture profits as the trend re-sumes.
Here are the rules for Trend Knockouts:
For Buys (Short Sales are reversed):
1. The market should be in a strong trend as defined by a com-puter-based indicator such as ADX >= 30 and +DMI > –DMI or as de-fined under Trend Qualifiers (Chapter 3).
2. The market should make at least a two-bar low. Buy tomorrow or thenext day (allow yourself two days to get filled), 1/16 above today’shigh.
3. Place a protective stop below the low of the knockout bar (2). If this ismore than 5% away from your entry, risk no more than 5% of thestock’s value.
Let’s look at four examples.
62 Chapter 6
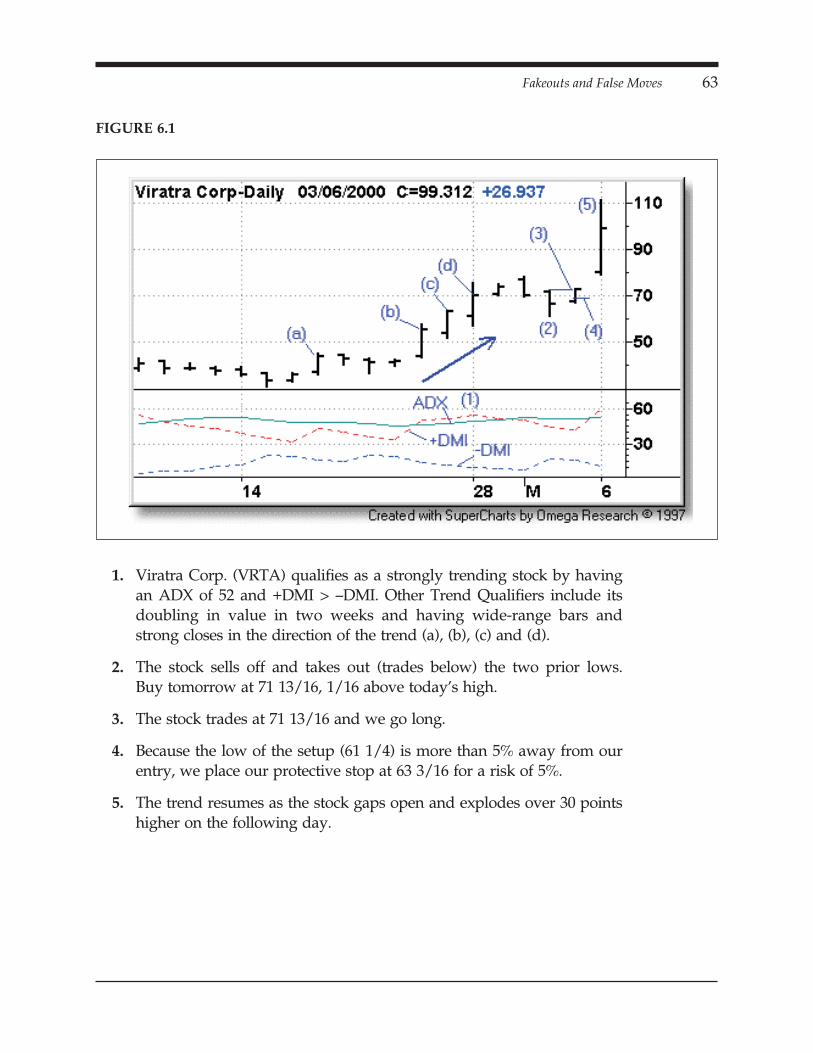
1. Viratra Corp. (VRTA) qualifies as a strongly trending stock by havingan ADX of 52 and +DMI > –DMI. Other Trend Qualifiers include itsdoubling in value in two weeks and having wide-range bars andstrong closes in the direction of the trend (a), (b), (c) and (d).
2. The stock sells off and takes out (trades below) the two prior lows.Buy tomorrow at 71 13/16, 1/16 above today’s high.
3. The stock trades at 71 13/16 and we go long.
4. Because the low of the setup (61 1/4) is more than 5% away from ourentry, we place our protective stop at 63 3/16 for a risk of 5%.
5. The trend resumes as the stock gaps open and explodes over 30 pointshigher on the following day.
Fakeouts and False Moves 63
FIGURE 6.1

Here we have an example of getting filled on the second day.
1. Gene Logic (GLGC) qualifies as a strongly trending stock by risingmore than 300% in less than a month and by having an ADX of 63and +DMI > –DMI (not shown).
2. The stock makes a two-bar low. Buy tomorrow at 79 7/8, 1/16 abovetoday’s high.
3. No fill.
4. The stock trades at 79 7/8 and we go long.
5. The low of the setup (68) is more than 5% away from our entry so weplace a protective stop at 75 7/8 for a risk of 5% of the entry price.
6. The trend resumes and the stock explodes higher over the next fewdays.
64 Chapter 6
FIGURE 6.2

Here’s another example of getting filled on the second day.
1. Abgenix (ABGX) qualifies as a strongly trending stock by having anADX of 47 and +DMI > –DMI (not shown). Other Trend Qualifiers in-clude its more than doubling in less than three weeks and havingwide-range bars (a), (b), (c) and (d), and its having strong closes in thedirection of the uptrend (b) and (d).
2. The stock makes a two-bar low. Buy tomorrow or the next day at 689/16, 1/16 above today’s high.
3. The stock trades at 68 9/16 and we go long.
4. The low of the formation (57 7/8) is more than 5% away from our en-try, so we place a protective stop at 65 1/8 for a risk of 5%.
5. The trend resumes and the stock trades over 20 points higher over thenext six days.
Fakeouts and False Moves 65
FIGURE 6.3
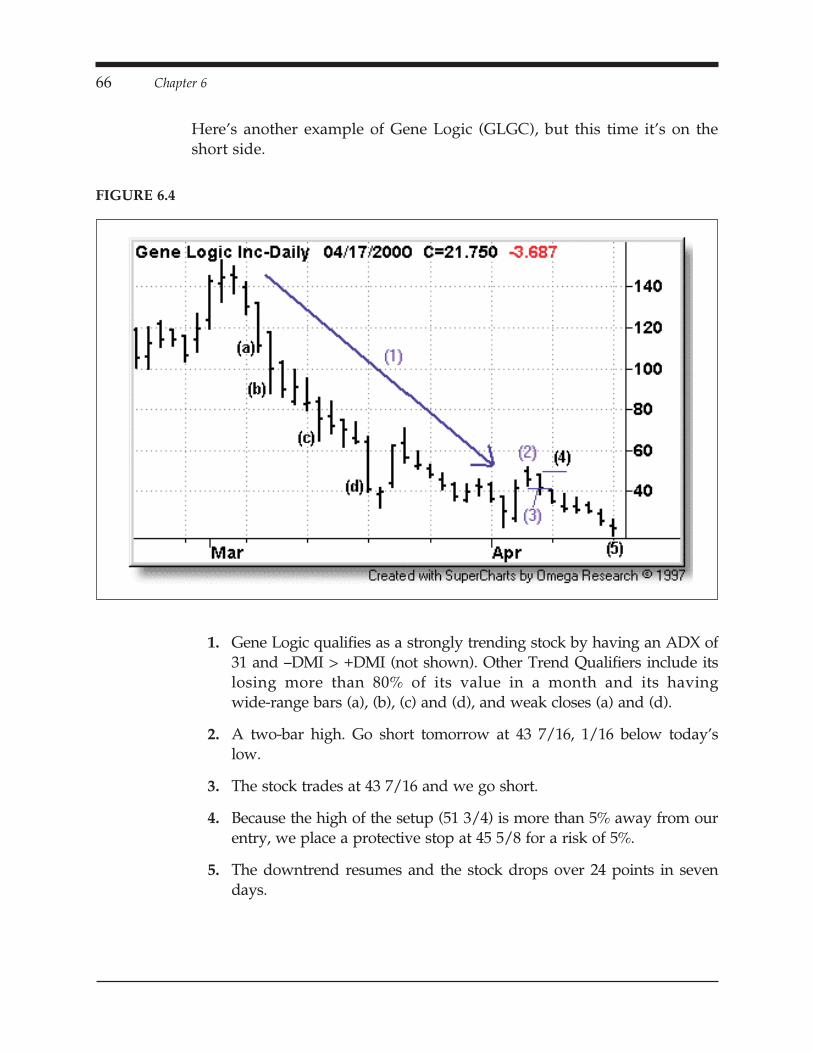
Here’s another example of Gene Logic (GLGC), but this time it’s on theshort side.
1. Gene Logic qualifies as a strongly trending stock by having an ADX of31 and –DMI > +DMI (not shown). Other Trend Qualifiers include itslosing more than 80% of its value in a month and its havingwide-range bars (a), (b), (c) and (d), and weak closes (a) and (d).
2. A two-bar high. Go short tomorrow at 43 7/16, 1/16 below today’slow.
3. The stock trades at 43 7/16 and we go short.
4. Because the high of the setup (51 3/4) is more than 5% away from ourentry, we place a protective stop at 45 5/8 for a risk of 5%.
5. The downtrend resumes and the stock drops over 24 points in sevendays.
66 Chapter 6
FIGURE 6.4

Q&AQ. How did you discover this pattern?
A. Many times, I would get stopped out of positions, only to watch infrustration as the trend resumed.
Q. Why not just re-enter when the trend resumed?
A. I now know that second entries, after being stopped out, are often thebest entries, but I didn’t always know that. Someone once said that aloss is not a loss as long as something is learned from it. I learnedTKOs from getting stopped out.
Q. So the loses were painful?
A. Yes. I found it aggravating that I sold stock or futures at a bargain tosomeone who was now making money. I would eventually “throw inthe towel” and jump back into the market, only to get knocked outone more time. I knew I had to come up with a better way to enterstrongly trending markets.
Q. The setup calls for “at least” a two-bar low. Does a three-bar low orgreater work better?
A. Yes, in general, the more players that are knocked out the better. Youare just less likely to get filled.
Fakeouts and False Moves 67

DOUBLE TOP KNOCKOUT (DT-KO)
Reversal patterns of markets in strong uptrends attract eager top pickers.These patterns also shake out the nervous longs. When the reversal failsto follow through, these players are trapped on the wrong side of themarket or knocked out.
The Double Top Knockout (DT-KO) seeks to take advantage of thesetraders’ predicament as the shorts scramble to cover their positions andthe longs that were shaken out are forced back in.
Here are the rules for the Double Top Knockout:
For Buys (Short Sales are reversed):
1. The market should be in a strong trend as defined by a com-puter-based indicator such as ADX >= 30 and +DMI > –DMI or as de-fined under Trend Qualifiers (Chapter 3).
2. The market must make a new two-month calendar high.
3. The market must make another new high no sooner than three tradingdays later. This is important as it allows the false double top to form.
68 Chapter 6

4. The market must then make (at least) a two-bar low. This actiondraws in eager shorts (or shakes out longs) on what appears to be aconfirmed double top. Buy tomorrow 1/16 above today’s high.
5. If filled, place a protective stop 1/16 below yesterday’s low. If this ismore than 5% of the stock’s value, risk no more than 5% of the stock’svalue.
Let’s look at four examples.
Fakeouts and False Moves 69
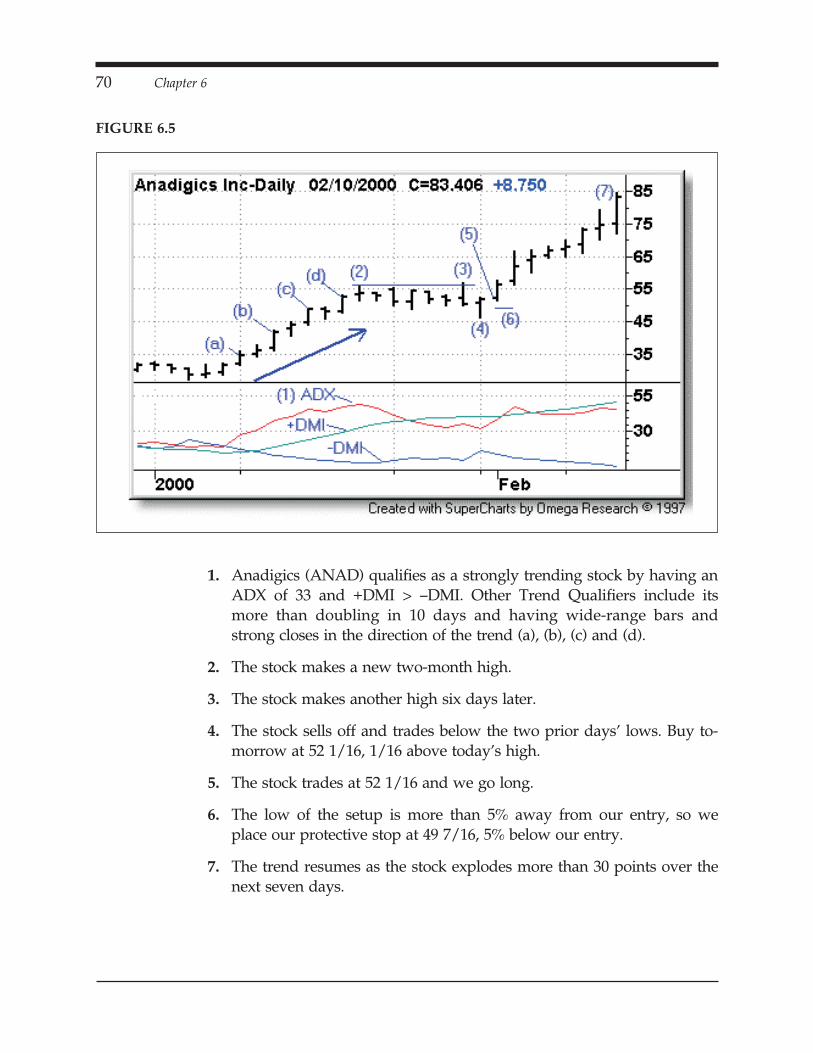
1. Anadigics (ANAD) qualifies as a strongly trending stock by having anADX of 33 and +DMI > –DMI. Other Trend Qualifiers include itsmore than doubling in 10 days and having wide-range bars andstrong closes in the direction of the trend (a), (b), (c) and (d).
2. The stock makes a new two-month high.
3. The stock makes another high six days later.
4. The stock sells off and trades below the two prior days’ lows. Buy to-morrow at 52 1/16, 1/16 above today’s high.
5. The stock trades at 52 1/16 and we go long.
6. The low of the setup is more than 5% away from our entry, so weplace our protective stop at 49 7/16, 5% below our entry.
7. The trend resumes as the stock explodes more than 30 points over thenext seven days.
70 Chapter 6
FIGURE 6.5

1. Plantronics (PLT) qualifies as being in a strong uptrend by having anADX of 34 and +DMI > –DMI (not shown). Other Trend Qualifiers in-clude its rallying nearly 70% in less than a month and a gap (a), itshaving wide-range bars (b), (c) and (d), and strong closes in the direc-tion of the trend (b) and (d).
2. PLT makes a new two-month high.
3. The stock makes another new high five days later.
4. A two-bar low. Go long tomorrow 1/16 above today’s high (44 1/16).
5. The stock trades at 44 1/16 and we go long.
6. Because the low of the setup is more than 5% away from our entry,we place a protective stop at 41 13/16 for a risk of 5%.
7. The stock trades over six points higher in two days.
Fakeouts and False Moves 71
FIGURE 6.6

Here’s a low ADX example.
1. Clarent Corp. (CLRN) has a low ADX reading of 18 (not shown), butqualifies as being in a strong trend by having rallied over 230% in lessthan a month.
2. The stock makes a new two-month high.
3. The stock makes another new high four days later.
4. The stock trades below the prior two lows. Go long tomorrow at 7413/16, 1/16 above today’s high.
5. The stock trades at 74 13/16 and we go long.
6. Because the low of the setup (68 7/16) is more than 5% away fromour entry, we place our protective stop at 71 1/16 for a risk of 5%.
7. The trend resumes as the stock rallies more than 22 points over thenext four days.
72 Chapter 6
FIGURE 6.7
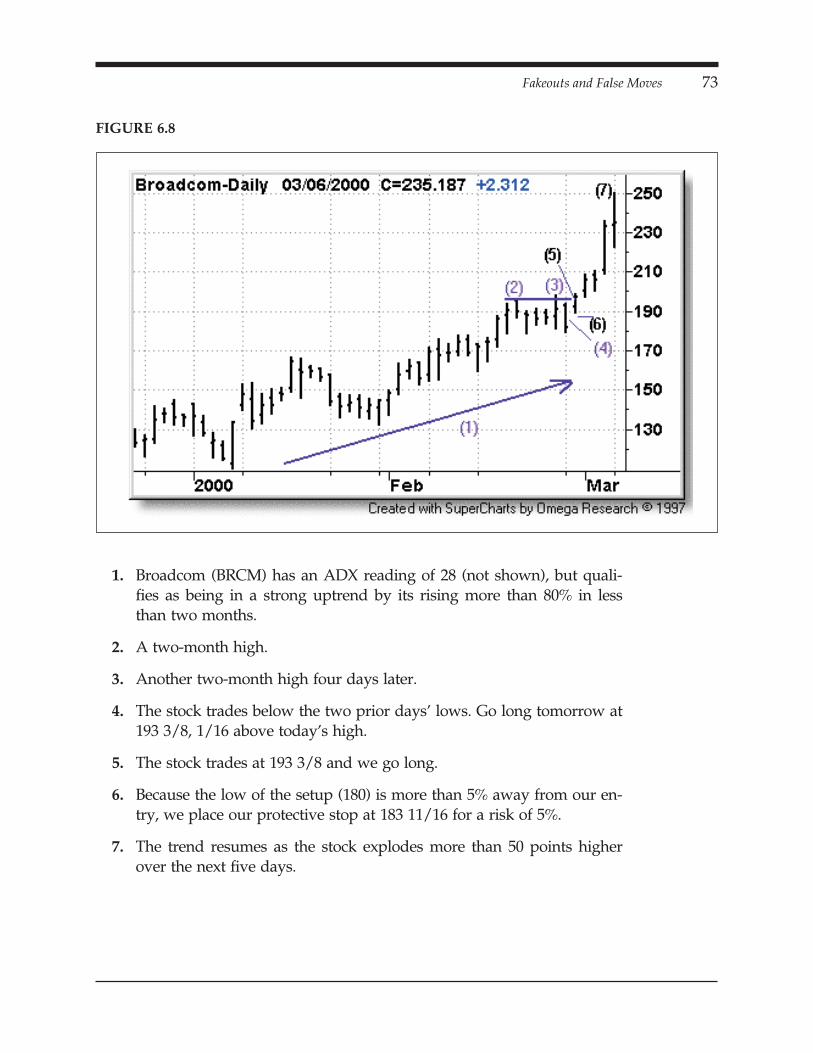
1. Broadcom (BRCM) has an ADX reading of 28 (not shown), but quali-fies as being in a strong uptrend by its rising more than 80% in lessthan two months.
2. A two-month high.
3. Another two-month high four days later.
4. The stock trades below the two prior days’ lows. Go long tomorrow at193 3/8, 1/16 above today’s high.
5. The stock trades at 193 3/8 and we go long.
6. Because the low of the setup (180) is more than 5% away from our en-try, we place our protective stop at 183 11/16 for a risk of 5%.
7. The trend resumes as the stock explodes more than 50 points higherover the next five days.
Fakeouts and False Moves 73
FIGURE 6.8
Q&AQ. How did you discover the DT-KO?
A. I know several very talented traders who are great at “putting theirface in the fire” (going against the trend). When they are right, thepayoff is substantial as they latch on to a major market turn. However,I noticed that more-often-than-not, they are quickly stopped out as thelonger-term underlying trend resumes. I saw this fakeout as an oppor-tunity.
Q. So you are basically taking the other side of their trades?
A. Yes and no. If the reversal is for real, my trade probably won’t be trig-gered. However, if the reversal is false, then yes, I’m buying as the re-versal players are getting stopped out.
Q. Why not play the double top and short the stock, then look to reverseyour position if stopped out (i.e., cover and go long)?
A. You could, but, again, I’d prefer going with the trend. Also, youwould have to be very disciplined and willing to switch from bearishto bullish very quickly. Psychologically, this may be tough for many.Further, there are execution costs and risks in doing all those trades.You could probably make such a “stop and reverse” strategy work infutures where there isn’t an uptick rule for shorting and the increasedleverage would help to cover the execution costs.
74 Chapter 6

TREND PIVOT (FALSE RALLY) PULLBACKS
Like the Trend Knockout, here’s another pattern born out of frustration.Often I would enter pullbacks and find myself quickly stopped out a fewdays before the market mounted a major move. This was difficult as Iwas “right,” but too early. It’s now obvious to me that the correctionwasn’t over and I should have been looking to re-enter the market as thetrend resumed.
Trend Pivot Pullbacks seek to identify pullbacks that have had this falserally. This rally draws in, and subsequently shakes out, the “fastmoney”—traders without staying power (money) and/or patience. Oncethese players are cleared out of the market, the stock often resumes itsuptrend.
Here are the rules for the Trend Pivot Pullback:
For Buys (Short Sales are reversed):
1. The market should be in a strong trend as defined by a com-puter-based indicator such as ADX >= 30 and +DMI > –DMI or as de-fined under Trend Qualifiers (Chapter 3).
2. The market must make a two-month calendar high.
3. The market must subsequently make at least one, but no more thanfive, lower highs.
Fakeouts and False Moves 75

4. The market must stage a one-day rally (a high greater than the priorday’s high) followed by a lower high. This is known as a pivot highand is illustrated below. Go long tomorrow or the next day 1/16above this pivot high.
5. If filled, place a protective stop 1/16 below the lowest bar in the setup.If this is more than 5% of the stock’s value, risk no more than 5% ofthe stock’s value.
76 Chapter 6

1. Cirrus Logic (CRUS) qualifies as being in a strong uptrend by havingan ADX of 49 and +DMI > –DMI (not shown). Other Trend Qualifiersinclude its nearly doubling in less than a month and havingwide-range bars and strong closes (a) and (b) in the direction of thetrend and a high-level base breakout (c).
2. The stock makes a new two-month high.
3. The stock begins rallying out of a pullback but fails, leaving a pivotpoint at 33 3/8. Go long tomorrow at 33 7/16, 1/16 above pivot high.
4. The stock trades at 33 7/16 and we go long.
5. Because the low of the setup (30 3/8) is more than 5% away from ourentry, we place a protective stop at 31 3/4 for a risk of 5%.
6. The trend resumes and the stock rallies nearly 20% in two days.
Fakeouts and False Moves 77
FIGURE 6.9

Here’s a low-ADX example.
1. Tektronix (TEK) has a fairly low ADX of 25 (not shown), but qualifiesas being in a strong trend by rising nearly 60% in less than a month.Other Trend Qualifiers include its having wide-range bars (a) and (b),a gap (c) and strong closes in the direction of the uptrend (a) and (b).
2. Tektronix makes a new two-month calendar high.
3. After three lower highs, the stock begins rallying out of a pullback,but fails on 6/29/2000 leaving a pivot point at 35 15/16 (the high ofthe previous day). Go long at 36, 1/16 above the pivot high, tomorrowor the next day.
4. The stock trades at 36 and we go long.
5. Place a protective stop at 34 5/8, 1/16 below the low of the formation.
6. The trend resumes as the stock trades more than 20% higher over thenext eight days.
78 Chapter 6
FIGURE 6.10

Here’s another low-ADX example.
1. Cell Therapeutics (CTIC) has a low ADX (17), but is in a strong uptrendbased on the fact that it has risen over 70% in just over two weeks.Other Trend Qualifiers include its having Daylight (a), positive slopeson the 10-period simple, 20-period exponential and 30-period expo-nential moving averages (b), proper order (10SMA>20EMA>30EMA)of its moving average (c) and its having a wide-range bar higher witha strong close (d).
2. The stock makes a new two-month high.
3. The stock has a one-day false rally, forming a pivot point at 23 1/4 (alower high the day before and lower high the day after). Go long to-morrow or the next day at 23 5/16, 1/16 above the pivot high.
4. The stock trades at 23 5/16 and we go long.
5. Because the low of the setup (21 1/2) is more than 5% away from ourentry, we place a protective stop at 22 1/8 for a risk of 5%.
6. The trend resumes as the stock trades more than 20% higher over thenext five days.
Fakeouts and False Moves 79
FIGURE 6.11

Here’s a low-ADX example on the short side.
1. Open Market (OMKT) has a low ADX of 22 (not shown), but is in anobvious downtrend by losing over half of its value in seven days.Other Trend Qualifiers include its having wide-range bars lower andpoor closes (a), (b) and (c).
2. The stock makes a new two-month low.
3. The stock forms a pivot point (a low surrounded by two higher lows).Go short tomorrow or the next day at 35 1/16, 1/16 below the pivotlow.
4. The stock opens at 34 1/2 and we go short.
5. Because the high of the setup is more than 5% away from our entry,we place a protective stop at 36 1/4 for a risk of 5%
6. The downtrend resumes as the stock implodes, losing over 50% of itsvalue over the next six days.
80 Chapter 6
FIGURE 6.12

Q&AQ. Should the pivot high be less than the two-month high (rule 1)?
A. Yes, otherwise it wouldn’t be a pullback.
Q. Don’t you give up some of the move by requiring the stock to tradeback above the pivot high?
A. Yes, but you also often avoid getting caught in a potential second falsemove.
Q. So when it trades above the pivot high, it helps confirm the rally?
A. Yes.
Q. What’s the difference between this pattern and the Simple Pullback(SP)?
A. The SP doesn’t require the one-day false rally. With the Simple Pull-backs, you actually enter the market on that false rally. Of course, atthat time, you don’t know that it’s going to turn out to be a false rally.
Q. So why not wait until a Trend Pivot Pullback is formed?
A. You could. It all depends on your trading style. However, you willmiss all of the stocks that don’t come back in. For me, it’s tough towatch all those stocks go by.
Fakeouts and False Moves 81

CHAPTER 7
BOW TIES3 3 3 3 3 3 3 3 3 3 3 3 3 3 3 3 3 3 3 3 3 3 3 3 3 3
Picking tops and bottoms can be costly since markets are prone tolong-term continuation moves and false reversals. On the other hand,blindly jumping on an established trend can also be costly since these mar-kets are prone to correct. Bow Ties avoid these pitfalls associated with trendtrading and top/bottom picking by waiting for the trend to turn based onmultiple moving averages followed by a countertrend correction.
In Chapter 3, Trend Qualifiers, we defined “proper order” for an uptrendas when the faster moving averages (shorter periods) were above theslower moving averages (longer periods). Conversely, for a downtrend,we defined proper order as when the faster moving averages were belowthe slower moving averages.
83

With Bow Ties, we are looking for these moving averages to switch fromdowntrend proper order to uptrend proper order over a period of threeto four days. This gives the moving averages the appearance of a bow tieas they all cross and spread out from one point. When the Bow Tieforms, it suggests that the market has made a major trend shift. How-ever, it’s still prone to correct. Therefore, Bow Ties seek to enter after aminor correction.
Here are the rules for Bow Ties.
For Buys (Short Sales are reversed):
Using a 10-period simple, 20-period exponential and a 30-period expo-nential moving average:
1. The moving averages should converge and spread out again, shiftingfrom proper downtrend order (10-SMA < 20-EMA < 30-EMA) toproper uptrend order (10-SMA > 20-EMA > 30-EMA). Ideally, thisshould happen over a period of three to four days. This creates the ap-pearance of a bow tie in the averages, as illustrated below.
84 Chapter 7

2. The market must make a lower low. That is, today’s low must be lessthan yesterday’s low.
3. Once qualifications for rule 2 have been met, place a buy order 1/16above today’s high good for tomorrow. Continue to work an orderabove today’s high good for the next trading day until filled or the mar-ket trades below its 20-period exponential moving average.
4. If filled, place a protective stop below the lowest bar in the setup. Ifthis is extreme, then place your stop no more than 5% away fromyour entry.
Let’s look at five examples.
Bow Ties 85

1. The moving averages on EMC converge and begin to spread out.
2. A lower low. Go long at 69 15/16, 1/16 above today’s high.
3. The stock trades at 69 15/16 and we go long.
4. Place a protective stop at 67 1/16, 1/16 below the low of the setup.
5. The trend resumes as the stock rallies nearly 13 points over the nextfour days.
86 Chapter 7
FIGURE 7.1

1. The moving averages converge on Lynx Therapeutics (LYNX) and be-gin to spread out—giving the appearance of a “bow tie.”
2. A lower low. Go long tomorrow at 32 3/16, 1/16 above today’s high.
3. The stock trades at 32 3/16 and we go long.
4. Because the low of the setup (29 1/4) is more than 5% away from ourentry, we place our protective stop at 30 9/16 for a risk of 5%.
5. The uptrend continues as the stock trades 40% higher over the nextfour days.
Bow Ties 87
FIGURE 7.2
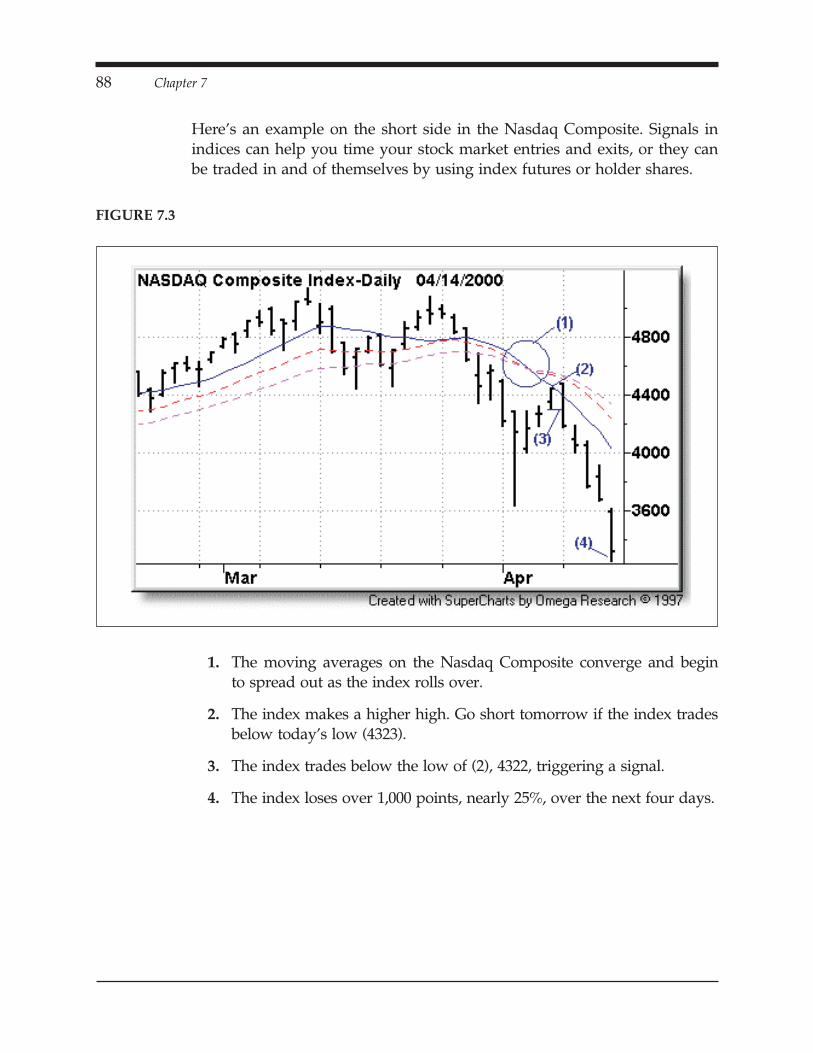
Here’s an example on the short side in the Nasdaq Composite. Signals inindices can help you time your stock market entries and exits, or they canbe traded in and of themselves by using index futures or holder shares.
1. The moving averages on the Nasdaq Composite converge and beginto spread out as the index rolls over.
2. The index makes a higher high. Go short tomorrow if the index tradesbelow today’s low (4323).
3. The index trades below the low of (2), 4322, triggering a signal.
4. The index loses over 1,000 points, nearly 25%, over the next four days.
88 Chapter 7
FIGURE 7.3

Here’s an example in the futures market.
1. On 7/12/2000, the moving averages on September Orange Juice con-verge and begin to spread out as the market rolls over from anuptrend to a downtrend.
2. The market trades above the prior-day high.
3. A signal is triggered as the market trades below the low of (2).
4. OJ drops over 3 points in two days.
Bow Ties 89
FIGURE 7.4
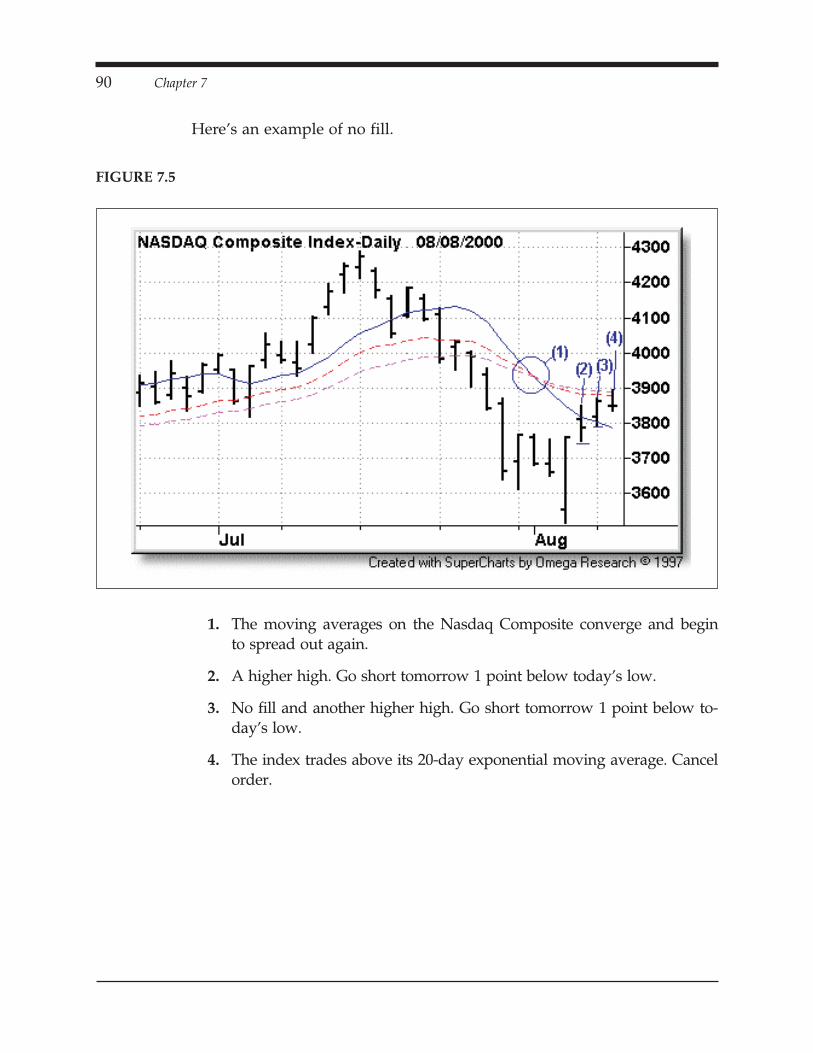
Here’s an example of no fill.
1. The moving averages on the Nasdaq Composite converge and beginto spread out again.
2. A higher high. Go short tomorrow 1 point below today’s low.
3. No fill and another higher high. Go short tomorrow 1 point below to-day’s low.
4. The index trades above its 20-day exponential moving average. Cancelorder.
90 Chapter 7
FIGURE 7.5
Q&AQ. Why use multiple moving averages?
A. When several moving averages converge at the middle of the Bow Tie,it suggests that the longer-term and shorter cycles are coming to-gether. Once they spread out again, it suggests a new trend is beingformed.
Q. So why not just buy the market as soon as it comes out of the conver-gence?
A. In spite of what many books on technical analysis will tell you, mov-ing-average crossovers do not work. I suppose, in their defense, manyof these books were written before everyone had a computer sitting onhis/her desk. Before computers, crossovers worked much better.
Q. Do you think they used to work better because it wasn’t so obvious?
A. Yes. Technology has helped to eradicate this edge.
Q. Back to Bow Ties, does the countertrend movement (rule #2, a lowerlow for buys and a higher high for short sales) help to eliminate falsestarts?
A. Exactly. You often avoid false moves by waiting for a countertrend byonly entering if the trend re-asserts itself. Conceptually, it’s no differ-ent than pullbacks. Essentially, you are looking for thrust/trend, cor-rection and then resumption of trend.
Q. Why cancel your entry order if the market trades back to the 20-dayEMA?
A. If a market comes all the way back to the 20-day EMA, it’s possiblethat what appeared to be a new trend is a false move. This doesn’tmean that the market isn’t worthy of trading. As you know, in tradingthere are no exacts. However, in any pattern, you should have a rulefor when you should step back and re-evaluate your analysis. Maybesome other pattern is forming, maybe not.
Q. But it’s okay for the market to trade back to the 10-day simple movingaverage?
A. I think it’s normal, and likely healthy, for a market to pull back to the10-day SMA.
Bow Ties 91
Q. You refer to the Bow Tie from downtrend to uptrend for longs andfrom uptrend to downtrend for shorts. Does the pattern work on mar-kets coming out of consolidations or bases?
A. Yes. I discovered the pattern while studying markets that had majorchanges in trend—from up to down or from down to up. The beautyis that you avoid top and bottom picking by waiting for a confirma-tion of this rollover. A “half bow tie,” if you will, emerges when theprice is coming out of bases/consolidations. These seem to work, but Iprefer the “rollover” pattern since the chance exists that there are play-ers still trapped on the wrong side of the market.
Q. The “trapped” players will add fuel to the rally or sell-off for short set-ups?
A. Yes.
92 Chapter 7

CHAPTER 8
MICRO PATTERNS3 3 3 3 3 3 3 3 3 3 3 3 3 3 3 3 3 3 3 3 3 3 3 3 3 3
HIGH-LEVEL MICRO DOUBLE BOTTOM
As its name implies, a double bottom is normally considered a bottomingpattern when a market in a downtrend bottoms, has a false rally and thenmakes a final bottom at or slightly above the previous bottom. However,sometimes a market is so strong that it’s able to make the formation as partof a continuation move. In other words, it sells off very little while formingthis pattern. This is known as a high-level double bottom and is shown inFigure 8.1.
93

Corrections such as the above normally take place over several weeks tomonths. Sometimes, however, stocks are so strong that they will correctover much shorter time frames—forming a “micro” pattern.
Although still a discretionary pattern in nature, the High-Level MicroDouble Bottom is more easily defined than its bigger picture counterpart.We define the pattern as two pivot lows that form at or near the samelevel. To review, a pivot low is formed when a stock makes a lower lowfollowed by a higher low. This leaves a low surrounded by two higherlows.
94 Chapter 8
FIGURE 8.1

Here are the rules for the High-Level Micro Double Bottom.
For Buys (Short sales are reversed):
1. The market should be in a strong trend as defined by a com-puter-based indicator such as ADX >= 30 and +DMI > –DMI or as de-fined under Trend Qualifiers (Chapter 3).
2. The stock must make at least a two-month high.
3. The stock must make a pivot low, that is, a low surrounded by twohigher lows.
4. The stock must make another pivot low at or near the first pivot low.
5. Go long 1/16 above the high of the right side of the pivot low formedin (4).
6. If filled, place a protective stop below the lowest bar in the setup. Ifthis is more than 5% of the stock’s value, risk no more than 5%.
Micro Patterns 95

1. Extreme Networks (EXTR) qualifies as being in a strong uptrend byhaving an ADX of 37 and +DMI > –DMI (not shown). Other TrendQualifiers include its more than doubling in less than a month and itshaving wide-range bars higher (a), (b) and strong closes (a), (c).
2. The stock makes a new two-month high.
3. The stock forms two pivot lows near the same price level. Go long to-morrow at 104 3/4, 1/16 above the high of the second pivot forma-tion.
4. The stock trades at 104 3/4 and we go long.
5. Because the low of the setup (90 5/8) is more than 5% away from ourentry, we place our protective stop at 99 1/2 for a risk of 5%.
6. The uptrend resumes as the stock trades more than 40% higher overthe next five days.
96 Chapter 8
FIGURE 8.2
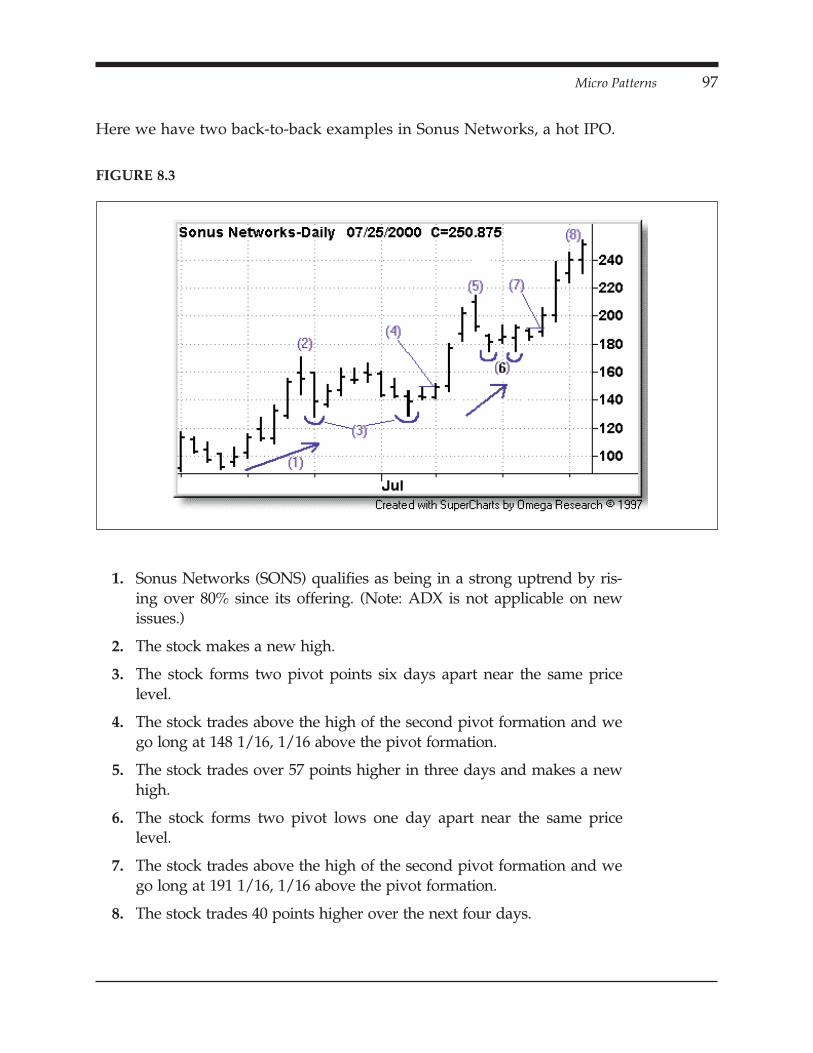
Here we have two back-to-back examples in Sonus Networks, a hot IPO.
1. Sonus Networks (SONS) qualifies as being in a strong uptrend by ris-ing over 80% since its offering. (Note: ADX is not applicable on newissues.)
2. The stock makes a new high.
3. The stock forms two pivot points six days apart near the same pricelevel.
4. The stock trades above the high of the second pivot formation and wego long at 148 1/16, 1/16 above the pivot formation.
5. The stock trades over 57 points higher in three days and makes a newhigh.
6. The stock forms two pivot lows one day apart near the same pricelevel.
7. The stock trades above the high of the second pivot formation and wego long at 191 1/16, 1/16 above the pivot formation.
8. The stock trades 40 points higher over the next four days.
Micro Patterns 97
FIGURE 8.3

Here we have an example in the Amex Biotech Index (BTK). Sector sig-nals can be used to help time entries in individual stocks within that sec-tor or can be traded in and of themselves through holder shares or sectoroptions.
1. The Amex Biotech Index has an ADX below 30 (29) (not shown), butqualifies as being in a strong uptrend by its rising over 70% in lessthan a month. Other Trend Qualifiers include its having wide-rangebars higher and strong closes.
2. The index makes a new two-month high.
3. The index forms two pivot lows three days apart near the same pricelevel.
4. The index trades above the high of the second pivot formation, signal-ing an entry.
5. The trend resumes as the index rises over 100 points in three days.
98 Chapter 8
FIGURE 8.4

Q&AQ. How did you begin noticing High-Level Micro Double Bottoms?
A. Pullbacks are my favorite patterns. Many times I’d notice that eventhough a stock didn’t follow through on a rally out of a pullback, itstill didn’t do anything wrong.
Q. Define “wrong.”
A. It would come back and test the level of the original pullback. I no-ticed that this became a level of strong support.
Micro Patterns 99
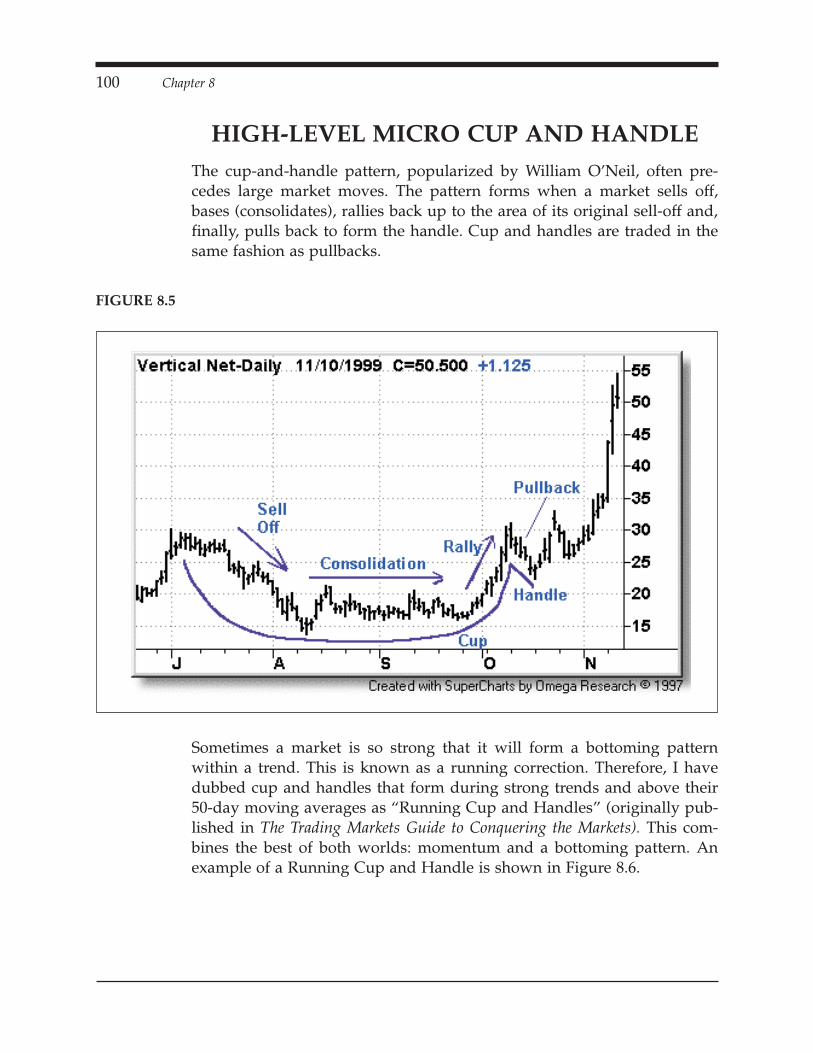
HIGH-LEVEL MICRO CUP AND HANDLEThe cup-and-handle pattern, popularized by William O’Neil, often pre-cedes large market moves. The pattern forms when a market sells off,bases (consolidates), rallies back up to the area of its original sell-off and,finally, pulls back to form the handle. Cup and handles are traded in thesame fashion as pullbacks.
Sometimes a market is so strong that it will form a bottoming patternwithin a trend. This is known as a running correction. Therefore, I havedubbed cup and handles that form during strong trends and above their50-day moving averages as “Running Cup and Handles” (originally pub-lished in The Trading Markets Guide to Conquering the Markets). This com-bines the best of both worlds: momentum and a bottoming pattern. Anexample of a Running Cup and Handle is shown in Figure 8.6.
100 Chapter 8
FIGURE 8.5

Taken one step further, stocks in extremely strong trends often form com-pressed or “micro” cup and handles. These occur over a period of daysas opposed to their bigger picture counterparts, which may take weeks tomonths to form.
Although discretionary in nature, the following rules and examplesshould help you be able to recognize the pattern.
1. The market should be in a strong trend as defined by a com-puter-based indicator such as ADX >= 30 and +DMI > –DMI or as de-fined under Trend Qualifiers (Chapter 3).
2. The market must make a two-month high.
Micro Patterns 101
FIGURE 8.6

3. The market should have a one- to four-day sell-off (a). This actionforms the left side of the cup.
4. The market must then trade sideways for one to four days (b). This ac-tion forms the bottom of the cup.
5. The market must then rally back up to at or near the original sell-off(c). This action forms the right side of the cup.
102 Chapter 8
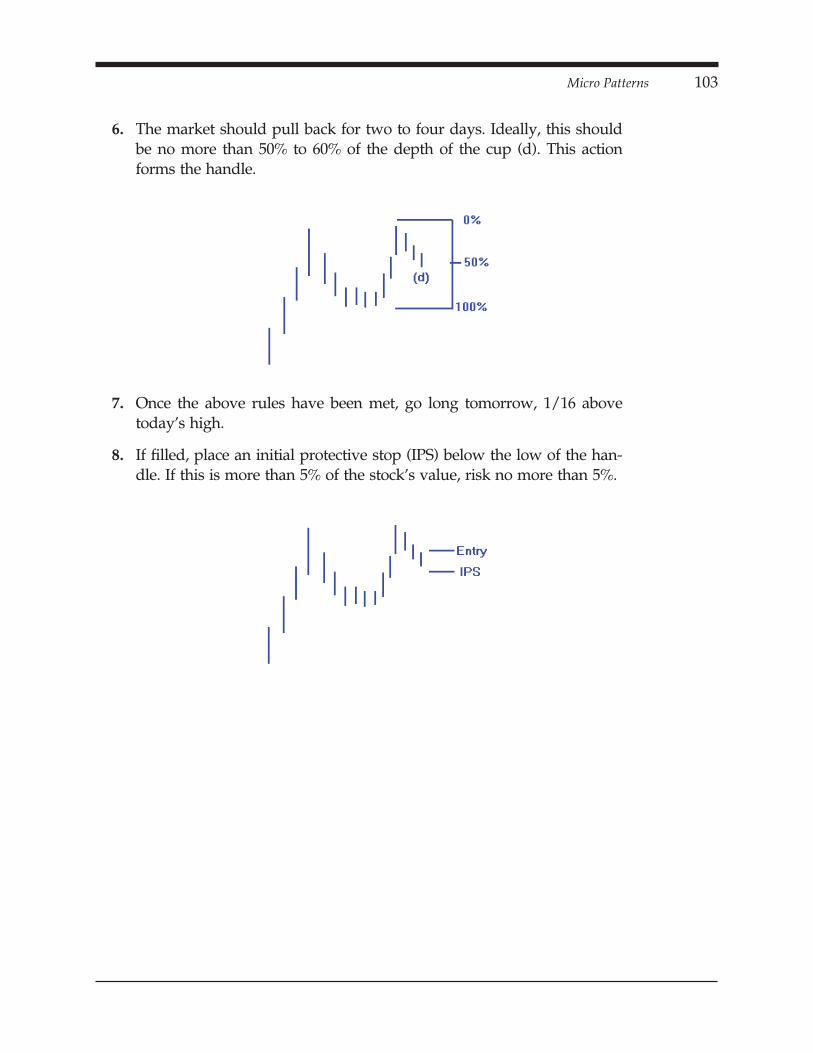
6. The market should pull back for two to four days. Ideally, this shouldbe no more than 50% to 60% of the depth of the cup (d). This actionforms the handle.
7. Once the above rules have been met, go long tomorrow, 1/16 abovetoday’s high.
8. If filled, place an initial protective stop (IPS) below the low of the han-dle. If this is more than 5% of the stock’s value, risk no more than 5%.
Micro Patterns 103
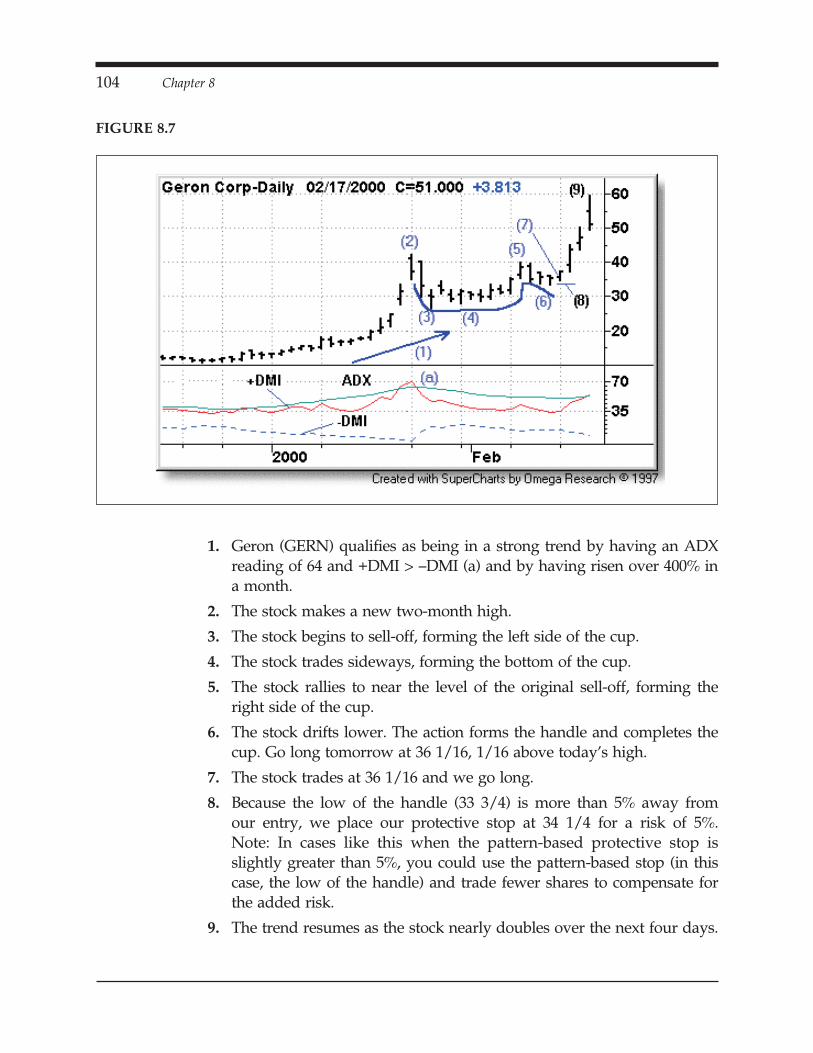
1. Geron (GERN) qualifies as being in a strong trend by having an ADXreading of 64 and +DMI > –DMI (a) and by having risen over 400% ina month.
2. The stock makes a new two-month high.
3. The stock begins to sell-off, forming the left side of the cup.
4. The stock trades sideways, forming the bottom of the cup.
5. The stock rallies to near the level of the original sell-off, forming theright side of the cup.
6. The stock drifts lower. The action forms the handle and completes thecup. Go long tomorrow at 36 1/16, 1/16 above today’s high.
7. The stock trades at 36 1/16 and we go long.
8. Because the low of the handle (33 3/4) is more than 5% away fromour entry, we place our protective stop at 34 1/4 for a risk of 5%.Note: In cases like this when the pattern-based protective stop isslightly greater than 5%, you could use the pattern-based stop (in thiscase, the low of the handle) and trade fewer shares to compensate forthe added risk.
9. The trend resumes as the stock nearly doubles over the next four days.
104 Chapter 8
FIGURE 8.7
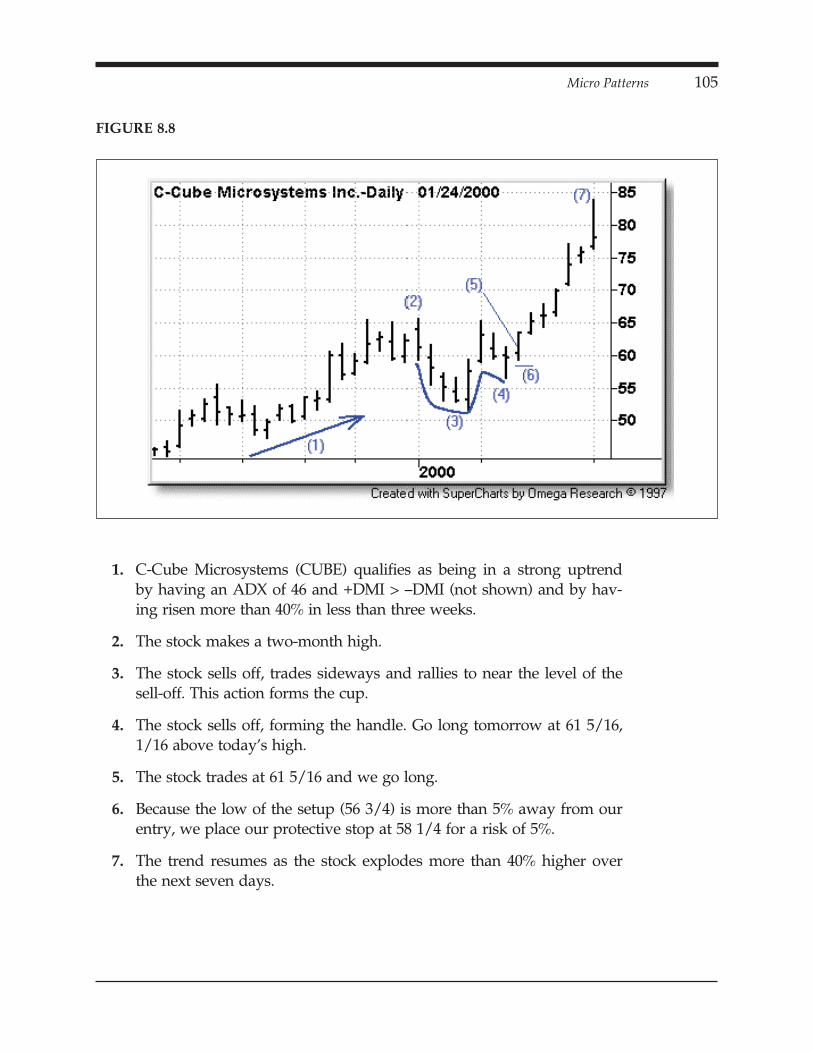
1. C-Cube Microsystems (CUBE) qualifies as being in a strong uptrendby having an ADX of 46 and +DMI > –DMI (not shown) and by hav-ing risen more than 40% in less than three weeks.
2. The stock makes a two-month high.
3. The stock sells off, trades sideways and rallies to near the level of thesell-off. This action forms the cup.
4. The stock sells off, forming the handle. Go long tomorrow at 61 5/16,1/16 above today’s high.
5. The stock trades at 61 5/16 and we go long.
6. Because the low of the setup (56 3/4) is more than 5% away from ourentry, we place our protective stop at 58 1/4 for a risk of 5%.
7. The trend resumes as the stock explodes more than 40% higher overthe next seven days.
Micro Patterns 105
FIGURE 8.8
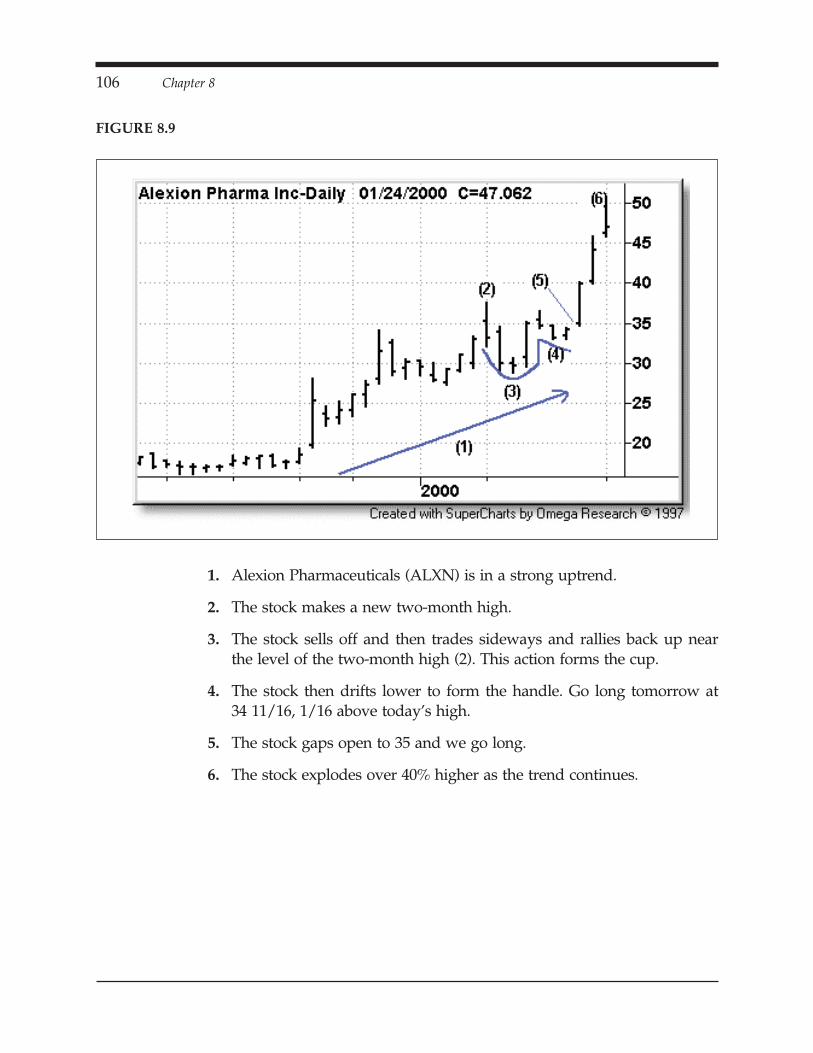
1. Alexion Pharmaceuticals (ALXN) is in a strong uptrend.
2. The stock makes a new two-month high.
3. The stock sells off and then trades sideways and rallies back up nearthe level of the two-month high (2). This action forms the cup.
4. The stock then drifts lower to form the handle. Go long tomorrow at34 11/16, 1/16 above today’s high.
5. The stock gaps open to 35 and we go long.
6. The stock explodes over 40% higher as the trend continues.
106 Chapter 8
FIGURE 8.9

1. Biotech Holdings (BBH) is in a strong uptrend.
2. The shares make a new two-month high.
3. The shares sell off, trade sideways and then rally back up near thelevel of the original sell-off. This action forms the cup.
4. The shares drift lower forming a handle. Go long tomorrow at 1797/16, 1/16 above today’s high.
5. The shares trade at 179 7/16 and we go long.
6. The trend resumes as the shares rally over 28 points in three days.
Micro Patterns 107
FIGURE 8.10

Q&AQ. The Micro Cup and Handle seems very discretionary. Any tips on
how to recognize them?
A. The best way to learn this pattern is to look at charts, lots of charts.After a while, you’ll find your eye drawn to the pattern.
Q. Any other tips?
A. Yes, look for other patterns that may also be setting up.
Q. Such as?
A. Double Top Knockouts that don’t trigger immediately often set up asMicro Cup and Handles. Also, sometimes pullbacks set up as MicroCup and Handles.
108 Chapter 8
SECTION THREE
VOLATILITY3 3 3 3 3 3 3 3 3 3 3 3 3 3 3 3 3 3 3 3 3 3 3 3 3 3 3 3 3 3 3
109

CHAPTER 9
FINDING EXPLOSIVEMOVES: AN ADVANCEDLESSON IN SWINGTRADING3 3 3 3 3 3 3 3 3 3 3 3 3 3 3 3 3 3 3 3 3 3 3 3 3 3
We predict that the use of historical volatility will beone of the growth areas for financial markets in the
late ’90s. Up until now, the use of historical volatilityhas been confined mostly to the options market, but
we have found it can be equally applied to thefutures and equity markets.
—Connors and Hayward,Investment Secrets of aHedge Fund Manager
As swing traders, our goal is to find markets that have the potential tomake large moves over a short time frame. One of the greatest tools that canhelp us accomplish this goal is the study of volatility. Although the conceptscan be a little overwhelming at first, I can assure you that they are wellworth your effort to learn them.
111
HISTORICAL VOLATILITYHistorical volatility (HV), also known as statistical volatility, is the stan-dard deviation of day-to-day price changes expressed as an annual per-centage. Its complete calculation can be found in the Appendix.However, don’t get too caught up in the details of the formula and haveyour computer do the work for you. Just know that it’s a measurementof how much a stock has fluctuated in the past and can be used as agauge for how much the stock will likely fluctuate in the future. For in-stance, suppose the 50-day HV on a $100 stock is 10%. Assuming a nor-mal distribution of stock prices and that volatility remains the same, thisstock has a 66% chance (one standard deviation) of trading between $90($100 less 10%) and $110 ($100 plus 10%) one year from now.
Again, don’t get too caught up in the math. The main thing you shouldknow about HV is that stocks with higher HV readings have fluctuatedmore in the past than stocks with lower HV readings. And further, thosestocks with higher HV readings will likely fluctuate more in the futurethan those stocks with lower HV readings. Therefore, as short-termtraders, we must focus on those stocks with higher HV readings as weare looking for an immediate move.
TRADING WHERE THE ACTION ISLarry Connors, a pioneer in volatility research for the stock and com-modity markets, has dubbed using HV to select stocks “Trading WhereThe Action Is.” In Connors On Advanced Trading he states: “As short-termtraders, we do not have the luxury of waiting for a market to move. Be-cause our profits tend to be small, we need to be trading those specificmarkets that provide us with the opportunity to maximize our profits ona daily basis.”
I fully agree with Larry. As an example of the potential for higher HVstocks, refer to Figure 9.1 of Geron Corp. The stock had a 50-day HVreading of 95% in late 1999. This suggested that the stock statistically hadthe potential (a 66% chance) to trade either 95% higher or 95% lowerover the next year. Notice that the stock skyrockets over the next fewmonths and trades nearly 700% higher. It then tops out and loses 80% ofits value in the following months. As you can see, stocks with higher HVreadings have the potential to make extraordinary moves. In fact, all ofthe examples used in this manual had a 50-day HV reading of at least40% and most had readings of 80% or higher.
112 Chapter 9
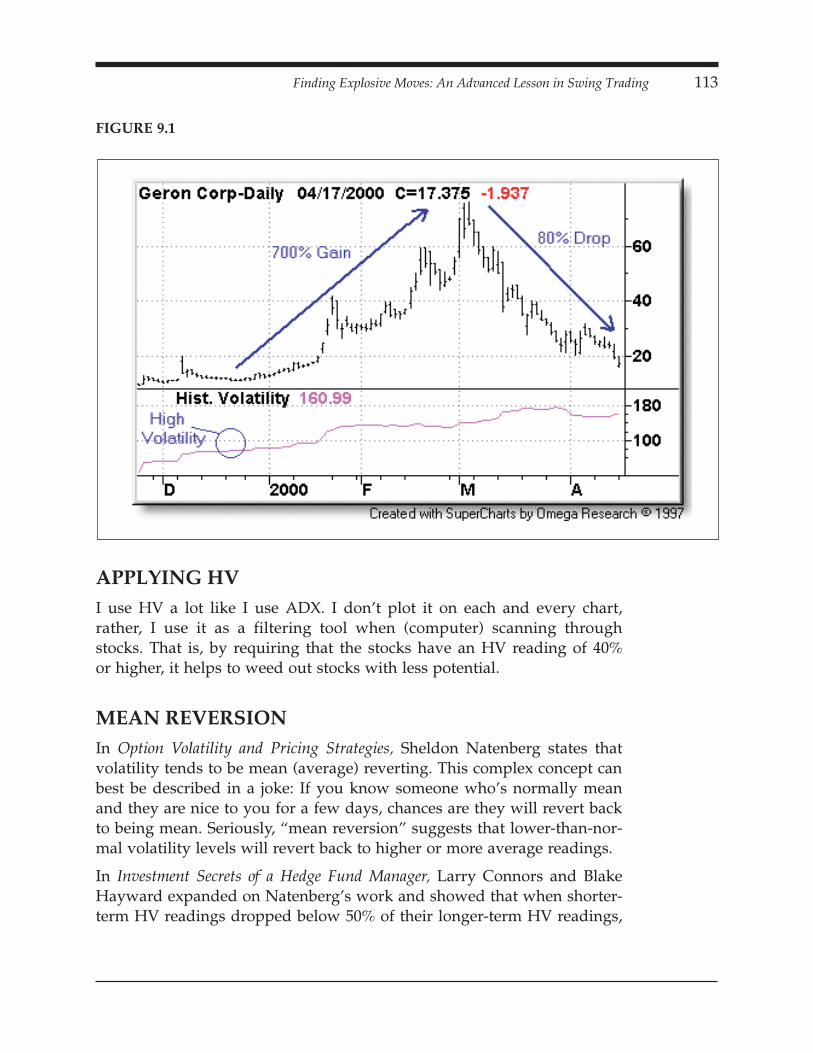
APPLYING HVI use HV a lot like I use ADX. I don’t plot it on each and every chart,rather, I use it as a filtering tool when (computer) scanning throughstocks. That is, by requiring that the stocks have an HV reading of 40%or higher, it helps to weed out stocks with less potential.
MEAN REVERSIONIn Option Volatility and Pricing Strategies, Sheldon Natenberg states thatvolatility tends to be mean (average) reverting. This complex concept canbest be described in a joke: If you know someone who’s normally meanand they are nice to you for a few days, chances are they will revert backto being mean. Seriously, “mean reversion” suggests that lower-than-nor-mal volatility levels will revert back to higher or more average readings.
In Investment Secrets of a Hedge Fund Manager, Larry Connors and BlakeHayward expanded on Natenberg’s work and showed that when shorter-term HV readings dropped below 50% of their longer-term HV readings,
Finding Explosive Moves: An Advanced Lesson in Swing Trading 113
FIGURE 9.1

a large market move was prone to ensue as volatility reverted back to itsmean.
As an example, referring to Figure 9.2, Analog Devices (ADI), notice thatthe six-day HV reading (33.39) dropped to less than half of the 100-dayHV reading (68.39) as the stock traded sideways. Referring to Figure 9.3,the stock explodes higher (a) as the short-term volatility reverts back tomore normal longer-term levels (b).
114 Chapter 9
FIGURE 9.2
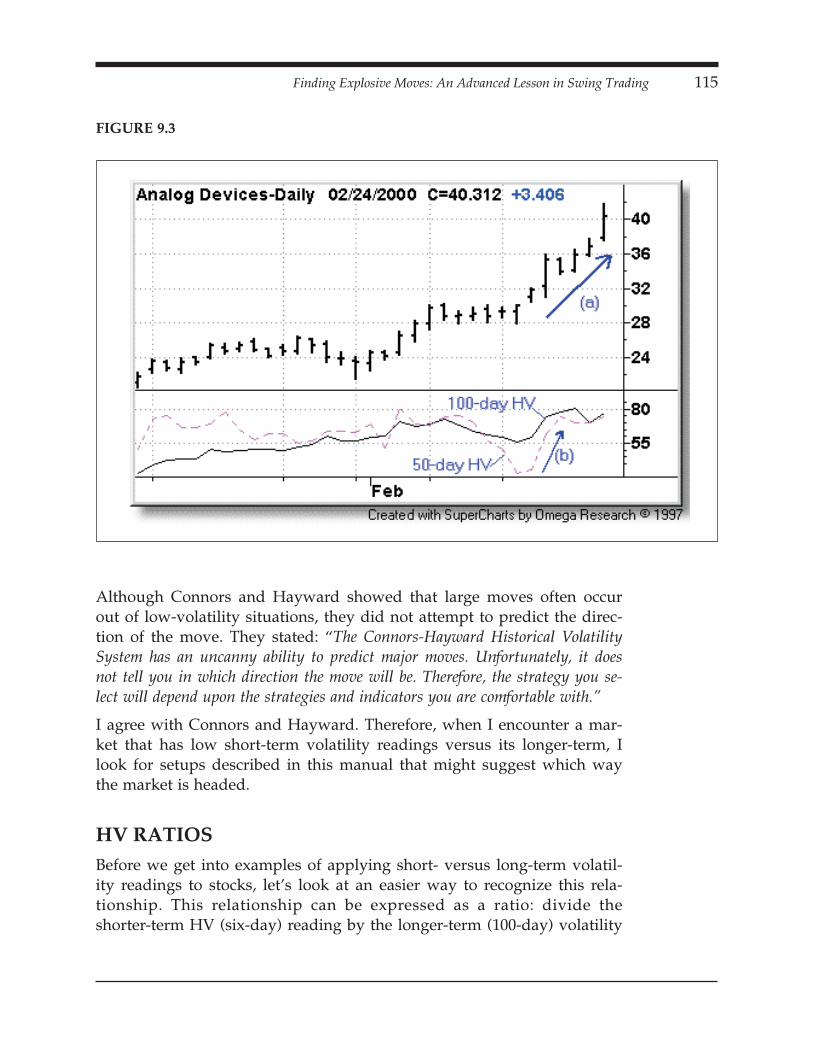
Although Connors and Hayward showed that large moves often occurout of low-volatility situations, they did not attempt to predict the direc-tion of the move. They stated: “The Connors-Hayward Historical VolatilitySystem has an uncanny ability to predict major moves. Unfortunately, it doesnot tell you in which direction the move will be. Therefore, the strategy you se-lect will depend upon the strategies and indicators you are comfortable with.”
I agree with Connors and Hayward. Therefore, when I encounter a mar-ket that has low short-term volatility readings versus its longer-term, Ilook for setups described in this manual that might suggest which waythe market is headed.
HV RATIOSBefore we get into examples of applying short- versus long-term volatil-ity readings to stocks, let’s look at an easier way to recognize this rela-tionship. This relationship can be expressed as a ratio: divide theshorter-term HV (six-day) reading by the longer-term (100-day) volatility
Finding Explosive Moves: An Advanced Lesson in Swing Trading 115
FIGURE 9.3

reading. When the ratio drops below 50%, we know that the market hasthe potential to make a large move as volatility reverts back to its mean.Figure 9.4 is the same stock described earlier except that the 100-day andsix-day HV readings have been replaced with the ratio of the six-day HVdivided by the 100-day HV. Notice that the ratio drops below 50% (a)right before the stock makes a large move (b).
Let’s look at some swing-trade setups that also had low 6/100 HV-ratioreadings.
116 Chapter 9
FIGURE 9.4

Here we have an example of a Trend Pivot Pullback with a low 6/100HV ratio.
1. Alpharma (ALO) has a 6-day HV/100-day HV reading below 50%.This suggests a large move is imminent since volatility is prone to re-vert back to its mean.
2. The stock sets up as a Trend Pivot Pullback (see Chapter 6 for details).
3. An entry is triggered on the Trend Pivot Pullback.
4. The stock explodes higher as volatility reverts back to its mean (a).
Finding Explosive Moves: An Advanced Lesson in Swing Trading 117
FIGURE 9.5

Here we have an example of a High-Level Micro Double Bottom withlow 6/100 HV readings.
1. I2 Technologies (ITWO) has a 6-day HV/100-day HV reading below50%. This suggests a large move is imminent since volatility is proneto revert back to its mean.
2. The stock sets up as a High-Level Micro Double Bottom (see Chapter8 for details).
3. An entry is triggered on the High-Level Micro Double Bottom.
4. The stock explodes higher as volatility reverts back to its mean (a).
118 Chapter 9
FIGURE 9.6

1. Sandisk (SNDK) has a 6-day HV/100-day HV reading below 50%.This suggests a large move is imminent since volatility is prone to re-vert back to its mean.
2. The stock sets up as a Double Top Knockout (see Chapter 6 for de-tails).
3. This is where discretion comes in. Although the Double Top Knockoutdidn’t trigger right after the setup (day one), the fact that the stockheld at high levels and began to rally, combined with a low-volatilitysituation, made the setup still worthy of considering. Therefore, whenthe stock trades above the entry of the DT-KO, we go long.
4. The stock explodes over 30 points higher as volatility reverts back toits mean (a).
Finding Explosive Moves: An Advanced Lesson in Swing Trading 119
FIGURE 9.7
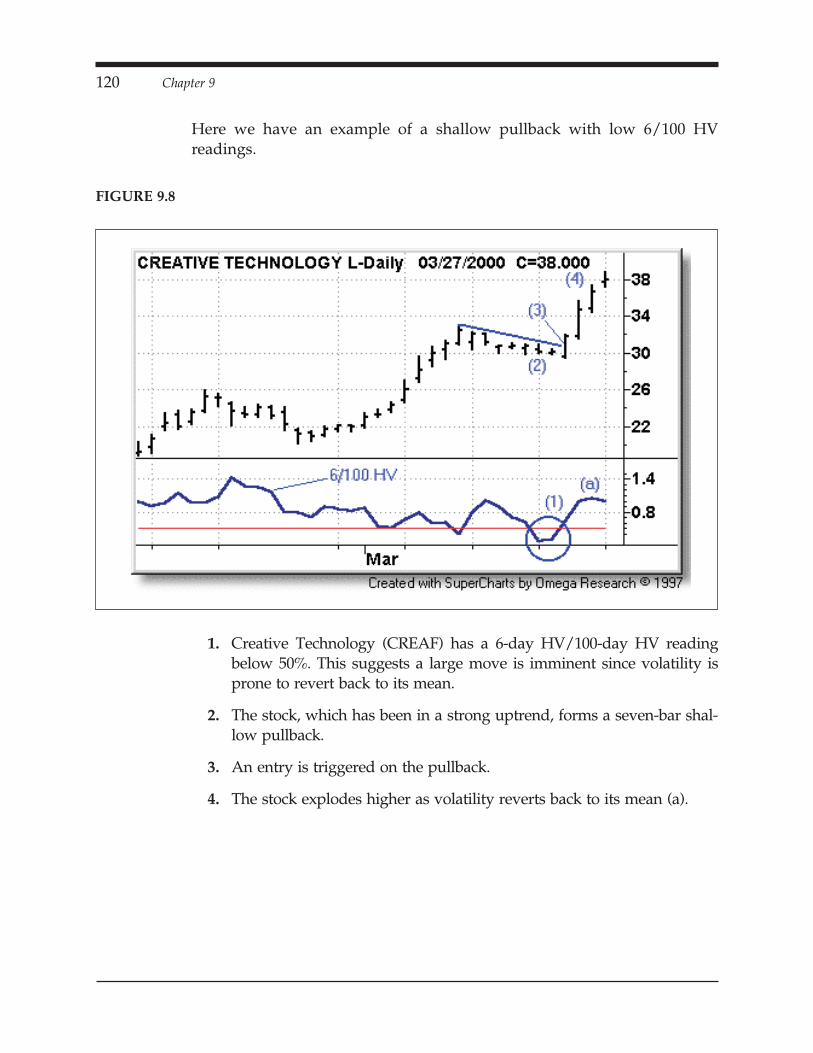
Here we have an example of a shallow pullback with low 6/100 HVreadings.
1. Creative Technology (CREAF) has a 6-day HV/100-day HV readingbelow 50%. This suggests a large move is imminent since volatility isprone to revert back to its mean.
2. The stock, which has been in a strong uptrend, forms a seven-bar shal-low pullback.
3. An entry is triggered on the pullback.
4. The stock explodes higher as volatility reverts back to its mean (a).
120 Chapter 9
FIGURE 9.8

Here’s another example of a shallow pullback with low 6/100 HV read-ings.
1. 3Com (COMS) is in a strong uptrend.
2. The 6/100 HV ratio drops below 50%. This suggests a large move isimminent since volatility is prone to revert back to its mean.
3. At the same time, the stock sets up as a shallow pullback.
4. The stock explodes nearly 20% higher in one day, as volatility revertsto its mean (a).
Finding Explosive Moves: An Advanced Lesson in Swing Trading 121
FIGURE 9.9

SECTION FOUR
MARKET TIMING3 3 3 3 3 3 3 3 3 3 3 3 3 3 3 3 3 3 3 3 3 3 3 3 3 3 3 3 3 3 3
123

CHAPTER 10
MARKET TIMING FORSWING TRADING3 3 3 3 3 3 3 3 3 3 3 3 3 3 3 3 3 3 3 3 3 3 3 3 3 3
A rising tide lifts all boats.
—old Wall Street adage
In this chapter, we will look at how to gauge the overall direction of themarket to help time swing trades. This involves discretionary analysis, sys-tem analysis and sector analysis.
DISCRETIONARY ANALYSISWhen analyzing the overall indices, I first look for any Trend Qualifiersthat might suggest an overall trend. These include how the market is trad-ing relative to its 10-SMA, 20-EMA and 30-EMA (Daylight, slope, properorder). I also look for setups and concepts described in this manual, suchas Trend Knockouts (TKOs), Simple Pullbacks (SP), etc. I check for theseon both the cash indices and in the futures market. As an example (Figure10.1), notice that in the sharp uptrend of the Nasdaq Composite from No-vember of 1999 through January of 2000 there were Trend Qualifiers in themoving averages such as positive slope and Daylight, and they were inproper uptrend order. Also notice that there were setups such as TrendKnockouts (TKOs) and Simple Pullbacks (SP) along the way.
125

On the short side (Figure 10.2), notice that in the downtrend from Marchthrough May 2000, there were Trend Qualifiers such as wide-range barsdown, moving averages with a negative slope and in proper order fordowntrends, and Daylight between the highs and the moving averages.Also notice there were setups such as Bow Ties, Simple Pullbacks (SP)and Outside-Day Pullbacks (OD).
126 Chapter 10
FIGURE 10.1

Continuing in my discretionary analysis, I also look at the 50-day simpleand 200-day simple moving averages. I pay attention to these moving av-erages because they are well-watched by large institutions. In general,and unless I have some sort of other timing signal, I focus mostly on thelong side when a market is trading above its 50-day and 200-day movingaverages and focus mostly on the short side when the market is tradingbelow its 50-day and 200-day moving averages. I also watch for a transi-tion—that is, if a market is trading above both the 50 and 200 and thendrops below the 50, I question whether or not a new downtrend is begin-ning or if it’s simply a pullback.
Market Timing for Swing Trading 127
FIGURE 10.2
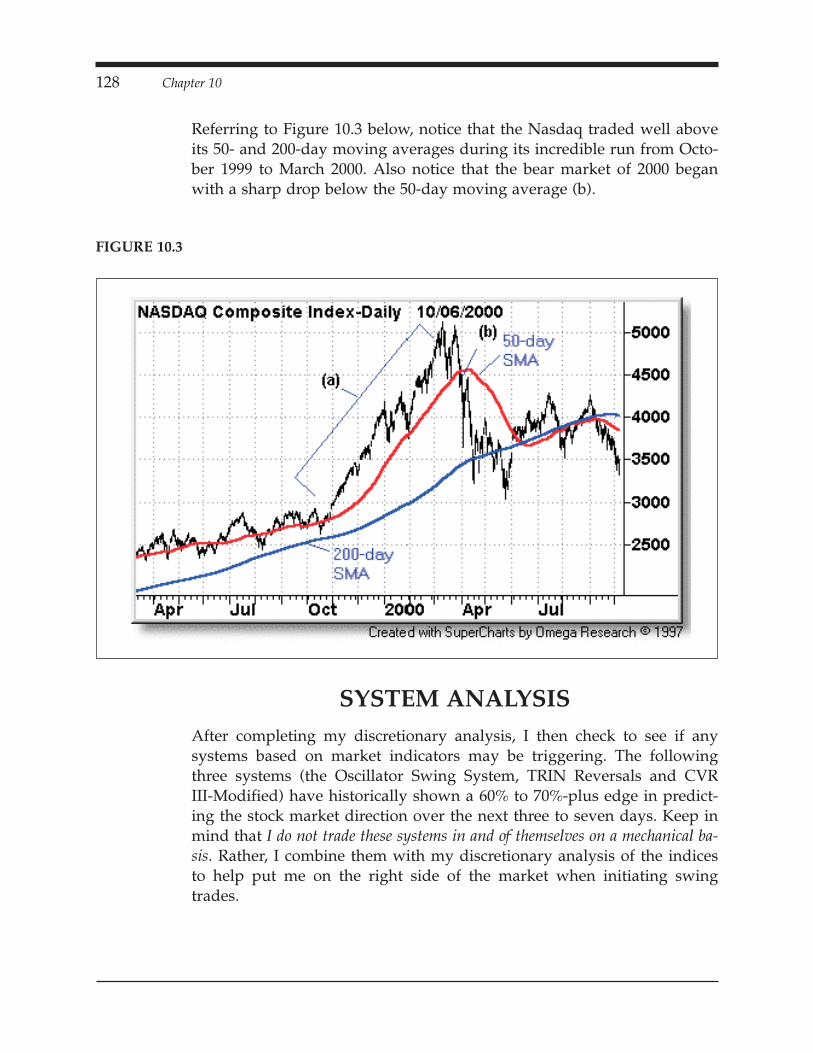
Referring to Figure 10.3 below, notice that the Nasdaq traded well aboveits 50- and 200-day moving averages during its incredible run from Octo-ber 1999 to March 2000. Also notice that the bear market of 2000 beganwith a sharp drop below the 50-day moving average (b).
SYSTEM ANALYSISAfter completing my discretionary analysis, I then check to see if anysystems based on market indicators may be triggering. The followingthree systems (the Oscillator Swing System, TRIN Reversals and CVRIII-Modified) have historically shown a 60% to 70%-plus edge in predict-ing the stock market direction over the next three to seven days. Keep inmind that I do not trade these systems in and of themselves on a mechanical ba-sis. Rather, I combine them with my discretionary analysis of the indicesto help put me on the right side of the market when initiating swingtrades.
128 Chapter 10
FIGURE 10.3

OSCILLATOR SWING SYSTEMThe Oscillator Swing System (OSS) seeks to identify when the overallmarket is oversold (overbought) and seeks to go long (short) when themarket has an intraday reversal. The system uses the 3-10 oscillator. Thisoscillator, popularized by Linda Raschke, co-author of Street Smarts, issimply a three-period simple moving average minus a 10-period movingaverage.
I define an “overbought” market as when the oscillator has gone up forfive days in a row. Conversely, an “oversold” market is when the oscilla-tor has gone down for five days in a row. I then look for an open-to-closereversal. That is, if the market is oversold, I look to see if the market canreverse intraday and close above its open. Finally, like all patterns in thisbook, I avoid taking trades against the trend. Therefore, if the market is inan uptrend, as defined by having an ADX reading of 30 or higher and+DMI > -DMI, shorts are not taken. Conversely, if the market is in adowntrend, as defined by having an ADX reading of 30 or higher andthe –DMI > +DMI, then longs are not taken.
Here are the rules for the Oscillator Swing System:
For Buys
1. The market must not be in a downtrend, as defined by an ADX >= 30and –DMI > +DMI.
2. The 3-10 oscillator must have at least five consecutive down days.
3. If the market closes above the open, go long on the close.
4. Exit on the close three to seven days later.
For Short Sales
1. The market must not be in an uptrend as defined by an ADX >= 30and +DMI > –DMI.
2. The 3-10 oscillator must have at least five consecutive up days.
3. If the market closes below the open, go short on the close.
4. Exit on the close three to seven days later.
Let’s look at an example before we review the results.
Market Timing for Swing Trading 129

The ADX (not shown) in the June S&P futures is below 30, which sug-gests this market is not in a trend.
1. The 3-10 oscillator of the September S&P futures rises for five consecu-tive days.
2. The contract closes below its open. Go short on the close.
3. Five consecutive days down in the 3-10 oscillator.
4. The market closes above the open. Go long on the close.
5. Five consecutive days up in the 3-10 oscillator.
6. The market closes below its open. Go short on close. Exit seven dayslater.
7. Five consecutive days down (ten total) in the 3-10 oscillator.
8. The contract closes above its open. Go long on the close. Exit sevendays later.
130 Chapter 10
FIGURE 10.4

Here are the results over the past ten years using a continuous S&P fu-tures contract ($250 per point) and exiting on the seventh day. No stopsor money management were used.
Notice that the short-side performance is much less than the long side.This reflects the longer-term bull market. Should we go into a prolongeddowntrend, these numbers would likely reverse.
Market Timing for Swing Trading 131
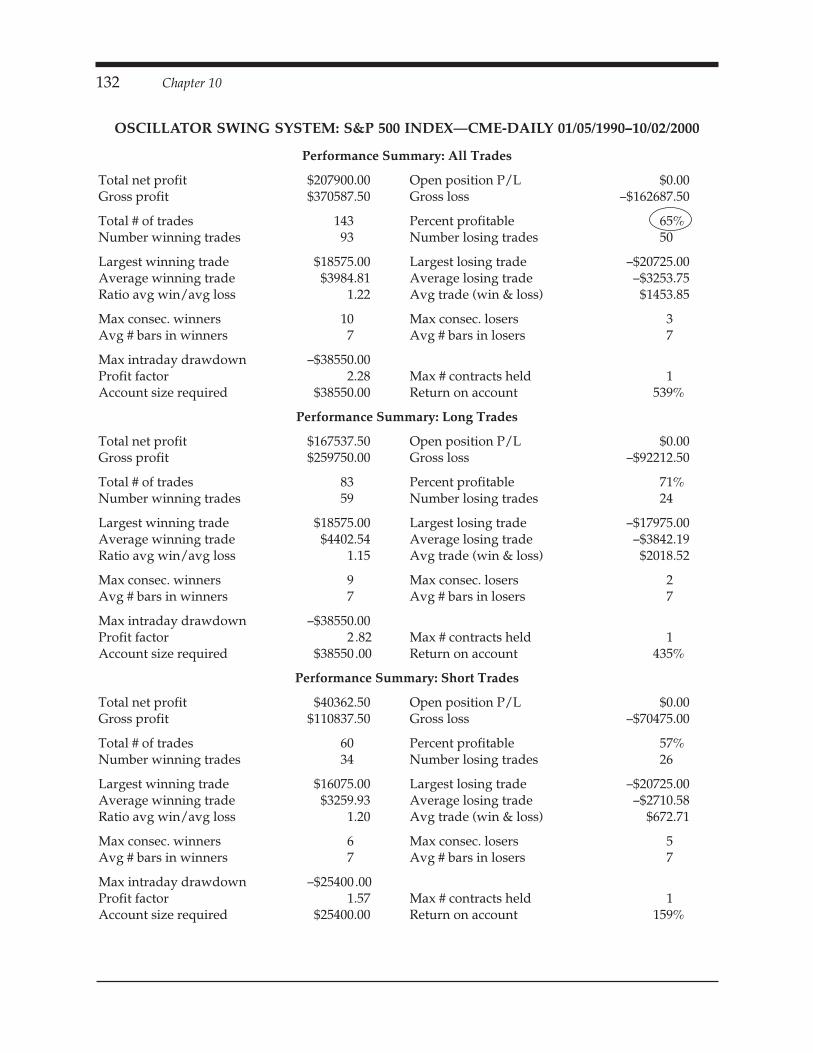
132 Chapter 10
OSCILLATOR SWING SYSTEM: S&P 500 INDEX—CME-DAILY 01/05/1990–10/02/2000
Performance Summary: All Trades
Total net profit $207900.00 Open position P/L $0.00Gross profit $370587.50 Gross loss –$162687.50
Total # of trades 143 Percent profitable 65%Number winning trades 93 Number losing trades 50
Largest winning trade $18575.00 Largest losing trade –$20725.00Average winning trade $3984.81 Average losing trade –$3253.75Ratio avg win/avg loss 1.22 Avg trade (win & loss) $1453.85
Max consec. winners 10 Max consec. losers 3Avg # bars in winners 7 Avg # bars in losers 7
Max intraday drawdown –$38550.00Profit factor 2.28 Max # contracts held 1Account size required $38550.00 Return on account 539%
Performance Summary: Long Trades
Total net profit $167537.50 Open position P/L $0.00Gross profit $259750.00 Gross loss –$92212.50
Total # of trades 83 Percent profitable 71%Number winning trades 59 Number losing trades 24
Largest winning trade $18575.00 Largest losing trade –$17975.00Average winning trade $4402.54 Average losing trade –$3842.19Ratio avg win/avg loss 1.15 Avg trade (win & loss) $2018.52
Max consec. winners 9 Max consec. losers 2Avg # bars in winners 7 Avg # bars in losers 7
Max intraday drawdown –$38550.00Profit factor 2.82 Max # contracts held 1Account size required $38550.00 Return on account 435%
Performance Summary: Short Trades
Total net profit $40362.50 Open position P/L $0.00Gross profit $110837.50 Gross loss –$70475.00
Total # of trades 60 Percent profitable 57%Number winning trades 34 Number losing trades 26
Largest winning trade $16075.00 Largest losing trade –$20725.00Average winning trade $3259.93 Average losing trade –$2710.58Ratio avg win/avg loss 1.20 Avg trade (win & loss) $672.71
Max consec. winners 6 Max consec. losers 5Avg # bars in winners 7 Avg # bars in losers 7
Max intraday drawdown –$25400.00Profit factor 1.57 Max # contracts held 1Account size required $25400.00 Return on account 159%
TRIN REVERSALS
In Connors On Advanced Trading, Larry Connors published his TRIN Thrustsstrategy. This strategy seeks to go long when the NYSE TRIN indicator has aone-day thrust lower of 30% (or more) and seeks to go short when the TRINhas a one-day thrust of 30% or more higher. I found this system useful, es-pecially when combined with other market indicators. However, in and ofitself, I found the system generated too many signals for use in swing trad-ing. Therefore, I decided to take the research one step further to find aTRIN-based system that would generate fewer signals and an edge gearedmore towards the swing trader—that is, one that would predict market di-rection over three to seven days. Larry originally published my research inthe October 1998 issue of his Professional Traders Journal. Special thanks toLarry for allowing me to republish the system.
To those not familiar with the TRIN indicator, it was developed by Rich-ard Arms in 1967 and was originally called the Arm’s Index. The indica-tor is calculated by taking the ratio of Advancing Issues to Decliningissues and dividing that by the ratio of Advancing Volume to DecliningVolume. This formula is illustrated below.
Advancing Issues /Declining IssuesAdvancing Volume /Declining Volume
If more volume is associated with advancing stocks than decliningstocks, the TRIN will be less than 1.00. Conversely, if more volume is as-sociated with declining stocks rather than advancing stocks, the TRINwill be greater than 1.00. Common Wall Street wisdom states that a TRINreading above 1.00 suggests a market is oversold and due for a bounce,and that a reading below 1.00 suggests a market is overbought and dueto sell off. Be warned though, little money, if any, can be made by follow-ing “common Wall Street wisdom.”
Rather than look for absolute levels of the average TRIN, I define anoverbought market as when the three-day average of the TRIN is hitting20- to 30-period lows, and an oversold market as when the three-day av-erage of the TRIN is hitting 20- to 30-period highs. As you likely know,just because a market is oversold doesn’t mean it can’t go lower. And,just because a market is overbought, doesn’t mean it can’t go higher.Therefore, once the three-day average of the TRIN is at one of these ex-tremes, I then wait for the moving average of the TRIN to turn. This sug-
Market Timing for Swing Trading 133
gests that a major reversal has begun to take place from a marketextreme.
Here are the rules for TRIN reversals:
For Buys:
1. The three-day simple moving average of the NYSE TRIN must makeat least a 30-period high (shorter periods, say 20-period highs, willgenerate more but less-accurate signals).
2. If today’s three-day moving average of the TRIN is less than yester-day’s (a “flip down” in the moving average), then buy the market onthe close.
3. Exit three to seven days later.
For Short Sales:
1. The three-day simple moving average of the NYSE TRIN must makeat least a 30-period low (shorter periods, say a 20-period low, will gen-erate more but less-accurate signals).
2. If today’s three-day moving average of the TRIN is greater than yes-terday’s (a “flip up” in the moving average), then sell short the marketon the close.
3. Exit (on the close) three to seven days later.
Let’s look at an example before reviewing the results.
134 Chapter 10

Here we have several back-to-back examples using the system to timethe December 1999 S&P index futures.
1. On 08/30/1999, the three-period moving average of the NYSE TRINindicator makes a 30-period high. On 08/31/1999, the moving averageturns down (today’s average is less than yesterday’s).
2. Buy the market on the close.
3. Exit on the close seven days later.
4. On 10/06/1999, the three-period moving average of the TRIN makes a30-period low. On 10/07/1999, the moving average turns up.
5. Sell short the contract on the close.
6. Exit seven days later.
7. The same day, 10/15/1999, the TRIN average turns down after hittinga 30-period high, signaling a buy signal.
8. Exit seven days later.
Market Timing for Swing Trading 135
FIGURE 10.5
Here are the results using a continuous S&P futures contract ($250 perpoint) over the last ten years. Exits were a fixed exit on the close of theseventh day. No stops or money management were used.
Notice that the system historically has had a better than 70% accuracyrate on the long side and also shows some promise on the short side bybeing historically 58% accurate. These numbers reflect the longer-termbull market and would likely reverse when we encounter a prolongedbear market.
136 Chapter 10

Market Timing for Swing Trading 137
TRIN REVERSALS S&P 500 INDEX—CME-DAILY 01/02/1990–10/02/2000
Performance Summary: All Trades
Total net profit $201850.00 Open position P/L $0.00Gross profit $358387.50 Gross loss –$156537.50
Total # of trades 135 Percent profitable 65%Number winning trades 88 Number losing trades 47
Largest winning trade $35125.00 Largest losing trade –$13100.00Average winning trade $4072.59 Average losing trade –$3330.59Ratio avg win/avg loss 1.22 Avg trade (win & loss) $1495.19
Max consec. winners 9 Max consec. losers 4Avg # bars in winners 7 Avg # bars in losers 7
Max intraday drawdown –$23975.00Profit factor 2.29 Max # contracts held 1Account size required $23975.00 Return on account 842%
Performance Summary: Long Trades
Total net profit $137712.50 Open position P/L $0.00Gross profit $200475.00 Gross loss –$62762.50
Total # of trades 73 Percent profitable 71%Number winning trades 52 Number losing trades 21
Largest winning trade $16375.00 Largest losing trade –$7900.00Average winning trade $3855.29 Average losing trade –$2988.69Ratio avg win/avg loss 1.29 Avg trade (win & loss) $1886.47
Max consec. winners 6 Max consec. losers 2Avg # bars in winners 7 Avg # bars in losers 7
Max intraday drawdown –$17675.00Profit factor 3.19 Max # contracts held 1Account size required $17675.00 Return on account 779%
Performance Summary: Short Trades
Total net profit $64137.50 Open position P/L –$0.00Gross profit $157912.50 Gross loss –$93775.00
Total # of trades 62 Percent profitable 58%Number winning trades 36 Number losing trades 26
Largest winning trade $35125.00 Largest losing trade –$13100.00Average winning trade $4386.46 Average losing trade –$3606.73Ratio avg win/avg loss 1.22 Avg trade (win & loss) $1034.48
Max consec. winners 7 Max consec. losers 4Avg # bars in winners 6 Avg # bars in losers 7
Max intraday drawdown –$32800.00Profit factor 1.68 Max # contracts held 1Account size required $32800.00 Return on account 196%

CVR III—MODIFIED
The Chicago Board Options Exchange Volatility Index (VIX) measures theimplied volatility (a measurement of cost) of the short-term (30 days)at-the-money OEX options. Market sell-offs are normally associated withhigh VIX readings since panic drives the cost of these options higher. Con-versely, during a gradual rising market, the VIX tends to drop as traders be-come complacent toward the market and option prices fall. Therefore, theVIX, in a sense, is a measurement of fear in the market. High readings (sug-gesting panic) normally occur near market bottoms, and low readings (sug-gesting compliancy) normally occur near market tops. This makes the VIX agreat contrary indicator.
Larry Connors, CEO of TradingMarkets.com, has done extensive researchon using the VIX to predict short-term stock market moves. His ConnorsVIX Reversal (CVR) systems are based on the fact that volatility is mean(average) reverting. In other words, periods of higher-than-normal vola-tility are normally followed by lower or more average volatility. Con-versely, periods of lower-than-normal volatility are normally followed byhigher or more average periods of volatility. His CVR systems essentiallylook to position when the VIX reaches an extreme and begins to reverse.
In 1997, while conducting research for Connors On Advanced Trading,Larry and I discovered that once the VIX was 10% or more away from itsmoving average, the stock market had a nearly 70% chance of reversingover the next three to seven days as the VIX returned to more averagelevels. Based on this research, we co-created the Connors VIX Reversal III(CVR III).
I’ve taken this research one step further and require that the VIX not onlybe at least 10% away from its moving average but must also reverseintraday. This suggests that the market is not only at an extreme but alsohas begun to reverse from that extreme. This “intraday reversal” is sim-ply defined as the VIX closing below its open (suggesting volatility hasbegun to implode) for buys or for short sales, the VIX must close aboveits open (suggesting volatility has begun to increase).
Here are the rules for CVR III-Modified:
138 Chapter 10

For Buys
1. Today, the low of the VIX must be above its 10-day moving average.
2. Today, the VIX must close at least 10% above its 10-day moving aver-age.
3. Today, the VIX must close below its open.
4. Once rules 1 through 3 have been met, buy the market on the close.
5. Exit (on the close) the day the VIX trades (intraday) below yesterday’s10-day moving average (reversion to the mean).
For Short Sales
1. Today, the high of the VIX must be below its 10-day moving average.
2. Today, the VIX must close at least 10% below its 10-day moving aver-age.
3. Today, the VIX must close above its open.
4. Once rules 1 through 3 have been met, sell short the market on theclose.
5. Exit (on the close) the day the VIX trades (intraday) above yesterday’s10-day moving average (reversion to the mean).
Let’s look at an example before reviewing the results.
Market Timing for Swing Trading 139

1. The low of the CBOE Volatility Index (VIX) is greater than its 10-daymoving average.
2. The VIX closes below its open and its close is more than 10% above its10-day moving average. This suggests the VIX has reached an extremehigh and has begun to reverse.
3. Buy the market on the close.
4. The VIX trades back below its moving average suggesting that volatil-ity has dropped to more normal levels.
5. Exit the market on the close.
6. The high of the VIX is below its 10-day moving average.
7. The VIX closes above its open and its close is more than 10% below its10-day moving average. This suggests the VIX has reached an extremelow and has begun to reverse.
8. Go short on the close.
140 Chapter 10
FIGURE 10.6

9. The VIX trades back to its 10-day moving average, suggesting thatvolatility has risen to more normal levels.
10. Exit the market on the close.
Here are the results over the last seven years using a continuous S&P fu-tures contract ($250 per point). No stops or money management wereused. Historically, the system has shown that the market has a 76%chance of reversing over the next three days. Like virtually all mechani-cal systems over the past few years, the results on the long side (84% cor-rect) are much greater than those on the short side (56% correct). Again,this reflects the bull market of the 1990s. This will likely reverse when weencounter a longer-term bear market.
Market Timing for Swing Trading 141
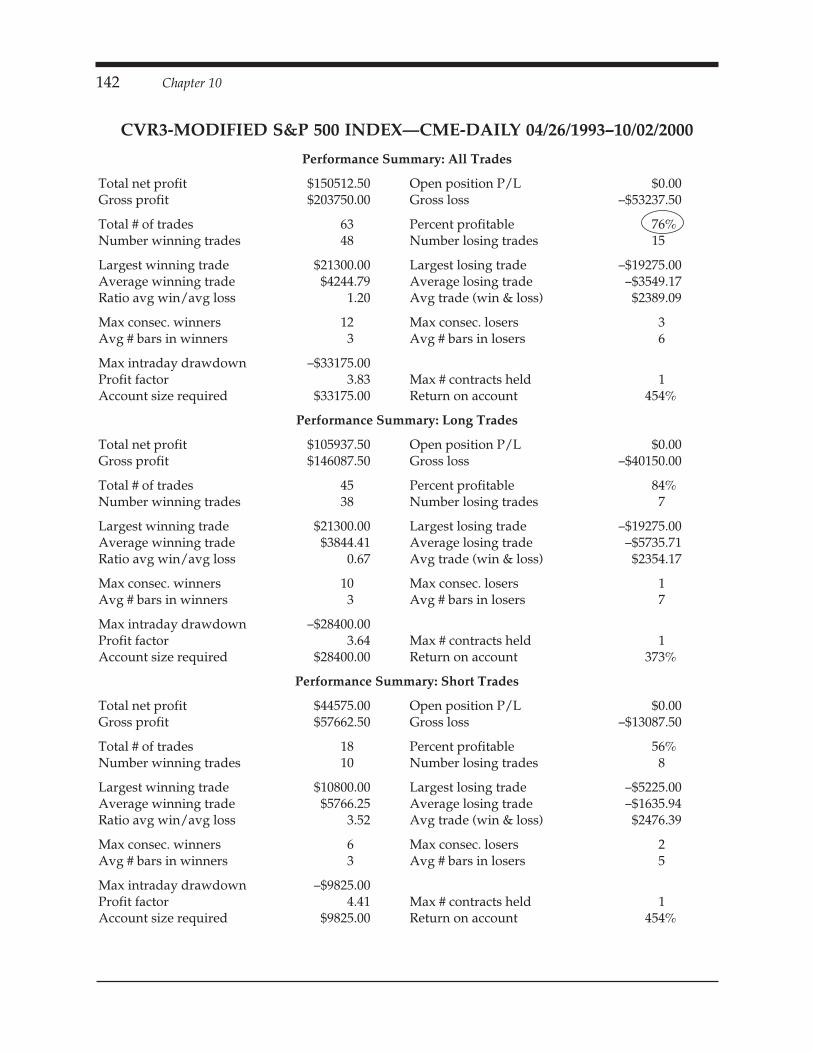
142 Chapter 10
CVR3-MODIFIED S&P 500 INDEX—CME-DAILY 04/26/1993–10/02/2000
Performance Summary: All Trades
Total net profit $150512.50 Open position P/L $0.00Gross profit $203750.00 Gross loss –$53237.50
Total # of trades 63 Percent profitable 76%Number winning trades 48 Number losing trades 15
Largest winning trade $21300.00 Largest losing trade –$19275.00Average winning trade $4244.79 Average losing trade –$3549.17Ratio avg win/avg loss 1.20 Avg trade (win & loss) $2389.09
Max consec. winners 12 Max consec. losers 3Avg # bars in winners 3 Avg # bars in losers 6
Max intraday drawdown –$33175.00Profit factor 3.83 Max # contracts held 1Account size required $33175.00 Return on account 454%
Performance Summary: Long Trades
Total net profit $105937.50 Open position P/L $0.00Gross profit $146087.50 Gross loss –$40150.00
Total # of trades 45 Percent profitable 84%Number winning trades 38 Number losing trades 7
Largest winning trade $21300.00 Largest losing trade –$19275.00Average winning trade $3844.41 Average losing trade –$5735.71Ratio avg win/avg loss 0.67 Avg trade (win & loss) $2354.17
Max consec. winners 10 Max consec. losers 1Avg # bars in winners 3 Avg # bars in losers 7
Max intraday drawdown –$28400.00Profit factor 3.64 Max # contracts held 1Account size required $28400.00 Return on account 373%
Performance Summary: Short Trades
Total net profit $44575.00 Open position P/L $0.00Gross profit $57662.50 Gross loss –$13087.50
Total # of trades 18 Percent profitable 56%Number winning trades 10 Number losing trades 8
Largest winning trade $10800.00 Largest losing trade –$5225.00Average winning trade $5766.25 Average losing trade –$1635.94Ratio avg win/avg loss 3.52 Avg trade (win & loss) $2476.39
Max consec. winners 6 Max consec. losers 2Avg # bars in winners 3 Avg # bars in losers 5
Max intraday drawdown –$9825.00Profit factor 4.41 Max # contracts held 1Account size required $9825.00 Return on account 454%
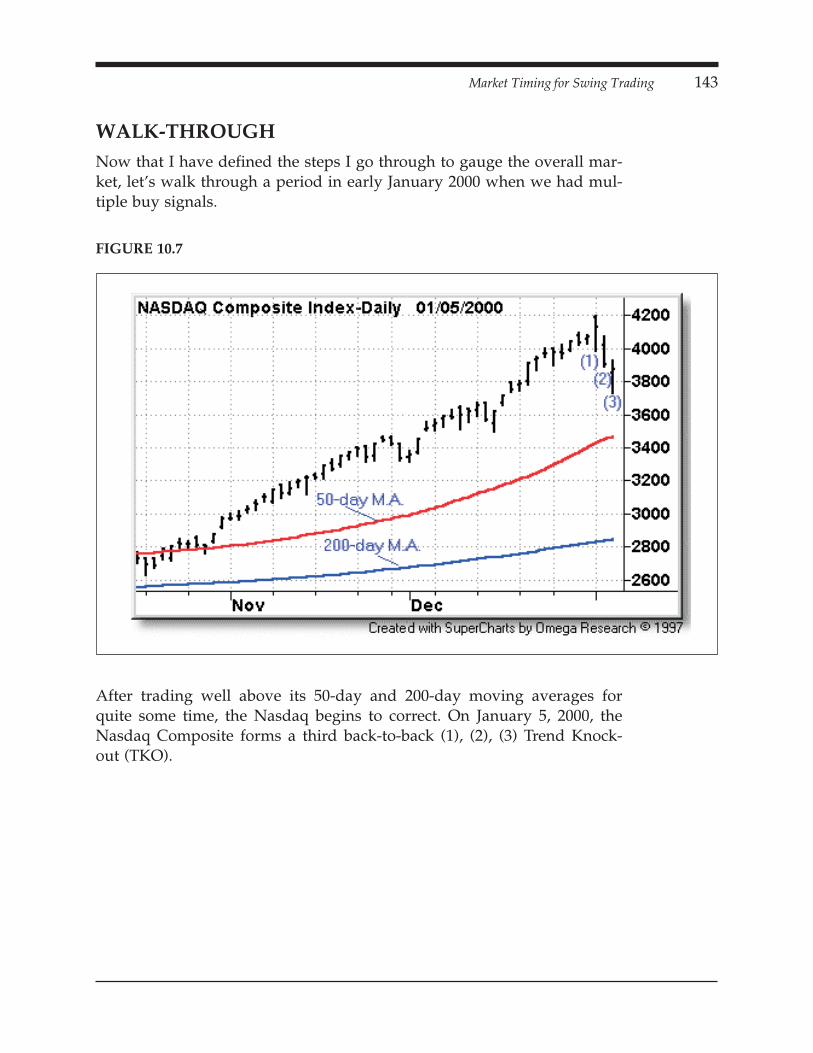
WALK-THROUGHNow that I have defined the steps I go through to gauge the overall mar-ket, let’s walk through a period in early January 2000 when we had mul-tiple buy signals.
After trading well above its 50-day and 200-day moving averages forquite some time, the Nasdaq begins to correct. On January 5, 2000, theNasdaq Composite forms a third back-to-back (1), (2), (3) Trend Knock-out (TKO).
Market Timing for Swing Trading 143
FIGURE 10.7

Looking to the S&P 500, I see that it has probed below its 50-day movingaverage but reversed and rallied to close right at the average.
144 Chapter 10
FIGURE 10.8
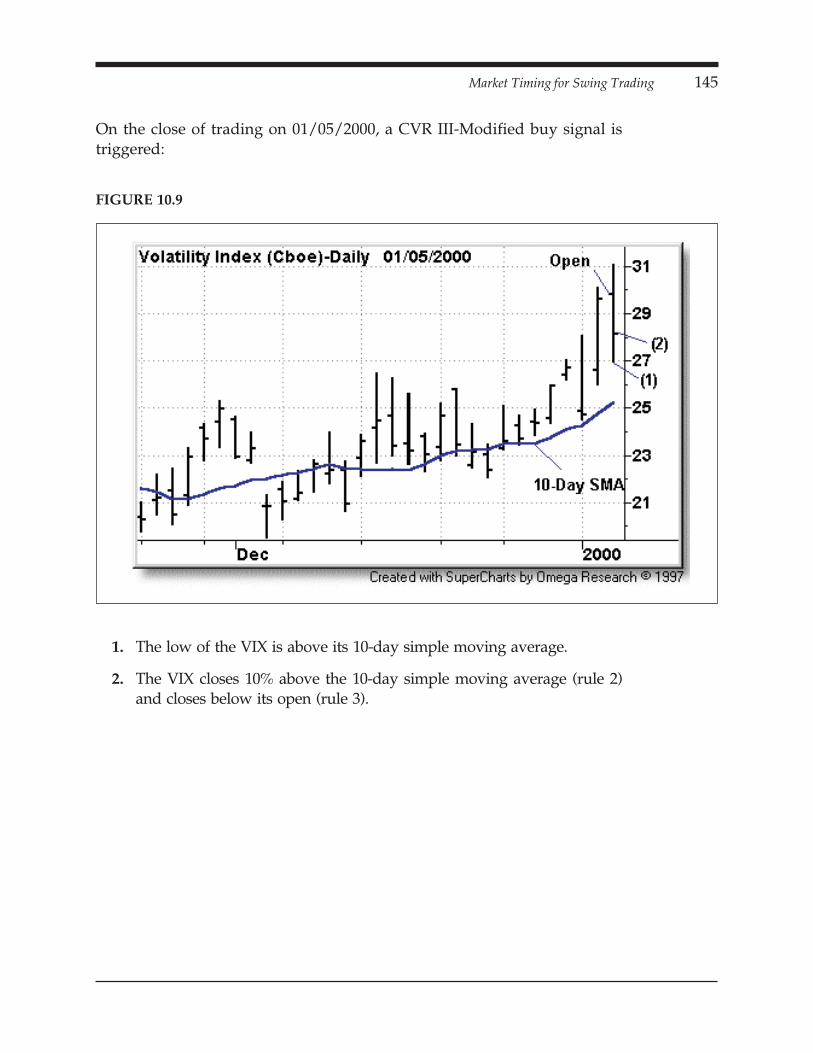
On the close of trading on 01/05/2000, a CVR III-Modified buy signal istriggered:
1. The low of the VIX is above its 10-day simple moving average.
2. The VIX closes 10% above the 10-day simple moving average (rule 2)and closes below its open (rule 3).
Market Timing for Swing Trading 145
FIGURE 10.9

An Oscillator Swing System buy signal is also triggered on the close of01/05/2000:
1. The S&P futures are not in a downtrend by a having low ADX read-ing of 18 (not shown).
2. The 3-10 oscillator drops for five consecutive days.
3. The S&P futures close above their open.
146 Chapter 10
FIGURE 10.10

On 01/05/2000, the three-day average of the TRIN suggests that a buysignal is near:
1. The three-day average of the TRIN hits a 30-day high.
2. The TRIN drops sharply, suggesting that we could get a buy signal (aflip down in the three-day average of the TRIN) within a day.
Market Timing for Swing Trading 147
FIGURE 10.11

Now that we know the overall market is set up to rally, we take the nextstep and begin looking for the strongest sector(s).
1. The AMEX Biotech Index (BTK) is in a strong uptrend.
2. The index has a sharp sell-off.
3. On 01/05/2000, after probing lower, the index rallies to close well.This intraday reversal suggests the correction is over and the sector ispoised to resume its strong uptrend.
148 Chapter 10
FIGURE 10.12

Now that we have the overall market and sector behind us, we look forindividual stocks in the sector that are set up.
1. Alexion Pharmaceuticals (ALXN), a biotech, is in a strong uptrend.
2. The stock pulls back.
3. On 01/05/2000, after gapping lower, the stock reverses to close well.This intraday reversal suggests the correction is complete and thestock is poised to rally. We will look to go long tomorrow at 29 3/16,1/16 above today’s high.
Market Timing for Swing Trading 149
FIGURE 10.13
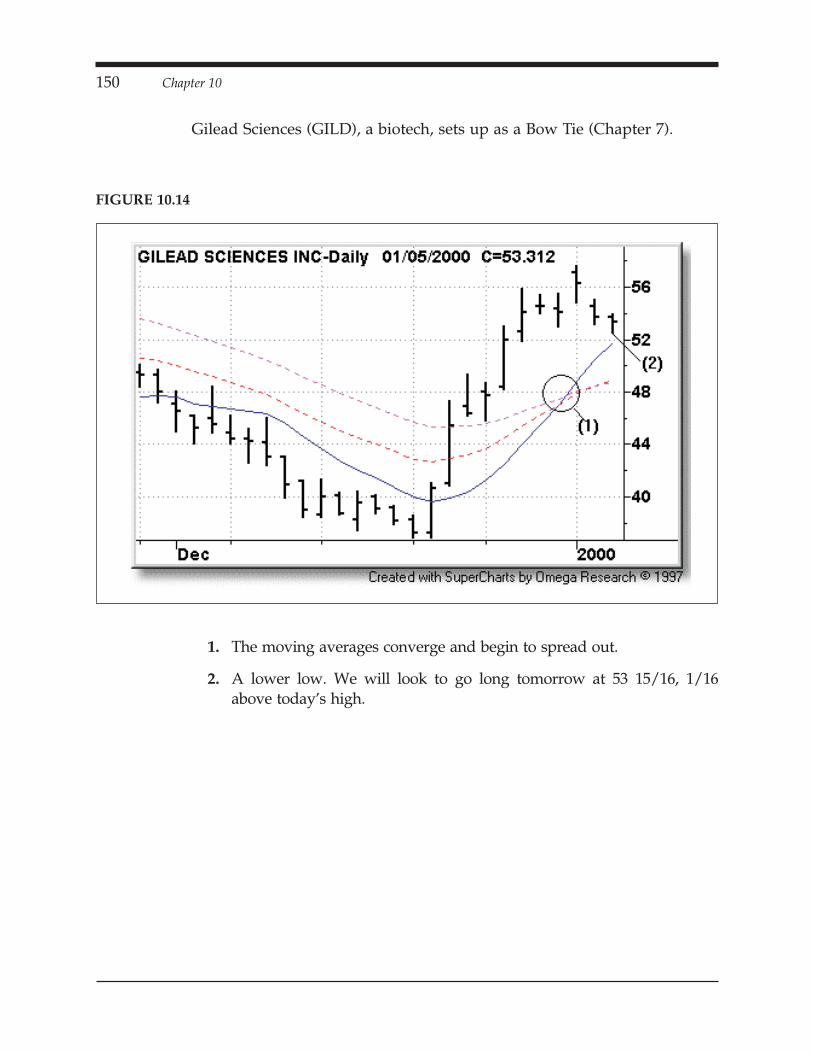
Gilead Sciences (GILD), a biotech, sets up as a Bow Tie (Chapter 7).
1. The moving averages converge and begin to spread out.
2. A lower low. We will look to go long tomorrow at 53 15/16, 1/16above today’s high.
150 Chapter 10
FIGURE 10.14

On 01/05/2000, CV Therapeutics (CVTX) sets up as a Trend Pivot Pull-back and a low-volatility situation:
1. CVTX is in a strong uptrend.
2. The stock forms a Trend Pivot Pullback on 01/04/2000 (Chapter 6).
3. On 01/05/2000, the ratio of the 6/100 historical volatility drops below50%, suggesting that a large move is imminent. We will look to golong tomorrow at 26 11/16, 1/16 above the pivot high (2).
Market Timing for Swing Trading 151
FIGURE 10.15

On 1/6/2000 we get entries on CVTX, ALXN and GILD:
152 Chapter 10
FIGURE 10.16

Market Timing for Swing Trading 153
FIGURE 10.17
FIGURE 10.18
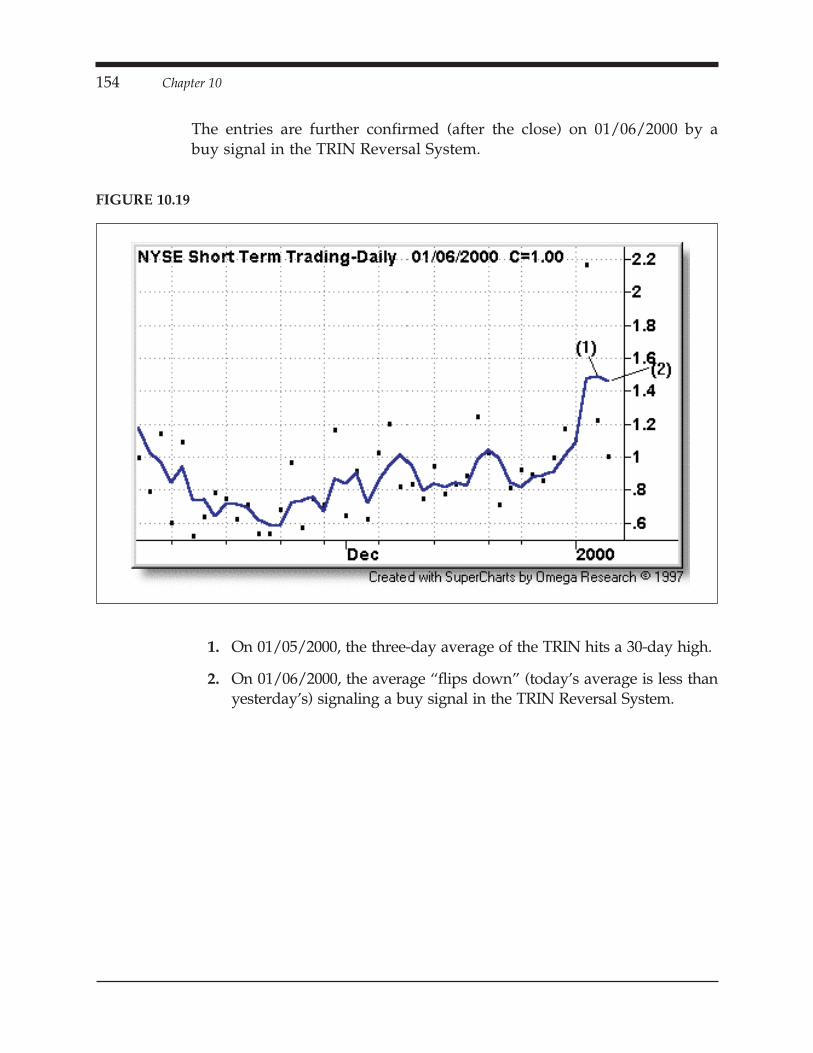
The entries are further confirmed (after the close) on 01/06/2000 by abuy signal in the TRIN Reversal System.
1. On 01/05/2000, the three-day average of the TRIN hits a 30-day high.
2. On 01/06/2000, the average “flips down” (today’s average is less thanyesterday’s) signaling a buy signal in the TRIN Reversal System.
154 Chapter 10
FIGURE 10.19

Over the next few days, the S&P, Nasdaq, Biotech Index and the stocksthat were set up (CVTX, GILD and ALXN) all trade higher.
Market Timing for Swing Trading 155
FIGURE 10.20
FIGURE 10.21

156 Chapter 10
FIGURE 10.22
FIGURE 10.23

Market Timing for Swing Trading 157
FIGURE 10.24
FIGURE 10.25
SUMMARYAs you can see, the odds are stacked in your favor as a swing trader bycombining discretionary analysis, mechanical systems and sector analysisalong with setups in individual issues.
Q&AQ. Where can I find more information about the VIX indicator?
A. Contact the Chicago Board Options Exchange at www.cboe.com. Also,Connors VIX Reversal Signals are published nightly onTradingMarkets.com.
Q. Do you only trade when you have signals and setups in the indi-ces/sectors such as those mentioned in your walk-through?
A. I’ll trade as long as I have some sort of feel for the market. If I don’t,then I’ll take smaller position sizes. If these trades turn into losing po-sitions, I may stop trading until I have a better feel for the market. But,yes, ideally, I like to see systems kicking in along with patterns in theoverall indices and sectors.
Q. In your walk-through, you had systems, patterns in the overall indicesand sectors all occurring around the same time frame. During thesetimes, do you tend to take larger position sizes?
A. Yes, to some extent. There are only a few times a year when every-thing lines up. During these times, I may take a larger position size orpossibly increase my leverage by taking an options trade. But, eventhough I know what the market should do, I keep risks in check just incase I’m wrong.
158 Chapter 10

SECTION FIVE
OPTIONS3 3 3 3 3 3 3 3 3 3 3 3 3 3 3 3 3 3 3 3 3 3 3 3 3 3 3 3 3 3 3
159


CHAPTER 11
A FEW WORDS ABOUTUSING OPTIONS WITHSWING TRADES3 3 3 3 3 3 3 3 3 3 3 3 3 3 3 3 3 3 3 3 3 3 3 3 3 3
The setups and concepts described in this manual are designed to captureexplosive short-term moves in stocks. As such, they often lend themselveswell to option trading. Be warned, however, options are an extremely com-plex vehicle and you must use utmost caution when trading them. Makesure you fully understand the nuances and risks involved. There are entiretexts devoted strictly to option trading, pricing models and volatility. Istrongly urge you to learn as much as possible about options before at-tempting to trade them.
It has been estimated that as much as 90% of those who trade optionslose. Why? Because most who buy options do not have a strategy, amoney-management plan in place, and tend to buy extremely speculativeout-of-the-money options. The following guidelines, while by no meansexhaustive, will help improve your odds when using options to initiateswing trades.
Avoid Out-of-the-Money Options—One of the main reasons most peo-ple lose when trading options is that they buy mostly out-of-the-moneyoptions. Although cheaper in absolute dollars, these options are normally
161

very expensive in terms of true value. And more often than not, they ex-pire worthless. Even if the underlying stock price rises sharply, these op-tions often do not increase enough in value to make trading themworthwhile.
In order to avoid the pitfalls associated with out-of-the-money options, agood rule of thumb is to buy options that are 1 to 2 strikes in the money.These options will tend to trade in tandem with the underlying stock.For instance, if the stock rises 1 point in value, an in-the-money call op-tion would also rise one point in value. In option lingo, this is known ashaving a delta of 100. This means the option trades in a similar mannerto 100 shares of outright stock.
Buy the Nearby—As swing traders we are looking to position ourselvesfor the next two to seven days. We do not have to increase our risk bybuying longer-dated, higher premium options. Therefore, look to tradethe front-month options unless the expiration is less than seven tradingdays away. In these cases, go to the following month’s expiration.
Those familiar with options may argue that nearby options have worsetime-decay profiles than longer-term options. I understand this argu-ment, but believe that the potential of the patterns in this manual tomake an immediate move far outweigh these drawbacks.
No Tickie, No Tradie—As discussed in Chapter 2, Landry’s Rules andMoney Management for the Swing Trader, you should not buy or sellshort a stock unless it triggers a setup. The same holds true for buyingoptions. Only buy options if, and only if, a setup triggers in the underly-ing stock. Be warned, however, if the stock is in a fast move when it trig-gers the setup, the spreads on the option will likely widen. In these casesyou may have to be willing to forgo an options position.
Consider Options as a Stock Replacement on Profitable Stock Posi-tions—Once a swing trade entry is triggered, in most cases, it’s mucheasier to enter the underlying stock than it is to buy options. This is espe-cially true during fast markets that often occur when setups are trigger-ing. Therefore, you may want to consider options as stock replacementafter you have entered the underlying stock and only if the positionshows a reasonable profit.
For instance, if after entering a swing trade you are fortunate enough tohave a large profit, rather than carry a large stock position overnight, youmight look to sell the position and buy options with a piece of your prof-its. This is, of course, provided the options are reasonably priced. This
162 Chapter 11
way, you have banked a profit and will still have the potential for awindfall profit on the option position with defined downside risk.
If You Hit a Double, Bank Half—Option prices often fluctuate wildly.Therefore, whenever you initiate an option position, you should immedi-ately place a limit order to sell half of the position at twice your originalcost. For instance, suppose you buy four options for $5 each, you wouldthen place a limit order to sell two options at $10 (or slightly higher tocover commissions). Should the option spike higher, you’ll get filled onthis limit order and have covered the cost of the entire position. Youshould then look to scale out of these remaining options by followingmanagement principles outlined in this manual.
Q&AQ. You mentioned buying calls to replace stock in order to help reduce
the risks of holding overnight. Why not just buy puts to hedge the po-sition?
A. You could, but often the premium on the puts is quite high becausemany with profits will be looking to hedge off risk. Also, if you buyputs, you now have to manage a hedge along with your original posi-tion. In other words, you have two positions to deal with. For in-stance, what if the stock continues to rise? You now have to buyhigher strike puts in order to remain hedged. For me, it’s easier tothink and manage one position in one direction.
Q. You don’t mention option pricing models in your guidelines. Do youuse them?
A. As I said earlier, there are entire texts devoted strictly to option pricingmodels and volatility. My goal with this manual was to provide acomplete manual for the stock trader. I do look at the implied volatil-ity on the options and compare it to the historical volatility. I use thisas a general guideline to gauge how expensive the option is. However,keep in mind that no option pricing model or technique can accuratelypredict future volatility. There are (albeit rare) times when optionsmay appear expensive on the surface but are actually a bargain in re-ality.
Q. Can you give us an example of when this occurs?
A Few Words About Using Options with Swing Trades 163

A. Sure. In a blow-off market, no one knows how far and how long itwill go. For instance, in early 2000 call options were fairly priced, butin reality, due to the extreme nature of the market, were actuallycheap. Many at-the-money options became 10, 20, 30 or more points inthe money in a matter of days. No option pricing model could haveaccurately predicted this.
Q. Do you have a favorite pattern for trading options?
A. The best setups are those that occur during a low-volatility situation(see Chapter 9, Finding Explosive Moves: An Advanced Lesson inSwing Trading). In these cases, option premiums tend to fall right be-fore a large increase in volatility and stock price. This is the best ofboth worlds for the buyer of options.
Q, What about covered calls, spreads and other option strategies?
A. As mentioned earlier, the focus of this manual is predicting theshort-term directional moves in stocks and not options trading. I pre-fer to keep it simple: I’ll occasionally use calls if I’m bullish or puts ifI’m bearish.
164 Chapter 11

SECTION SIX
PSYCHOLOGY3 3 3 3 3 3 3 3 3 3 3 3 3 3 3 3 3 3 3 3 3 3 3 3 3 3 3 3 3 3 3
165

CHAPTER 12
TRADER’S PSYCHOLOGY3 3 3 3 3 3 3 3 3 3 3 3 3 3 3 3 3 3 3 3 3 3 3 3 3 3
The Speculator’s chief enemies arealways boring from within.
—Edwin LeFevre,Reminiscences of a Stock Operator
I’m afraid that some timesyou’ll play lonely games, too.Games you can’t win’cause you’ll play against you.
—Dr. Seuss, Oh! The Places You’ll Go!
In trading, there are many psychological barriers that you must overcome.The first step you must take is to realize that the trading world is much dif-ferent than the “real world.” For instance, in the “real world,” as long asyou perform your job to the degree expected of you, you’ll continue to re-ceive a paycheck on schedule. In trading, however, you can work hard, doeverything “correctly” and occasionally still lose money. Even worse, themarkets will sometimes lull you into a false sense of security by rewarding“bad behavior” such as being careless and taking excessive risk.
In the real world if something goes awry on the job, it can be coveredup, the blame can be shared and, in some cases, insurance will cover
167
the losses. In trading, however, there is no safety net and nowhere tohide. You must take responsibility for your actions. Your account bal-ance doesn’t lie.
In the real world, you are expected to stay busy. After all, they’re notpaying you to sit on your butt. In trading, however, sometimes the bestthing to do is just that—nothing. Trying to make something happen inthese environments can be detrimental to your account. The old saying“Don’t confuse activity with accomplishment” applies here.
Obviously, operating in the unstructured environment of the tradingworld versus the real world can be difficult. You have to manage your-self and your emotions. Below we will look at ways to recognize andovercome the psychological pitfalls of trading.
Realize That Losses Are Part of the Game—You can’t take a loss person-ally. If you think about it, the guy on the other end of your trade has theexact opposite opinion of you. You can’t both be right. Therefore, everytrade has the potential to be a loser.
Money Management, Money Management, Money Management—Proper money management will help solve many of the psychologicalpitfalls of trading. For instance, if you are only risking 1% to 2% pertrade, then any individual loss should be of little consequence.
Have Confidence—You must be comfortable with your methodologies.You develop this comfort through historical research, real-time observa-tion and trading. This does not mean that you are confident to the pointthat you are infallible on any one trade. Rather, you know that through aconsistent approach, you will make money in the long run.
Remain Humble—This may seem like a contradiction to confidence, buta good trader must also be humble. The best traders are confident abouttheir methods but humbled by the fact that the market can do anything itwants in spite of their opinions.
Realize That You Have No Control Over the Markets—The market cando whatever it wants. It is made up of millions of individuals overwhom you have absolutely no control over. The best setup in the worldwon’t work if some hedge fund or large trader decides to dump his posi-tion (for whatever reason) right after you enter the market. Also, youhave no control over outside influences. This doesn’t have to be some-thing obvious like a war or even an off-the-cuff remark from a worldleader. It can be something as simple as the actions of some lunatic. Forexample, I once was knocked out of a perfectly good and profitable S&P
168 Chapter 12
futures trade because some psychopath decided to start shooting peoplein our nation’s capital building.
Forget About Being Right—In swing trading, as many as half of yourtrades will result in a loss. Yet through controlling those losses, the win-ning trades will more than make up for the other half. Your goal is not tobe right. Your goal is to make money, period.
Realize That No Methods Are Perfect—Be a student of the markets butrealize that there is no “Holy Grail”—an infallible system that will leadto riches without risk. Stick with simple, conceptually correct methodssuch as those outlined in this manual. In the past, many have made bil-lions on simple systems such as those developed by Donchian. In hiswords: “In this field of technical study, it is probably safe to state that the be-ginning of wisdom comes when you stop chasing rainbows and admit that nomethod is perfect. When you find yourself willing to settle for any comparativelysimple method that, in tests over a long period, makes money on balance, thenstick to the method devotedly, at least until you are sure that you haven’t discov-ered a better method.”
Be Consistent—You must be consistent in your approach to the markets.You will never be successful as long as you are jumping from method tomethod. Find something that works and stick to it.
Keep Emotions in Check—Those who become euphoric when things aregood are also those who tend to fall the hardest when things turn bad.Strive to stay on an even keel in good times and bad.
In Times Of War, Prepare For PeaceIn Times Of Peace, Prepare For War
—Sun Tzu
In good times, you must realize that you are just around the corner froma string of losses. Conversely, after a string of losses, better times oftenfollow.
Embrace Who You Are—We are all individuals with our own psycholog-ical makeup. Recognize and embrace what makes you different and useit to your favor when trading. For instance, I was raised with a strongwork ethic. Phrases such as “There’s no free lunch” were common in myhousehold when I was growing up. However, as mentioned previously,sometimes in trading, the best thing to do is nothing. This goes com-pletely against my upbringing. At these times I would feel lazy and
Trader’s Psychology 169

guilty for “not working.” I would then try to make something happen byestablishing positions even though I knew I shouldn’t. I finally realizedthat during poor market conditions I must channel my energy into some-thing other than trading. I’ve discovered that if I used this time to con-duct market research, I felt productive without having to expose myequity unnecessarily.
Treat Profits as Your Own Money—Chances are, if you are a successfultrader, you have worked very hard to achieve this goal. Therefore, whenyou make money trading, you are being paid for that hard work. It’syour money and should be treated no differently than a paycheck. Donot become careless and violate your rules because it is the “market’smoney” or a “free” position. It’s okay to occasionally press a little whenyou have windfall profits, just make sure you keep the lion’s share.
Only Trade When You Are of Sound Body and Mind—Do not tradearound major life events or when you are sick, distracted or simply notprepared.
Only Trade When You Have an Edge—The best times to trade are thetimes when the overall market and individual sector(s) are suggesting aclear direction. It is at these times you will find yourself having troublechoosing between all those wonderful setups. Other times, when it’s ex-tremely difficult to determine market and sector direction, it will benearly impossible to find decent setups. And when you do, you’ll oftenfind yourself quickly stopped out. At these times, you must be patientand wait for better times.
Be Positive in Life But Skeptical in the Markets—In life, we are taughtto be positive. “Look on the bright side,” “Things normally work out”and “Have faith” are phrases we have all heard over and over. However,having faith and hope for a losing position is fruitless. The best tradersdon’t focus on what they will make on a trade, but rather how muchthey can lose and how to manage that risk. Successful traders are posi-tive in life and confident that their methodologies will work over thelong haul, but remain skeptical on any given trade.
Don’t Expect Immediate Success—Some of the worst novice traders Iknow are medical doctors. Why? Because they are successful in whatthey do and automatically assume they can transfer their success to trad-ing. They forget that it took an intense study of 10 years before they wereallowed to cut on their first patient.
170 Chapter 12

It is not my intent to pick on doctors; I also know incredibly successfullawyers, engineers and even a rocket scientist who think that they canquickly pick up trading because they have become masters in their ca-reers. What they fail to remember is that it took them more than a fewweeks to become successful in their professions.
Learn from Your Losses—A loss in the market is not a total loss as longas something is learned. For instance, after getting stopped out numeroustimes only to watch the trend resume, I discovered the Trend Knockout(TKO) (Chapter 6).
Work Hard and Love What You Do—You should be passionate abouttrading. It is not something you should do casually. Because money is theultimate motivator, I can assure you those on the other sides of yourtrades have dedicated the better part of their lives to trading. And, theyare all too happy to take money away from those less serious.
Keep a Journal—Other than finding a methodology that makes sense toyou and applying strict money-management principles, the best way tobecome a better trader is to monitor yourself and your own performance.I strongly urge to you keep a trading journal. Whenever you enter atrade you should write: What motivated it? What was the setup? What isthe overall market doing? What is the sector of the stock doing? If thetrade is a larger- (or smaller-) than-normal position size, why? Print andlabel any charts that support you claim. Once all the mechanics aredown, make sure you include a little about yourself. Are you feelingwell? Are their any stresses weighting you down? Have you experiencedany major life changes recently? Have you been making money lately?
Plot Your Equity—The value of your trading account does not lie.Having made it this far in this manual, you should now know what atrend is. Therefore, if your equity curve is trending steadily higher, thenyou are doing something right and/or market conditions are favorable.On the other hand, if your equity curve is trending lower, then you aredoing something wrong and/or market conditions are unfavorable. Stoptrading and reevaluate the situation with a clear head. The name of thegame is long-term survival. The markets will always be there.
I know several traders who know very little about market timing, yet arealways out of the markets when conditions are at their worst. How?They stop trading after a string of losses, wait for better times and thenslowly ease back in.
Trader’s Psychology 171

Reflect—At the end of the day, take a few minutes to quietly reflect onyour trading. Mentally rehash the day’s events. What did you do right?What did you do wrong? What could you have done better? Did youkeep losses in check? Did you honor your stops? Did you take partialprofits if they were offered to you?
SUMMARYThe trading world is vastly different from the real world. There are manypsychological barriers that must be overcome. However, if you strive tobecome successful, I can assure you that it will be well worth the effort.With hard work and devotion, there is no limit to what you can achieve.Think about it. How many times at work have your accomplishmentsgone unnoticed and unrewarded? How many times have others takencredit for your actions? This will never happen in the trading world. Youand only you control your own destiny.
172 Chapter 12
CHAPTER 13
LESSONS LEARNED3 3 3 3 3 3 3 3 3 3 3 3 3 3 3 3 3 3 3 3 3 3 3 3 3 3
Over the years, I have learned many lessons about trading through theschool of hard knocks. In more recent times, by being a public figure in thetrading world, I have been able to re-learn these and new lessons throughfellow traders. The following are some of my favorites.
START TRAINING ON MONDAY,COMPETE ON WEDNESDAYMy wife Marcy asked me if I would discuss trading with two of her cli-ents and their spouses. She explained to me that they were all going toplop down $3,000 each on a weekend seminar that would teach them“everything they needed to know to immediately start earning a livingtrading.” Marcy knew that none of these individuals had ever traded andfeared the seminar would be a waste of their money. And worse, she wasconcerned that they would lose much more money should they decide tojump into the markets. I agreed and we all had dinner the followingSunday night.
After patiently listening to a regurgitation of the motivational speech thathad been given to them, I studied the materials that were to be covered.To my surprise, it involved technical analysis and didn’t involve any“magic” systems. However, much of the material was dated and wasn’tanything you couldn’t get from a good $50 primer on the subject. Fur-
173

thermore, it certainly wasn’t enough for a novice to become a full-timetrader a few days later.
I tried to talk them out of the seminar in several different ways. I offeredto loan them books, suggested they get a free trial toTradingMarkets.com and even was willing to give them private lessonsfor free—provided, of course, they were serious about learning. I empha-sized that they should do this before plopping down money on a get-richseminar. All of this fell on deaf ears as they once again repeated the salespitch to me.
As I watched them drink their water and eat their bland chicken andvegetables, finally it hit me: I had to speak in their terms. The gentlemenwere bodybuilders and their wives were fitness fanatics. All had the ut-most discipline and had been training for years. One of the men heldseveral regional bodybuilding titles and the other was preparing to com-pete in his first amateur competition. For dramatic effect, I put a wholejumbo shrimp into my mouth, took a big slurp of my 25-ounce beer andslammed it down on the table. Talking with my mouth full, I then said,“You know what? I’m going to finish this beer, my fried shrimp appe-tizer, my 14-ounce steak and fries, and on Monday I’m going to starttraining and dieting (I was about 30 pounds overweight at the time).Then, on Wednesday, I’m going to compete in a bodybuilding contest.”
Follow-up: Couple A heeded my advice and avoided the seminar. In-stead, they continued to focus on growing the business they owned. Infact, the business has grown so much that they have recently consideredfranchising.
Couple B attended the seminar, quit their jobs, and after a brief stint attrading, are now searching for the next get-rich-quick scheme.
The moral: Becoming a successful trader is possible, but it takes morethan a weekend.
ENJOY THE RIDEJoe is a successful long-term trader who decided to try his hand at swingtrading. I began working with Joe and he became quite successful in ashort period of time. The fact that he started during the greatest bullmarket blow-off in the last 20 years didn’t hurt either.
One day we were discussing the markets and he said that he had alreadymade over $35,000 and it wasn’t even noon. He was bragging that this
174 Chapter 13
just about covered the tricked-out sport-utility vehicle he had ordered theday before. At this point, I told him, “As soon as you hang up the phone,cash out, write a check and pay for your new truck. Then, no matterwhat happens to you in the markets, at least you’ll have nice truck toride around in.” He took my advice and paid cash for his truck.
Follow-up: Ironically, Joe suffered a severe loss in the markets in the fol-lowing few weeks, but is really enjoying his SUV.
The moral: Take something out.
NURSING POSITIONSLonger term, Bill was a successful trader, but had recently entered somebad trades. We were talking one day about a number of stocks that hadset up. I assumed that he must be printing money since we were bothlooking at the same stocks and they were all moving nicely. When I in-quired about his position size, he replied that he did not take these newpositions because he was too busy “nursing all his bad positions.”
The moral: Because he was focused on positions that were not working,he missed all the opportunity of the new stocks that were setting up. Toquote Livermore, “The chap who is compelled to lug a corpse a year ortwo always loses more than the original cost of the deceased; he is sureto find himself tied up with it when some really good things come hisway.”
WHO MAKES A BETTER TRADER:AN MBA OR A RECEPTIONIST?Many years ago I worked on a base where they used to test rocket en-gines. The base was so large that it had its own fitness facility. One day Iwalked into the gym with a long face.
The receptionist: “What’s wrong?”
Me: “I’m in a bunch of bad stocks.”
The receptionist (with a perky little smile and a high-pitched bouncyvoice): “Well, sell them and buy a bunch of good stocks.”
Her statement infuriated me. After all, I had recently completed my MBAand had been studying the market for a few years. I thought, “What thehell does a receptionist know about trading?”
Lessons Learned 175
Follow-up: Evidently, she knew a lot more about trading than I did atthat time. Taking this simple advice would have saved me about$30,000—a lot of money for a kid fresh out of school!
The moral: Trading is not rocket science.
THE GENIUSMike, an accomplished long-term trader, has recently begun swing trad-ing. He calls me a few times a week. Almost always, it’s the same con-versation:
Mike: “I’m up 4 points on XYZ, what should I do?“
Me: “Sell half and move your stop on your remaining shares tobreakeven.”
Mike: “Man, that’s great advice. You’re a genius!”
The moral: Simple money management is not rocket science.
NEVER-WRONG MANNever-Wrong Man never loses money trading. Even when he’s followinga mechanical system, he “forgets” to take the losing trades. There’s al-ways an excuse. “I got busy and forgot to check my signals,” or “Thebroker screwed my order up, so while I thought I was losing money, inreality the trade didn’t go through.” When he does take what would turnout to be a losing trade, there’s always another excuse. For instance, “Youknow, I can’t explain it, but I just decided to sell the stock afterhours, fiveminutes before the bad news came out.”
I used to be intimidated by Never-Wrong Man. I would think, “Geez,what’s wrong with me? Why do I make mistakes? Take bad trades? Getstopped out? Why can’t I be more like Never-Wrong Man?” I later real-ized that no one is immune to losses in this game, not even Never-WrongMan. You win some, you lose some and hopefully, by being consistentand controlling losses, you make money overall.
The moral: Big Foot, The Loch Ness Monster and Never-Wrong Man al-legedly exist, yet their existence has yet to be proved.
ANTHILLBob entered a swing trade and failed to place a protective stop. Withinhours, he was down over 20 points. The next day, he got an incredible
176 Chapter 13

break; the stock came all the way back plus some. Bob was smug abouthis trade as he cashed out for a 2-point gain.
pieces, but all it takes is one big footprint to smash it down.
METHOD MANMethod Man is a setup junkie. He reads everything he can get his handson regarding trading. The problem is, he runs out and tries to apply con-cepts with his hard-earned money literally minutes after reading aboutthem. He doesn’t take the time to do the proper research, to prove thatthe setup has worked historically and through real-time observation.Method Man occasionally gets lucky but never has consistent longer-termperformance.
The moral: Find something that works and stick to it.
SHOW-AND-PULLI once checked out a chat room full of daytraders just to see what it wasall about. There were a few smaller “wannabes” in the room, but for themost part, it was made up of larger, well-capitalized traders. One of thenewer traders entered a small position in a thinly traded stock. The stocklooked impressive and fit all the criteria for a good setup. After mention-ing the stock to the group and the fact he was long 100 shares, one of thelarger traders in the group decided to have a little fun. He said, “Hey, ev-eryone, pull up XYZ on your Level II quote screens . . . now watchthis . . .” He then put out a 10,000-share offer on the stock. He laughed asthe smaller trader began to squirm and beg him to take it down. A fewseconds later, he removed the offer.
Now here’s a guy that was screwing around just to get a few laughs.However, this could have had a material impact on the stock. What ifother traders had been scared out of their positions based on this bogusoffer? A chain reaction could have knocked the small trader out of a per-fectly good position.
The moral: All it takes is one jerk to screw up a perfectly good trade.
Lessons Learned 177
Ants can build a significant mound with tiny little bits andThe moral: Strategies like Bob's are known as "anthill strategies

GET YOURSELF A PUNCHING BAGSteve, a daytrader, always had a chip on his shoulder. He was constantlymad at the market makers for “screwing him.” In fact, on some days,Steve would send me numerous e-mails complaining about the above.He would even go through the painstaking process of providing timeand sales information and other information to support his claims. Hebecame so obsessed, he began watching stocks that he had no intentionof trading just so he could prove his point. I couldn’t imagine where anactive daytrader was finding so much time intraday. I knew he had to bemissing numerous opportunities while expending all that negative en-ergy. Finally, after getting tired of reading all his e-mails, I decided totake action. I explained to him that he was wasting far too much energyon things he couldn’t control. Further, I admitted that I, too, occasionallygot mad at brokers, market makers and the market in general, but in-stead of obsessing over it, I go to the back of my office and beat on mypunching bag. After a few minutes of this, I return to my screens focusedand refreshed. Next!
The moral: Get yourself a punching bag.
RETIRE ON A SAILBOATJohn, a friend of mine, became incredibly bullish on a certain stock.Starting with $5,000, he began buying options on the stock. Turns out,John’s analysis was right. The options soon became worth many thou-sands of dollars. As the options neared expiration, he sold them and par-layed the money into more further out-of-the-money options. He beganto repeat this process over and over. This strategy was so successful thathe quit his day job. As he approached the million-dollar mark, I sug-gested that he lock in his profits and place them into a secure fixed-in-come investment. He explained to me that when he reached four millionhe was going to buy a sailboat and retire.
Follow-up: Unfortunately, the stock began to implode soon after hereached a million dollars. His entire account was wiped out over the nextfew weeks.
The moral: Don’t expect the market to fulfill your dreams. To quoteLivermore: “There isn’t a man on Wall Street who has not lost money try-ing to make the market pay for an automobile or a bracelet or a motor-boat or a painting.”
178 Chapter 13
THE BEAR HAS EYESIn the late ’90s, during one of the greatest bull markets in history, BearMan, one of the best daytraders in the world, was constantly faxing,e-mailing and calling me to talk about how the bull market was comingto an end. He’d support his claims with articles and newsletters alongwith market statistics and historical comparisons. His research was oftenthorough and quite convincing
The conversations were almost always the same. After about 10 minutesof listening to his bearish arguments:
Me: “Okay, I know you are bearish. So what are you trading?”
BM: “I’m long, ABC, CDE and EFG.”
Me: “Why no shorts?”
BM: “Because the market is going up.”
The moral: Bear Man never confuses being right with making money.This is why he is one of the greatest traders in the world.
OH, I DON’T LIKE TO TAKE A LOSSAfter just a few months of trading, Mike had become a very successfultrader. In fact, he was so successful that he was on the verge of shuttingdown his successful law practice so he could focus on trading. Impressed(and somewhat envious) with his immediate success, I inquired about hismethods. He told me that he buys the hottest stocks on the momentumlists. When I asked about his risk control, he stated, “Oh, I don’t like totake a loss . . . they’ll come back.”
Follow-up: I can’t say for sure that Mike has been wiped out, but I doknow that his law practice has been dissolved and he appears to havevanished off the face of the earth. I hope the best for Mike, but fear theworst.
The moral: Use a stop.
IMPRESS YOUR FRIENDSJohn was lucky enough to pick a hot Genomic stock as his first trade.The stock shot up from 20 to 70 in a few days. When I asked him how hewas going to exit, he replied, “I’m going to wait until it hits 300 so I can
Lessons Learned 179

tell my friends I was in it at 20.” A few days later the stock implodedand was trading below his entry.
The moral: If you want to really impress your friends, throw a party andspring for the beer.
BALANCESharon achieved the success that many aspiring traders dream of. In ashort period of time, she amassed a small fortune through her trading.This was not done through pure luck alone. She studied the marketsmorning, noon and night. She did not take trading casually, it was herlife. In fact, she worked so hard that it was beginning to cause problemswith her home life. She finally had to choose between trading and herfamily. She realized that if she chose trading, eventually the tremendouspsychological burden from her family would hurt her performance. Shechose her family and placed most of her profits with a professionalmoney manager with a long-term track record.
The moral: Work hard, but balance your life.
I’M THE KING OF THE WORLDIn late February of 2000, I was having my best year ever in my privatetrading. I was up several hundred percent in nearly all of my accounts.Further, my ego was being fed by the readers of my TradingMarkets.comstock column. They were sending me e-mails praising my stock-pickingabilities. On top of all this, my wife was scheduled to deliver my firstchild in a few weeks. I felt bulletproof and invincible, kind of like Leo-nardo DiCaprio’s character on the front of the Titanic. Jeff Cooper warnedme that it wasn’t a good idea to trade around major life events. He sug-gested that I bank profits and take a break for a while. Unfortunately, Ididn’t heed his advice. I continued to trade actively. In fact, I was evenplacing trades from the delivery room in between my wife’s contractions.Ironically, my daughter, Isabelle Florence, was born minutes after theNasdaq closed above 5,000 for the first time in history. As I held her upto the CNBC screen for my bragging pictures, I remember thinking that,at the rate I was going, I would have her college paid for within the nextfew weeks. I was invincible.
180 Chapter 13

Follow-up: My accounts peaked the same day my daughter was born.Although I was able to stay in the black, I gave up a significant portionof the profits over the next month or so.
The moral: The “king of the world” eventually went down on the Titanic.Keep your ego in check and don’t trade around major life events.
Lessons Learned 181


SECTION SEVEN
PUTTING THEPIECES TOGETHER3 3 3 3 3 3 3 3 3 3 3 3 3 3 3 3 3 3 3 3 3 3 3 3 3 3 3 3 3 3 3
183


CHAPTER 14
NIGHTLY PREPARATION3 3 3 3 3 3 3 3 3 3 3 3 3 3 3 3 3 3 3 3 3 3 3 3 3 3
If people only knew how hard I worked to gain my mastery,it wouldn’t seem so wonderful at all.
—Michelangelo Buonarroti
As I stated in Trader’s Psychology, money is the ultimate motivator. Assuch, it attracts some of the brightest minds in the world. I can assure youthose on the other sides of your trades are prepared. And they are all toohappy to take your money away from you if you are not. The following ishow I prepare for the next trading day. It’s a lot of work, but for me it’s likebeing on a treasure hunt.
POSTMORTEMRight after the market closes, I take a few minutes to review and recon-cile the day’s trades and plot my equity. I then find a quiet place andspend 5–10 minutes mentally reviewing the day’s actions. As mentionedin Trader’s Psychology, it is at this time that I think about what tradeswere taken and why, what went right, what went wrong, what could Ihave done better and so on and so forth. I then make the appropriatenotes in my trading journal.
185

ANALYZE A SMALL DATABASEI keep a small database of 400-600 stocks that I download shortly afterthe close. The database contains the bellwether and popular stocks suchas Intel and Microsoft, the 30 Dow Jones Industrial Average stocks, manytech issues from the Nasdaq 100, a few cyclicals such as oils and oil ser-vice and representative stocks from a variety of sectors. The above makesup the core database and it rarely changes. The remainder of the data-base is made up of momentum stocks and the current “glamour” stocks.I cull these out as they drop below certain levels (usually $10 per share)or lose momentum. New stocks for the database are found by goingthrough momentum lists, such as the TradingMarkets.com ProprietaryMomentum (and Implosion) lists, TradingMarkets.com StockScanner,talking with other traders, stocks mentioned on CNBC and any otherstocks I find in my nightly analysis. This database grows and shrinks asvarious sectors heat up and cool off.
My charting software allows me to “click” through each and every chartin this database. On average, I spend between 2-3 seconds on each chart.Even though I have scanning software to scan for most of the patternslisted in this manual (more on this below), I still like to look through thecharts because it gives me a feel for what’s going on in the markets.Sometimes I can pick up on “themes” that cannot be found via com-puter-based scans or through overall sector analysis. For instance, Imight notice some “hidden” aspects, such as pockets of strength in other-wise down sectors, or “old tech,” or under-performing “new tech.”
In going through the charts, I’ll also stop and analyze any chart thatmade a large move for the day. I then ask myself, could I have predictedthis ahead of time? Is it one of my patterns? Is it possibly a new pattern?
The exercise of actually going through all of these charts (versus relyingsolely on the computer scans) not only unearths potential for the nexttrading day, it also makes me a better chart reader. It’s no different than amusician practicing.
ANALYZE SPECIALIZED DATABASESDepending on market conditions, I often keep separate small databasesfor specific sectors. For instance, in late 1999/early 2000 the Genomicstocks were on fire. Therefore, I’ll keep a completely separate database ofonly these stocks during such periods. This helps to me to focus on thehottest stocks in the hottest sectors. Obviously, these databases change
186 Chapter 14

with the times. They range from the complete sector (such as telecommu-nications) down to a specific niche within that sector (e.g., fiber optics).
ANALYZE IPOsI also keep a small database of the Initial Public Offerings (IPOs) thatwent public over the last three months. These can be found throughInternet sources such as TradingMarkets.com and IPO.com. Often thesenewer stocks offer great swing-trade setups as the euphoria over thepromise outweighs the reality. As nimble swing traders, we can oftencapture a piece of these moves before that reality sets in.
SECTOR ANALYSISAfter completing my analysis of the above databases, I then look throughthe main sector charts such as the semiconductors, banks, biotech, oil ser-vice, major drugs, gold and silver, broker/dealer, telecommunications,etc. I look for setups in these sectors, bigger-picture patterns and momen-tum in general.
OVERALL MARKET ANALYSISI then look at what the overall indices are doing. This analysis was cov-ered in detail under Chapter 10, Market Timing for Swing Trading.
STUDY FUTURES MARKETSI download and analyze about 30 active futures markets. Even if youdon’t intend on trading futures, it’s a good idea to know what’s going onhere because markets don’t exist in a vacuum. For my stock swing trad-ing, I pay careful attention to what’s going on in the index futures andthe bond market. I’ll also analyze what’s going on in the currency mar-kets and commodities in general (e.g., crude oil).
ANALYZE SCANSAll of the above takes between one-and-a-half and two hours. Duringthis time, I have scans running on my main database of over 5,000 activestocks. These scans give me pullbacks, Double Top Knockouts, Bow Tiesand most of the other patterns and concepts outlined in this manual.
Nightly Preparation 187

I also look at all of the stocks produced by TradingMarkets.com indica-tors. Not only does this provide me with potential setups, but it also maygive me themes that I might not have picked up on through my ownanalysis and scans. Further, it also often provides me with stocks thatmay be worth watching for setups over the next few days.
FINAL PREPI then take all of the above analyses and put together my game plan. Imake a list of the stocks I want to watch for the following day. I alsocheck to see if they are optionable, make specific notes about where Ishould enter and where my protective stops should be placed. I plug thestocks into my quote screen and set alarms near the trigger points.Finally, I check the after-hours index futures for any late-breaking newsthat could throw a wrench in any of my analyses.
When I arrive at my office the next morning, I have a game plan in frontof me and my screens are ready to go. There’s no last-minute stress orscrambling involved with not being prepared. I sip my coffee and waitfor the opening.
Q&AQ. You mentioned spending only 2-3 seconds per chart while tooling
through your small database of up to 600 stocks. What can be gath-ered in such a small amount of time?
A. A time of 2-3 seconds is only an average. If I don’t like a chart, I mightonly spend a fraction of a second on it. On others, I might spend aminute or longer or make a note to come back to it later.
Q. How do you know to spend only a “fraction of a second on a chart”?
A. After a while you begin to memorize the charts. For instance, I knowthat XYZ has been trading in a low-level base for months. When I getto this chart, unless the chart is showing some signs of life, I think, oh,that’s XYZ, I see it’s still in the toilet. Next!
Q. Why not rely solely on the scans?
A. Most people are looking for the easy way out, and the scans do awonderful job of reducing the workload and finding setups. However,
188 Chapter 14

looking at charts gives you a much better picture of what’s going onunder the surface.
Q. Why look at so many charts?
A. I’m a technician. And technicians predict the markets through the useof charts. The more charts I look at, the better I get.
Q. By looking at so many charts, obviously you must see lots of stockstake off or implode (for shorts). By missing these setups, doesn’t thisirritate you?
A. It used to. Now it just motivates me to see if I could have caught itahead of time. This makes me a better chart reader.
Q. You said you set up your quote screen with alarms “near” your en-tries. Why not at your entries?
A. When a stock triggers, especially if it’s an obvious setup, it can moveawfully fast. I want to know when it’s getting close to triggering. Idon’t want to know after the fact.
Q. Do you ever enter before the trigger?
A. If the markets are really in gear, then I might attempt to enter early,use a tighter-than-normal stop and look to re-enter if stopped out.Conversely, if the overall environment is mediocre, I might let setupstrigger and wait to see if they follow through or possibly wait for asecond entry.
Q. For your own scans, do you have parameters to reduce the number ofstocks that fit the pattern?
A. Yes. My goal with my scans is to show myself the best setups on thebest stocks. Often I’ll use historical volatility and ADX as filters alongwith minimum volume requirements.
Q. Where do you set these parameters?
A. I normally set the average volume to 100,000 or higher. For the HV, Inormally keep it above 40 but may raise it to as high as 80 dependingon market conditions. ADX, when used, also varies. I’ll usually keep itat 25 or higher, but raise or lower that threshold depending on overallmarket conditions.
Nightly Preparation 189

Q. You mentioned you look at the futures market. The indices and bondmarket makes sense, but why other commodities?
A. It all depends on the situation. If crude oil is at 10-year highs and itlooks like it’s going even higher, then that will likely drive interestrates higher and affect the indices. Markets are interrelated. For in-stance, in the summer of 2000, someone joked on Bloomberg that ifyou predict the stock market, the euro and the crude oil market, thenyou can trade bonds.
Q. Are there any fixed relationships?
A. There used to be. For instance, you could pretty much predict thebond market with the stock market and vice versa. Now it seems thatthe relationships matter only when traders decide to fixate on them.However, they’re still worth watching.
Q. You mentioned you check to see if the stocks you are interested in areoptionable. What are you looking for here?
A. If the options are cheap enough, occasionally I might just buy optionsversus the underlying stock. Or, I know that I might be able to usethem to hedge, should I be blessed with a profit. I also look to see ifthere is a large open interest in a particular strike, especially when ex-piration is near.
Q. Some traders stress the importance of writing down market stats, forc-ing them to recognize market conditions. Do you do a similar exercisedaily?
A. This is a wonderful exercise. One of the most successful traders Iknow wakes up early each morning and fills out a sheet of about 50market statistics. He has done this religiously for the past 30 years.
In the past, I used to keep daily stats. In fact, I have tons of notebooksfull of market data lying around my office collecting dust. I would rec-ommend anyone getting started to do similar exercises. Due to timeconstraints, I now lean on my computer to keep the database for me. Iwill note any anomalies or extremes in my trading journal.
Q. Such as?
A. If the VIX is at an extremely low level historically, I’ll make a note of itand take notes on what it has done in the past during similar condi-tions. Things like this often become an early warning system.
190 Chapter 14
CHAPTER 15
MORE EXAMPLES3 3 3 3 3 3 3 3 3 3 3 3 3 3 3 3 3 3 3 3 3 3 3 3 3 3
MONEY-MANAGEMENT EXAMPLES
191

On 07/14/2000, Immunex Corp. (IMNX) sets up as a simple four-bardeep pullback:
1. An entry on 07/15/2000 is triggered at 57 15/16, 1/16 above the priorday’s high.
2. Because the low of the formation is more than 5% away from the en-try, a protective stop is placed at 54 15/16 for a 3-point risk (approxi-mately a 5% risk).
3. IMNX rallies over 3 points to 60 15/16 and we exit half of our posi-tion.
4. The protective stop is moved up to breakeven (57 15/16, the same asthe entry), and we are stopped out for a scratch on the remainder ofthe position.
5. The market gaps lower and trades below our original entry. As youcan see, if money management was not used, this overall profitabletrade would have resulted in a loss.
192 Chapter 15
FIGURE 15.1
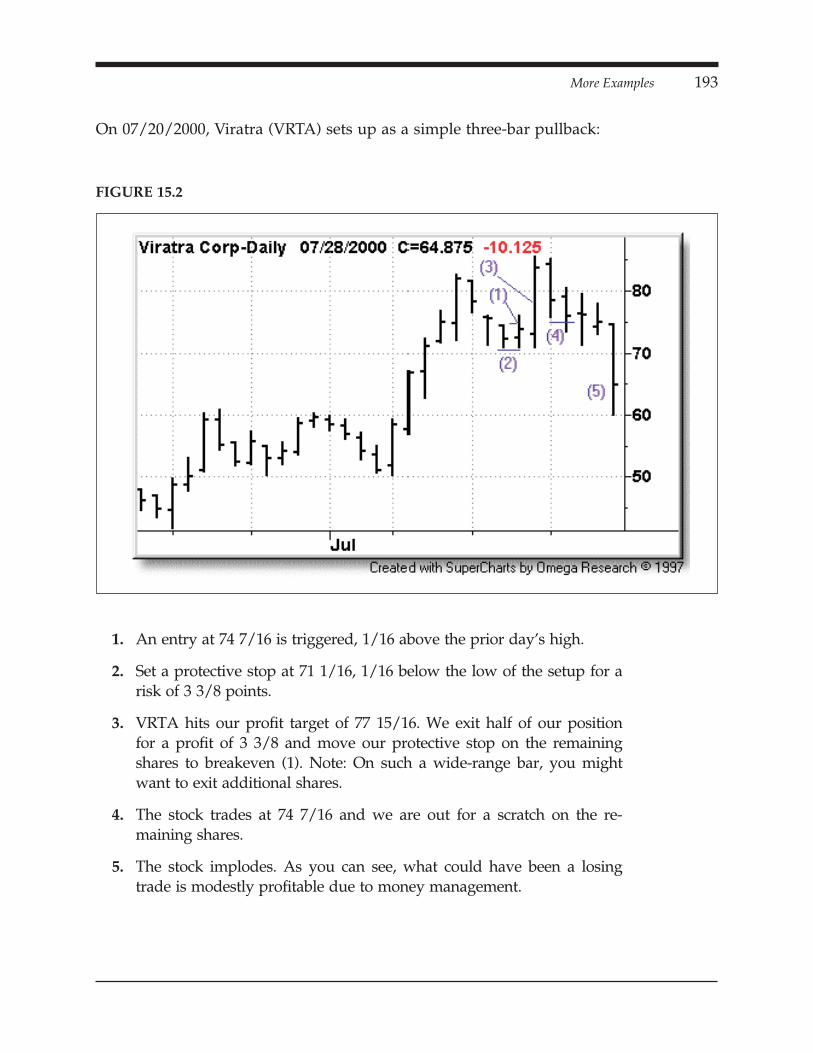
On 07/20/2000, Viratra (VRTA) sets up as a simple three-bar pullback:
1. An entry at 74 7/16 is triggered, 1/16 above the prior day’s high.
2. Set a protective stop at 71 1/16, 1/16 below the low of the setup for arisk of 3 3/8 points.
3. VRTA hits our profit target of 77 15/16. We exit half of our positionfor a profit of 3 3/8 and move our protective stop on the remainingshares to breakeven (1). Note: On such a wide-range bar, you mightwant to exit additional shares.
4. The stock trades at 74 7/16 and we are out for a scratch on the re-maining shares.
5. The stock implodes. As you can see, what could have been a losingtrade is modestly profitable due to money management.
More Examples 193
FIGURE 15.2

Anadigics (ANAD) sets up as a Double Top Knockout (DT-KO):
1. The stock triggers an entry at 52 1/16.
2. The low of the setup bar is more than 5% away from our entry, so weplace our protective stop at 49 7/16 for a risk of approximately 5% (25/8 points).
3. The stock rallies to 54 11/16 and we lock in half of the profits for a 25/8-point gain.
4. We move our stop to breakeven (the same as the entry).
5. Trail a stop higher. Here we used a simple two-bar low. As swingtraders, we would look to continue to scale out of the position as itcontinues to move in our favor and would likely have been out by theend of the seventh day. If you were willing to stay in the market forextended periods, you could have trailed a stop on a piece of the posi-tion. In this case, this simple trailing-stop technique would have keptyou in for a 38-point run.
194 Chapter 15
FIGURE 15.3
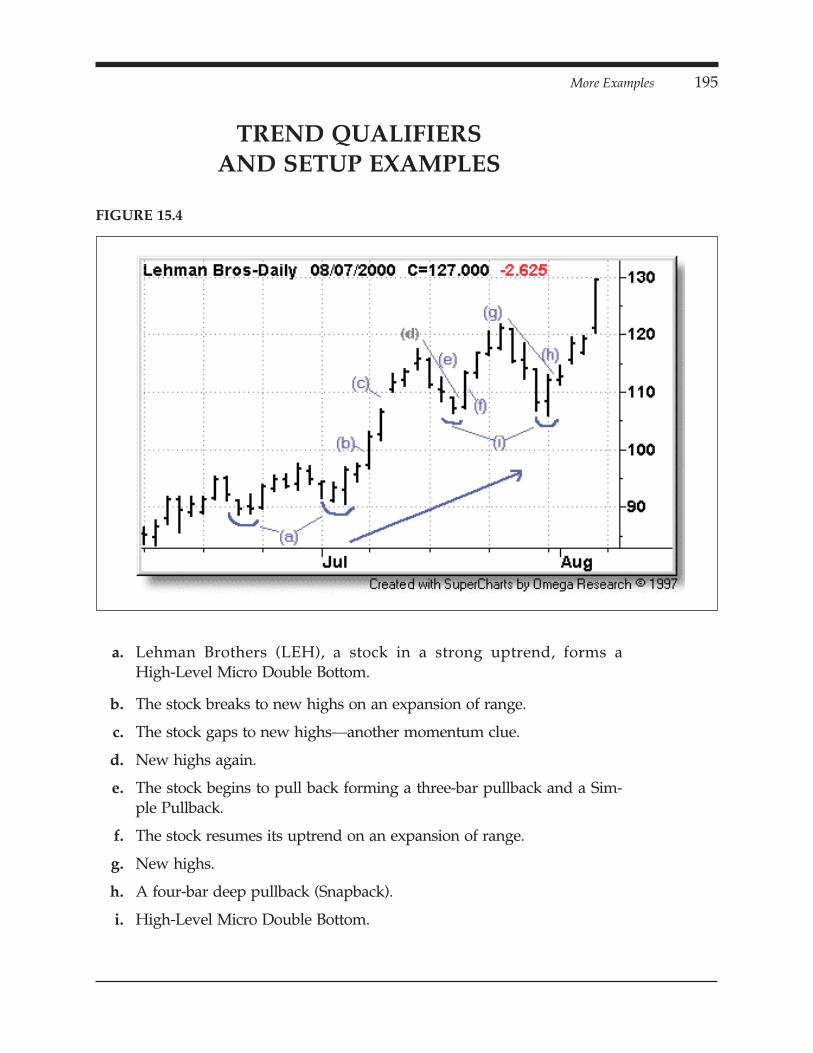
TREND QUALIFIERSAND SETUP EXAMPLES
a. Lehman Brothers (LEH), a stock in a strong uptrend, forms aHigh-Level Micro Double Bottom.
b. The stock breaks to new highs on an expansion of range.
c. The stock gaps to new highs—another momentum clue.
d. New highs again.
e. The stock begins to pull back forming a three-bar pullback and a Sim-ple Pullback.
f. The stock resumes its uptrend on an expansion of range.
g. New highs.
h. A four-bar deep pullback (Snapback).
i. High-Level Micro Double Bottom.
More Examples 195
FIGURE 15.4
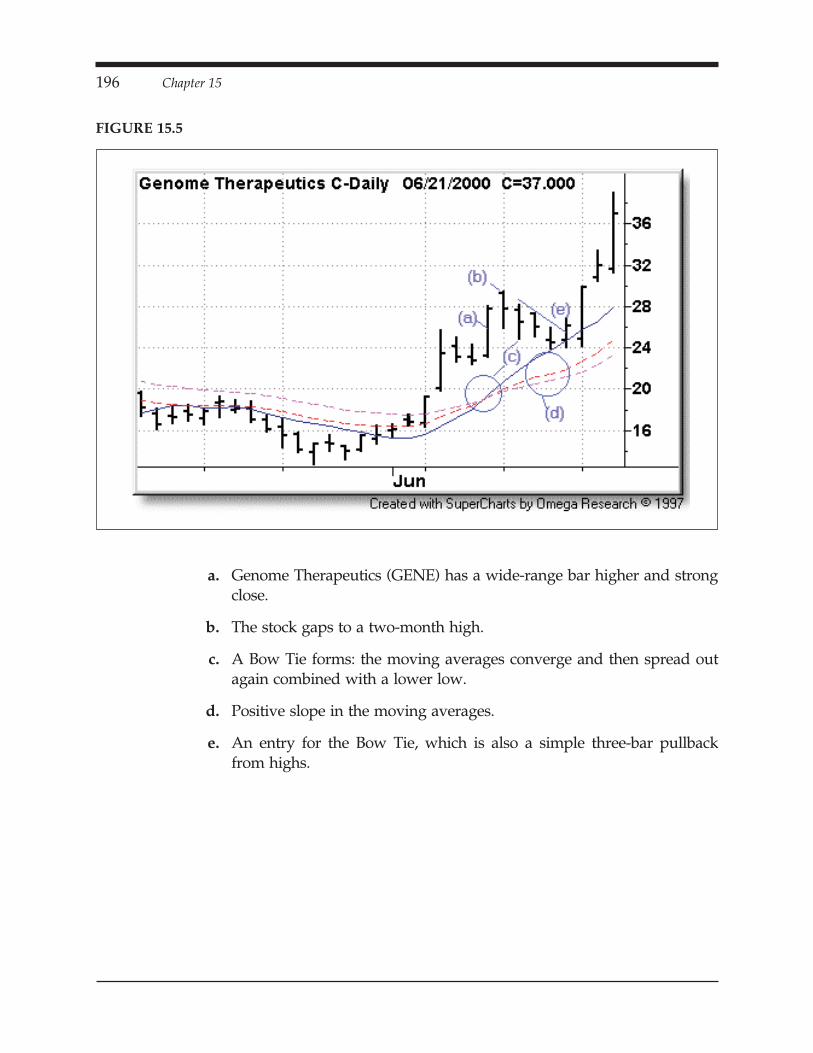
a. Genome Therapeutics (GENE) has a wide-range bar higher and strongclose.
b. The stock gaps to a two-month high.
c. A Bow Tie forms: the moving averages converge and then spread outagain combined with a lower low.
d. Positive slope in the moving averages.
e. An entry for the Bow Tie, which is also a simple three-bar pullbackfrom highs.
196 Chapter 15
FIGURE 15.5

a. Transwitch (TXCC) forms a high-level “running saucer.”
b. Double Top Knockout.
c. The trend resumes . . . Daylight.
d. Positive slope in the moving averages.
e. Simple four-bar pullback.
More Examples 197
FIGURE 15.6
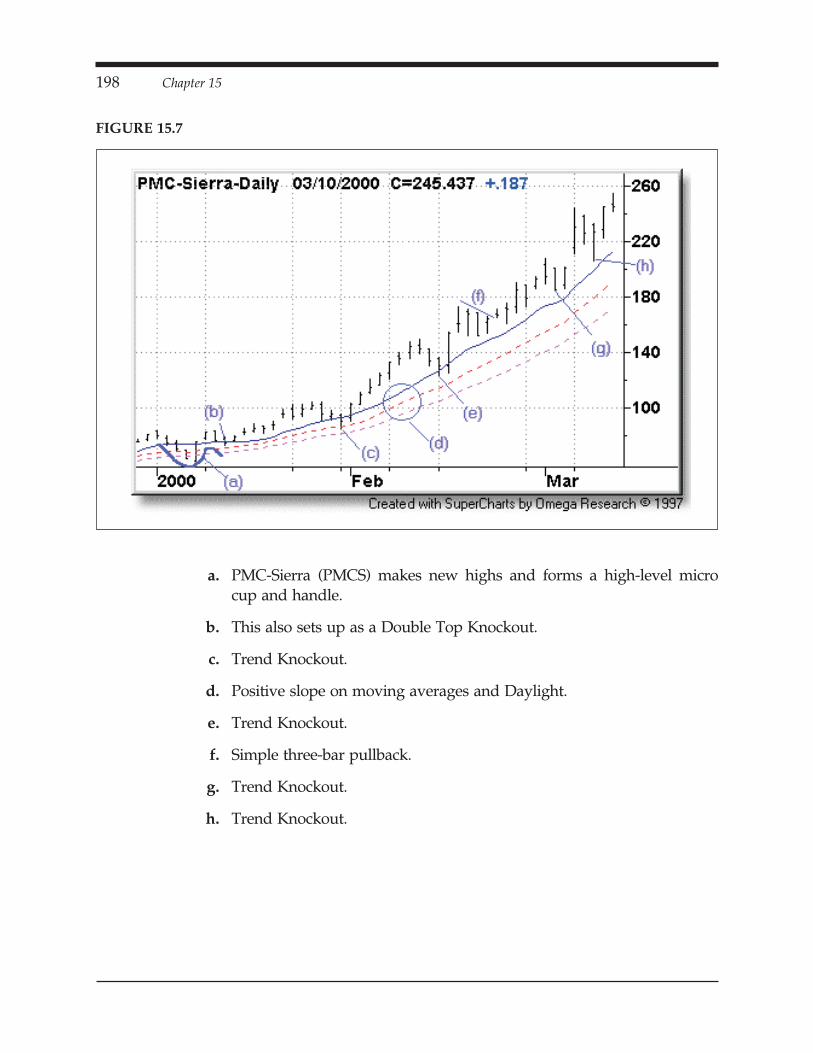
a. PMC-Sierra (PMCS) makes new highs and forms a high-level microcup and handle.
b. This also sets up as a Double Top Knockout.
c. Trend Knockout.
d. Positive slope on moving averages and Daylight.
e. Trend Knockout.
f. Simple three-bar pullback.
g. Trend Knockout.
h. Trend Knockout.
198 Chapter 15
FIGURE 15.7

a. Viratra Corp. (VRTA), a stock in a strong uptrend, makes a new high.
b. Three-bar pullback.
c. Positive slope in 10-SMA, 20-EMA and 30-EMA. Also, Daylight (lowsgreater than moving averages).
d. New High.
e. Simple six-bar pullback.
f. Simple three-bar pullback.
g. Trend Knockout.
More Examples 199
FIGURE 15.8

a. Daylight.
b. Wide-range bar higher/base breakout.
c. Three-bar pullback.
d. Another pullback.
e. Daylight, positive slope.
f. Trend Knockout (TKO).
g. TKO.
200 Chapter 15
FIGURE 15.9
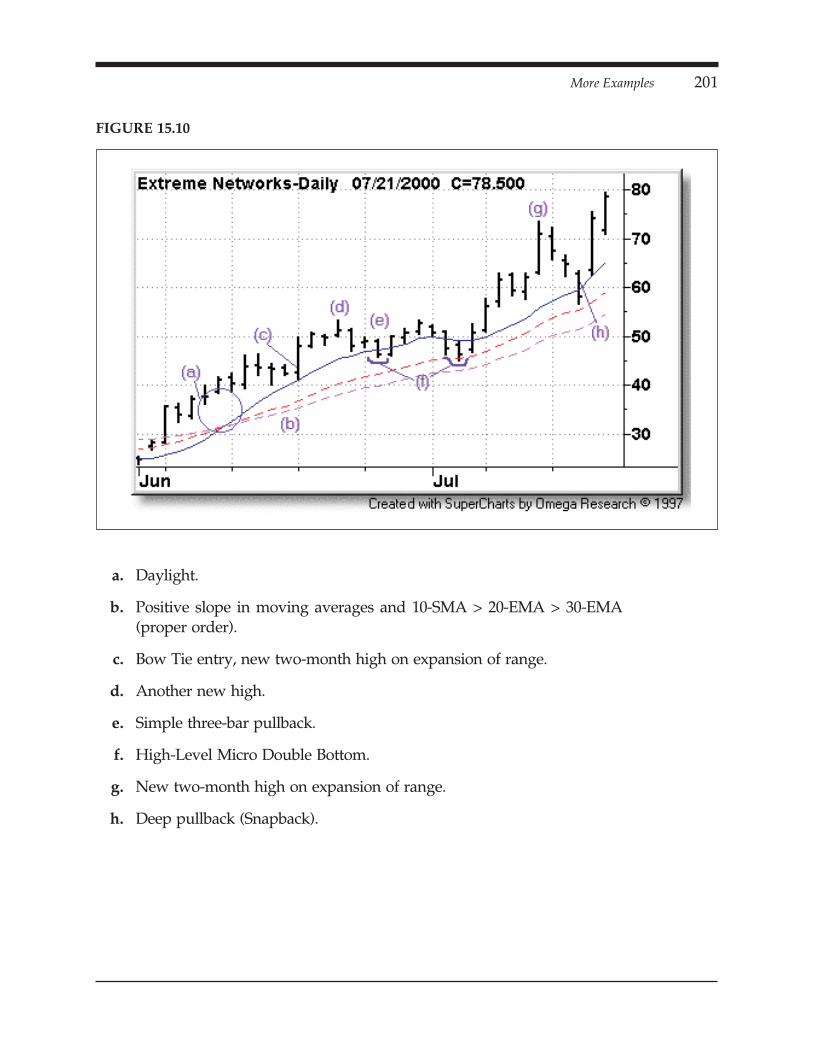
a. Daylight.
b. Positive slope in moving averages and 10-SMA > 20-EMA > 30-EMA(proper order).
c. Bow Tie entry, new two-month high on expansion of range.
d. Another new high.
e. Simple three-bar pullback.
f. High-Level Micro Double Bottom.
g. New two-month high on expansion of range.
h. Deep pullback (Snapback).
More Examples 201
FIGURE 15.10
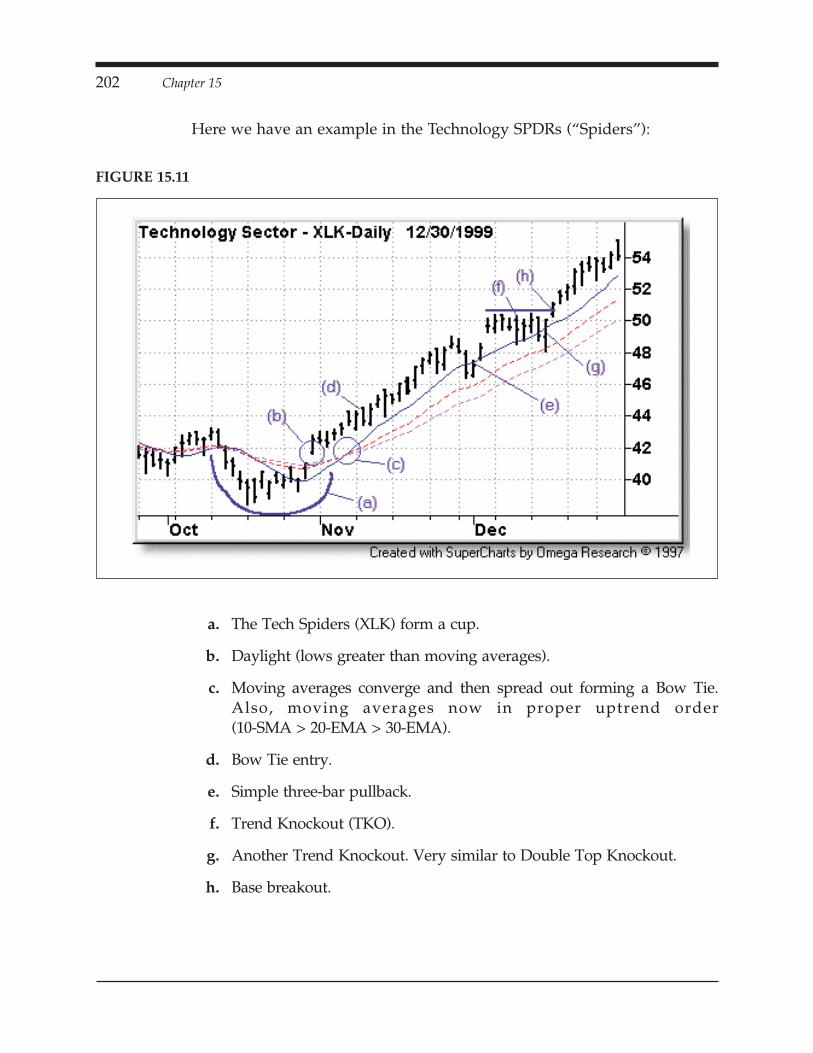
Here we have an example in the Technology SPDRs (“Spiders”):
a. The Tech Spiders (XLK) form a cup.
b. Daylight (lows greater than moving averages).
c. Moving averages converge and then spread out forming a Bow Tie.Also, moving averages now in proper uptrend order(10-SMA > 20-EMA > 30-EMA).
d. Bow Tie entry.
e. Simple three-bar pullback.
f. Trend Knockout (TKO).
g. Another Trend Knockout. Very similar to Double Top Knockout.
h. Base breakout.
202 Chapter 15
FIGURE 15.11

CHAPTER 16
MORE THOUGHTS3 3 3 3 3 3 3 3 3 3 3 3 3 3 3 3 3 3 3 3 3 3 3 3 3 3
Q. Why write this book?
A. It’s funny. Trading is about the only profession in which you get criti-cized for writing a book. I suppose it’s because the business is a com-petitive one and not a cooperative one. I’ll admit that I did write it forthe obvious reasons: ego and money. It would be great to be knownas an authority on swing trading. Making some money in the processdoesn’t hurt either. However, there’s something over and above theobvious. I have struggled for years to become a successful trader.There were times during extended drawdowns when I felt completelyworthless. In spite of all my formal education, during these periods Ifelt like about all I was good for was flipping burgers. Knowing howpainful this is, I would hate to see any struggling trader go throughthis process. My intent was to write a complete manual that anytrader serious about being successful could follow. Also, though it wasnot my original intent, soon after I began writing, this manual becamea manual for me. It forced me to realize when I was violating my ownrules. Putting everything down in writing cemented the process. Infact, 90% of my losing trades while writing this book occurred when Ididn’t follow my own rules.
203

Q. Are you worried that someone will come in, take your patterns anderadicate the edge?
A. My patterns are all designed for swing trades. Large traders and insti-tutions can’t make money on this time frame. Due to their size, theyhave to scale in over a period of days to weeks. Also, if someone hasachieved the status of a “large trader” or institution, chances are theyhave their own ways of doing things. They’re not going to run outand read a book and apply the concepts. One last point: most peoplewhen they read about a method don’t follow it to a “T.” They puttheir own twist on it.
Q. What would you suggest to a beginner who’s dedicated to learninghow to trade?
A. First and foremost, they should learn as much as possible aboutmoney management. Memorize the drawdown charts. Know that ifyou lose half of your money, it’ll take a 100% gain to get back tobreakeven. Look at charts, lots of charts. Find something simple andstick with it. Also, be optimistic but realistic. Some of the best moneymanagers in the world, on average, only return between 20% and 30%per year, but do so with very minimal drawdowns year in and yearout.
Q. Are there any traits in beginning traders that would suggest to youthat they will eventually become successful?
A. We’re all setup junkies, so most of the people who approach me havequestions about patterns and charts. However, when someone asksme a money management question, I have the utmost respect for himor her. I immediately think, now here’s a guy (or gal) who’s going tobe successful. Hard work is also vitally important. Trading, on the sur-face, looks like the complete life of leisure. You click a few keys, rakein the cash and then go sit on your yacht to count your money. In re-ality, it’s a lot of hard work. I have yet to meet a successful trader whoputs in fewer hours than those in the corporate world. I was once at aseminar surrounded by six traders who were dying to know how I goabout finding stocks to trade. I explained to them that I first toolthrough about 600 charts after the close. Four of the “traders” lookedat each other, shook their heads and walked off. I suppose they ex-pected me to say, “Oh, I run a magic scan and then I’m off to thebeach.” The two remaining individuals began to bombard me withquestions: “What charting software do you use?” “Who is your data
204 Chapter 16

vendor?” “How fast is your computer?” “How big are your moni-tors?” and so on and so forth. If I had to put money on who would besuccessful out of the six, I think I know which two to bet on.
Q. You have many setups. Do you trade them all?
A. Obviously, everything doesn’t set up every day. But, yes, unlike manywho publish patterns for the sake of publishing, I use every pattern inthis manual either directly in trading or in helping me develop a gameplan for trading.
Q. What setups do you mostly focus on?
A. I focus mostly on the basics, which are covered in the first section ofthe manual. In fact, this probably makes up about 90% of what I do.The rest is based on more advanced concepts.
Q. Referring to your advanced techniques, are there any patterns that youwill almost always take?
A. On the more rare patterns, such as the Double Top Knockout, I’llwatch for entries. I suppose this is because not too many stocks set upat any given time, making it easy to track. Also, I’ll strongly considerany pattern that sets up as a combination, such as a shallow pullbackin a low volatility situation.
Q. Do you trade every day?
A. Because I write a nightly analysis for TradingMarkets.com, I’m forcedto do my homework. Through this, I can usually find somethingworthwhile. However, if I encounter a string of losses, I’ll back wayoff and possibly even quit for a while until I can figure out if it’s meor the markets.
Q. What percentage of your trades are correct?
A. In trading, the results are skewed. It can get really streaky. There aretimes when I will go weeks on end and 90% to 100% of my trades arewinners. Other times, it’s just the opposite. You have to realize thatthe majority of your profits come from the minority of trades. If I had tocome up with an average, I’d say about 50% to 60%. But, I no longerworry about being right, instead I focus on making money.
Q. Your examples show exactly where to get in and exactly where toplace your protective stops. Can you elaborate more on what to do af-
More Thoughts 205

ter you’ve entered and placed your stops? In other words, how tomanage the position.
A. The secret to position management is taking half of your profits oncethey are equal to or greater than your initial risk and then movingyour stop to breakeven (2-for-1 Money Management). This will gener-ate income for your account. This income is vital to long-term survivalsince it will help to cover the inevitable and often frequent small lossesassociated with swing trading.
Q. Okay, suppose you are fortunate enough to have taken half of yourprofits and you have moved your stop on your remaining shares tobreakeven. How do you manage the remainder of the position?
A. You’re in a great place from both a psychological and a financial posi-tion once you have moved your stop to breakeven. This is the easypart. I look to do two things: continue to scale out and trail stops. IfI’m lucky enough to get a parabolic move (e.g., a sharp move higherin a long position), then by all means I take most, if not all of it.
Q. You didn’t talk much about trailing stops. Can you elaborate?
A. It’s really not rocket science. One of my favorite techniques is to trail astop below the lowest low of the prior two bars (for longs). So, if onMonday the low is 98 and the low for Tuesday is 100, then going intoWednesday I’ll ratchet my stop up to 97 15/16, right below the lowestof the two prior days. I have an example of this under More Examples(Chapter 15).
Q. What about time stops?
A. After five or six days I find my patience starts to wane. I’m usuallyout by the seventh day unless I’m fortunate enough to be in a strongtrend. At this point, I’ll continue to trail a stop.
206 Chapter 16

CHAPTER 17
READY, SET, WAIT!3 3 3 3 3 3 3 3 3 3 3 3 3 3 3 3 3 3 3 3 3 3 3 3 3 3
This manual is the culmination of over 10 years of research, market analy-sis and trading. I strongly believe that I have included everything that aswing trader needs in order to take on the markets and be successful. This isnot to say that you should run out and try all of the methods and conceptsimmediately. Ease into it, especially if you are fairly new to trading. Studyeach pattern and setup in this book. If it makes sense to you, research it andfind historical setups. Which ones worked? Which ones didn’t? What werethe market dynamics at that time? What were the sector dynamics? Is therea modification to the setup that would lend itself more to your style of trad-ing? Are there money-management techniques you could implement thatwould allow you to control risk or capture larger profits? Once you’ve doneyour homework, then paper trade methods. Be a realist and carefully docu-ment your records—timestamp your “trades” or use a tracking service.
After you have completed the above due diligence, make sure you gothrough one final checklist before jumping into the markets:
What is the setup?
Where is your entry?
Where is your protective stop?
Where will you look to scale out?
207

What is the overall market doing?
Are there any systems that are triggering?
Is there momentum?
Are there any setups that are triggering?
What is the sector doing?
Is there momentum?
Are there any setups that are triggering?
Are you focused, free of distractions and of sound body and mind?
After you have answered all of the above, you should be ready to facethe markets.
208 Chapter 17

CHAPTER 18
CLOSING THOUGHTS3 3 3 3 3 3 3 3 3 3 3 3 3 3 3 3 3 3 3 3 3 3 3 3 3 3
As I complete this manual in late 2000, many of the biggest and best namesassociated with a “buy and hold” portfolio have been decimated. Home De-pot (HD), Intel (INTC), Microsoft (MSFT) and America Online (AOL) aredown over 50% from their highs; Yahoo! (YHOO) and AT&T (T) have lostover 60% of their value since the beginning of the year; Lucent (LU) has lostover 70% of its value during the same period and Apple Computer (AAPL)is 80% off its highs. The list goes on and on.
My method of swing trading allows you to a) participate in the bestnames at the most opportune times and b) when wrong, avoid beingcaught in debacles such as those listed above.
Best of luck with your trading!
Dave Landry
P.S. Protective stops on every trade!
209
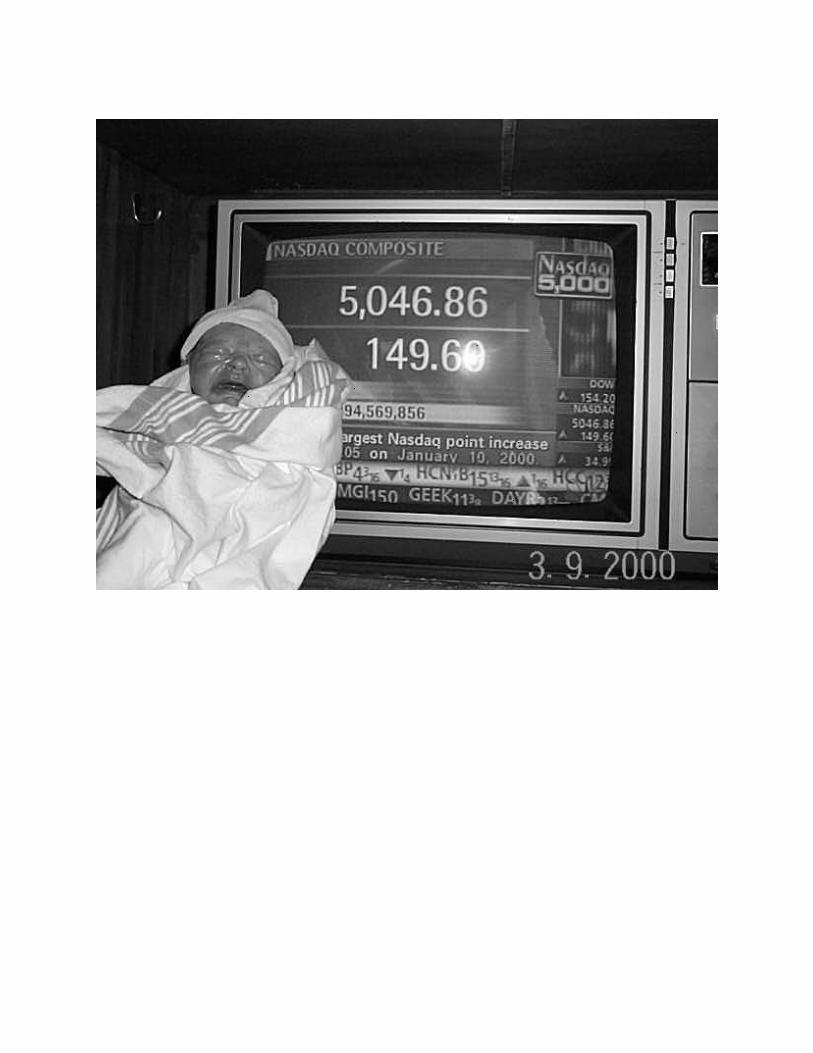
APPENDIX3 3 3 3 3 3 3 3 3 3 3 3 3 3 3 3 3 3 3 3 3 3 3 3 3 3
FORMULASWhile the following formula for historical volatility may be of use to a mathema-tician, you should ideally have a software program calculate this for you.
CALCULATING HISTORICAL VOLATILITY
Let Length = length of volatility to be calculatedand ln = natural logarithm
Historical Volatility(length) = standard deviation(ln(close/yesterday’sclose),length) ∗ 100 ∗ square root (256).
In English:
1. Divide today’s close by yesterday’s close.
2. Take the natural log of #1.
3. Take the standard deviation of #2 for length desired (the number oftrading days, i.e., 50).
4. Multiply #3 by 100.
5. Multiply #4 by the square root of the number of trading days in 1 year(around 256).
211

GLOSSARYThe following terms are used throughout this manual. Even if you are amore advanced trader, you might want to skim this section to see howthey are defined for purposes of this manual.
Average Directional Movement Index (ADX)—Developed by WellesWilder, this formula is used to measure the strength of a market but notits direction. The higher the reading, the stronger the trend, regardless ifit is up or down. It is calculated based on the Positive Directional Move-ment Index (+DMI) and Minus Directional Movement Index (–DMI). See“Plus Directional Movement Index” and “Minus Directional MovementIndex” in this Glossary, and “Capturing Trends Through ADX” in thisappendix for more information.
Bar Chart—Shows the open, high, low and close of a market.
Downtrend—A series of lower lows and lower highs.
212 Appendix

+DMI—see Plus Directional Movement Index.
–DMI—see Minus Directional Movement Index.
Exponential Moving Average—A moving average that gives higherweighting to more recent prices.
Fading—Trading contrary to the trend.
Gap Down—Today’s open is less than yesterday’s low.
Gap Up—Today’s open is greater than yesterday’s high.
Appendix 213
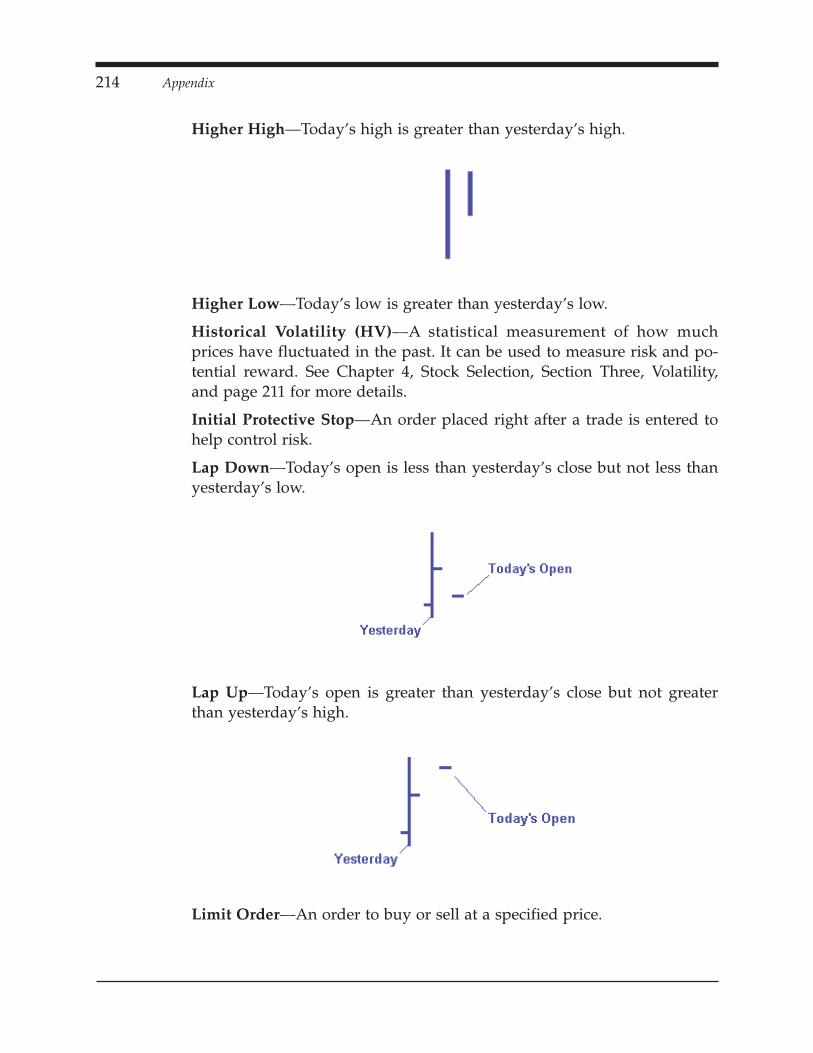
Higher High—Today’s high is greater than yesterday’s high.
Higher Low—Today’s low is greater than yesterday’s low.
Historical Volatility (HV)—A statistical measurement of how muchprices have fluctuated in the past. It can be used to measure risk and po-tential reward. See Chapter 4, Stock Selection, Section Three, Volatility,and page 211 for more details.
Initial Protective Stop—An order placed right after a trade is entered tohelp control risk.
Lap Down—Today’s open is less than yesterday’s close but not less thanyesterday’s low.
Lap Up—Today’s open is greater than yesterday’s close but not greaterthan yesterday’s high.
Limit Order—An order to buy or sell at a specified price.
214 Appendix

Long—A position that seeks to profit if the market rises. To buy.
Lower High—Today’s high is less than yesterday’s high.
Lower Low—Today’s low is less than yesterday’s low.
Market Order—An order to be executed immediately at the asking pricefor buys and at the bid price for sales.
Minus Directional Movement Index (–DMI)—A component used in thecalculation of the ADX that measures the downward movement of amarket. If it is greater than the Positive Directional Movement, it sug-gests a downtrend.
Moving Average—The average price of a stock over a given period. Forinstance, a 10-day moving average would be the sum of those prices di-vided by 10. See Chapter 3, Trend Qualifiers, for more details.
Outside Day—Today’s high is greater than yesterday’s high and today’slow is less than yesterday’s low.
Appendix 215
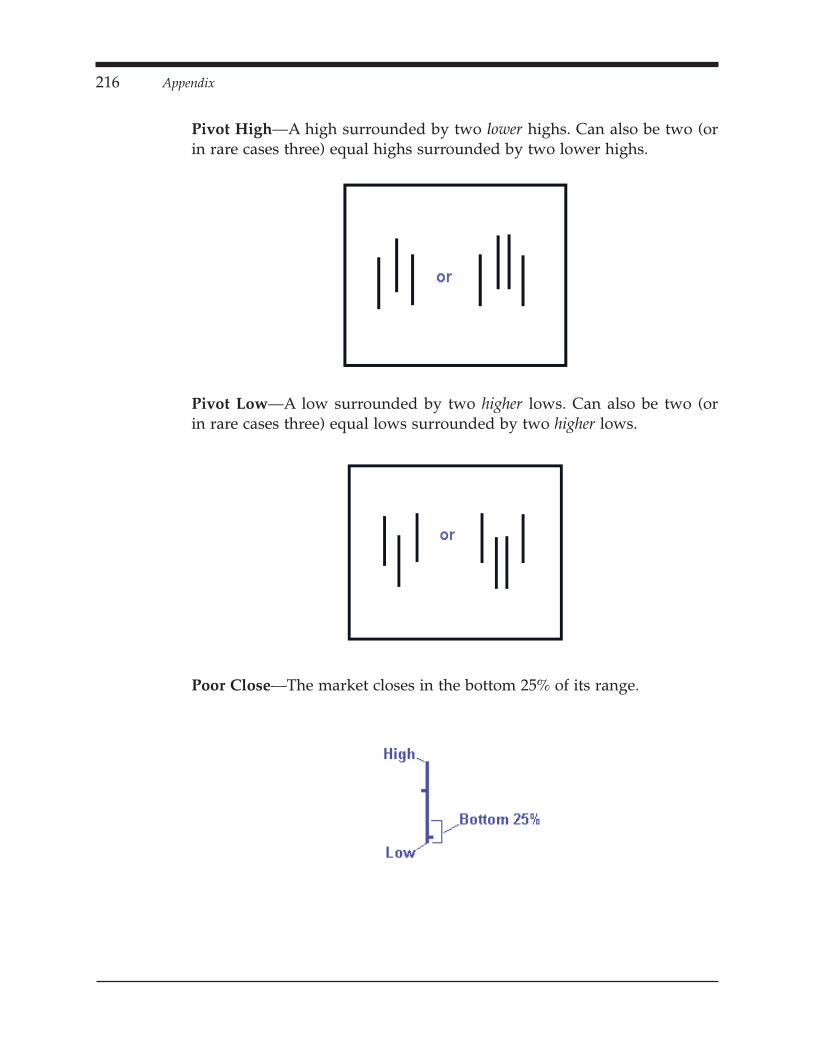
Pivot High—A high surrounded by two lower highs. Can also be two (orin rare cases three) equal highs surrounded by two lower highs.
Pivot Low—A low surrounded by two higher lows. Can also be two (orin rare cases three) equal lows surrounded by two higher lows.
Poor Close—The market closes in the bottom 25% of its range.
216 Appendix

Plus Directional Movement Index (+DMI)—A component used in thecalculation of the ADX that measures the upward movement of a market.If it is in greater than the Negative Directional Movement Index (–DMI),it suggests an uptrend.
Protective Buy Stop—Used to help control losses when shorting stocks.The order is placed above the current price of the stock. It becomes a mar-ket order if the stock trades at or above the specified price.
Protective Sell Stop—Used to help control losses when buying stocks.The order is placed below the current price of a stock. It becomes a mar-ket order if the stock trades at or below the specified price.
Range—The high price of the day minus the low price of the day. Seealso “True Range.”
Sell Short—A position that seeks to profit if a market drops in value. See“Shorting Stocks: The Art of Playing Both Sides of The Market” in thisAppendix for more details.
Stop Order—For buys, an order placed above the current stock price thatbecomes a market order if the stock trades at or above the order price.For sells, an order placed below the current price of the stock that be-comes a market order if the market trades at or below the order price.Stop orders are normally used to help control risk but can also be used toenter positions.
Strong Close—The stock closes within the top 25% of its range.
Appendix 217
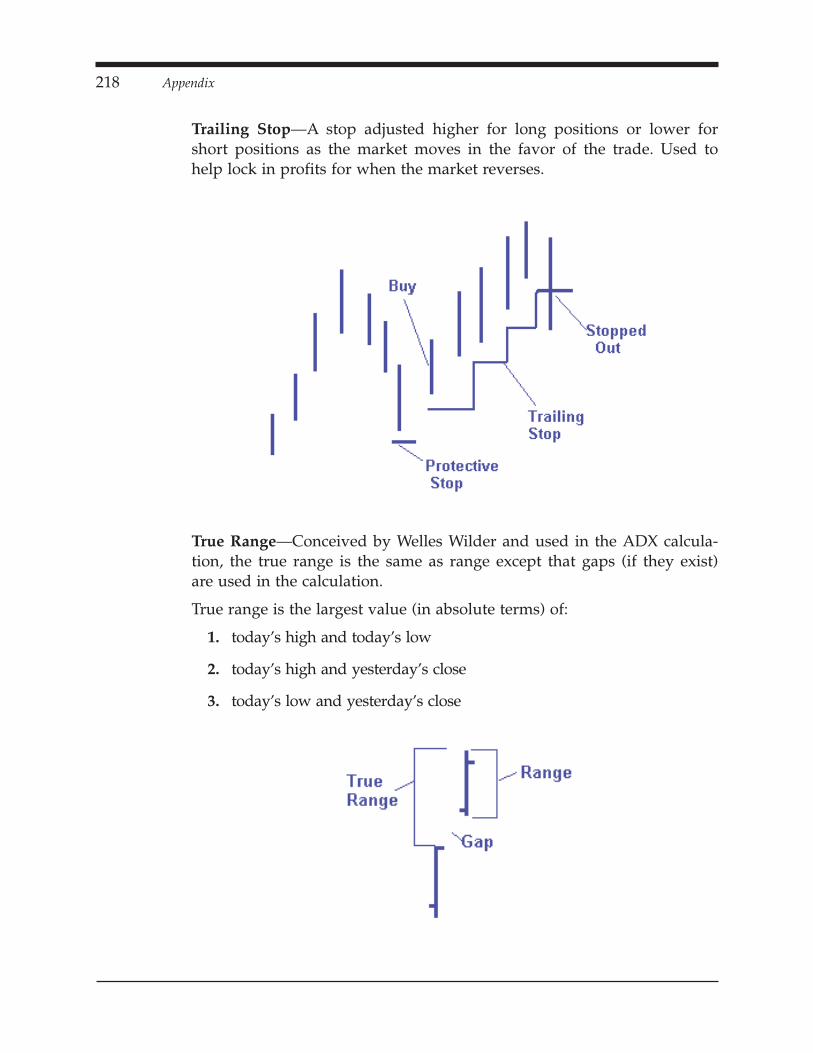
Trailing Stop—A stop adjusted higher for long positions or lower forshort positions as the market moves in the favor of the trade. Used tohelp lock in profits for when the market reverses.
True Range—Conceived by Welles Wilder and used in the ADX calcula-tion, the true range is the same as range except that gaps (if they exist)are used in the calculation.
True range is the largest value (in absolute terms) of:
1. today’s high and today’s low
2. today’s high and yesterday’s close
3. today’s low and yesterday’s close
218 Appendix

Uptrend—A series of higher highs and higher lows. See Chapter 3, TrendQualifiers, for more details.
Volatility—How much prices fluctuate over time.
Appendix 219
I originally published the following article on shorting stocks on TradingMarkets.com in January
1999. To my surprise, it quickly became one of the most popular articles and has since been
re-published by other Internet sites. Special thanks to Larry Connors, CEO of
TradingMarkets.com, for allowing me to re-publish this article.
SHORTING STOCKS: THE ART OF PLAYINGBOTH SIDES OF THE MARKET
To the public, selling stocks short can be an intimidating and confusingundertaking. Unfortunately, by sticking exclusively to the long side of themarket, average traders deny themselves the possibility of improvingtheir returns.
Professional traders, by contrast, know playing both sides of the marketis a crucial element of long-term stock trading success. We will try to de-mystify the process by explaining what short selling is and how you canbenefit from incorporating it into your trading plan. We’ll also show youthe rules that regulate short selling, and how to know which stocks toavoid.
REVERSING THE RULESWhen many people think of stock trading they automatically imaginebuying a stock and hoping it goes up. When it does, they envision sellingit and pocketing a profit. For example, suppose XYZ company was trad-ing at $10 per share. You would buy your shares at $10 (a “long” posi-tion) and sell them later at $12. Your profit from the trade would be thedifference between your entry and exit prices: $12 – $10, a $2-per-shareprofit. Nothing complicated here.
But what about when a market is falling? Short selling is simply a matterof reversing the process described in the previous paragraph to profitwhen a stock drops. For instance, suppose XYZ was trading at $12 butyou thought the stock would drop and you sold instead of bought—thatis, you “shorted” the market. If you later bought your shares back at $10,you would still have a $2-per-share profit.
Your trade consists of the same transactions (a buy and a sell) and netsthe same profit. The only difference is that in the case of the short sale,you sell the stock first and buy it back later—hopefully at a lower pricethan where you originally sold it.
220 Appendix

WHY SHORT STOCKS?The advantage to selling stocks short is simple: Bull markets do not lastforever, and even in the longest bull market there are corrections that lastfrom as little as a several minutes to as long as several months. Profes-sional traders seize these downside opportunities and profit by shortingstocks. Therefore, if you want to make a long-term living trading thestock market, it is to your advantage to add short selling to your toolbox.
WHAT IT MEANS TO SELL SHORTIn a short-selling situation, you enter a position without owning thestock. How can you sell something you do not own? The answer is, youcan’t. You have to borrow it before you can sell it. For example, supposeyou borrowed what you think is a cheap plate from a neighbor. Nowsuppose someone was visiting you and offered you $100 for the plate.You recognize that $100 is much more than this plate is worth, so yousell it to him. But now you owe your neighbor his plate—you are, in es-sence, short one plate. As long as you can replace it for less than $100,you make a profit.
Many people have a problem with selling before buying—it just seems tofly in the face of what is “natural.” But the short-selling process is reallyno different than when you order something and place a deposit. Thesalesman to whom you paid the deposit is “short” the product he owesyou. As long as he can fill your order for less than what you have agreedto pay for it, he makes a profit. From the salesman’s perspective, the de-posit ensures you will keep up your end of the bargain.
Short selling stocks is a similar process. If you believe a stock is overval-ued, you put up a deposit (to cover potential losses) and instruct yourbroker to sell the shares short. To do this, he borrows the shares from an-other account and sells them in the market. You are now short the stock.As long as you can buy it back for less than what you sold it, you willmake a profit.
RULES AND REGULATIONSThe Securities and Exchange Commission (SEC) has established specificrules regulating the short sale of stocks. First, you must have a mar-gin/short account with your broker. Second, the shares for the stock youwish to short must be available to borrow. Third, you can only sell short
Appendix 221
on an up tick. Finally, you must have (and maintain) at least 50 percent(or more, see below) of the stock’s value in your account.
Let’s break it down:
1. You must have a margin and short account agreement with your broker.
A “margin” account allows you to use stocks you own as collateral; a“short” account allows you to short stocks. This agreement also allowsyour broker to “borrow” shares from you should other traders wish toshort a stock you own.
2. The stock must be available to borrow.
Your broker must be able to borrow the shares from someone else’s ac-count. If he cannot, no short sale is allowed. Shorting stocks without firstborrowing the shares is known as “naked shorting” and is illegal.
3. The stock must trade on an up tick.
This means that the stock must tick higher before they will allow you toshort the stock. If you attempt to short a stock that trades at $50, $49 3/4,$49 1/2 and $49 5/8, your short trade would not be executed until thefirst higher trade in the sequence ($49 5/8). (This rule was instituted tokeep short sellers from manipulating the market.) You also can short sellon an “equal tick” if the preceding trade was an up tick. For example, ifthe stock traded at $50, $49 3/4, $49 1/2, $49 5/8 and again at $49 5/8,you could short sell on the second trade at $49 5/8—you would not haveto wait for the stock to up tick again to $49 11/16. Note: as of late 2000,this rule may be repealed.
4. You must maintain at least 50 percent of the stock’s value in youraccount.
This deposit is required in order to cover potential losses. Just as a sales-man requires a deposit on something you special order, the brokers (andthe SEC) require that you maintain at least 50 percent of the stock’s valuein your account in case your position turns into a loser. If the stock be-gins to rise you would have to add more money to your account (or exitthe position). Conversely, if the stock began to drop, you could removeexcess cash (or use it for other transactions) as long as you maintained atleast the 50 percent margin in your account.
While 50 percent is the absolute minimum deposit that brokerages willaccept, some brokers may require a larger deposit. Also, because volatilestocks are riskier, brokerages may require additional margin on these is-sues for extra insurance.
222 Appendix
SHORT-SELLING STRATEGIESIn general, the majority of patterns that work on the long side of themarket also work (in reverse) on the short side. For instance, just as fromnew highs often present good buy opportunities, pullbacks from lows of-ten present opportunities to sell short.
STOCKS TO AVOIDJust because something appears overvalued does not mean it cannot gohigher. Many traders were devastated by shorting “overvalued” biotechstocks in the early 1990s and by shorting “overvalued” Internet stocks inthe late 1990s. This is not to say you should avoid hot sectors altogether,it is just a warning to be cautious and realistic about the possibility ofsustained stock rallies.
You should always ask your broker if a particular stock you are inter-ested in is hard to borrow. Avoid such stocks because you could easilyget caught in what is known as a “short squeeze,” which occurs when astock rallies and the short sellers are forced to cover (exit) their positions.This demand far exceeds the supply and pushes the stock much higher.If you believe a hard-to-borrow stock is headed lower, you are muchbetter off buying a put option.
SUMMARYShorting stocks allows you to enter the market as a seller and profitwhen a stock declines. Your broker “borrows” the stock from someoneelse’s margin/short account and sells it in the market for you. As long asyou buy back the shares at a lower price, you will profit.
To short stocks you must first establish a margin/short account withyour broker. The stock you wish to short must be available to borrowand you must maintain at least 50 percent or more of the stock’s value inyour account. Also, you can sell stock short only on an up tick.
Professional traders sell stocks short because they know markets areprone to corrections and longer-term declines. Many of the techniquesthat work on the long side of the market also work (in reverse) on theshort side. Finally, avoid hard-to-borrow stocks and be cautious aboutshorting stocks in a hot sector.Copyright © TradingMarkets.com 1999. Any reproduction of this article without the express written permis-sion from TradingMarkets.com is forbidden.
Appendix 223
CAPTURING TRENDS WITH THE ADXThe Average Directional Movement Index (ADX) measures the trendstrength of a market but not its direction. The higher the ADX reading,the stronger the trend, regardless if it is up or down.
The ADX, which was developed by Welles Wilder, uses calculationscalled the positive directional movement index (+DMI) and minus direc-tional movement index (–DMI) to measure price movement. Althoughthe entire ADX calculation is somewhat lengthy and complex, under-standing the basis of the calculation—directional movement—is fairlystraightforward and will help you understand how the indicator works.
Below we will show you how to determine the directional movementand interpret ADX readings.
UNDERSTANDING DIRECTIONAL MOVEMENTDirectional movement is essentially the part of a price bar that falls out-side of the prior price bar’s range. In terms of a daily chart, price actionabove yesterday’s high is positive directional movement (+DM), whileanything below yesterday’s low is negative directional movement (–DM).
224 Appendix
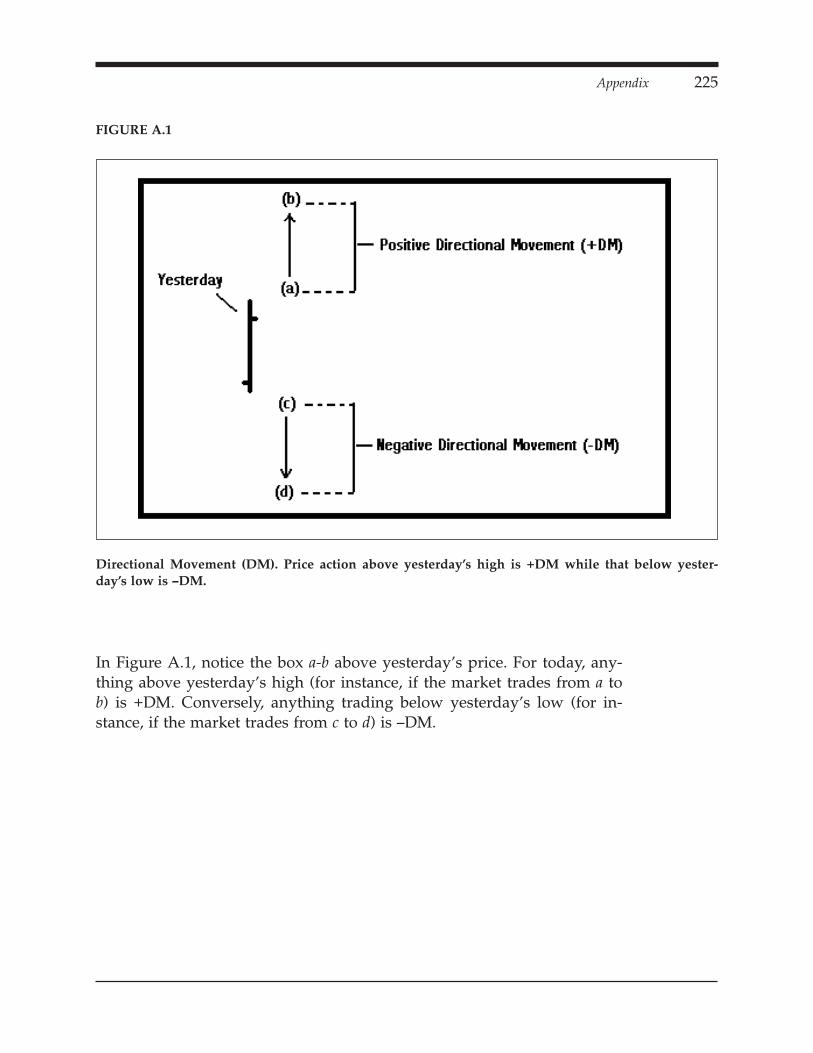
In Figure A.1, notice the box a-b above yesterday’s price. For today, any-thing above yesterday’s high (for instance, if the market trades from a tob) is +DM. Conversely, anything trading below yesterday’s low (for in-stance, if the market trades from c to d) is –DM.
Appendix 225
FIGURE A.1
Directional Movement (DM). Price action above yesterday’s high is +DM while that below yester-day’s low is –DM.

Notice in Figure A.2 that the price bar trades above the prior price bar(from a to b). This distance is the +DM. Referring to Figure A.3, the rangeof the bar that trades below the prior day’s low (from c to d) is the –DM.
226 Appendix
FIGURE A.2
Plus Directional Movement (+DM).

Obviously, not every trading day sets up like Figures A.2 or A.3. There-fore, we must consider two other possibilities: inside days and outsidedays. An inside day occurs when the entire day’s range is “contained”within the prior day’s high and low. In other words, today’s high is lessthan yesterday’s high and today’s low is greater than yesterday’s low.For example, if XYZ traded yesterday between 50 and 60 and trades to-day between 51 and 59, then today is an inside day. In Figure A.4, noticethere is no DM (either + or –) because the range doesn’t trade above (fora +DM reading) or below (for a –DM reading).
Appendix 227
FIGURE A.3
Minus Directional Movement (–DM).
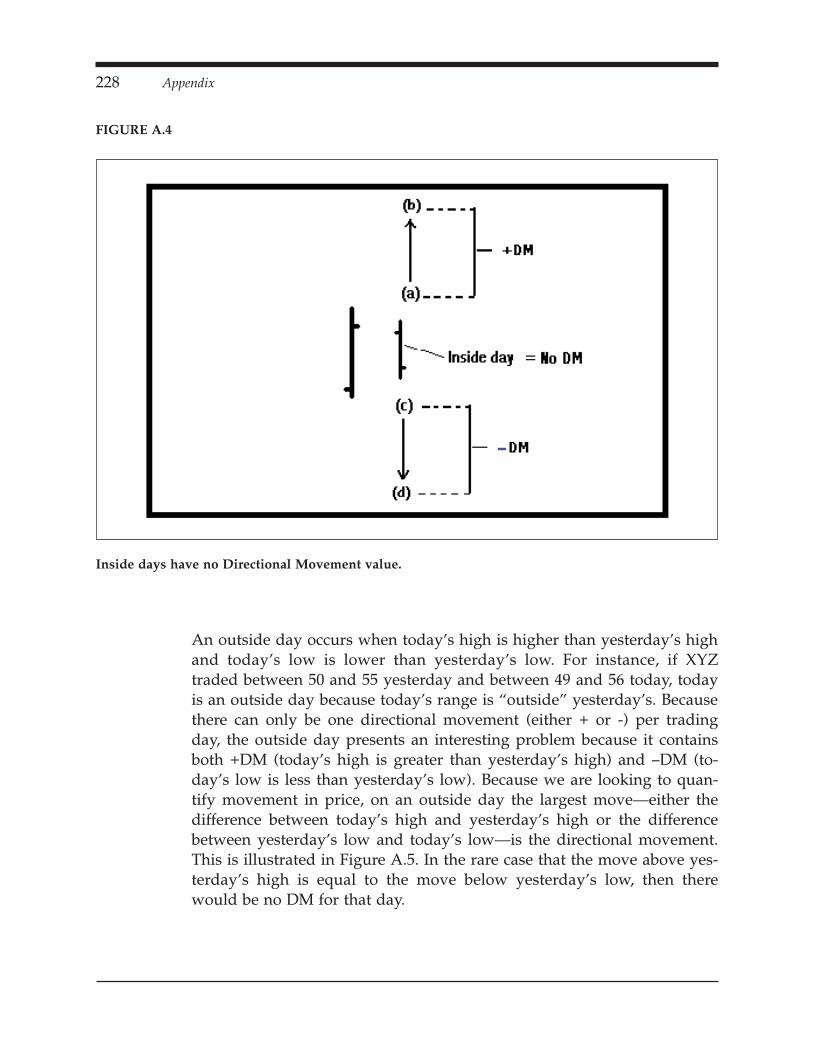
An outside day occurs when today’s high is higher than yesterday’s highand today’s low is lower than yesterday’s low. For instance, if XYZtraded between 50 and 55 yesterday and between 49 and 56 today, todayis an outside day because today’s range is “outside” yesterday’s. Becausethere can only be one directional movement (either + or -) per tradingday, the outside day presents an interesting problem because it containsboth +DM (today’s high is greater than yesterday’s high) and –DM (to-day’s low is less than yesterday’s low). Because we are looking to quan-tify movement in price, on an outside day the largest move—either thedifference between today’s high and yesterday’s high or the differencebetween yesterday’s low and today’s low—is the directional movement.This is illustrated in Figure A.5. In the rare case that the move above yes-terday’s high is equal to the move below yesterday’s low, then therewould be no DM for that day.
228 Appendix
FIGURE A.4
Inside days have no Directional Movement value.
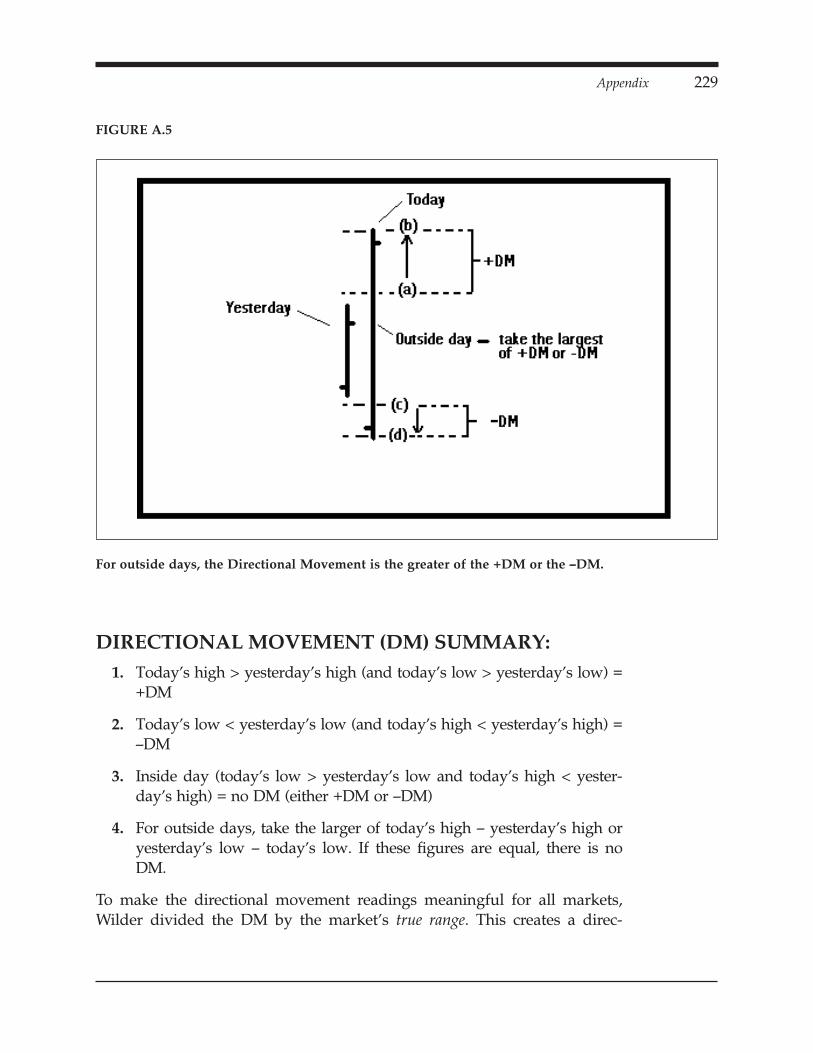
DIRECTIONAL MOVEMENT (DM) SUMMARY:1. Today’s high > yesterday’s high (and today’s low > yesterday’s low) =
+DM
2. Today’s low < yesterday’s low (and today’s high < yesterday’s high) =–DM
3. Inside day (today’s low > yesterday’s low and today’s high < yester-day’s high) = no DM (either +DM or –DM)
4. For outside days, take the larger of today’s high – yesterday’s high oryesterday’s low – today’s low. If these figures are equal, there is noDM.
To make the directional movement readings meaningful for all markets,Wilder divided the DM by the market’s true range. This creates a direc-
Appendix 229
FIGURE A.5
For outside days, the Directional Movement is the greater of the +DM or the –DM.

tional movement indicator (DMI) in a form of a ratio and allows for mean-ingful comparisons regardless of various market prices. In other words,the DMI of a $5 stock can be compared to the DMI of a $100 stock.
Because one day does not a trend make, the DMI is then averaged over anumber of days. The magnitude of the trend reflected by the ADX—lon-ger-term or shorter-term—depends on the number of days in this calcula-tion. Wilder’s default, and the number widely used by charting softwarepackages (and TradingMarkets.com), is 14 days.
The Average Directional Movement Index (ADX) is then calculated bytaking the difference between the smoothed +DMI and –DMI calcula-tions. It’s obvious the ADX calculation is very complex, but if you under-stand the directional movement detailed previously, you’ll have a goodunderstanding of how the indicator works and enough background touse it.
230 Appendix
FIGURE A.6
Amazon.com, daily. +DMI greater than –DMI reflects an uptrending market. Source: Omega Research.
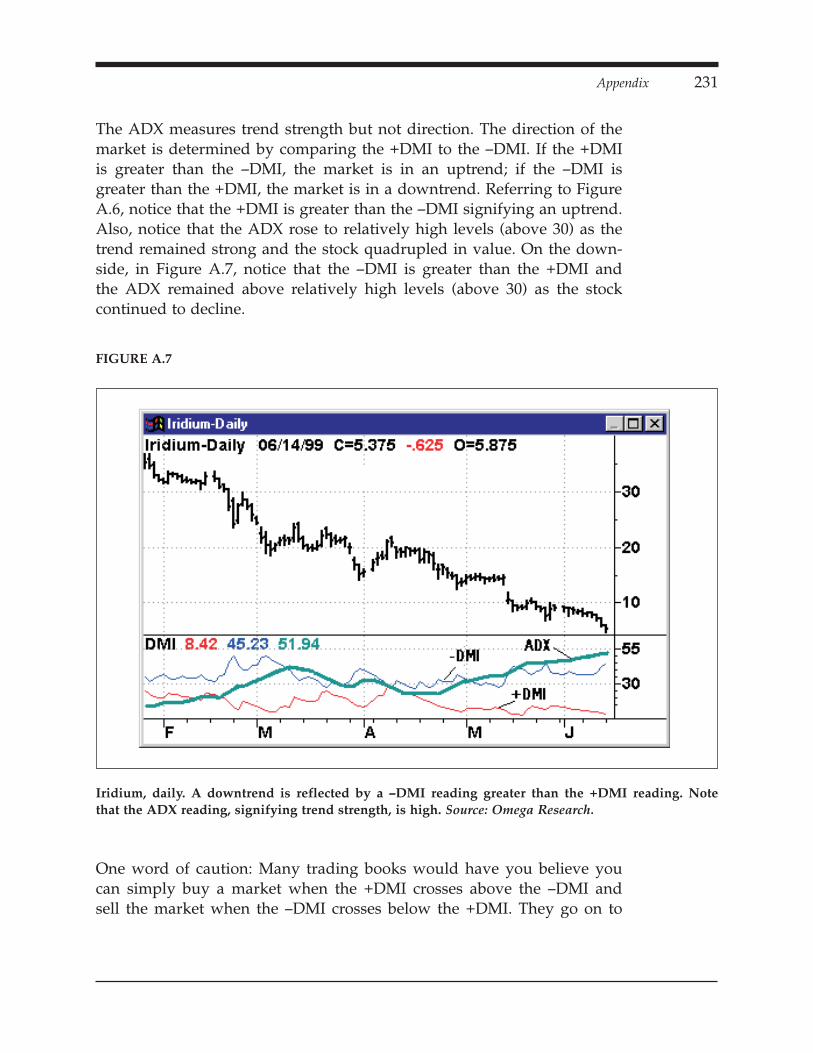
The ADX measures trend strength but not direction. The direction of themarket is determined by comparing the +DMI to the –DMI. If the +DMIis greater than the –DMI, the market is in an uptrend; if the –DMI isgreater than the +DMI, the market is in a downtrend. Referring to FigureA.6, notice that the +DMI is greater than the –DMI signifying an uptrend.Also, notice that the ADX rose to relatively high levels (above 30) as thetrend remained strong and the stock quadrupled in value. On the down-side, in Figure A.7, notice that the –DMI is greater than the +DMI andthe ADX remained above relatively high levels (above 30) as the stockcontinued to decline.
One word of caution: Many trading books would have you believe youcan simply buy a market when the +DMI crosses above the –DMI andsell the market when the –DMI crosses below the +DMI. They go on to
Appendix 231
FIGURE A.7
Iridium, daily. A downtrend is reflected by a –DMI reading greater than the +DMI reading. Notethat the ADX reading, signifying trend strength, is high. Source: Omega Research.

show well-chosen examples where you could have followed this simplesystem and made large sums of money. However, nothing could be fur-ther from the truth. What they fail to show you is how much money youwould lose as the DMIs cross back and forth.
USING THE ADXHigh ADX readings reflect a strongly trending market. Conversely, lowADX numbers reflect non-trending markets. The minimum reading todetermine a “trend” is subject to debate. In general, 14-day ADX read-ings above 30 suggest a strongly trending market. Those who only wishto trade the strongest of markets may look for readings of 35 or higher.The trade-off here is that the stronger the number, the longer the trendhas been in place. Therefore, much of the original move (that caused theADX to rise) is missed. Those who look to catch early trends may lookfor markets with an ADX of 25 or higher. Not surprisingly, the trade-offhere is that these markets are more prone to failure because they have yetto “prove” themselves.
The advantage of the ADX is that it provides a standardized way of mea-suring trend. This lends itself well to computerized scans for findingtrending markets (i.e., the TradingMarkets.com ADX Search and Filter).These markets can then be watched for potential entries signals frombreakouts, pullbacks, cup-and-handle patterns and so forth. Coun-ter-trend traders, those who tend to fade markets (trade opposite to thetrend), may look to trade markets that are in a trading range or nottrending as measured by a low ADX reading.
SUMMARYThe ADX is based on the directional movement, positive or negative, of amarket. The positive directional movement is the portion of today’srange that is above yesterday’s high. The negative directional movementis the portion of today’s range that falls below yesterday’s low.
Only one directional movement is calculated for each day. Therefore, ifthere are both +DMI and –DMI for a given day (i.e., an outside day),then the larger of the two becomes the directional movement. If today’srange does not trade above or below the prior day (i.e., an inside day),then there is no directional movement for that day.
232 Appendix

The ADX is calculated by taking the difference of the average directionalmovement values over a given time period. The ADX measures trend butnot direction. The direction of the market is determined by comparingthe +DMI to the –DMI. If the +DMI is greater than the –DMI, the marketis uptrending; if the –DMI is greater than the +DMI, the market isdowntrending. High ADX readings suggest a market is in a strong trend.
Appendix 233

ABOUT THE AUTHOR3 3 3 3 3 3 3 3 3 3 3 3 3 3 3 3 3 3 3 3 3 3 3 3 3 3 3 3 3 3 3
Dave Landry is a co-founder of and regular contributor toTradingMarkets.com. He is a registered Commodity Trading Advisor (CTA)d/b/a Sentive Trading. He is also a principal of Harvest Capital Manage-ment, a hedge fund. Mr. Landry has authored a number of trading systems,including the 2/20 EMA Breakout System and the Volatility ExplosionMethod, and his articles have been published in Technical Analysis of Stocksand Commodities, Active Trader and Bridge Trader magazines. His research hasbeen referenced in several books such as Connors On Advanced Trading Strat-egies and Beginners Guide to Computerized Trading. Mr. Landry holds a Bache-lor of Science degree in computer science from the University of Louisianaand a Masters in Business Administration degree from the University ofSouthern Mississippi.
241