Dave Farley The Rationale for Continuous Delivery or… What does ‘Good’ look like?
25
Dave Farley http://www.davefarley.net The Rationale for Continuous Delivery or… What does ‘Good’ look like?
-
Upload
samson-long -
Category
Documents
-
view
218 -
download
0
Transcript of Dave Farley The Rationale for Continuous Delivery or… What does ‘Good’ look like?
Dave Farley
http://www.davefarley.net
The Rationale for Continuous Delivery
or…
What does ‘Good’ look like?

The state of Software Development
Source: KPMG (New Zealand)Date: 2010
In a study of project management practices:
1)70% of organizations have suffered at least one project failure in the last 12 months
2)50% of respondents indicated that their projects consistently failed to achieve what they set out to achieve.
Source: KPMG – Global IT Management SurveyDate: 2005
In a survey of 600 projects worldwide:
1)49% of organisations had suffered a project failure in the past 12 months
2)2% of organisations reported that all of their projects achieved their desired benefits.
Source: Logica Management ConsultingDate: 2008
In a survey of 380 senior execs in Western Europe:
1)35% of organisations abandoned a major project in the last 3years
2)37% of business change programmes fail to deliver benefits.
Source: The McInsey Group with Oxford UniversityDate: 2012
In a study of 5,400 large scale projects (> $15m):
1)17% of projects go so badly that they threaten the existence of the company performing them.
2)On average large projects run 45% over budget and 7% over time while delivering 56% less value than predicted.
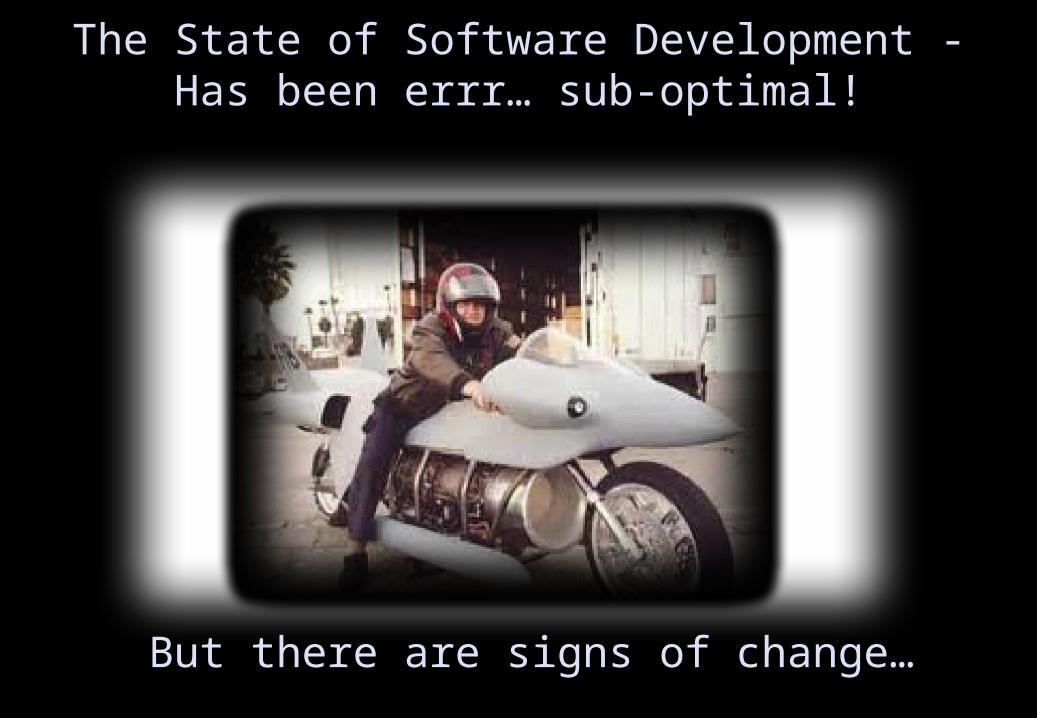
The State of Software Development -Has been errr… sub-optimal!
But there are signs of change…
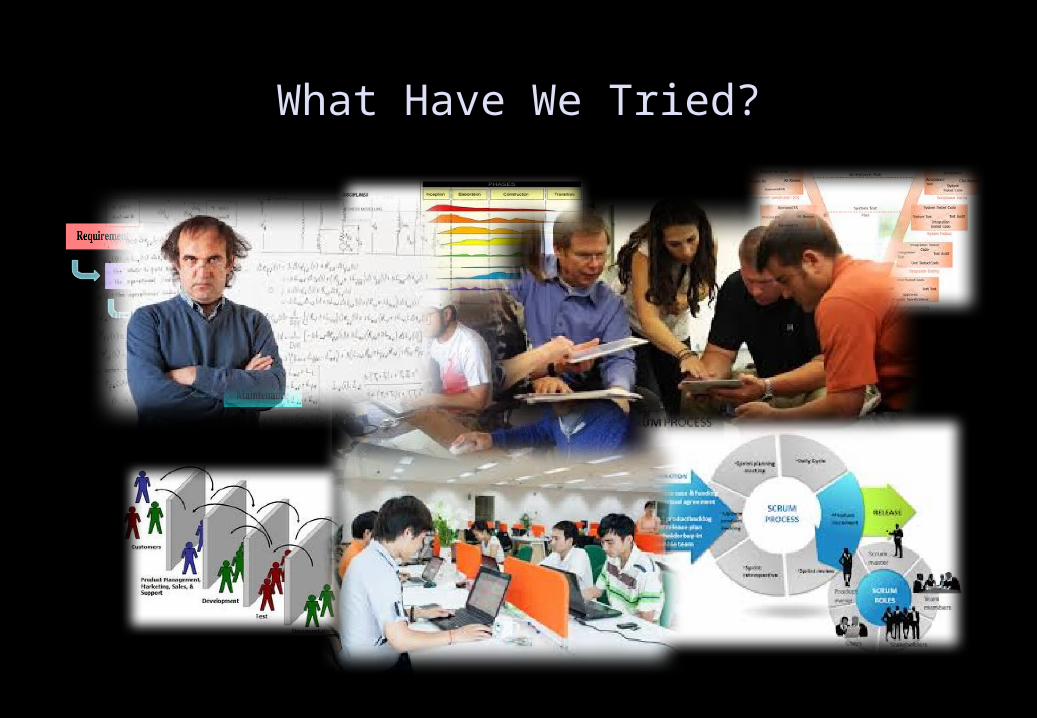
What Have We Tried?
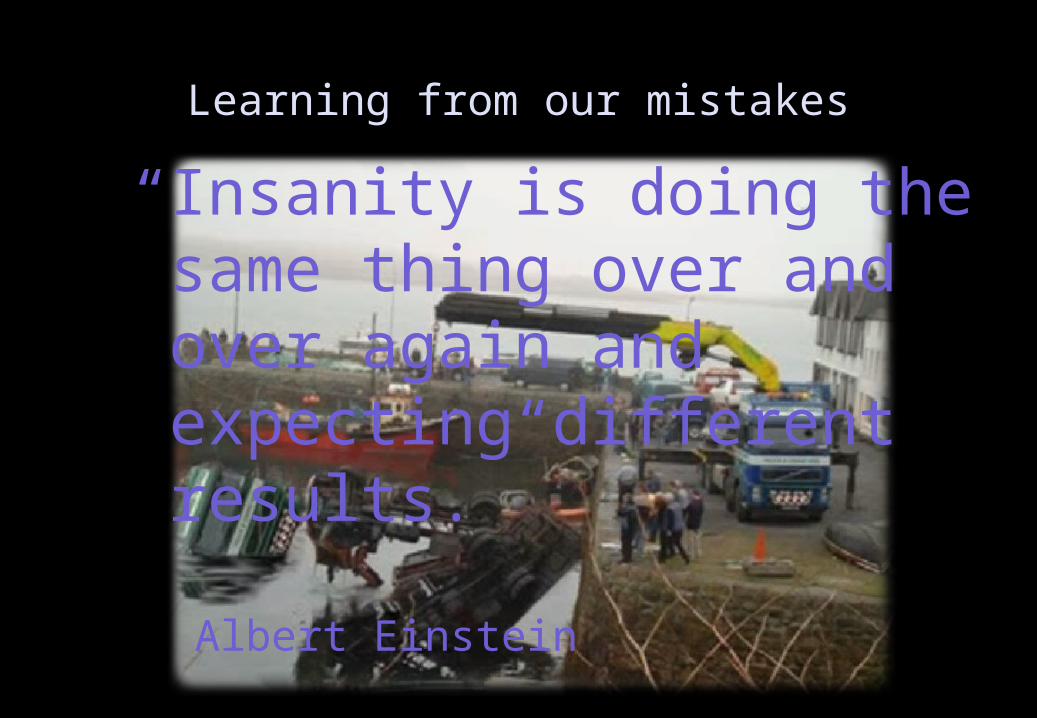
“Insanity is doing the same thing over and over again and expecting different results.”
Albert Einstein
Learning from our mistakes
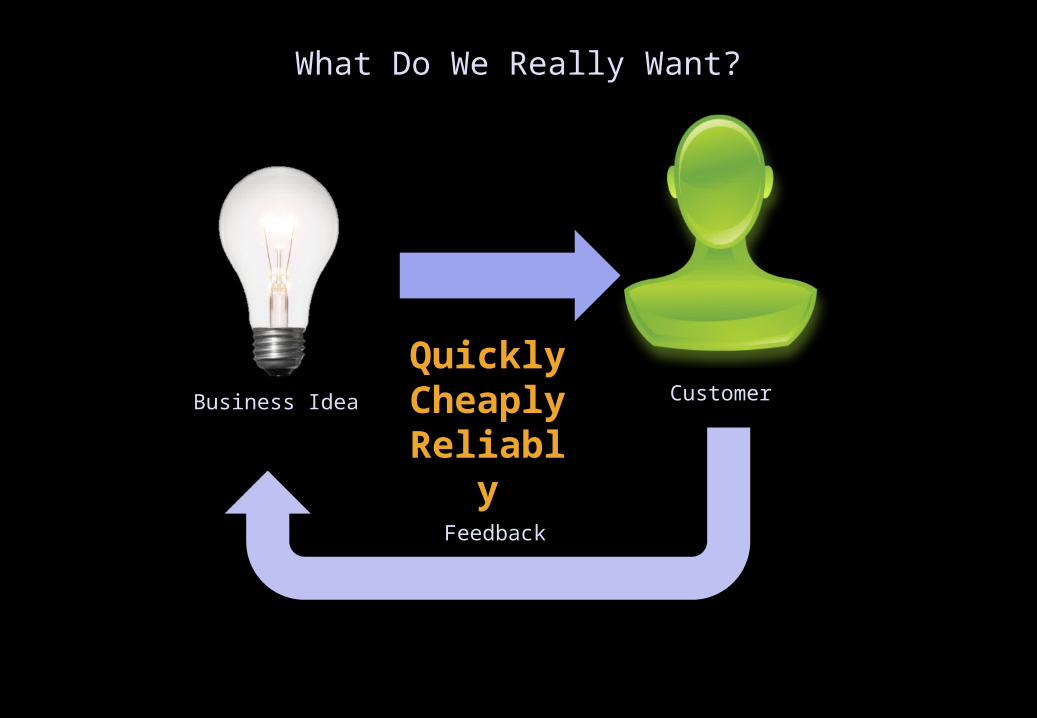
What Do We Really Want?
Customer
Feedback
Business Idea
QuicklyCheaplyReliably

A Question…
What is the most successful invention in human history?

A Question…
What is the most successful invention in human history?SCIENCE
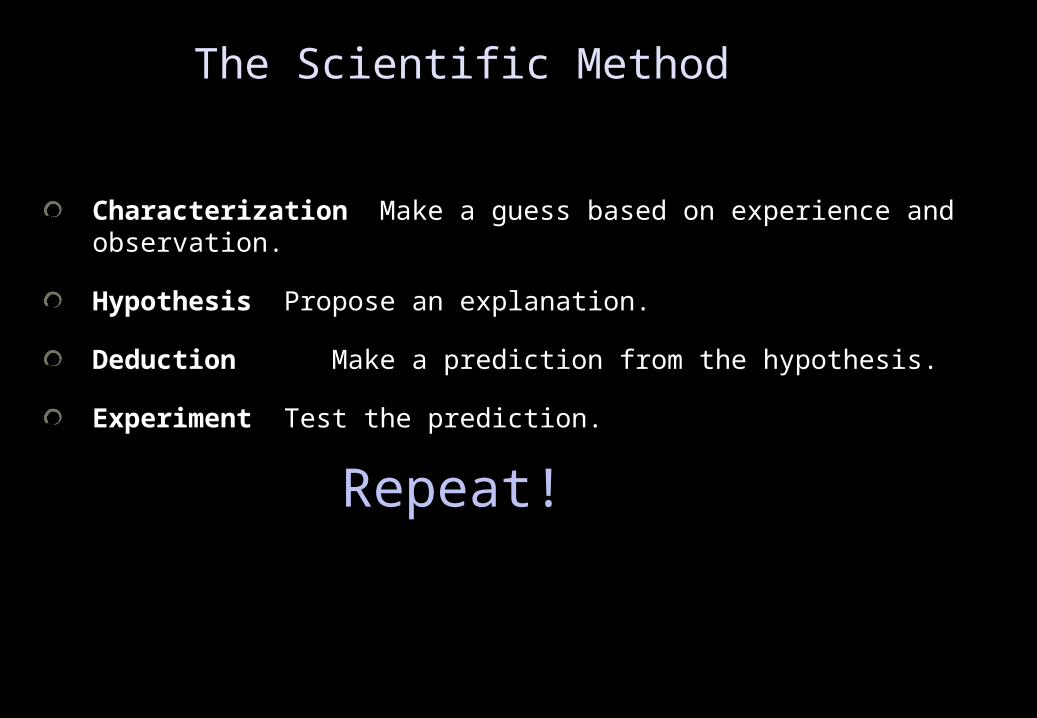
The Scientific Method
Characterization Make a guess based on experience and observation.
Hypothesis Propose an explanation.
Deduction Make a prediction from the hypothesis.
Experiment Test the prediction.
Repeat!
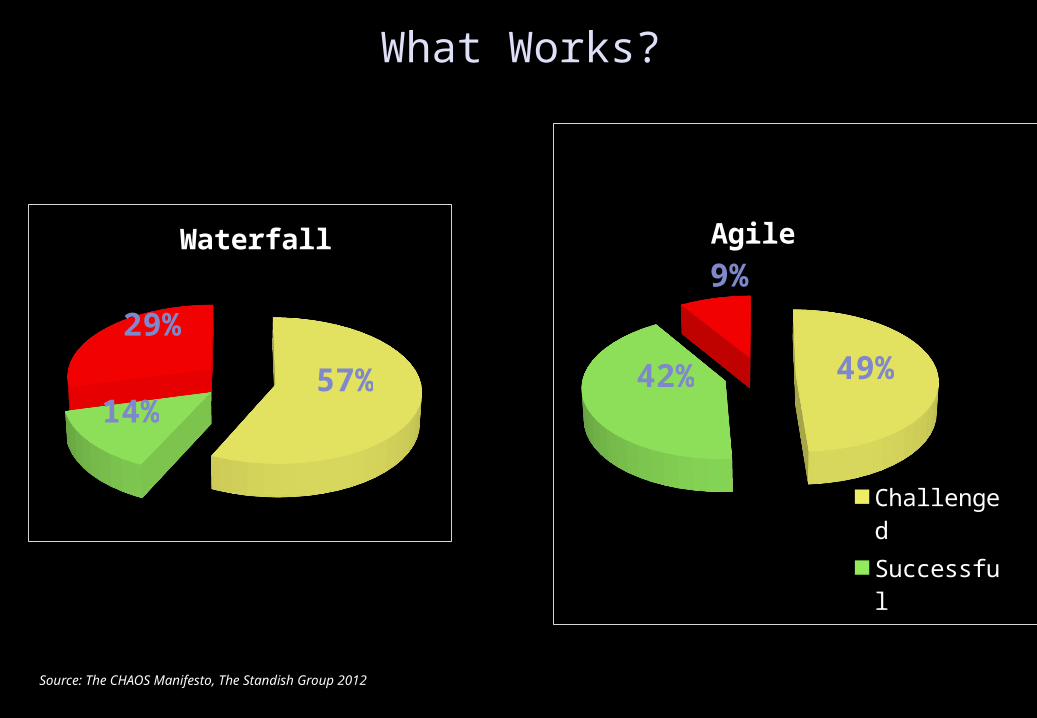
What Works?
Waterfall
57%14%
29%
Agile
Challenged
Successful
Failed
49%42%
9%
Source: The CHAOS Manifesto, The Standish Group 2012
Agile
30%
64%
6%
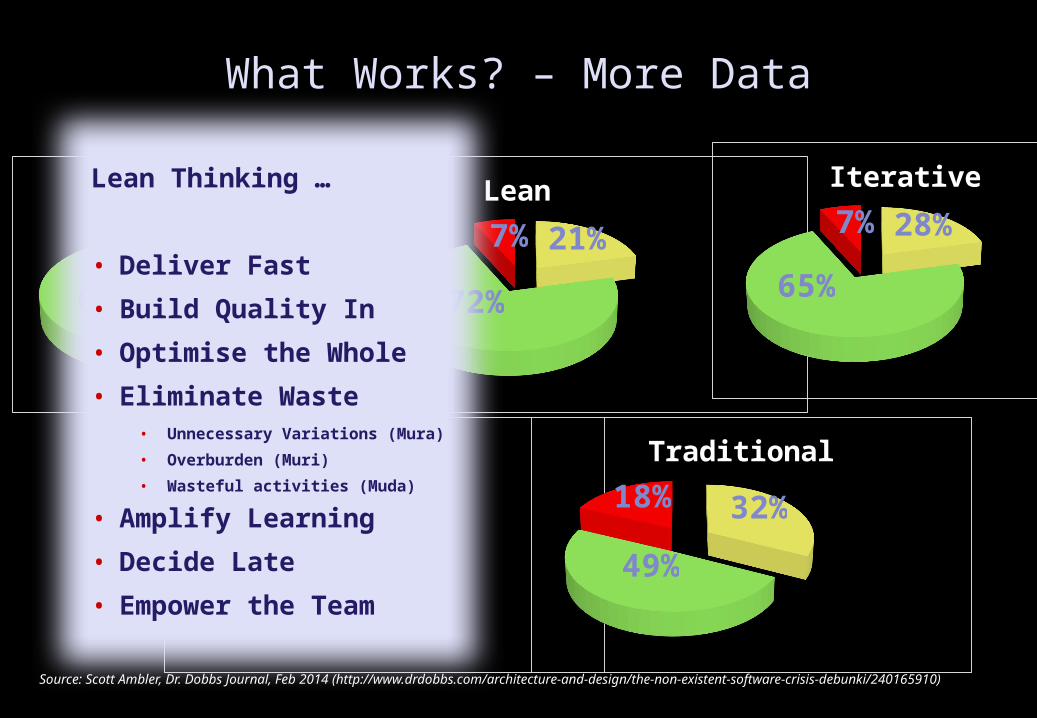
Lean
21%
72%
7%
Iterative
28%
65%
7%
Ad-Hoc
35%
50%
15%
Traditional
32%
49%
18%
What Works? – More Data
Lean Thinking …
• Deliver Fast
• Build Quality In
• Optimise the Whole
• Eliminate Waste• Unnecessary Variations (Mura)
• Overburden (Muri)
• Wasteful activities (Muda)
• Amplify Learning
• Decide Late
• Empower the Team
Source: Scott Ambler, Dr. Dobbs Journal, Feb 2014 (http://www.drdobbs.com/architecture-and-design/the-non-existent-software-crisis-debunki/240165910)

Smart Automation - a repeatable, reliable process for releasing software
Unit Test CodeIdeaExecutable
spec.Build Release
“It doesn’t matter how intelligent you are, if you guess and that guess cannot be backed up by experimental evidence – then it is still a guess!”
- Richard Feynman
What Really Works?
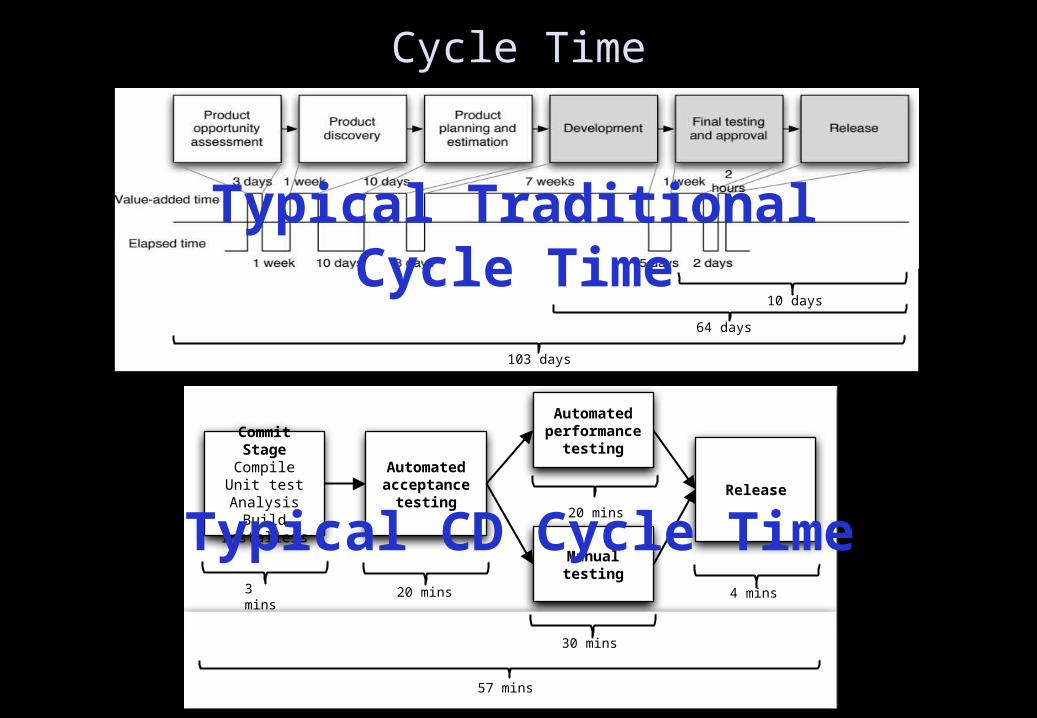
Cycle Time
Commit StageCompileUnit testAnalysis
Build Installers
Automated acceptance
testing
Automated performance
testing
Manual testing
Release
57 mins
3 mins 20 mins
20 mins
30 mins
4 mins
Typical CD Cycle Time
103 days
Typical Traditional Cycle Time
10 days
64 days
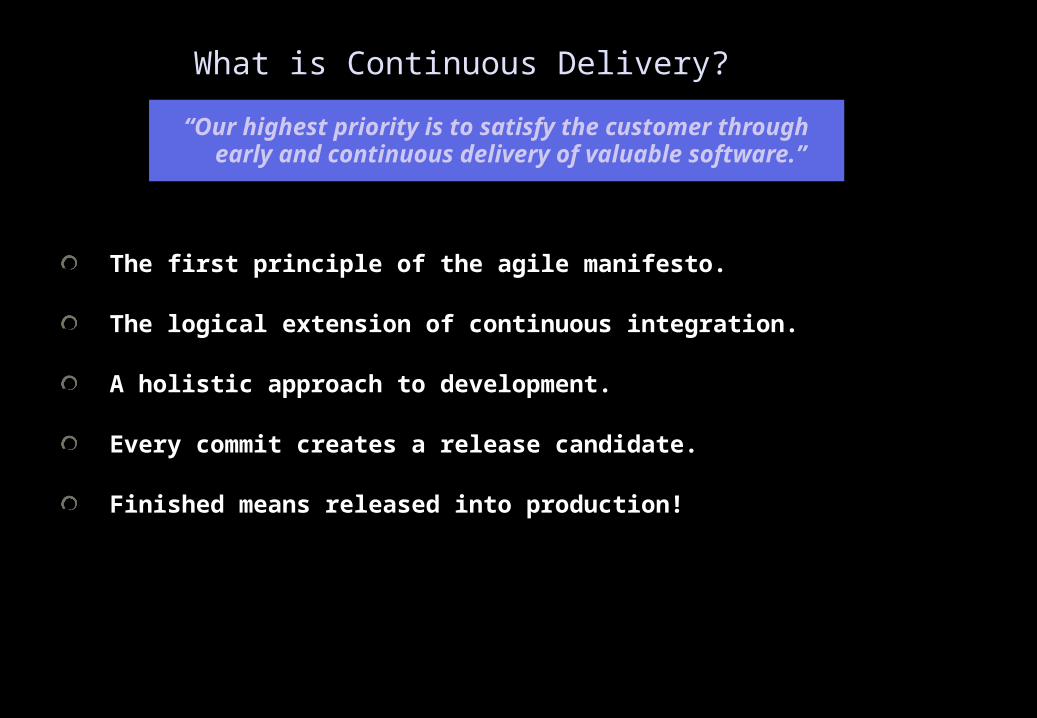
What is Continuous Delivery?
“Our highest priority is to satisfy the customer through early and continuous delivery of valuable software.”
The first principle of the agile manifesto.
The logical extension of continuous integration.
A holistic approach to development.
Every commit creates a release candidate.
Finished means released into production!
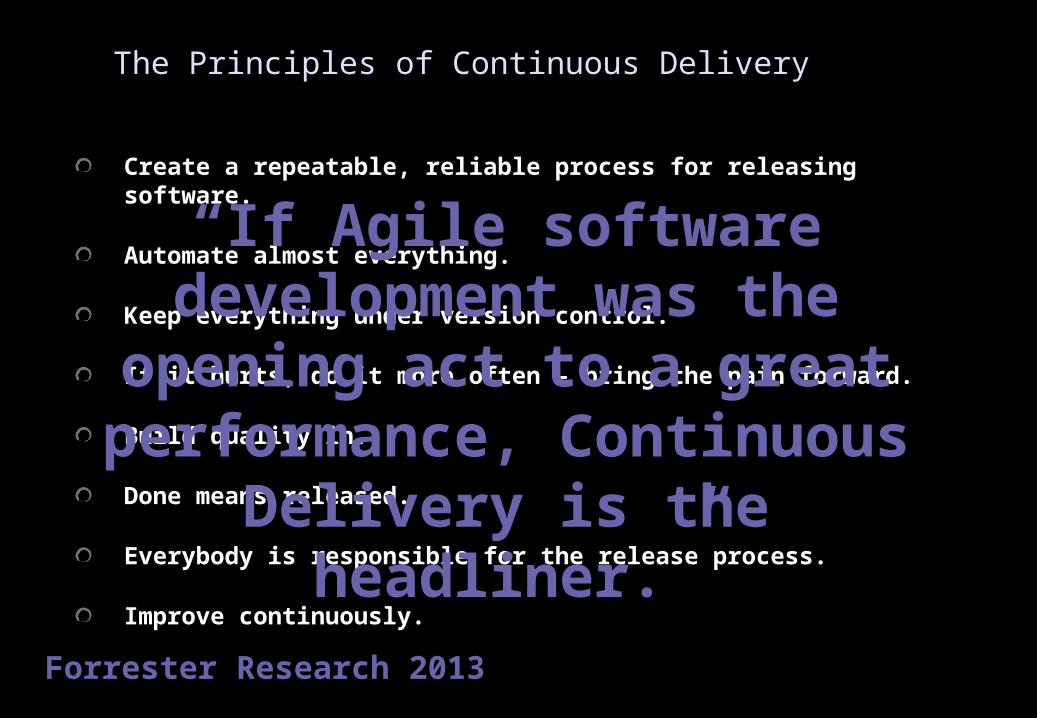
The Principles of Continuous Delivery
Create a repeatable, reliable process for releasing software.
Automate almost everything.
Keep everything under version control.
If it hurts, do it more often – bring the pain forward.
Build quality in.
Done means released.
Everybody is responsible for the release process.
Improve continuously.
“If Agile software development was the opening act to a great
performance, Continuous Delivery is the headliner.”
Forrester Research 2013
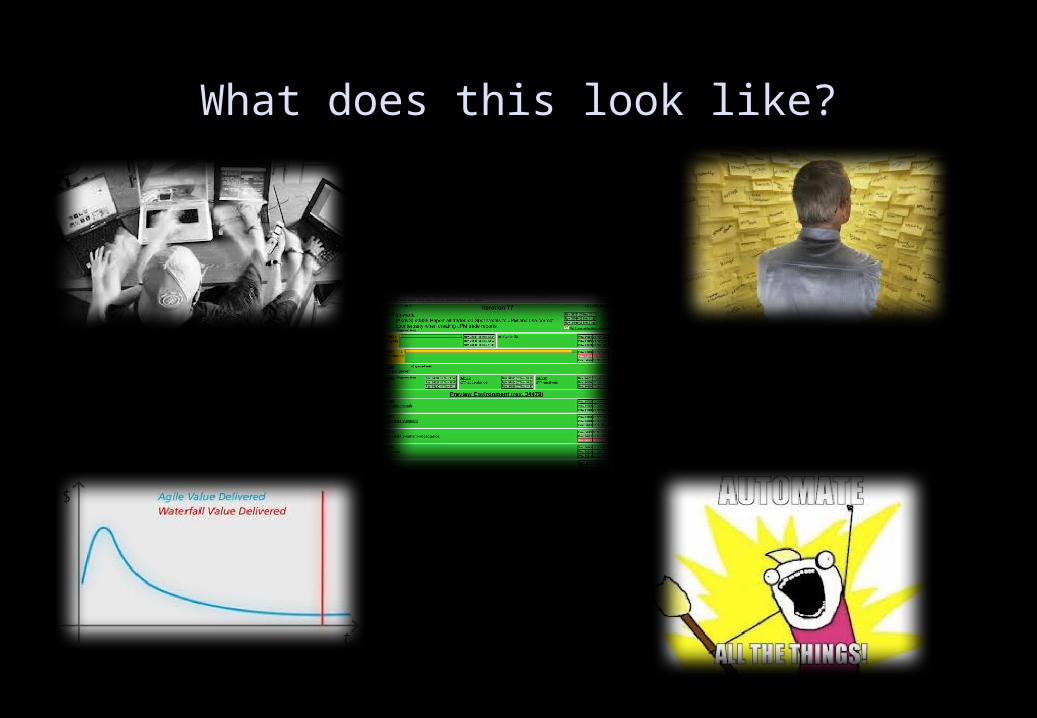
What does this look like?
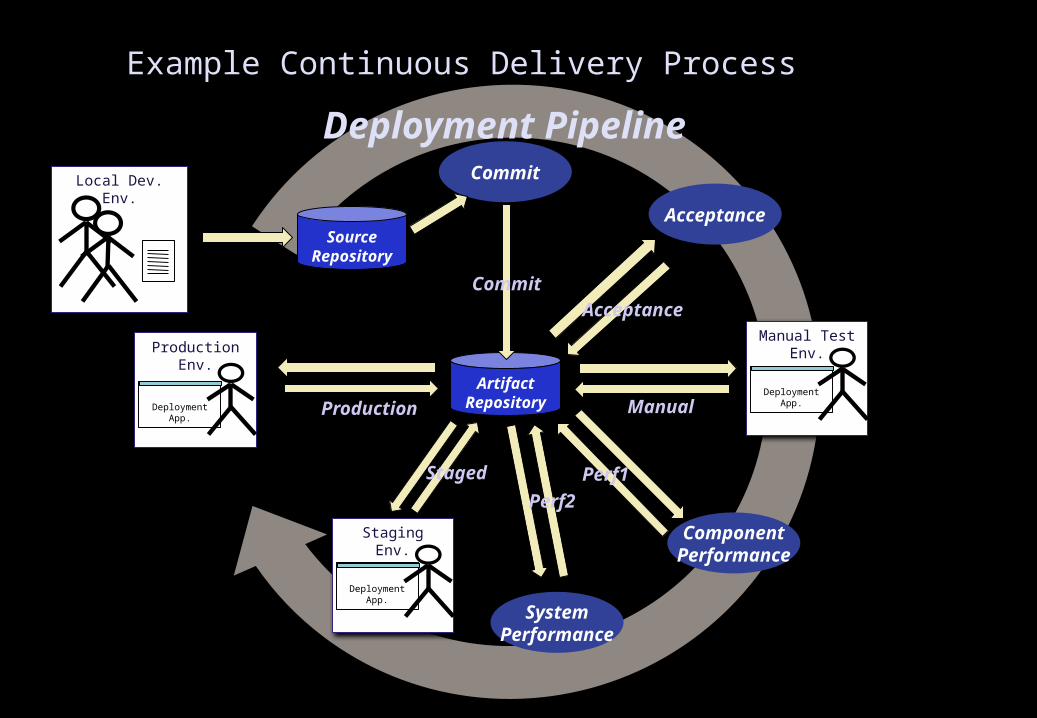
Example Continuous Delivery Process
ArtifactRepository
Local Dev. Env.
Deployment Pipeline
Acceptance
Commit
ComponentPerformance
SystemPerformance
Staging Env.
DeploymentApp.
Production Env.
DeploymentApp.
CommitAcceptance
Manual
Perf1
Perf2
Staged
Production
SourceRepository
Manual Test Env.
DeploymentApp.
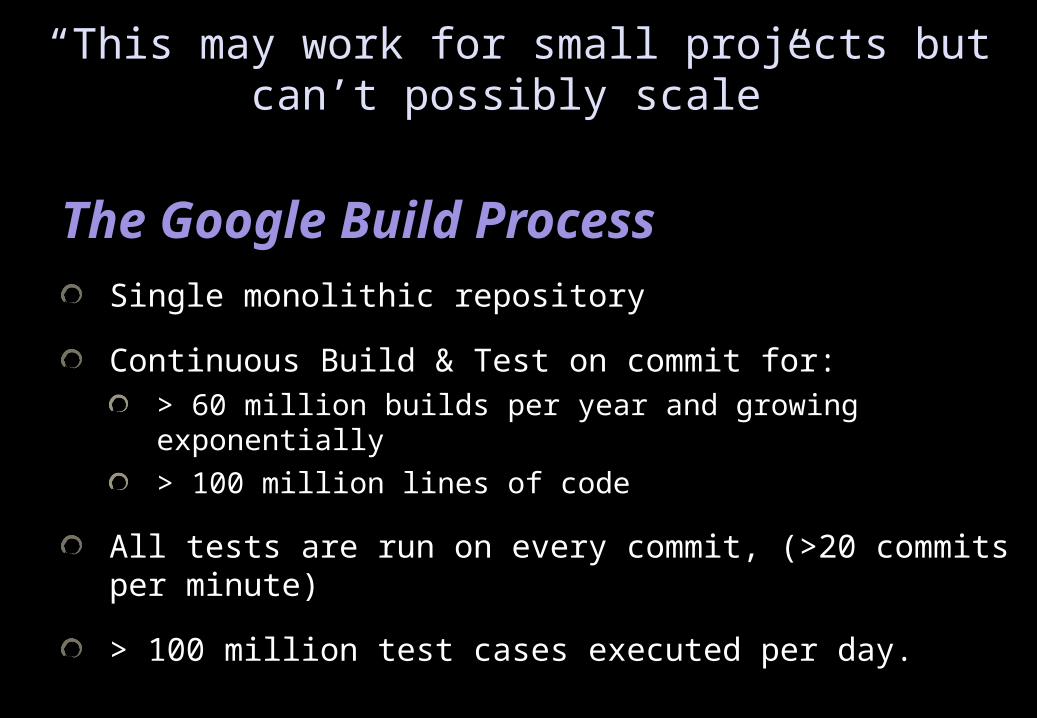
“This may work for small projects but can’t possibly scale”
The Google Build ProcessSingle monolithic repository
Continuous Build & Test on commit for:> 60 million builds per year and growing exponentially
> 100 million lines of code
All tests are run on every commit, (>20 commits per minute)
> 100 million test cases executed per day.
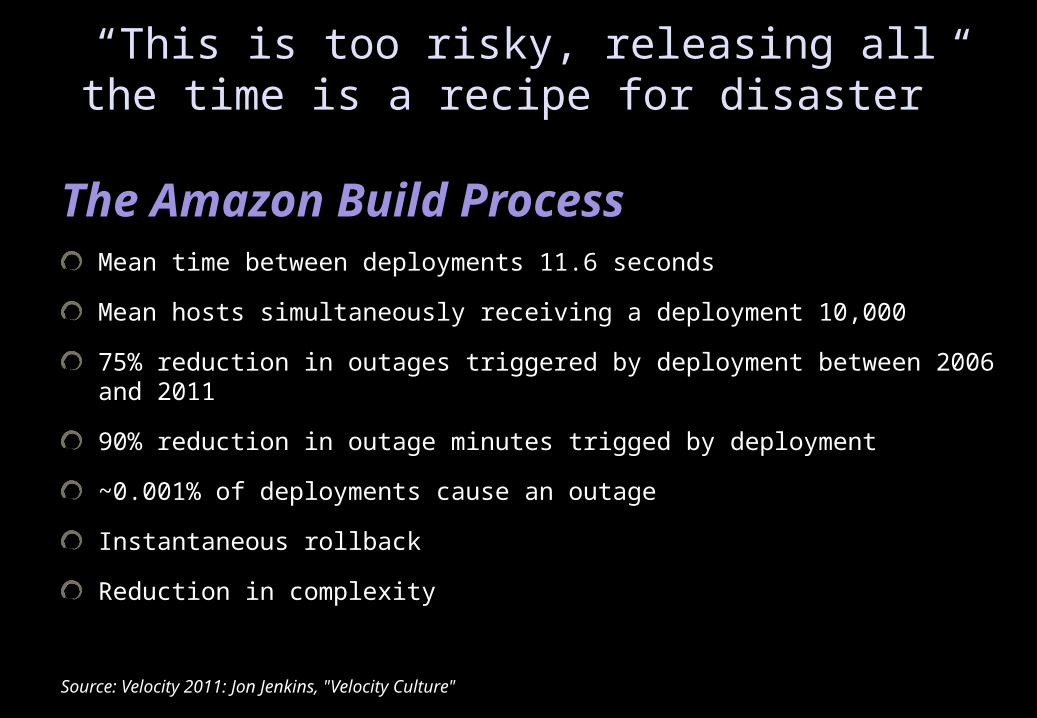
“This is too risky, releasing all the time is a recipe for disaster”
The Amazon Build ProcessMean time between deployments 11.6 seconds
Mean hosts simultaneously receiving a deployment 10,000
75% reduction in outages triggered by deployment between 2006 and 2011
90% reduction in outage minutes trigged by deployment
~0.001% of deployments cause an outage
Instantaneous rollback
Reduction in complexity
Source: Velocity 2011: Jon Jenkins, "Velocity Culture"
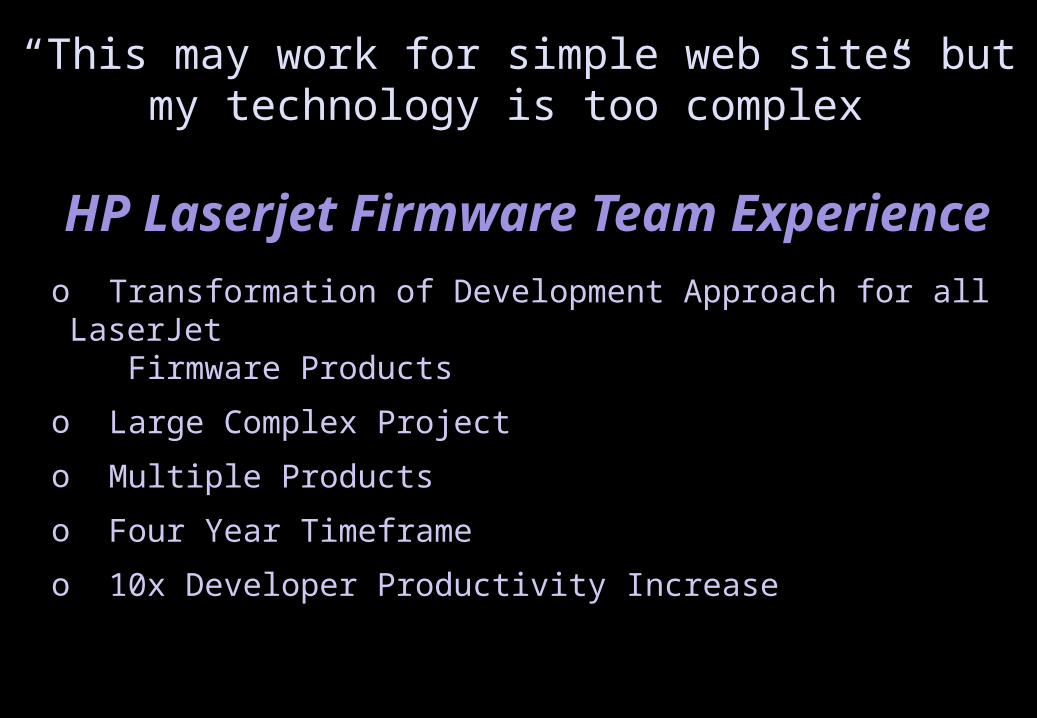
o Transformation of Development Approach for all LaserJet Firmware Products
o Large Complex Project
o Multiple Products
o Four Year Timeframe
o 10x Developer Productivity Increase
HP Laserjet Firmware Team Experience
“This may work for simple web sites but my technology is too complex”
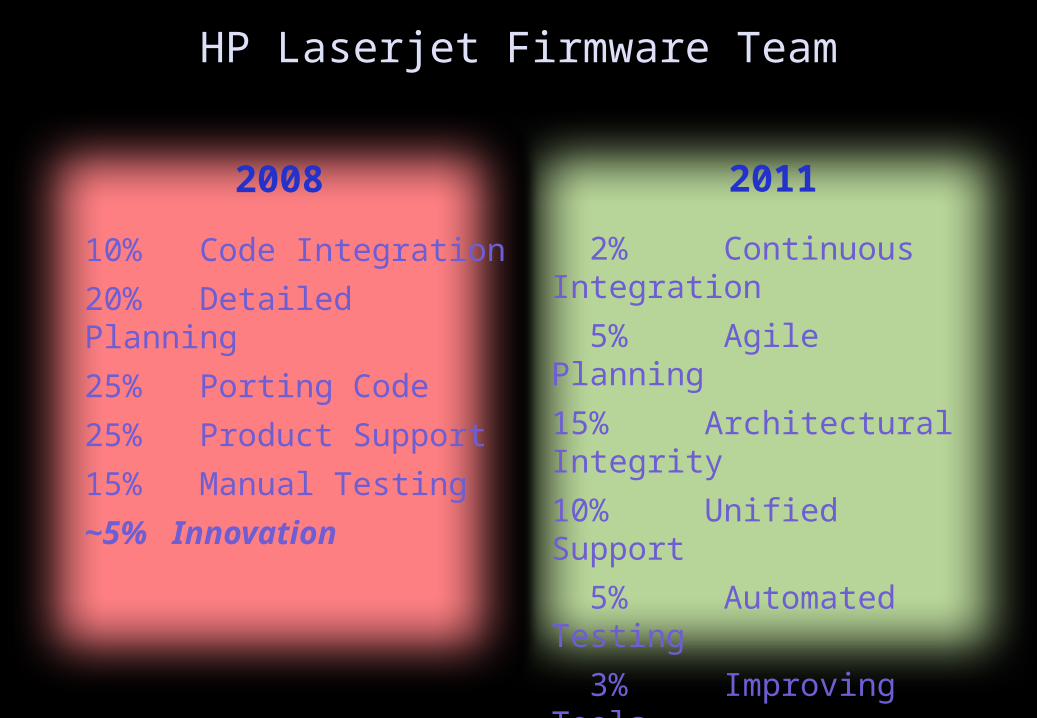
HP Laserjet Firmware Team
10% Code Integration
20% Detailed Planning
25% Porting Code
25% Product Support
15% Manual Testing
~5% Innovation
2% Continuous Integration
5% Agile Planning
15% Architectural Integrity
10% Unified Support
5% Automated Testing
3% Improving Tools
10% Writing Tests
~40% Innovation
2008 2011
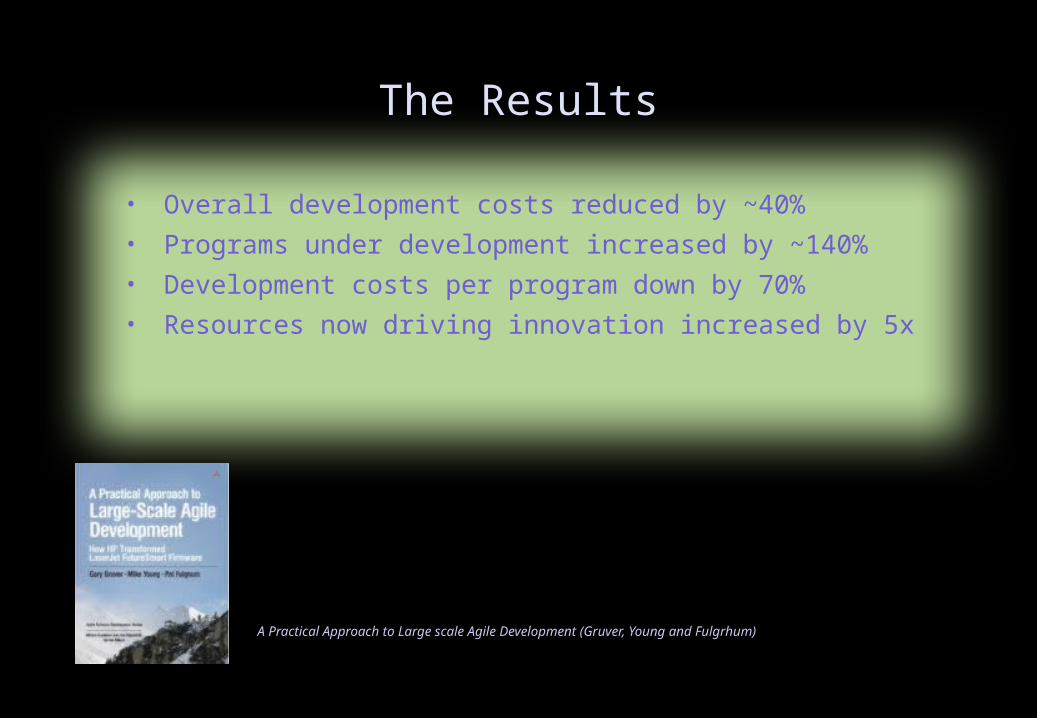
The Results
• Overall development costs reduced by ~40%
• Programs under development increased by ~140%
• Development costs per program down by 70%
• Resources now driving innovation increased by 5x
A Practical Approach to Large scale Agile Development (Gruver, Young and Fulgrhum)
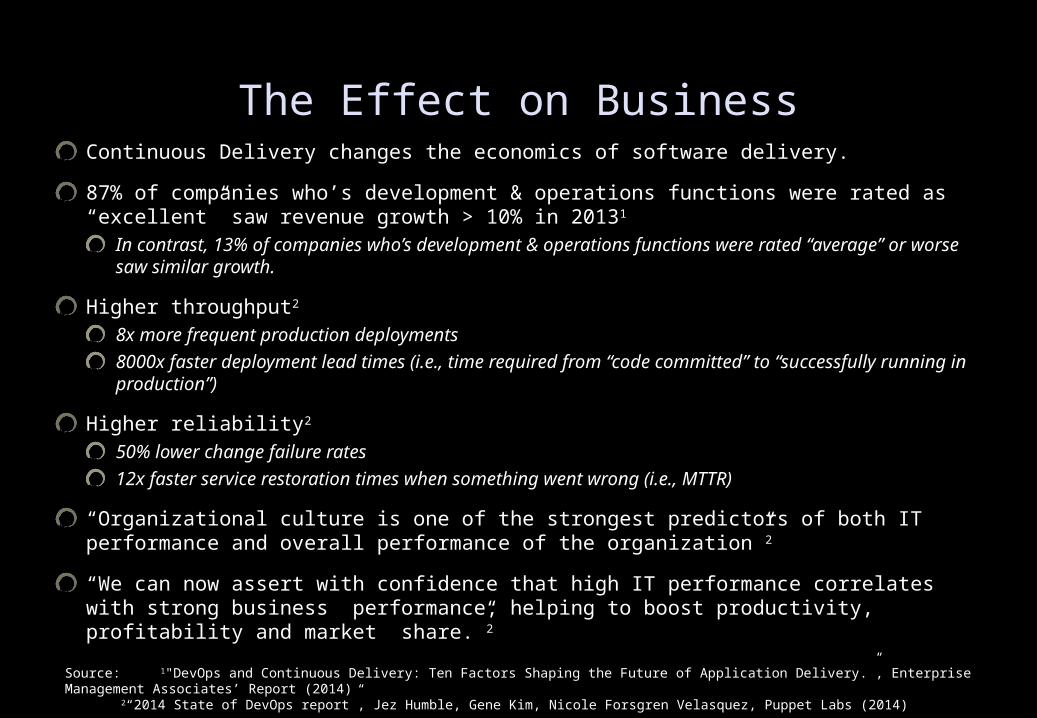
The Effect on BusinessContinuous Delivery changes the economics of software delivery.
87% of companies who’s development & operations functions were rated as “excellent” saw revenue growth > 10% in 20131
In contrast, 13% of companies who’s development & operations functions were rated “average” or worse saw similar growth.
Higher throughput2
8x more frequent production deployments
8000x faster deployment lead times (i.e., time required from “code committed” to “successfully running in production”)
Higher reliability2
50% lower change failure rates
12x faster service restoration times when something went wrong (i.e., MTTR)
“Organizational culture is one of the strongest predictors of both IT performance and overall performance of the organization”2
“We can now assert with confidence that high IT performance correlates with strong business performance, helping to boost productivity, profitability and market share.”2
Source: 1"DevOps and Continuous Delivery: Ten Factors Shaping the Future of Application Delivery.”, Enterprise Management Associates’ Report (2014)2“2014 State of DevOps report”, Jez Humble, Gene Kim, Nicole Forsgren Velasquez, Puppet Labs (2014)
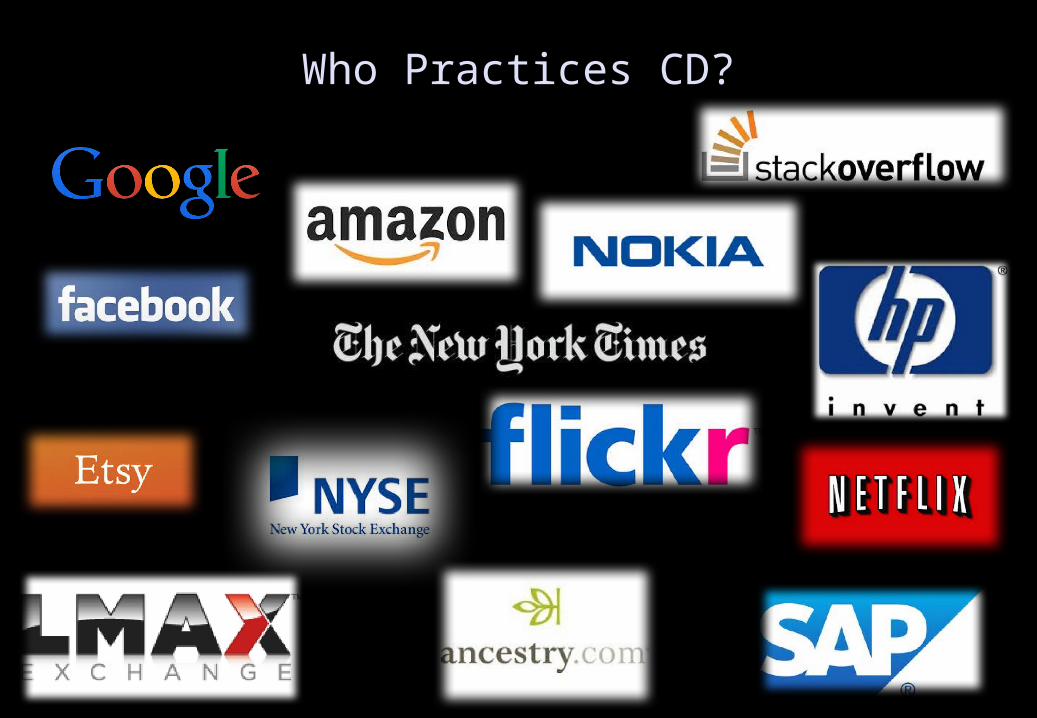
Who Practices CD?

Wrap up
Q & A
Dave Farley
http://www.davefarley.net