Dat~;o/8:>/.J- - TAMS Center: Data Toolsdatatools.tamscenter.com/hosted_files/SOPs/SOP... · SOP...
19
SOP FOR STANDARDS LABORATORY OPERATIONS Proc. 600, Rev.0 CLARK COUNTY DEPARTMENT OF AIR QUALITY Monitoring Division PROCEDURE NUMBER 600 Standards Laboratory Operations Revision number 0 07/23/2015 APPROVALS: Date !/ zJ / ;r Date 1 7- /d.8 /;5 Date 7/23/ 15 Pa ge I of20
Transcript of Dat~;o/8:>/.J- - TAMS Center: Data Toolsdatatools.tamscenter.com/hosted_files/SOPs/SOP... · SOP...

SOP FOR STANDARDS LABORATORY OPERATIONS Proc. 600, Rev. 0
CLARK COUNTY DEPARTMENT OF AIR QUALITY
Monitoring Division
PROCEDURE NUMBER 600
Standards Laboratory Operations
Revision number 0
07/23/2015
APPROVALS:
Date
!/zJ /;r
Dat~;o/8:> /.J-Date 1
7- /d.8 /;5 Date
7/23/ 15 Page I of20
SOP FOR STANDARDS LABORATORY OPERATIONS Proc. 600, Rev. 0
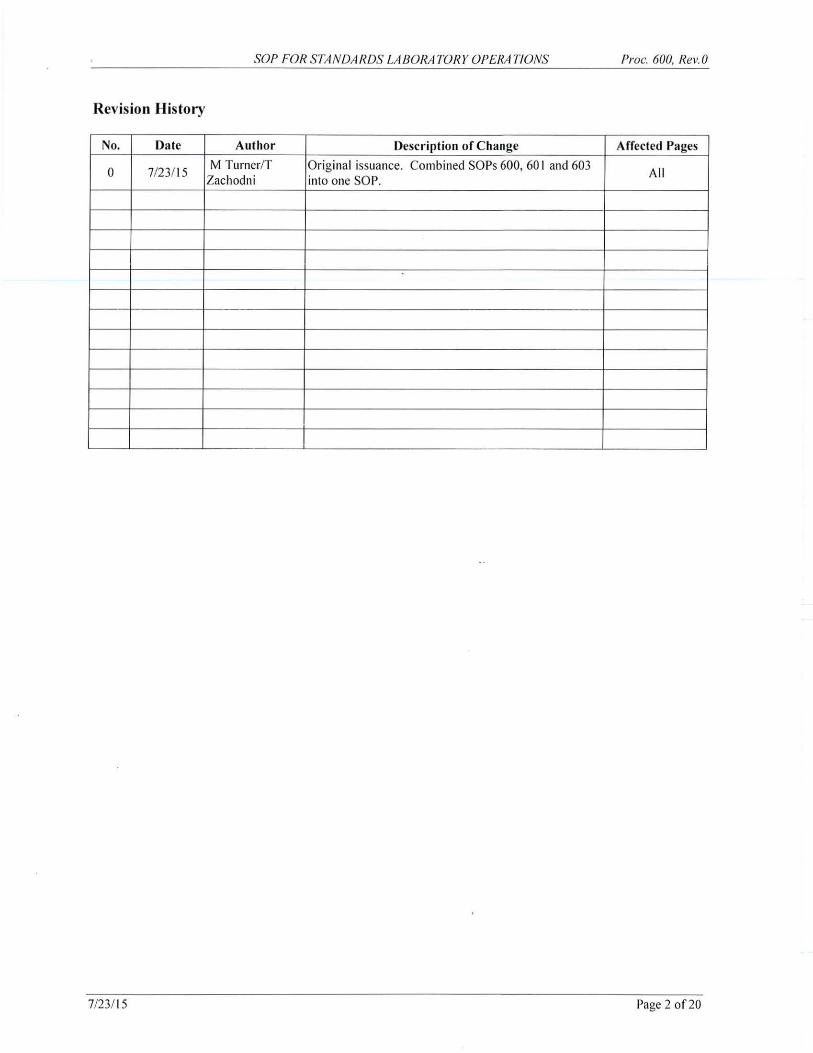
Revision History
No. Date Author Description of Change Affected Pages
0 7/23/ 15 M Turner/T Original issuance. Combined SOPs 600, 60 I and 603
All Zachodni into one SOP.
7/23/15 Page 2 of20

SOP FOR STANDARDS LABORATORY OPERATIONS Proc. 600, Rev. 0
TABLE OF CONTENTS
1.0 PURPOSE ........................................................................................................................... 7
2.0 SCOPE/APPLICABILITY ............................................................................................... 8
3.0 DEFINITIONS ....................................... ................... ............ ............................................. 9
4.0 ROLES AND RESPONSIBILITIES .............................................................................. IO
5.0 PROCEDURE ..... ............................................................................................................. 10 5 .I Sutntnary of Method ............... ........ ..................... .... ..... ........ .... .... ......................... 1 0
15.2 Health and Safety Warnings ................ ... .. .......... .. ............ .. ...... .. ........................... ! 0 5.3 Cautions ................................................ ..... ..... ....... .... .... ... ..... .................... ............ IO 5.4 Interferences .. ..... ................................... .. .. ...................................... .. ........... .... ...... ll 5.5 Equipment and Supplies ...... ............ ............... .. ....... ... ......................... .... .. ... ......... !! 5.6 Procedure ............... .. ...... .. ...... ... .... ..... .... ......... .. ................ ... .. ... .. .. ..... ... .... ...... ... .. .. !!
5.6.1 Receipt and Acceptance Testing of New Equipment ..................... .... ....... !! 5.6.2 Set-up of Calibrator .. ... ... .. .. ....................................... ..................... .... ........ II 5.6.3 Level Ill Ozone Transfer Standard Verification (6X6) ................. ..... ....... 12 5.6.4 Level III Ozone Transfer Standard Re-Verification .. ........ ...... ..... ..... ........ 14 5.6.5 Leak Check Procedure ........................................ .... ....... ............. ...... ......... 16 5 .6.6 Calibrator Mass Flow Controller Verification .......... ...... .. ......... ......... .. ..... 16 5.6.7 Standards Tracking ............................................... .. .... ............................... 19 5.6.8 Computer Hardware and Software ... .. ............ .. ....... ........ ...... ...... ... ............ l9
6.0 RECORDS MANAGEMENT ................................................. ........................................ 20
7.0 REFERENCES ................................................................................................................. 20
7/23/ 15 Page 3 of 20
SOP FOR STANDARDS LABORATORY OPERATIONS Proc. 600, Rev.O
LIST OF FIGURES
Figure I: Cotnparison .... .. .... ...... ......... .. .......................................... ..... ... .... .................................. 13 Figure 2: 6 X 6 Verification .......................... .......... ... .. ................... ........... ......... ........ .. ......... .. ..... l4 Figure 3: 6 X 6 Slope Chart ........................................................................................................... 15 Figure 4: Variability ... ..... ................ ... ....... .. ....... .. .... ..... ..... ...... ........... ..... ....... .. ....... ...... .. ............. l6 Figure 5: As Is Air MFC Verification ....... ............. ....................................................................... l 7 Figure 6: Final Air MFC Verification ..................... ... ... .. .... .. ..... ........................ .............. ... .. ... .... . 18 Figure 7: % Delta ............. .... ... .. ....... .. ........ .... .... ... ... ........... ....... ...... ... ............. ........ .... ................. 19
7/23/ 15 Page 4 of20

SOP FOR STANDA RDS LABORATORY OPERATIONS Proc. 600, Rev.O
LIST OFT ABLES
No table of figures entries found.
7/23115 Page 5 of 20

SOP FOR STANDARDS LABORATORY OPERATIONS
ACRONYMS AND ABBREVIATIONS
Acronyms
DAQ EPA LEADS NIST
Department of Air Quality
Abbreviations
U.S. Environmental Protection Agency Leading Environmental Analysis and Display System National Institute of Standards and Technology
CO Carbon Monoxide DAS Data Acquisition System I Average Intercept
m Average Slope MFC Mass Flow Controller I Mean Intercept ri1 Mean Slope NO Nitric Oxide N02 Nitrogen Dioxide NOx Nitrogen Oxides 03 Ozone PSIG Pounds per square in gauge QC Quality Control QA Quality Assurance RSD Resultant standard deviation express in % Sm Standard deviation of Slopes Si Standard deviation of intercepts S02 Sulfur Dioxide SOP Standard Operating Procedure SRP Standard Reference Photometer TAD Technical Assistance Document UV Ultra Violet
1.0 PURPOSE
Proc. 600, Rev. 0
T-he purpose of this procedure is to provide an overview of operations associated with the Standards Laboratory of the Monitoring Division of the Clark County Department of Air Quality (DAQ).
The Monitoring Division ' s Standards Laboratory conducts tests of instrument performance to ensure the equipment and field transfer standards used by division personnel are ofthe required specification, of the highest quality, and with the traceable authority necessary for the quality control of the criteria pollutant measurement system.
7/23/ 15 Page 7 of20

SOP FOR STANDARDS LABORATORY OPERATIONS Proc. 600, Rev.O
This SOP, along with the called out reference guides, will provide the necessary steps to maintain the highest quality of calibration standards available to the field technicians in support of the ambient air quality monitoring network.
2.0 SCOPE/APPLICABILITY
This procedure provides an overview on acceptance testing, setup, traceability, certification, verification, and tracking of the field standards used for the calibration and verification of the instrumentation employed in the ambient air quality measurement system.
The laboratory maintains National Insti tute of Standards and Technology (NIST) traceable reference standards for the calibration and verification of these field transfer standards. The laboratory manages these higher level reference standards by maintaining current, periodic certification of these standards. The reference standards are tracked by expiration date and are returned to the appropriate laboratory or vendor fo r re-certification prior to expiration.
The reference standard for ozone is the Level II photometer. The Level II transfer/primary standard is the authori tative standard for calibration and verification of the internal photometers found in the Level Ill 0 3 transfer standards. The Level II transfer/primary standard is located on the dedicated ozone verification bench in the standard 's laboratory and remains at this fixed location to ensure physical integrity and stability. The Level II transfer/primary is returned annually to the Califo rnia Air Resources Board Standards Laboratory for comparison to a Standard Reference Photometer (SRP).
The reference flow standard is also maintained on a dedicated bench in the standards laboratory for the purposes of calibration and veri fication of the mass flow controllers (MFCs) used in the dynamic dilution calibrators employed in the DAQ monitoring network. This flow standard provides compensated flow rate measurement at standard conditions and is returned annually to the vendor for calibration.
DAQ uses compressed gas cylinders of gaseous pollutant standards to obtain test concentrations for carbon monoxide (CO), sulfur dioxide (S02), nitrogen oxide (NO), and nitrogen dioxide (N02). These gaseous standards are N 1ST traceable and certified by the vendor to meet "EPA Protocol" certification procedures. As part of this certification the gas vendor is required to participate in the EPA Protocol Gas Verification Program.
Personnel in the standards laboratory pre-program the standardized quality control (QC) gas levels and level sequences (refer to Calibration Limits Levels and Sequences Guide) into the calibrators to ensure compatibility with the monitoring network's data acquisition system (DAS).
Additionally, the laboratory maintains and tracks numerous other reference standards for the calibration and verification of flow, temperature, pressure, relative humidity, voltage, and various signal generation devices. Field transfer standards used in support of the particulate monitoring network are tracked by laboratory personnel and returned to the vendor for annual calibration.
7/23/ 15 Page 8 of 20
SOP FOR STANDARDS LABORATORY OPERATIONS Proc. 600, Rev. 0
The laboratory has bench space where acceptance testing and verification of newly acquired monitoring equipment may be performed. The laboratory has an operational test station where instrumentation can be integrated into a simulated monitoring site, for testing purposes, under the control ofthe DAS.
Bench space is available for troubleshooting, repair, and testing.
3.0 DEFINITIONS
Transfer Standard - Is defined as a transportable device or apparatus which, together with associated operational procedures, is capable of accurately reproducing pollutant concentration standards or of producing accurate assays of pollutant concentrations which are quantitatively related to a higher level and more authoritative standard.
Level II Transfer Standard - DAQ maintains a stationary Level II ozone standard for verifying and calibrating the Level III ozone transfer standards. The Level II is verified against a Level 1 Standard Reference Photometer (SRP).
Level II Standard Uncompromised- The use of transfer standards of Level III and greater allows the Level II standard equipment and procedures to be used at a fixed laboratory location where the conditions of use can be carefully controlled. The equipment and procedures need not be compromised for field use, and there is no risk of damage to sensitive equipment during transport. Under the controlled conditions and fixed location, variability in the generated authoritative standard will be reduced, providing better accuracy and uniformity among all 0 3 analyzers in the network. If doubt arises in the quality of the Level III standard due to rough treatment in the field, it can be brought back in for re-verification to the Level II standard.
Level III Transfer Standard- DAQ uses commercial calibrators that incorporate a photometer and ozone generator that are capable of generating and assaying ozone concentrations. These calibrators are certified to the local Level II standard and are transported to the field to calibrate and verify the ozone analyzers.
Traceability - The property of the result of a measurement or the value of a standard whereby it can be related to stated references, usually national or international standards, through an unbroken chain of comparisons all having stated uncertainties.
Verification- Confirmation by examination and provision of objective evidence that specified requirements have been fulfilled. Verification of the accuracy of a transfer standard is established by (1) relating the output to an 03 standard of higher authority and (2) demonstrating that the repeatability of the transfer standard is within the limits.
Singularity - By using transfer standards, all 03 analyzer calibrations in a network can be related to a single UV photometer. All measurements in the network are then directly related to a single common standard (Level II), which can be verified by inter-comparison with other UV standards more easily and more frequently than multiple UV photometers could be. Concerns about variations or discrepancies among multiple UV standards are then eliminated.
7/23/ 15 Page 9 of20
SOP FOR STANDARDS LABORATORY OPERATIONS Proc. 600, Rev. 0
Standard Reference Photometer (SRP) - Stationary photometers maintained and operated by the EPA. They are referenced directly to the NIST primary photometer. Due to the longer UV paths and software they are more accurate and stable than other photometric devices.
4.0 ROLES AND RESPONSIBILITIES
It is the responsibility of the personnel assigned to the standards laboratory, to perform and document the tests, methods, and procedures necessary to demonstrate NlST traceability to all of the field transfer standards used for the calibration and quality control of the divisions pollutant measurement system's instrumentation.
It is the responsibility of Monitoring Supervisors to inspect and verify that the work performed followed all applicable procedures.
5.0 PROCEDURE
The gaseous field transfer standards must be calibrated and verified prior to initial use. Thereafter, periodic verification (refer to the Maintenance, Calibration, Certification, Firmware Schedules) is used to maintain the verification relationship. Laboratory pers01mel perform these verifications in the standards laboratory.
5.1 Summary of Method
All field standards used in support of the ambient monitoring network require periodic calibration or verification with traceability to NIST. This procedure defines these requirements and the associated guides provide step by step operation procedures.
5.2 Health and Safety Warnings
Hazards from physical activities involved in this procedure (lifting, carrying, etc.) can be minimized by using proper procedures for these types of activities.
Observe common safety practices in the handling, transport, and storage of compressed gas cylinders.
Some instruments produce UV light. Eye damage may occur if proper protection is not worn.
Nominal gas delivery pressure is 30 PSIG. Never set the delivery pressure to higher than 55 PSIG. To do so may cause damage to the unit or injury to the operator.
5.3 Cautions
Precautions should be taken to avoid mmecessary exposure to electrical shocks. Do not operate the calibrator without a functioning power line ground.
7/23/15 Page 10 of20

SOP FOR STANDA RDS LABORA TORY OPERATIONS Proc. 600, Rev.O
High voltages are present inside the calibrator.
Care should be taken in the handling and installation of the equipment. The calibrator's photometer contains fragile glass sample tubes. A void rough handling.
This list is not all inclusive of the risk involved in this procedure. Common sense, safety training and supervisory communication are advised if safety concerns arise.
5.4 Interferences
Damaged equipment or Teflon tubing may cause poor equipment performance. Faulty equipment connections, leaks, contaminated filters, spent scrubber material, dirty reaction cells and photometer tubes can alter instrument performance.
5.5 Equipment and Supplies
Computer to document certifications, verifications, and acceptance tests Terminal emulation program to communicate with instruments Access to manufacturer's manuals, SOPs, TADs, or EPA directives Applicable reference standards Tubing and connection fittings Leak check fittings and adapters
5.6 Procedure
5.6.1 Receipt and Acceptance Testing of New Equipment
Upon receipt of new instrumentation, the instrument will need to be added to the inventory record, inspected for physical shipping damage, verified for correct operation, and documentation logs created (refer to the Instrument Acceptance Testing, Setup & Operating Parameters and Designations Guide and the (Station Operations Guide).
5.6.2 Set-up of Calibrator
7/23/ 15
The DAS measures, records and processes the measurements made in the air quality network. The system also incorporates automated quality control tests of the gaseous analyzers on a standardized schedule (refer to the Maintenance, Calibration, Certification, Firmware Schedules). This is accomplished by the correct set up of the scheduler of the data logger (refer to the Data Logger Guide), and the level and sequence settings on the calibrator (refer to Calibration Limits Levels and Sequences Guide).
The laboratory personnel initially set up the level and sequence configuration into the calibrator prior to the calibrator going to the field (refer to Calibration Limits Levels and Sequences Guide). This is accomplished using terminal emulation software to transfer the level and sequence files to the calibrator via the calibrator's serial port.
Page II of 20

SOP FOR STANDARDS LABORATORY OPERATIONS Proc. 600, Rev.O
Each pre-defined test concentration is assigned a level number. The levels are programmed to produce the type of gas, the concentration, total flow of the test gas, and status bits I and 2 (refer to the Calibration Limits Levels and Sequences Guide). The calibrator communicates this information through its serial port to the data logger, and in doing so sets the correct data quality flag to denote QC is occurring.
Each pre-defined QC sequence is assigned a sequence number (refer to the Calibration Limits Levels and Sequences Guide). The sequences are programmed to produce a series of pre-defined levels to challenge the analyzers under test.
5.6.3 Level lii Ozone Transfer Standard Verification (6X6)
7/23/15
The following is a general overview of the verification process for the Level III ozone transfer standard. Each individual model of calibrator has a reference guide detailing the process (refer to the Calibrator Verification Guide).
1. Each calibrator model has a spreadsheet template in which the initial 6 X 6 verification will be documented. Select the template from the template folder located on the DAQ network drive.
2. The verification relationship shall consist of the average of 6 individual comparisons of the transfer standard to the authoritative Level II Photometer. Each comparison must be carried out on a different day.
3. Each comparison shall consist of at least 6 levels at concentrations evenly spaced over the concentration range of the Level III transfer standard, including 0 and 90% (± 5%) ofthe upper range limit. For the 6levcls of each comparison, compute the slope and intercept by the least squares linear regression of the Level III transfer standard and the Level H Photometer. (See Figure 1.)
4. For the 6 comparisons, compute the average slope (m) and the average intercept (I). 5. Compute the relative standard deviation (RSD) of the 6 slopes (sm), and the standard
deviation for the 6 intercepts (si). (See Figure 2.) 6. The value ofsm must be :S 3.7%, and si must be :S 1.5 (ppb). (See Figure 2)
Page 12 of 20

SOP FOR STANDARDS LABORATORY OPERATIONS Proc. 600, Rev. 0
Figure 1: Comparison
Ca libt·a tot· LEVEL-3 T.-ansfet· LEVEL-2 T.-ansfe t· API 400 E S/N 1047-S I Sample Press un:: __ ,.-::.27_1n·Hg· A
Sample Te mpemlui"C : 34.4 o C CCI DII 133000 Pholo SPress : 26.9 IN- HG-A
l' ho lomele r STemp: __ .;;;.39.:;..; . .;_5 o C S/N: 23 1
Test C onditions l'holo !\I easure: 4343 MV OJ Refe i"C nce: 3639 Mv
Da~· : 6 of6 Pholo Reference: 4343 .3 MV 03 !\Ieasure: 3639 M v Dale/Time : 4 /8/20 14 l' holome le r Flow: 0. 792 LPM Sample Flow: 8 13 CC/M
Ve rifie d By: T!m1er O ulpul Flow: 4.2 LPM LEVEL-2 Ve t·itica tion Da ta Press ure: 29.55 IN-HG-A Box Temp: 28.8 ° C Leve l-2 S lope: 1.0008
Tempeml ui"C: 24.44 oc l'holo S lope: 0.996 Leve l-2 lnl: 0.0005 Pholo OITsel· 0 2 PPB Level-2 Verifica lion Due Dale· 6/26/20 14
S et Point i I I 2 I 3 I 4 I 5 I 6 I 7 I 8 I 9 I 10 I AVG . ] Lcwi-J I 0.000 I 0.000 I 0.000 I 0.000 I 0.000 I 0.000 I 0.000 I 0.000 I 0.000 I 0.001 I o.ooo I Oppm
l...c"~ l-2 I 0.0028 I o.oo29 I o.oo29 I 0.0030 I o.oo29 I o.oo28 I o.oo21 I o .oo28 I o.oo29 I o .oo29 I o.oo26 I l..c\d-3 I 0.050 I 0 .050 I o.o5o I 0.050 I 0 .050 I 0.050 I 0.050 I 0.050 I 0.050 I 0.050 I o.o5o 1
fl.05 l'J'Itl
l..c'cl-2 I 0.053 I 0 .053 I 0 .052 I 0.052 I 0 .052 I 0.052 I 0.052 I 0.052 I 0.052 I 0.052 I o.o52 I Lc\c-14 3 I 0.090 I 0.090 I 0.090 I 0.090 I 0.090 I 0.090 I 0.090 I 0.089 I 0.089 I 0.089 I o.o9o I
0. 09 ppm
Lcwl-2 I 0.093 I 0.092 I 0.092 I 0 .092 I 0.092 I 0.092 I 0.092 I 0.092 I 0.092 I 0.092 I o.on 1 l.c\ci -J I 0.200 I 0.200 I 0.200 I 0.200 I 0.200 I 0.200 I 0.200 I 0.200 I 0.200 I 0.200 I o.2oo I
0.2ppm
l.c'cl-2 I 0.202 I 0.202 I 0.202 I 0.202 I 0.202 I 0.202 I 0.202 I 0.202 I 0. 202 I 0.202 I 0.202 I Lcwi-J I 0.300 I 0.300 I 0.300 I 0.300 I 0.300 I 0.300 I 0.300 I 0.300 I 0.300 I 0.300 I o.3oo I
0.3 ppm
Lcwl-2 I 0.30 1 I 0.30 1 I 0.30 1 I 0.302 I 0.30 1 I 0.30 1 I 0.30 1 I 0.30 1 I 0.30 1 I 0.30 1 I 0.30 1 I L.cwl-3 I 0.400 I 0.400 I 0 .400 I 0.40 1 I 0.400 I 0.40 1 I 0.400 I 0.40 1 I 0.40 1 I 0.400 I 0.400 I
0.4ppm Lcwl -2 I 0.40 1 I 0.40 1 I 0.40 1 I 0.402 I 0.402 I 0.40 1 I 0.40 1 I 0.40 1 I 0.40 1 I 0.40 1 I 0.40 1 I OA 53 I 0.453 I 0.452 I 0.452 I 0.452 I 0.452 I 0.4 52 I 0.452 I 0.45 1 I 0.452 I 0.452 I 0.452 I
0.45ppm
Lc\cl -2 I 0.454 I 0.453 I 0.453 I 0.453 I 0.453 I 0.453 I 0.453 I 0.453 I 0.453 I 0.452 I 0.453 I
7/23115 Page 13 of20

SOP FOR STANDA RDS LABORATORY OPERATIONS Proc. 600, Rev.O
Figure 2: 6 X 6 Verification
LEVEL-2 LEVEL-3 I %DELTA 0 0.0001
, #DIV/01
0.050 0.050 0.8065 DATE- 4/8/20 14
0.089 0.090 0.2459 NEXT DUE DATE- W /20 14
0. 199 0.200 0.37 14 SIGNATURE-0.299 0300 0.42 18 0399 0.400 0.4365 0.450 0.452 03508
SLOPE = 1.003696 «<i\1 UST BE WIT111N +/-.05 OF CURRRENT i\1EAN SLOPE
INTERCEPT = 0.000078 Difference = -0.000076
R2 = 0.999999
Previous Slo~s Previous lnterce[!IS I MEAN SLOPE I i\1 EAN INTERCEPT
4/1/2014 1.002021 <011 11 1 ~ -0.00045 1 1.0037725 -0 000269167
4/2/20 14 1.004935 <011 11 2 ~ -0.000355 I STANDAIW DEVIATION OF SLOPES RSD 4/3/2014 1.004345 <011113~ -0.000 183 0.000987049 MUST BE < 3. 7%>»> 0.0983% 4/4/201 4 1.00358 411114~ -0.00029 !STANDARD DEVIATIO:'II OF INTERCEPTS I PPB I 4/7/2014 1.004058 411115~ -0.0004 14 0.000 194829 MUST BE ±1.5 PPB»» 0. 1948 4/8/20 14 1.003696 411 11 6~ 0.000078 RSD = Resultant Standard Deviation expressed in %
Previous Mean SIOI?!;S 3.7% Spec. +5% of Mean S lo!!!; -5% of Mean Sloj!!; Previous Mean Interce(!ls 1.5S~c.
4/ 1/20 14 1.000202 1 1.0502 12205 0.950192 -0 000451
4/2/20 14 1.003478 0.2053 1.05365 19 0.9533041 -0.000403 0.0679 4/3/2014 1.003767 0.1535 1.05395535 0.953:57865 -0.000329667 0.1358 4/4/2014 1.00372025 0.1257 1.053906263 0.95353424 -0.0003 1975 0.1126 4/7/2014 1.0037878 0.1099 1.053977 19 0.9535984 1 -0.0003386 0.1063 4/8/2014 1.0037725 0.0983 1.0539611 25 0.95358388 -0 000269167 0. 1948
5.6.4 Level III Ozone Transfer Standard Re-Verification
7/23/ 15
A verified Level III transfer standard must be re-verified periodically (refer to the Maintenance, Calibration, Certification, Firmware Schedules). A transfer standard which loses its verification may cause the loss of ambient 0 3 measurements made with ambient monitors that were calibrated with the transfer standard. If a transfer standard loses its verification or needs repair, it must again under-go the 6 X 6 verification (refer to the Maintenance, Calibration, Certification, Firmware Schedules).
I . The first step in the re-verification procedure is to carry out a comparison to Level II Photometer (see Figure I).
2. The comparison is documented in the current 6 X 6 verification spreadsheet. This will be the most recent verification that was performed for the calibrator under test. To access the file look for the most recent file for the calibrator under test on the DAQ network drive.
3. To maintain verification, the results of the new individual linear regress ion slope of the new comparison must be within ± 5% of the average slope of the current 6 X 6 verification relationship (i.e. the average slope of the last 6 comparisons). Thus, the new individual slope must be within ± 5% of the current mean slope. A convenient
Page 14 of20

SOP FOR STANDARDS LABORATORY OPERATIONS Proc. 600, Rev.O
way to monitor the performance of a transfer standard is to plot each new slope as shown in Figure 3.
4. If the new slope is within the ± 5% specification, then a new mean slope (rn) and a new mean intercept (I) are calculated using the new comparison and the 5 most recent previous comparisons. Thus ri1 and I are running or moving averages always based on the 6 most recent comparisons. (See Figure 2)
5. New values for the re lative standard deviation of the slopes (sm) and the quantity (si) are calculated based on the new comparison and the 5 most recent prev ious comparisons. These parameters can also be monitored with a chart format similar to Figure 4.
Figure 3: 6 X 6 Slope Chart
7/23/15
6 X 6 03 VERIFICATION OF TAPI T703 SIN 231
~•-Slopes -+-Mean Slopes --+5% Of Mean Slopes ---5% of Mean Slopes
VERIFICATION #
2 3 4 5 6
1.08
1.06
1.04 (J)
1.02 ~ ~
0 .....::! (J)
0.98
0.96
0.94
0.92
6. The new sm and si must again meet the respective 3.7% RSD and ± 1.5 ppb. If all specifications are met, then a new verification relationship (based on the updated m and I) is established and illustrated by Figure 4.
7. If a transfer standard fails to meet one of the re-verification spec ifications, it loses its verification. Re-verification then requires 6 new comparisons according to the entire verification procedure. This failure could be due to a ma lfunction (refer to instrument manual for troubleshooting techniques), which should be corrected before repeating the verification procedure (if a transfer standard has been repaired or serviced in a way which could affect its output, the complete verification procedure must also be repeated.) Another possible cause for fa ilure of the re-verification specifications might be a change in the photometer cal ibration, which should then be re-established before the verification is repeated.
Page 15 of 20

SOP FOR STANDARDS LABORATORY OPERATIONS Proc. 600, Rev. 0
Figure 4: Variability
6 X 6 VERIFICATION VARIABILITY TAPI Model T703 SN 231
- 3.7% SPECIFICATION FOR SLOPES - 1.5% SPECIFICATION FOR INTERCEPTS
4 1.5
0.5
0 2 3 4 5 6
VERIFICATION #
5.6.5 Leak Check Procedure
Prior to performing the verification of the mass flow controllers a leak check should be accomplished.
5.6.6 Calibrator Mass Flow Controller Verification
7/23/ 15
The dilution calibrators used in the QC of the field analyzers use mass flow controllers (MFCs) for the blending of test gas concentrations from EPA Protocol Gas Standards. These MFCs provides discreet proportional flow control of diluent air and the pollutant gas being blended. Periodic verifications are conducted to ensure accuracy of the MFCs. The verifications are to a flow standard of higher authority, and are accomplished at the laboratory ' s flow bench. The laboratory flow standard automatically compensates for changes in temperature and pressure and provides real-time compensated flow rates.
First, the calibrator' s MFCs are compared to the reference flow standard in an "As Found" condition (see Figure 5). Usually, this is followed by a calibration throughout the MFCs range, where the MFC is adjusted by software calibration constants, to agree to the external reference standard. Then, the MFC is once again verified to the external standard to determine an "As Left" condition (see Figure 6). Acceptance criteria are based on a correlation coefficient of greater than .999, and no single point exceeding the bounds of greater than ± 2% of the point (see Figure 7).
Page 16 of20

SOP FOR STANDARDS LABORATORY OPERATIONS
The complete suite of MFCs, for each calibrator, is verified in this manner.
Figure 5: As Is Air MFC Verification
Verified By- M Turner I Verification Type "As Is"
SN i l 3 i Verification Date 3117120 i 4
Test Conditions: J Previous Cai.Date lnRk1i
Room Temperature- 24 c Barometric Pressure- 696 mmHg AJr Source Pressure- 30 PSIG
Indicated J MFC DRV - mVOC I Ext. Flow Std.
0.000 0 1.031 500 1. 530 750 2.031 1000 2.528 1250 3.034 1500 3.533 1750 4.035 2000 4.528 2260 5.026 2500 5.520 2760 6.035 3000 6.538 3260 7.035 3500 7.514 3760 8 .044 4000 8.525 4260 9.038 4500
0 1.08 1.61
2.145 2.685 3.21 3.74
4.276 4 .81 6.33
6.866 8.395 8.926 7.46 7.99
8.626 9.0~
9.67
Slope= 0.9421 Intercept= 0.0063
Flow Transfer Standard:
Manufacturer CME
Model Number 60B-7!;.20A
Serla I Number 6<MOO
Calibration Date 1012212013
Expl,atlon Date 10/22/2014
Net Change
0.000 0.049 0.080 0.114 0.157 0.177 0.207 0.241 0.282 0.304 0.345 0.360 0.387 0.425 0 .476 0.481 0.625 0.532
R2 = 1.0000 « Must be gruter than0.999
Proc. 600, Rev.O
7/23/ 15 Page l7of20

SOP FOR STANDARDS LABORATORY OPERATIONS
Figure 6: Final Air MFC Verification
7/23/15
Verified By- J\•ITumer
SN 113 1
Test Conditions: Room Temperature 24
Barometric Pressure 696 Air Source Pressure- 30
Indicated I MFC DRV- mVDC I 0.000 0 1.070 500 1.610 750 2.140 1000 2.675 1250 3.210 1500 3.745 1750 4.270 2000 4.800 2250 5.330 2500 5.850 2750 6.390 3000 6.920 3250 7.445 3500 7.975 3750 8.495 4000 9.020 4250
9.550 4500
Veification Type FIN AL
Date- 3/ 1712014
c mmHg
PSIG
Ext. Flow Std.
0.000 1.070 1.610 2.140 2.676 3.210 3.745 4.270 4.800 6.330 6.850 6.390 6.920 7.445 7.876 8.485 8.020
8.650
Flow Transfer Standard:
Manufacturer CME
Model Number 608·75-20A
Serial Number &600
Calibration Date 10/22/2013
Explr~tlon Date t0/22/2014
Net Change
0.000 0.000 0.000 0.000 0.000 0.000 0.000 0.000 0.000 0.000 0.000 0.000 0.000 0.000 0.000 0.000 0.000
0.000
Next Verification Is Due on : 611512014
Slope = 1 .0000 Intercept= 0.0000
R2 = 1.0000 <<<Must Be Greater Than .999 ..:S:.:.Ig"'n'-"a=-=t=u.:..:re=-:=-------------
Proc. 600, Rev. 0
Page 18 of20

SOP FOR STANDARDS LABORATORY OPERATIONS Proc. 600, Rev.O
Figure 7: % Delta
107 107 000 1090 109
161 161 000 1610 161 000
214 2 14 000 2 1 40 21 4 000
268 2675 000 26 70 267 000 321 321 000 31 90 31 9 000
3 75 3 745 000 37. 10 371 000
4 27 4 27 000 42 30 42 3 noo 4 80 4 8 000 47 50 47 5 000
533 5 33 000 52 70 52 7 000
586 586 000 5800 58 000
6 39 6 39 0 00 6320 632 0 00
692 692 0.00 6850 685 000
7 45 7 445 000 73 70 13i' 000
798 7 975 000 79 10 79.1 000
850 a 495 000 84.50 84.5 000
902 902 000 89 90 89 9 000
955 955 000 95 50 95 5 000
Percent Difference of Flows
., 2.50 "' c
1+ 2 % Limit J
., 1.50 ,_
~ Q
0.50 -c
'"' "' ,_ '"' c.
/·Z % Umit J
Oo/o Difl"erenceGas MFCI
5.6.7 Standards Tracking
5.6.8
7/23/ 15
Tracking the veri tication intervals of all of the field standards and laboratory standards is done by the laboratory personnel to ensure the standards are kept current. There are three Excel tracking spreadsheets designed for this purpose, one for standards verified in the Standards Lab, one for standards returned to the vendor for verification, and one for gas cylinder tracking. All three of these spreadsheets are on the DAQ network and are entitled:
• Calibrator - Tracker • Field Standards Tracker • Gas Cylinder Tracker
Computer Hardware and Software
The normal course of lab operations requires the use of a laptop or desktop computer for generating verification and acceptance test reports, and documenting work in instrument logbooks.
Page 19 of20

SOP FOR STANDARDS LABORATORY OPERATIONS Proc. 600, Rev. 0
Typical terminal emulation programs such as Hyper-Terminal , Pro-Comm Plus, APIComm, and /-Port are used in communicating with the instruments.
Copy or access to the correct associated spreadsheet or word documents for the work involved.
6.0 RECORDS MANAGEMENT
All electronic records stored on the DAQ network drive, unless otherwise designated, are considered to be official record of the activity. This location allows for review by Supervisors, QA Officer, and Management.
7.0 REFERENCES
USEPA Quality Assurance Handbookfor Air Pollution Measurement Systems, Volume II. Ambient Air Quality Monitoring Program. EPA-454/B-13-003, May 2013 http://www. epa.govl ttn/amtic/files/ ambienllpm25/qa/QA-Handbook-Vol-Jlpd(
Transfer Standardsfor Calibration of Air Monitoring Analyzers/or Ozone Technical Assistance Document: http://www.epa.govlttn/amticlfiles/ambientlqaqc/OzoneTransferStandardGuidance.pd(
Additional Documents:
Guides Calibration Limits Levels and Sequences Guide Calibrator Verification Guide Data Logger Guide Instrument Acceptance Testing, Setup & Operating Parameters, and Designations Guide
Schedules Maintenance Calibration Firmware Schedules
7/23/ 15 Page 20 of20