Dating models using man-made radionuclides Part 1: 137 Cs flux, vertical profiles and inventories...
25
Dating models Dating models using man-made using man-made radionuclides radionuclides Part 1: Part 1: 137 137 Cs flux, vertical profiles Cs flux, vertical profiles and inventories and inventories Roberta Delfanti ENEA –La Spezia, Italy 1 IAEA Regional Training Course on Sediment Core Dating Techniques. RAF7/008 Project CNESTEN, Rabat, 5 – 9 July 2010
-
Upload
colleen-strout -
Category
Documents
-
view
213 -
download
0
Transcript of Dating models using man-made radionuclides Part 1: 137 Cs flux, vertical profiles and inventories...
Dating models Dating models using man-made radionuclidesusing man-made radionuclides
Part 1:Part 1:137137Cs flux, vertical profiles and inventoriesCs flux, vertical profiles and inventories
Roberta DelfantiENEA –La Spezia, Italy
1
IAEA Regional Training Course on Sediment Core Dating Techniques. RAF7/008 Project
CNESTEN, Rabat, 5 – 9 July 2010

Why are we interested in sediments?Why are we interested in sediments?
Sediments are environmental archives where the events that have taken place in the sea are recorded.
Changes in particle supply from catchement basins, pollution, harmful algal blooms, changes in temperature, etc.
All events are characterised by “markers” stored in the sediment.
2

Why are we interested in sediments?Why are we interested in sediments?
Sediment coreAlboran Sea.
W-Med after thelast deglaciation.
20,000 y B.P.to present days.
14C givesthe time scale
Cacho et al., 20023

Why are we interested in sediments?Why are we interested in sediments?
Sediments in the coastal areas concentrate most heavy metals, POPs and radionuclides.
More, they contain the whole history of recent pollution.
Radionuclides allow us to Radionuclides allow us to define a time scale for the events define a time scale for the events
registered in sediments.registered in sediments.
The knowledge of how and how fast sediments are accumulated in a coastal area is one of the basic parameters for understanding its functioning and hence for its management.
4

5
OutlineOutline
• Fluxes of anthropogenic radionuclides (Fluxes of anthropogenic radionuclides (137137Cs)Cs)• Vertical profiles in sediments Vertical profiles in sediments • Factors affecting them:Factors affecting them:
inputinput bioturbationbioturbation grain size/porositygrain size/porosity compactioncompaction
• InventoriesInventories

Global falloutGlobal fallout
Hamilton, 2004 6

Input function of Input function of of Antrhropogenic Radionuclides of Antrhropogenic Radionuclides
60 65 70 75 80 85 90 950
200
400
600
800
1000
1200
1400
1600
1800
2000
Flu
x of 1
37 C
s (B
q m
-2 y
-1)
Year
137Cs fallout in N-Italy, 1959 - 2000
239,240239,240PuPu : same input function,no Chernobyl peak
Integrated deposition density(2010)
30- 40°N: 80 Bq m-2
7
137Cs cumulative fallout deposition (2010) 30- 40°N: 2 kBq m-2 + Chernobyl

60
65
70
75
80
85
90
0 200 400 600 800 1000 1200 1400 1600 1800 2000
Conc. 137Cs
Ann
o
Theoretical vertical profile of Theoretical vertical profile of 137137Cs Cs in a sediment corein a sediment core
If sediment acumulation rateis relatively fast (cm/y)the radionuclide vertical profile should reflectits input function.
8

Factors affecting radionuclide profilesFactors affecting radionuclide profiles
Real profilesare influenced by several factors:
0
5
10
15
20
25
30
0 2 4 6 8 10 12 14 16 18 20
Cs-137 (Bq kg-1)
Dep
th (
cm)
NW Med
differences in athmospheric input
river inputs
sedimentary regime
bioturbation
grain size 9

The presence/magnitudeof the Chernobyl and fallout peaks depends ondeposition in the area.
0
10
20
30
40
50
60
0 5 10 15 20 25 30 35
Activity, Bq/kg
Dept
h, cm
NE Med
10
Factors affecting radionuclide profiles:Factors affecting radionuclide profiles:inputinput

Construction of borrows and constant irrigation due to biological activity results in a higher water content of the surface sediment layers
Particle mixing due to biological activity modifies radionuclides profiles.
11
Factors affecting radionuclide profiles:Factors affecting radionuclide profiles:BioturbationBioturbation

12
Factors affecting radionuclide profiles:Factors affecting radionuclide profiles:BioturbationBioturbation
137Cs vertical profile,NW Med, 2009Depth: 15 m

The sediment structure: The sediment structure: grain size, porositygrain size, porosity
Porosity Φ = Volume of water / Volume of total sediment
Porosity of clay: 0.7 – 0.9Porosity of sand: 0.3 – 0.5
13
Boudreau, 1997

The sediment vertical structure: The sediment vertical structure: compactioncompaction
Compaction: loss of water Compaction: loss of water from a layer of sediment, due to compressioncompression arising from the deposition of overlaying sediment.
NEW
No compaction
NEW
Compaction
14

The sediment structure: The sediment structure: compactioncompaction
The The behaviour during compaction behaviour during compaction of sands and claysof sands and claysis different: is different: finefine-grained clays undergo -grained clays undergo continual continual compaction compaction even on a cm-by-cm basis, while for even on a cm-by-cm basis, while for sandsandthe decrease in porosity with depth is the decrease in porosity with depth is minimal.minimal.
15

PorosityPorosity
For sediment cores, we can plot porosity versus depth.Porosity in the surface layers is higher(lower compaction, bioturbation).
Exponential decrease Homogeneous grain size
High porosity Fine grained sediment
16

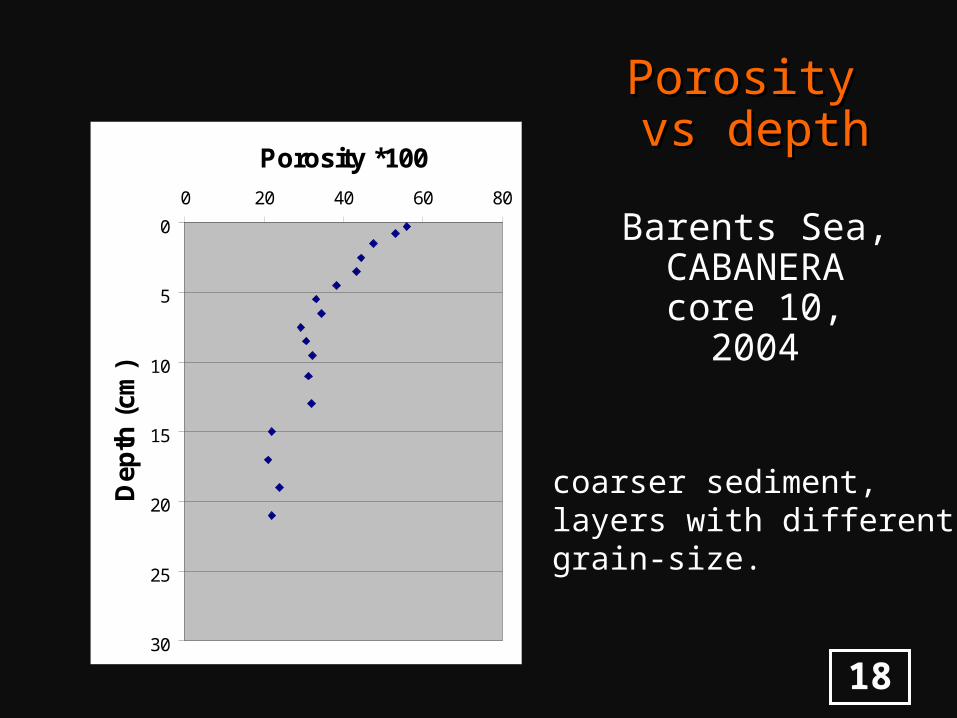
Porosity Porosity vs depthvs depth
Barents Sea,CABANERA
core 10,2004
0
5
10
15
20
25
30
0 20 40 60 80
Porosity * 100D
ep
th (
cm
)
silty, homogeneoussediment.
17
0
5
10
15
20
25
30
0 20 40 60 80
Porosity *100D
epth
(cm
)
coarser sediment,layers with differentgrain-size.
Porosity Porosity vs depthvs depth
Barents Sea,CABANERA
core 10,2004
18

Compaction and RN profilesCompaction and RN profilesconstant sed. accum. rate constant sed. accum. rate
2002
2003
2004
2005
2006
No compaction
20022003
2004
2005
2006
Compaction
The dry weight of the sediment is the same in every layer,what changes is the water content.water content.
19

Compaction and RN profiles
How can we correct our vertical profilesfor the effect of compaction?
An easy way is to calculate the integrated sedimentmass per unit area and re-plot theradionuclide vertical profile versus mass depth.
mass depth (g cm-2)
weight of dry sediment at a given depth (g)= --------------------------------------------------------- core surface (cm-2)
20

Compaction and RN profilesCompaction and RN profiles
30
25
20
15
10
5
00 2 4 6 8 10 12 14 16 18 20
Cs-137 (Bq kg-1)
Mas
s D
epth
(g
cm
-2)
0
5
10
15
20
25
30
0 2 4 6 8 10 12 14 16 18 20
Cs-137 (Bq kg-1)
Dep
th (
cm)
21
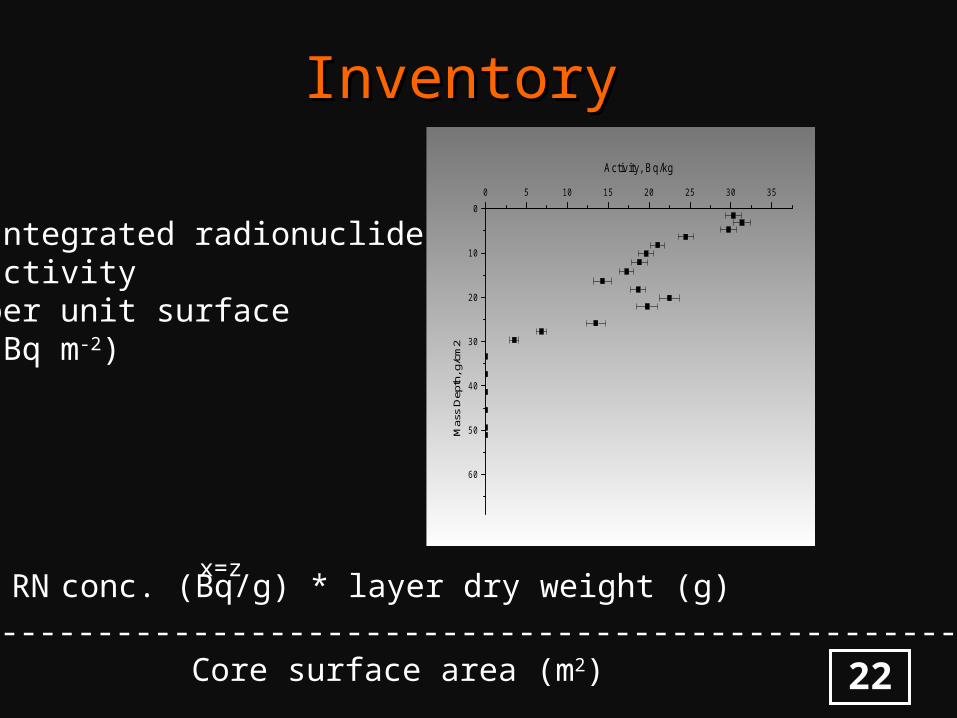
InventoryInventory
Integrated radionuclideactivityper unit surface(Bq m-2)
0
10
20
30
40
50
60
0 5 10 15 20 25 30 35
Activity, Bq/kg
Mas
s De
pth,
g/c
m2
x=0 RN conc. (Bq/g) * layer dry weight (g)
I = --------------------------------------------------------- Core surface area (m2)
x=z
22

23
Inventories of Inventories of 137137Cs Cs in different areas of the Med Sea in different areas of the Med Sea
Algerian Basin, 2007Depth: 2500 m
Inventory: 0.2 kBq m-2
30
25
20
15
10
5
00 2 4 6 8 10 12 14 16 18 20
Cs-137 (Bq kg-1)
Mass D
ep
th (g
cm
-2)
Ligurian Sea, 2000Depth: 20 m
Inventory: 1.2 kBq m-2

Inventories of Inventories of 137137Cs Cs in the Mediterranean Seain the Mediterranean Sea
24
89
Data from: Arnaud et al., 1995; Delfanti et al., 1997Livingston, 1978Barsanti et al., submitted.
72155
70-150
Cumulative Fallout deposition (2010): 1600 Bq m-2
Chernobyl: 1000-15000 Bq m-2
Prodelta mud:2500-64000Shelf mud: 700-6000Sand: 400-1200
Rhone mouth:1200-30000
194
19090

Inventories of Inventories of 137137Cs Cs in the Mediterranean Seain the Mediterranean Sea
25
7
>180
9057
4750-34020-130
Data from: Delfanti et al., 1995; Anton et al., 1995Delfanti e Papucci, 1989; Fowler et al., Jennings et al., 1985; Livingston, 1978.
180
37
2
3
Cumulative fallout deposition: 80 Bq m-2
![Risks from naturally occurring radionuclides in the Nordic ...¸d.pdf · radiation Other radionuclides in air [KATEGORINA VN] [KATEGORINA VN] Anthropogenic radionuclides in diet Average](https://static.fdocuments.us/doc/165x107/5f8a90afcd79846e8d420ef0/risks-from-naturally-occurring-radionuclides-in-the-nordic-dpdf-radiation.jpg)