Date of Meeting: July 21, 2016 #I-2 - Granicus
22
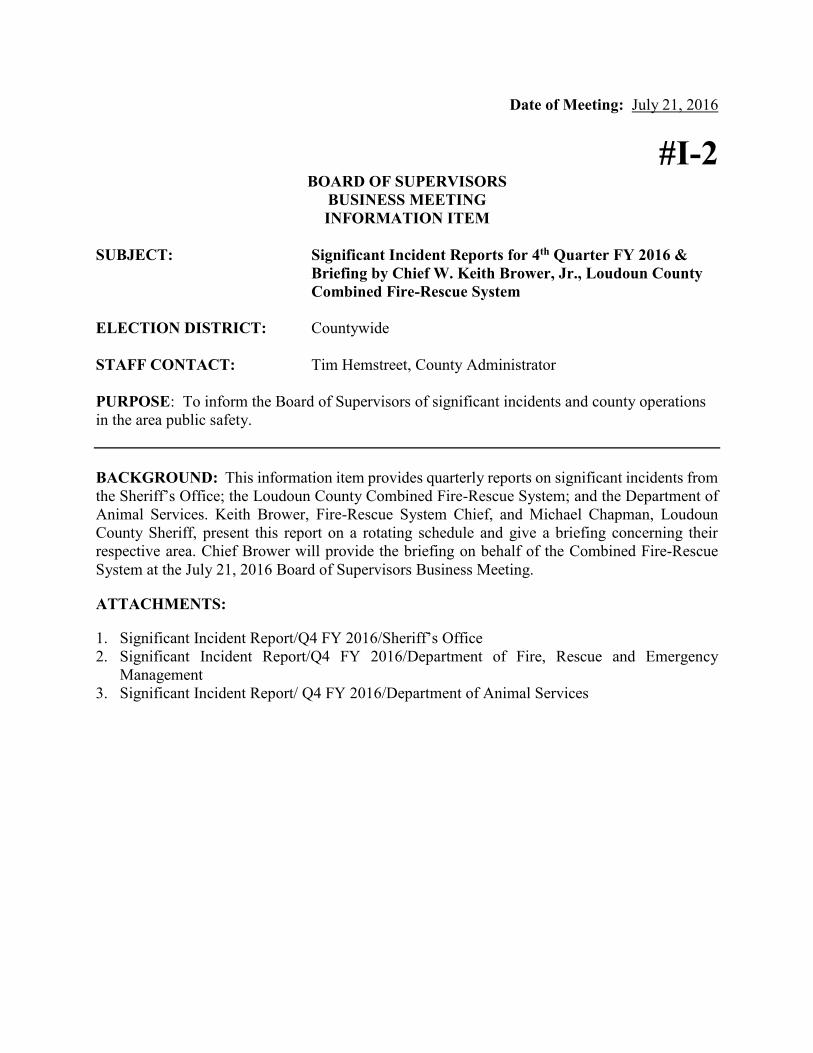
Date of Meeting: July 21, 2016 #I-2 BOARD OF SUPERVISORS BUSINESS MEETING INFORMATION ITEM SUBJECT: Significant Incident Reports for 4 th Quarter FY 2016 & Briefing by Chief W. Keith Brower, Jr., Loudoun County Combined Fire-Rescue System ELECTION DISTRICT: Countywide STAFF CONTACT: Tim Hemstreet, County Administrator PURPOSE: To inform the Board of Supervisors of significant incidents and county operations in the area public safety. BACKGROUND: This information item provides quarterly reports on significant incidents from the Sheriff’s Office; the Loudoun County Combined Fire-Rescue System; and the Department of Animal Services. Keith Brower, Fire-Rescue System Chief, and Michael Chapman, Loudoun County Sheriff, present this report on a rotating schedule and give a briefing concerning their respective area. Chief Brower will provide the briefing on behalf of the Combined Fire-Rescue System at the July 21, 2016 Board of Supervisors Business Meeting. ATTACHMENTS: 1. Significant Incident Report/Q4 FY 2016/Sheriff’s Office 2. Significant Incident Report/Q4 FY 2016/Department of Fire, Rescue and Emergency Management 3. Significant Incident Report/ Q4 FY 2016/Department of Animal Services
Transcript of Date of Meeting: July 21, 2016 #I-2 - Granicus
Date of Meeting: July 21, 2016
#I-2 BOARD OF SUPERVISORS
BUSINESS MEETING INFORMATION ITEM
SUBJECT: Significant Incident Reports for 4th Quarter FY 2016 &
Briefing by Chief W. Keith Brower, Jr., Loudoun County Combined Fire-Rescue System
ELECTION DISTRICT: Countywide STAFF CONTACT: Tim Hemstreet, County Administrator PURPOSE: To inform the Board of Supervisors of significant incidents and county operations in the area public safety. BACKGROUND: This information item provides quarterly reports on significant incidents from the Sheriff’s Office; the Loudoun County Combined Fire-Rescue System; and the Department of Animal Services. Keith Brower, Fire-Rescue System Chief, and Michael Chapman, Loudoun County Sheriff, present this report on a rotating schedule and give a briefing concerning their respective area. Chief Brower will provide the briefing on behalf of the Combined Fire-Rescue System at the July 21, 2016 Board of Supervisors Business Meeting.
ATTACHMENTS:
1. Significant Incident Report/Q4 FY 2016/Sheriff’s Office 2. Significant Incident Report/Q4 FY 2016/Department of Fire, Rescue and Emergency
Management 3. Significant Incident Report/ Q4 FY 2016/Department of Animal Services
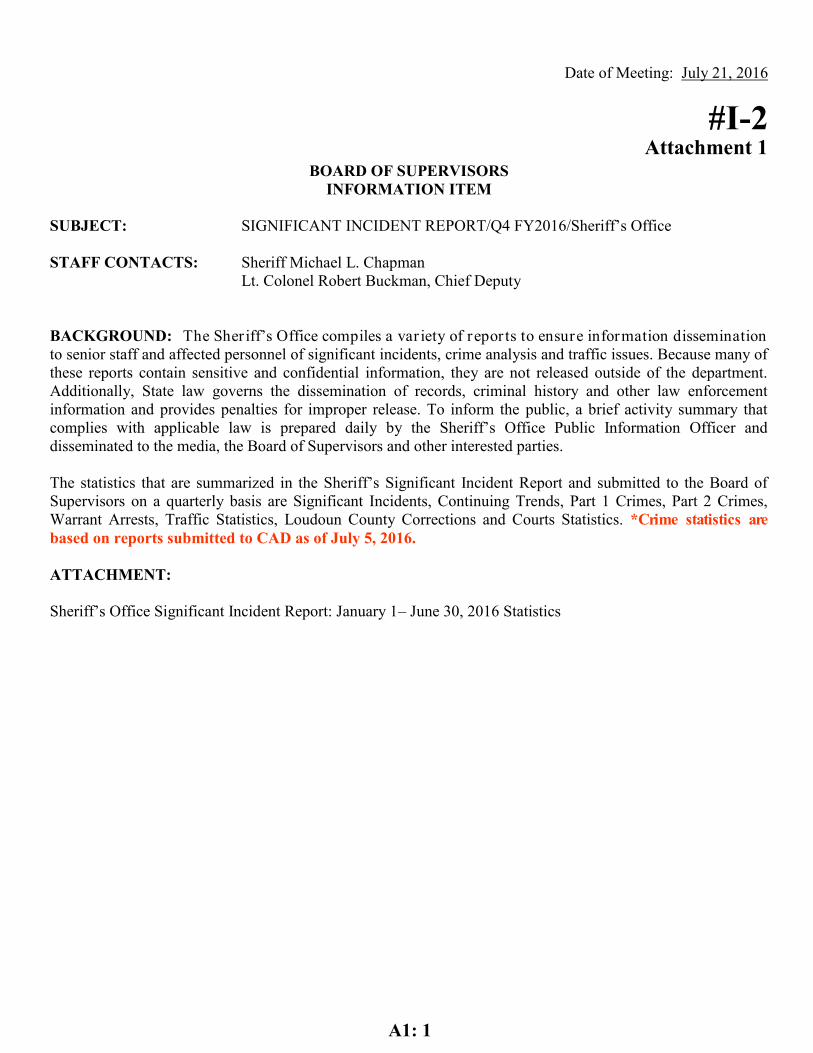
Date of Meeting: July 21, 2016
#I-2 Attachment 1
BOARD OF SUPERVISORS INFORMATION ITEM
SUBJECT: SIGNIFICANT INCIDENT REPORT/Q4 FY2016/Sheriff’s Office
STAFF CONTACTS: Sheriff Michael L. Chapman Lt. Colonel Robert Buckman, Chief Deputy
BACKGROUND: The Sher iff’s Office compiles a var iety of repor ts to ensure information dissemination to senior staff and affected personnel of significant incidents, crime analysis and traffic issues. Because many of these reports contain sensitive and confidential information, they are not released outside of the department. Additionally, State law governs the dissemination of records, criminal history and other law enforcement information and provides penalties for improper release. To inform the public, a brief activity summary that complies with applicable law is prepared daily by the Sheriff’s Office Public Information Officer and disseminated to the media, the Board of Supervisors and other interested parties.
The statistics that are summarized in the Sheriff’s Significant Incident Report and submitted to the Board of Supervisors on a quarterly basis are Significant Incidents, Continuing Trends, Part 1 Crimes, Part 2 Crimes, Warrant Arrests, Traffic Statistics, Loudoun County Corrections and Courts Statistics. *Crime statistics are based on reports submitted to CAD as of July 5, 2016.
ATTACHMENT:
Sheriff’s Office Significant Incident Report: January 1– June 30, 2016 Statistics
A1: 1
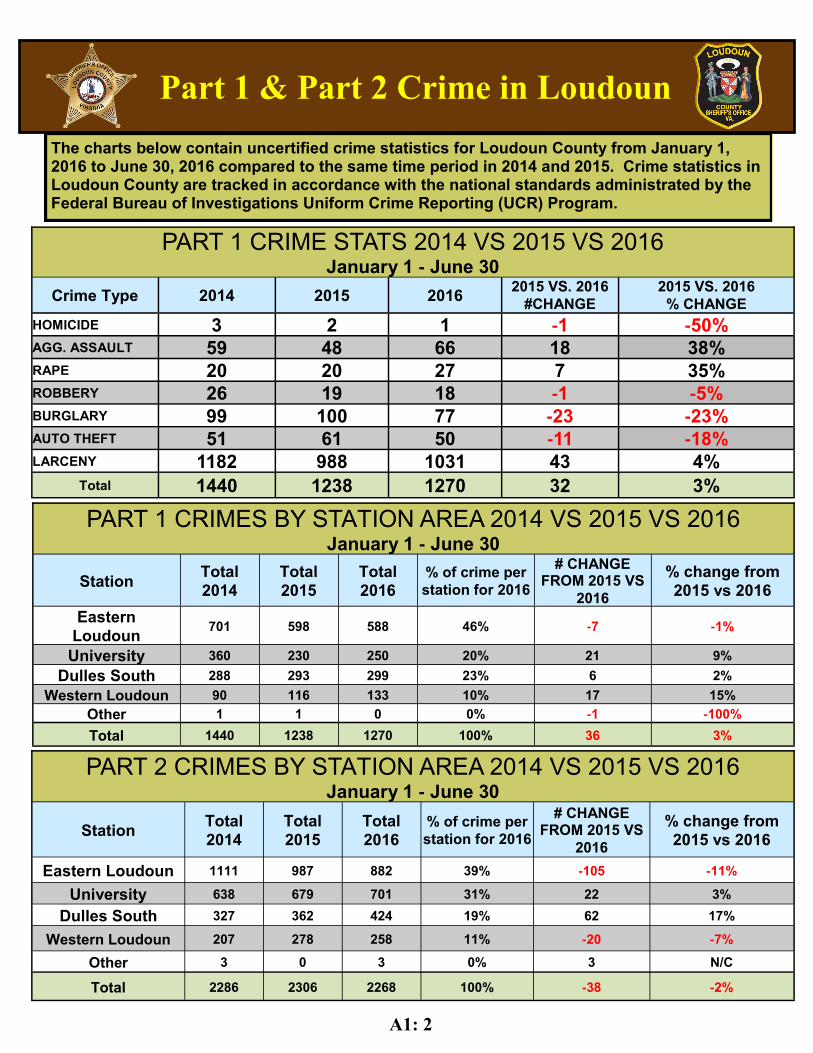
The charts below contain uncertified crime statistics for Loudoun County from January 1, 2016 to June 30, 2016 compared to the same time period in 2014 and 2015. Crime statistics in Loudoun County are tracked in accordance with the national standards administrated by the Federal Bureau of Investigations Uniform Crime Reporting (UCR) Program.
Part 1 & Part 2 Crime in Loudoun
A1: 2
PART 1 CRIME STATS 2014 VS 2015 VS 2016 January 1 - June 30
Crime Type 2014 2015 2016 2015 VS. 2016
#CHANGE
2015 VS. 2016
% CHANGE
HOMICIDE 3 2 1 -1 -50% AGG. ASSAULT 59 48 66 18 38% RAPE 20 20 27 7 35% ROBBERY 26 19 18 -1 -5% BURGLARY 99 100 77 -23 -23% AUTO THEFT 51 61 50 -11 -18% LARCENY 1182 988 1031 43 4%
Total 1440 1238 1270 32 3%
PART 1 CRIMES BY STATION AREA 2014 VS 2015 VS 2016 January 1 - June 30
Station Total
2014
Total
2015
Total
2016 % of crime per
station for 2016
# CHANGE FROM 2015 VS
2016
% change from
2015 vs 2016
Eastern
Loudoun 701 598 588 46% -7 -1%
University 360 230 250 20% 21 9%
Dulles South 288 293 299 23% 6 2%
Western Loudoun 90 116 133 10% 17 15%
Other 1 1 0 0% -1 -100%
Total 1440 1238 1270 100% 36 3%
PART 2 CRIMES BY STATION AREA 2014 VS 2015 VS 2016 January 1 - June 30
Station Total
2014
Total
2015
Total
2016 % of crime per
station for 2016
# CHANGE FROM 2015 VS
2016
% change from
2015 vs 2016
Eastern Loudoun 1111 987 882 39% -105 -11%
University 638 679 701 31% 22 3%
Dulles South 327 362 424 19% 62 17%
Western Loudoun 207 278 258 11% -20 -7%
Other 3 0 3 0% 3 N/C
Total 2286 2306 2268 100% -38 -2%
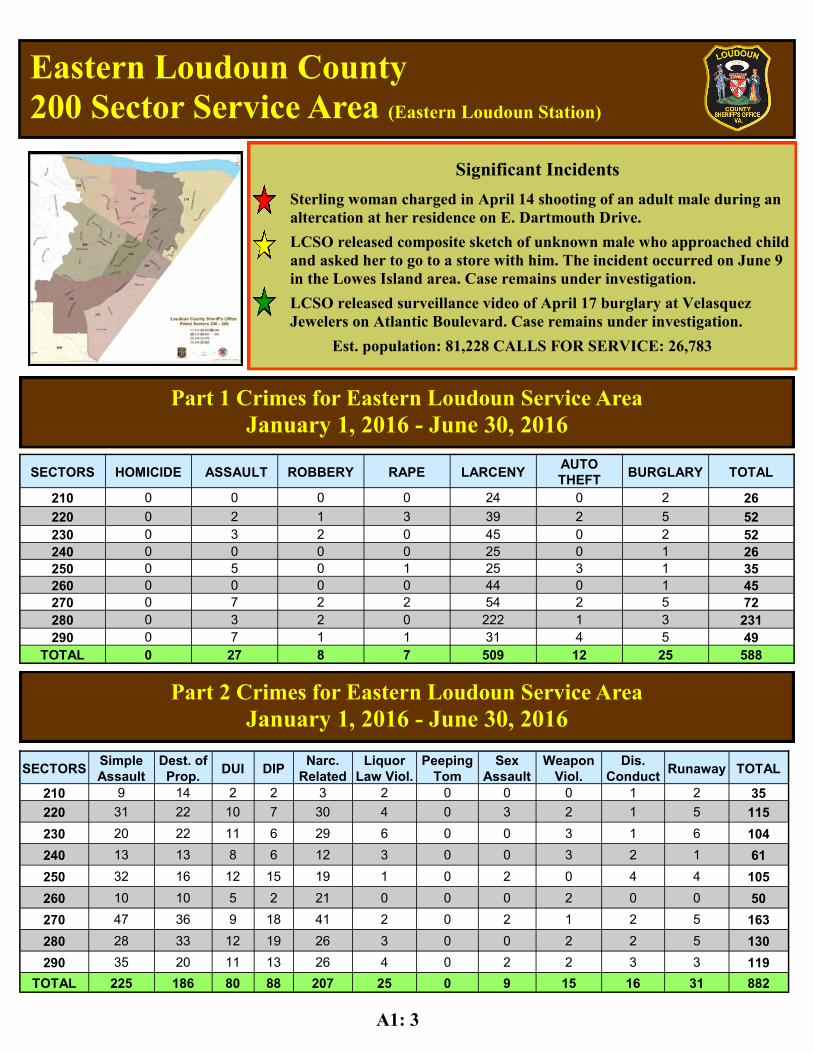
Eastern Loudoun County 200 Sector Service Area (Eastern Loudoun Station)
Sterling woman charged in April 14 shooting of an adult male during an altercation at her residence on E. Dartmouth Drive.
LCSO released composite sketch of unknown male who approached child and asked her to go to a store with him. The incident occurred on June 9 in the Lowes Island area. Case remains under investigation.
LCSO released surveillance video of April 17 burglary at Velasquez Jewelers on Atlantic Boulevard. Case remains under investigation.
Est. population: 81,228 CALLS FOR SERVICE: 26,783
Part 1 Crimes for Eastern Loudoun Service Area January 1, 2016 - June 30, 2016
Significant Incidents
Part 2 Crimes for Eastern Loudoun Service Area January 1, 2016 - June 30, 2016
A1: 3
SECTORS HOMICIDE ASSAULT ROBBERY RAPE LARCENY AUTO
THEFT BURGLARY TOTAL
210 0 0 0 0 24 0 2 26
220 0 2 1 3 39 2 5 52
230 0 3 2 0 45 0 2 52
240 0 0 0 0 25 0 1 26
250 0 5 0 1 25 3 1 35
260 0 0 0 0 44 0 1 45
270 0 7 2 2 54 2 5 72
280 0 3 2 0 222 1 3 231
290 0 7 1 1 31 4 5 49
TOTAL 0 27 8 7 509 12 25 588
SECTORS Simple
Assault
Dest. of
Prop. DUI DIP
Narc.
Related
Liquor
Law Viol.
Peeping
Tom
Sex
Assault
Weapon
Viol.
Dis.
Conduct Runaway TOTAL
210 9 14 2 2 3 2 0 0 0 1 2 35
220 31 22 10 7 30 4 0 3 2 1 5 115
230 20 22 11 6 29 6 0 0 3 1 6 104
240 13 13 8 6 12 3 0 0 3 2 1 61
250 32 16 12 15 19 1 0 2 0 4 4 105
260 10 10 5 2 21 0 0 0 2 0 0 50
270 47 36 9 18 41 2 0 2 1 2 5 163
280 28 33 12 19 26 3 0 0 2 2 5 130
290 35 20 11 13 26 4 0 2 2 3 3 119
TOTAL 225 186 80 88 207 25 0 9 15 16 31 882
University Station 300 Sector Service Area (University Station)
Part 1 Crimes for University Station Service Area January 1, 2016 - June 30, 2016
Est. Population: 91,568 CALLS FOR SERVICE: 25,976
Significant Incidents
Part 2 Crimes for University Station Service Area January 1, 2016 - June 30, 2016
Armed robbery of gas station in Ashbrook Commons Plaza on April 1. Video surveillance of suspect released. Case remains under investigation. Suspect apprehended in connection with June 26 robbery of residents inside an apartment on Bent Street Terrace in Lansdowne. LCSO continues to seek second suspect. Victims were targeted.
A1: 4
SECTORS HOMICIDE ASSAULT ROBBERY RAPE LARCENY AUTO
THEFT BURGLARY TOTAL
310 1 5 1 3 18 1 0 29
320 0 2 0 0 18 1 4 25
330 0 5 3 1 44 2 1 56
340 0 3 1 0 25 4 4 37
350 0 1 1 2 29 1 1 35
360 0 1 0 0 25 3 1 30
370 0 1 3 0 27 0 2 33
900 0 0 0 1 3 1 0 5
TOTAL 1 18 9 7 189 13 13 250
SECTORS Simple
Assault
Dest. of
Prop. DUI DIP
Narc.
Related
Liquor
Law Viol.
Peeping
Tom
Sex As-
sault
Weapon
Viol.
Dis.
Conduct Runaway TOTAL
310 21 20 12 9 25 4 0 2 1 0 4 98
320 21 22 3 2 12 4 0 0 1 1 9 75
330 25 23 27 24 32 4 0 1 2 0 8 146
340 23 14 15 12 29 1 0 1 0 0 4 99
350 24 18 9 3 27 3 0 1 1 1 1 88
360 24 20 8 5 20 0 0 0 1 0 5 83
370 22 24 3 6 12 3 0 0 2 0 8 80
900 1 3 3 4 18 0 0 0 0 1 2 32
TOTAL 161 144 80 65 175 19 0 5 8 3 41 701
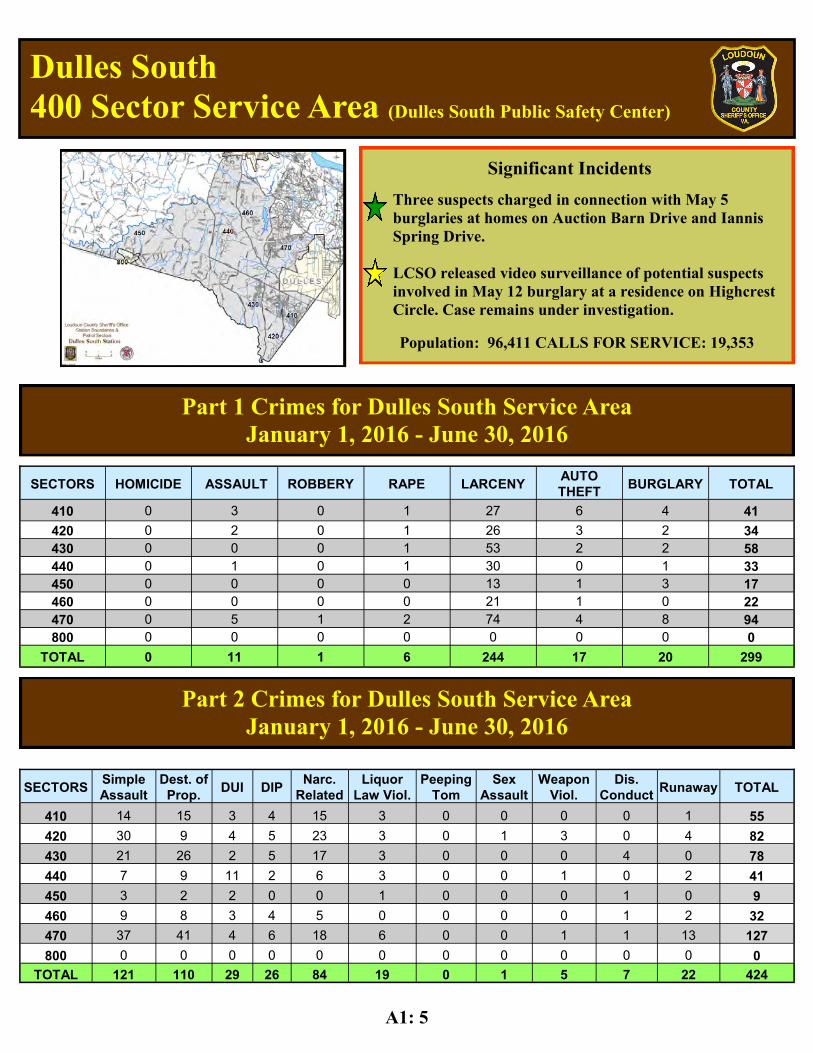
Dulles South 400 Sector Service Area (Dulles South Public Safety Center)
Population: 96,411 CALLS FOR SERVICE: 19,353
Part 1 Crimes for Dulles South Service Area January 1, 2016 - June 30, 2016
Significant Incidents
Part 2 Crimes for Dulles South Service Area January 1, 2016 - June 30, 2016
Three suspects charged in connection with May 5 burglaries at homes on Auction Barn Drive and Iannis Spring Drive. LCSO released video surveillance of potential suspects involved in May 12 burglary at a residence on Highcrest Circle. Case remains under investigation.
A1: 5
SECTORS HOMICIDE ASSAULT ROBBERY RAPE LARCENY AUTO
THEFT BURGLARY TOTAL
410 0 3 0 1 27 6 4 41
420 0 2 0 1 26 3 2 34
430 0 0 0 1 53 2 2 58
440 0 1 0 1 30 0 1 33
450 0 0 0 0 13 1 3 17
460 0 0 0 0 21 1 0 22
470 0 5 1 2 74 4 8 94
800 0 0 0 0 0 0 0 0
TOTAL 0 11 1 6 244 17 20 299
SECTORS Simple
Assault
Dest. of
Prop. DUI DIP
Narc.
Related
Liquor
Law Viol.
Peeping
Tom
Sex
Assault
Weapon
Viol.
Dis.
Conduct Runaway TOTAL
410 14 15 3 4 15 3 0 0 0 0 1 55
420 30 9 4 5 23 3 0 1 3 0 4 82
430 21 26 2 5 17 3 0 0 0 4 0 78
440 7 9 11 2 6 3 0 0 1 0 2 41
450 3 2 2 0 0 1 0 0 0 1 0 9
460 9 8 3 4 5 0 0 0 0 1 2 32
470 37 41 4 6 18 6 0 0 1 1 13 127
800 0 0 0 0 0 0 0 0 0 0 0 0
TOTAL 121 110 29 26 84 19 0 1 5 7 22 424
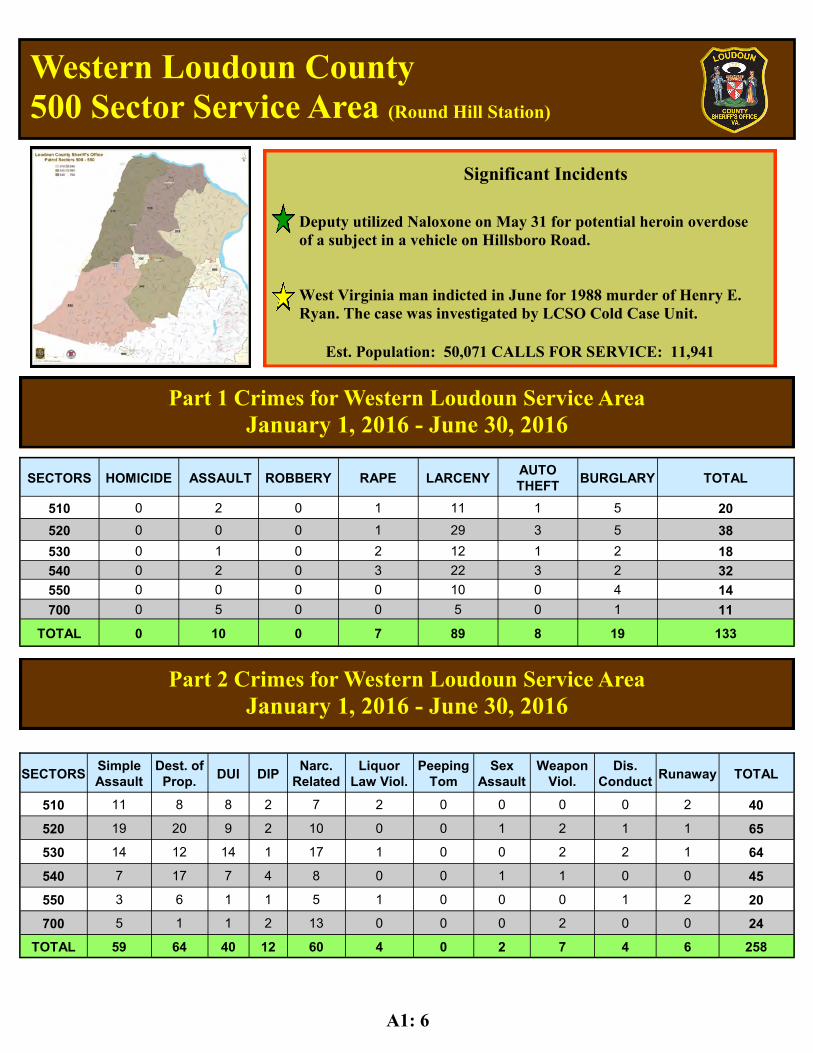
Western Loudoun County 500 Sector Service Area (Round Hill Station)
Part 1 Crimes for Western Loudoun Service Area January 1, 2016 - June 30, 2016
Part 2 Crimes for Western Loudoun Service Area January 1, 2016 - June 30, 2016
Est. Population: 50,071 CALLS FOR SERVICE: 11,941
Significant Incidents
Deputy utilized Naloxone on May 31 for potential heroin overdose of a subject in a vehicle on Hillsboro Road. West Virginia man indicted in June for 1988 murder of Henry E. Ryan. The case was investigated by LCSO Cold Case Unit.
A1: 6
SECTORS HOMICIDE ASSAULT ROBBERY RAPE LARCENY AUTO
THEFT BURGLARY TOTAL
510 0 2 0 1 11 1 5 20
520 0 0 0 1 29 3 5 38
530 0 1 0 2 12 1 2 18
540 0 2 0 3 22 3 2 32
550 0 0 0 0 10 0 4 14
700 0 5 0 0 5 0 1 11
TOTAL 0 10 0 7 89 8 19 133
SECTORS Simple
Assault
Dest. of
Prop. DUI DIP
Narc.
Related
Liquor
Law Viol.
Peeping
Tom
Sex
Assault
Weapon
Viol.
Dis.
Conduct Runaway TOTAL
510 11 8 8 2 7 2 0 0 0 0 2 40
520 19 20 9 2 10 0 0 1 2 1 1 65
530 14 12 14 1 17 1 0 0 2 2 1 64
540 7 17 7 4 8 0 0 1 1 0 0 45
550 3 6 1 1 5 1 0 0 0 1 2 20
700 5 1 1 2 13 0 0 0 2 0 0 24
TOTAL 59 64 40 12 60 4 0 2 7 4 6 258
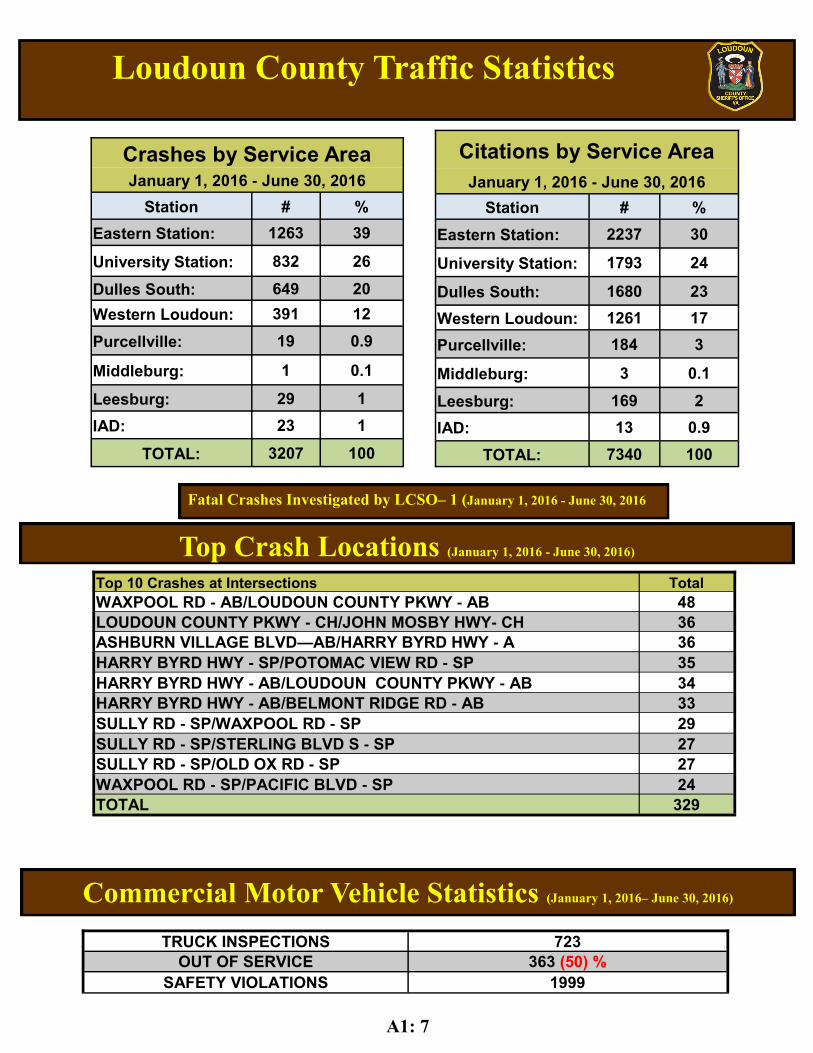
Loudoun County Traffic Statistics
Top Crash Locations (January 1, 2016 - June 30, 2016)
Commercial Motor Vehicle Statistics (January 1, 2016– June 30, 2016)
Fatal Crashes Investigated by LCSO– 1 (January 1, 2016 - June 30, 2016
A1: 7
Crashes by Service Area January 1, 2016 - June 30, 2016
Station # %
Eastern Station: 1263 39
University Station: 832 26
Dulles South: 649 20
Western Loudoun: 391 12
Purcellville: 19 0.9
Middleburg: 1 0.1
Leesburg: 29 1
IAD: 23 1
TOTAL: 3207 100
Citations by Service Area
January 1, 2016 - June 30, 2016
Station # %
Eastern Station: 2237 30
University Station: 1793 24
Dulles South: 1680 23
Western Loudoun: 1261 17
Purcellville: 184 3
Middleburg: 3 0.1
Leesburg: 169 2
IAD: 13 0.9
TOTAL: 7340 100
Top 10 Crashes at Intersections Total
WAXPOOL RD - AB/LOUDOUN COUNTY PKWY - AB 48
LOUDOUN COUNTY PKWY - CH/JOHN MOSBY HWY- CH 36
ASHBURN VILLAGE BLVD—AB/HARRY BYRD HWY - A 36
HARRY BYRD HWY - SP/POTOMAC VIEW RD - SP 35
HARRY BYRD HWY - AB/LOUDOUN COUNTY PKWY - AB 34
HARRY BYRD HWY - AB/BELMONT RIDGE RD - AB 33
SULLY RD - SP/WAXPOOL RD - SP 29
SULLY RD - SP/STERLING BLVD S - SP 27
SULLY RD - SP/OLD OX RD - SP 27
WAXPOOL RD - SP/PACIFIC BLVD - SP 24
TOTAL 329
TRUCK INSPECTIONS 723
OUT OF SERVICE 363 (50) %
SAFETY VIOLATIONS 1999
!(
!(
!(
!(!(!(
!(
!(
!(!(
!(
!(
!(
!(
!(
!(
!(
!(
!(
!(
!(
!(
!(
!(!(!(
!(!(
!(
!(
!(
!(
!(
!(!(
!(
!(!(
!(
!(
!(
!(
!( !(
!(
!(
!(
!(
!(!(!(
!(
!(
!(!(
!(
!(
!(
!(
!(
!(
!(
!(
!(!(
!(
!(
!(!(
!(!( !(!(!(
!(
!(!(
!(
!(
!(!(
!(!(
!(!(
!(
!(
!(
!(!(!(!(!(
!(!(
!(!(
!(
!(
!(
!(!(
!(
!(
!(!(!(!(
!(!(
!(
!(!(
!(
!(
!(
!(!(
!(
!(!(
!(
!(!(
!(
!(!(
!(
!(!(!(
!(
!(
!(
!(
!(!(
!(!(!(
!(!(
!(
!(!(!(!(
!(
!(!(
!(
!(
!(
!(!(
!(!(!(!(
!(
!(!(!(!(!(!(
!(
!(
!(
CC
JEFF
L o u d o u n C o u n t y
0 31.5
Miles
Ü
July 2016
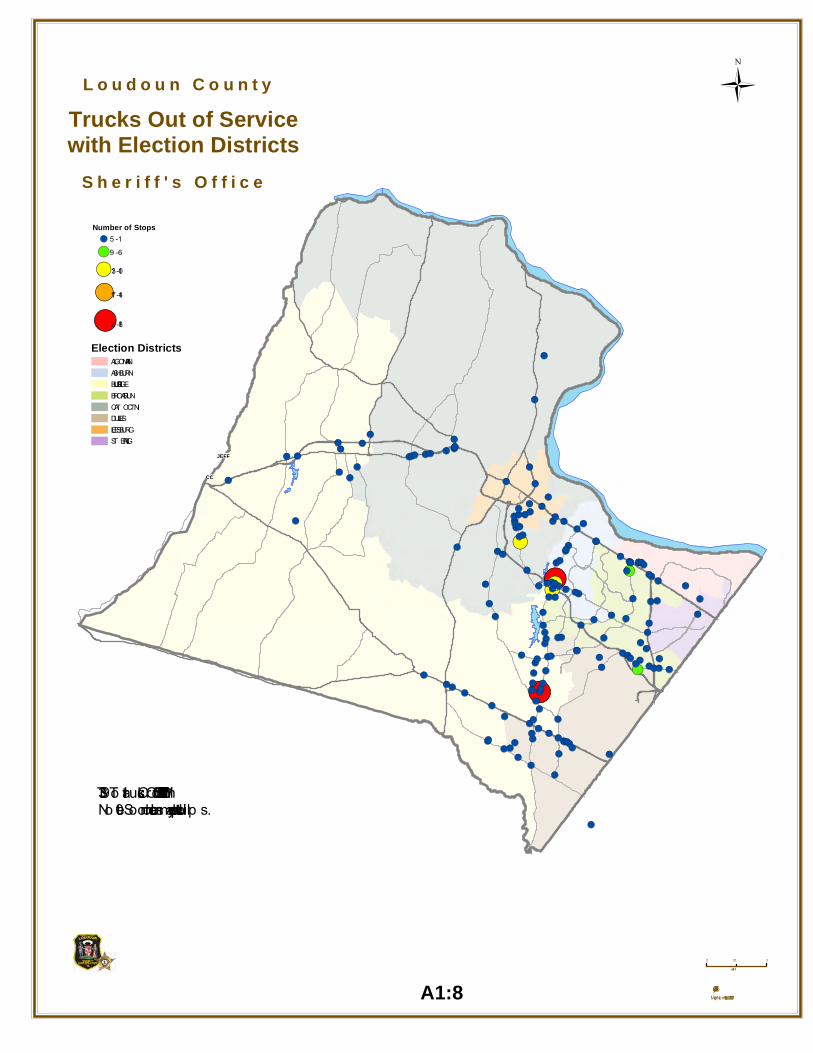
Trucks Out of Servicewith Election Districts
S h e r i f f ' s O f f i c e
Number of Stops!( 1 - 5!( 6 - 9
!( 10 - 13
!( 14 - 17
!(18 - 2
Election DistrictsALGONKIANASHBURNBLUE RIDGEBROAD RUNCAT OCT INDULLESLEESBURGST ERLING
339 T o tal T rucks OOS fro m 1/1/2016 to 6/30/2016No te – Some locations may dep ict multip le sto p s.
Map Number: SO2016007A1:8
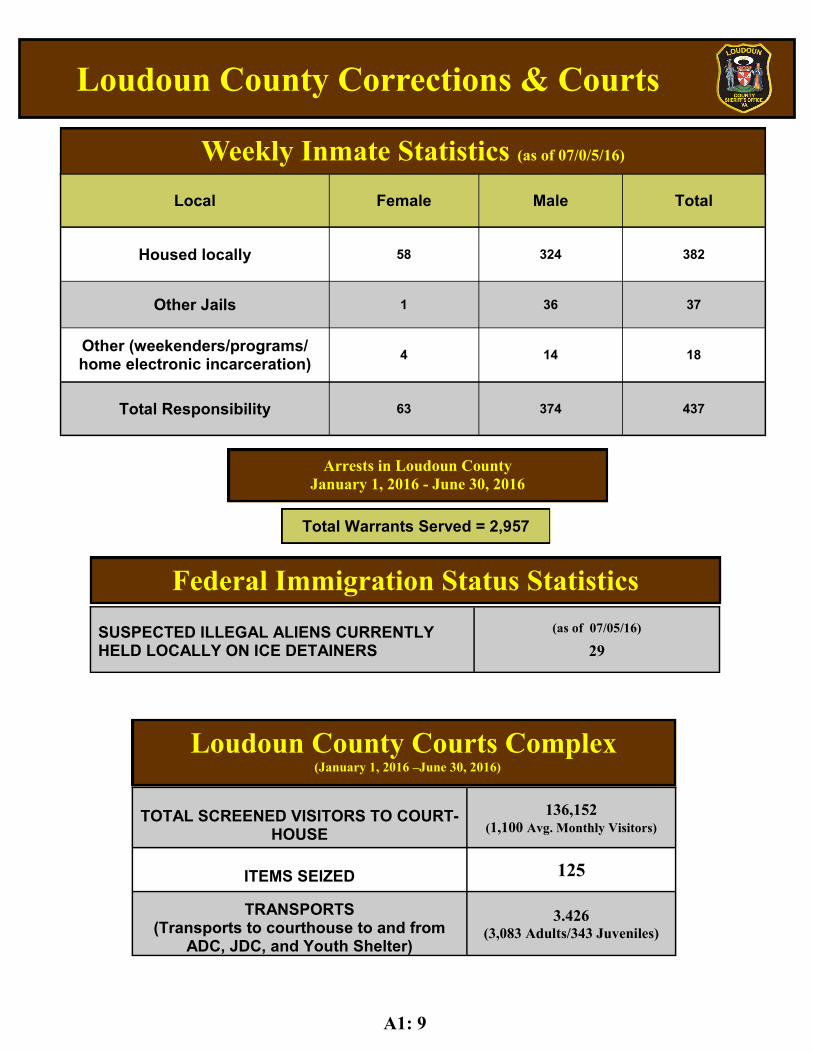
Loudoun County Corrections & Courts
Weekly Inmate Statistics (as of 07/0/5/16)
Federal Immigration Status Statistics
Loudoun County Courts Complex (January 1, 2016 –June 30, 2016)
TOTAL SCREENED VISITORS TO COURT-HOUSE
136,152 (1,100 Avg. Monthly Visitors)
ITEMS SEIZED 125
TRANSPORTS (Transports to courthouse to and from
ADC, JDC, and Youth Shelter)
3.426 (3,083 Adults/343 Juveniles)
SUSPECTED ILLEGAL ALIENS CURRENTLY HELD LOCALLY ON ICE DETAINERS
(as of 07/05/16)
29
Local Female Male Total
Housed locally 58 324 382
Other Jails 1 36 37
Other (weekenders/programs/home electronic incarceration)
4 14 18
Total Responsibility 63 374 437
Total Warrants Served = 2,957
Arrests in Loudoun County January 1, 2016 - June 30, 2016
A1: 9
Date of Meeting: July 21, 2016
#I-2 Attachment 2
BOARD OF SUPERVISORS BUSINESS MEETING INFORMATION ITEM
SUBJECT: Significant Incident Report/Q4 FY2016/Loudoun County Fire and
Rescue STAFF CONTACTS: W. Keith Brower, Jr., Fire System Chief, Loudoun County Fire
and Rescue Laura Rinehart, Public Information Officer, Loudoun County Fire
and Rescue _____________________________________________________________________________ BACKGROUND: The Loudoun County Fire and Rescue (LCFR) Incident Summary Report through the fourth quarter of FY 2016 is attached. This routine account is part of the standard reporting package made to the Board of Supervisors from LCFR. ATTACHMENT: Significant Incident Report/Q4 FY2016/LCFR
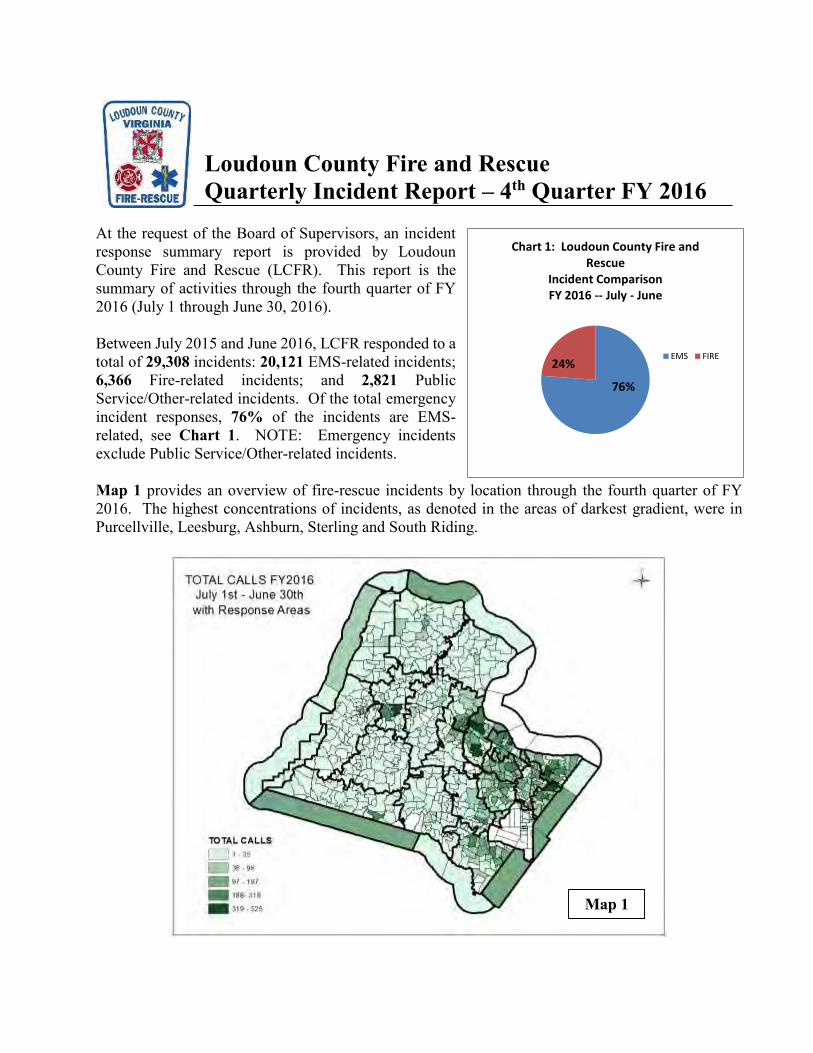
At the request of the Board of Supervisors, an incident response summary report is provided by Loudoun County Fire and Rescue (LCFR). This report is the summary of activities through the fourth quarter of FY 2016 (July 1 through June 30, 2016). Between July 2015 and June 2016, LCFR responded to a total of 29,308 incidents: 20,121 EMS-related incidents; 6,366 Fire-related incidents; and 2,821 Public Service/Other-related incidents. Of the total emergency incident responses, 76% of the incidents are EMS-related, see Chart 1. NOTE: Emergency incidents exclude Public Service/Other-related incidents. Map 1 provides an overview of fire-rescue incidents by location through the fourth quarter of FY 2016. The highest concentrations of incidents, as denoted in the areas of darkest gradient, were in Purcellville, Leesburg, Ashburn, Sterling and South Riding.
Loudoun County Fire and Rescue
Quarterly Incident Report – 4th Quarter FY 2016
Map 1
76%
24%
Chart 1: Loudoun County Fire and Rescue
Incident ComparisonFY 2016 -- July - June
EMS FIRE
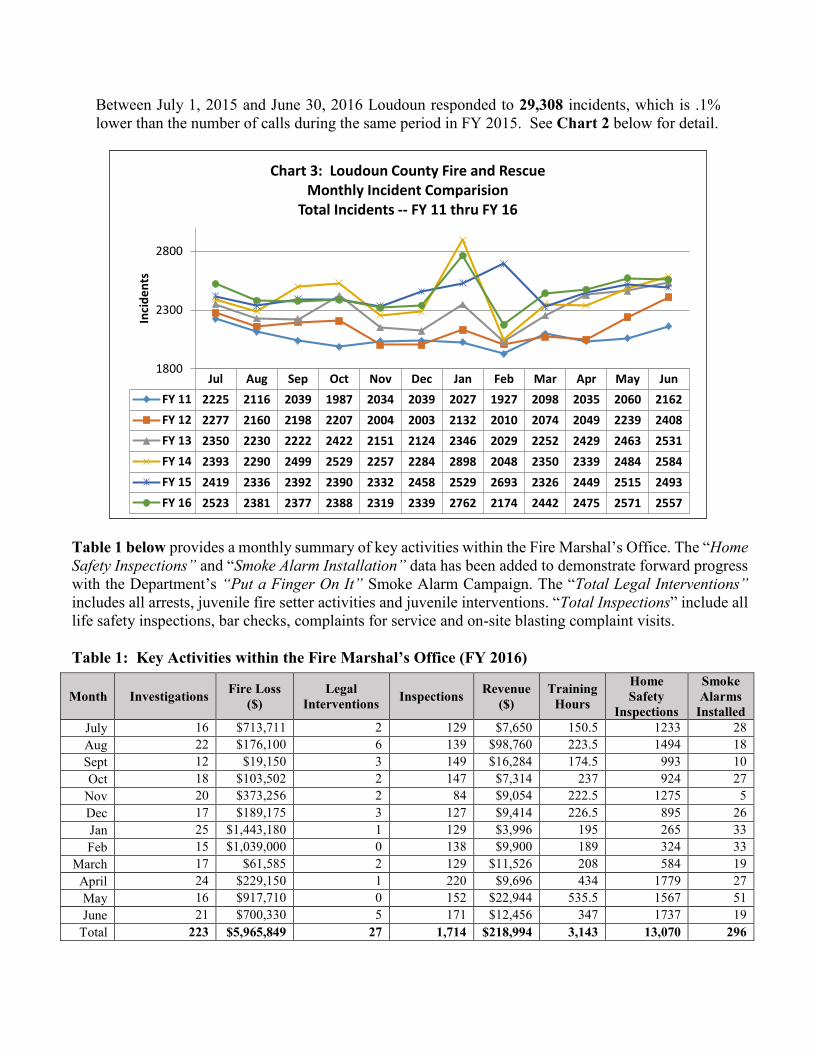
Between July 1, 2015 and June 30, 2016 Loudoun responded to 29,308 incidents, which is .1% lower than the number of calls during the same period in FY 2015. See Chart 2 below for detail.
Table 1 below provides a monthly summary of key activities within the Fire Marshal’s Office. The “Home Safety Inspections” and “Smoke Alarm Installation” data has been added to demonstrate forward progress with the Department’s “Put a Finger On It” Smoke Alarm Campaign. The “Total Legal Interventions” includes all arrests, juvenile fire setter activities and juvenile interventions. “Total Inspections” include all life safety inspections, bar checks, complaints for service and on-site blasting complaint visits. Table 1: Key Activities within the Fire Marshal’s Office (FY 2016)
Jul Aug Sep Oct Nov Dec Jan Feb Mar Apr May Jun
FY 11 2225 2116 2039 1987 2034 2039 2027 1927 2098 2035 2060 2162
FY 12 2277 2160 2198 2207 2004 2003 2132 2010 2074 2049 2239 2408
FY 13 2350 2230 2222 2422 2151 2124 2346 2029 2252 2429 2463 2531
FY 14 2393 2290 2499 2529 2257 2284 2898 2048 2350 2339 2484 2584
FY 15 2419 2336 2392 2390 2332 2458 2529 2693 2326 2449 2515 2493
FY 16 2523 2381 2377 2388 2319 2339 2762 2174 2442 2475 2571 2557
1800
2300
2800
Inci
de
nts
Chart 3: Loudoun County Fire and RescueMonthly Incident Comparision
Total Incidents -- FY 11 thru FY 16
Month Investigations Fire Loss ($)
Legal Interventions Inspections Revenue
($) Training
Hours
Home Safety
Inspections
Smoke Alarms
Installed July 16 $713,711 2 129 $7,650 150.5 1233 28 Aug 22 $176,100 6 139 $98,760 223.5 1494 18 Sept 12 $19,150 3 149 $16,284 174.5 993 10 Oct 18 $103,502 2 147 $7,314 237 924 27
Nov 20 $373,256 2 84 $9,054 222.5 1275 5 Dec 17 $189,175 3 127 $9,414 226.5 895 26 Jan 25 $1,443,180 1 129 $3,996 195 265 33 Feb 15 $1,039,000 0 138 $9,900 189 324 33
March 17 $61,585 2 129 $11,526 208 584 19 April 24 $229,150 1 220 $9,696 434 1779 27 May 16 $917,710 0 152 $22,944 535.5 1567 51 June 21 $700,330 5 171 $12,456 347 1737 19
Total 223 $5,965,849 27 1,714 $218,994 3,143 13,070 296
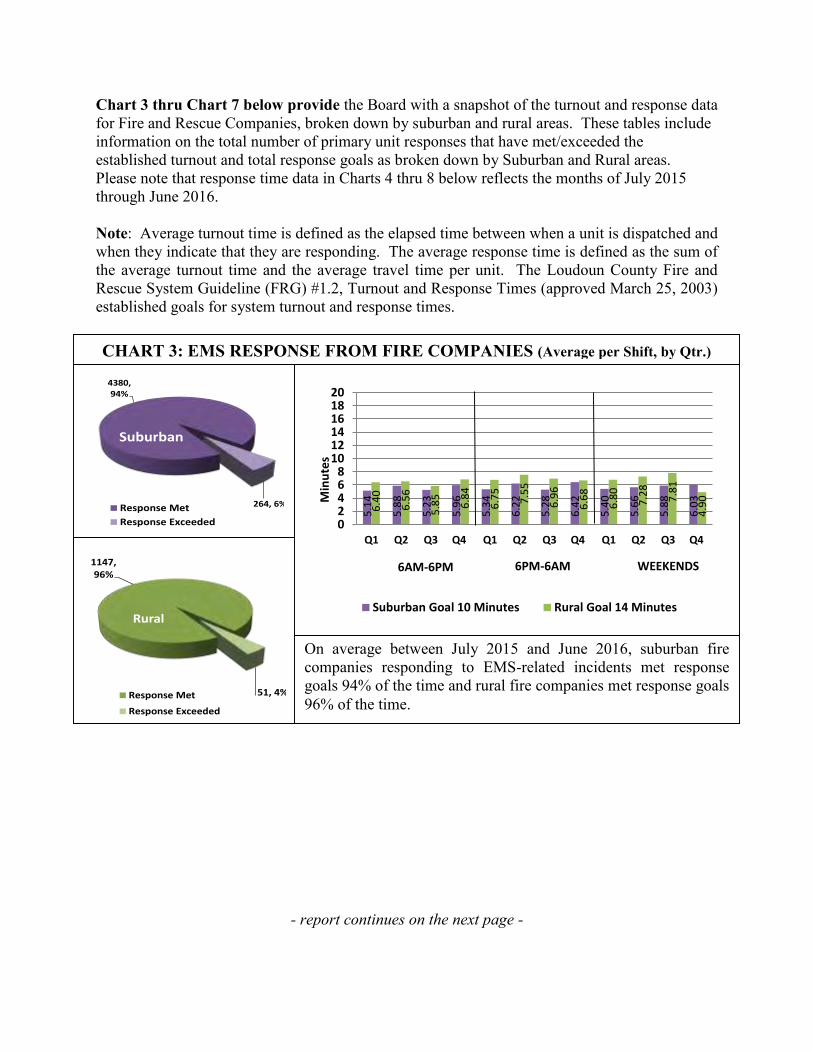
Chart 3 thru Chart 7 below provide the Board with a snapshot of the turnout and response data for Fire and Rescue Companies, broken down by suburban and rural areas. These tables include information on the total number of primary unit responses that have met/exceeded the established turnout and total response goals as broken down by Suburban and Rural areas. Please note that response time data in Charts 4 thru 8 below reflects the months of July 2015 through June 2016. Note: Average turnout time is defined as the elapsed time between when a unit is dispatched and when they indicate that they are responding. The average response time is defined as the sum of the average turnout time and the average travel time per unit. The Loudoun County Fire and Rescue System Guideline (FRG) #1.2, Turnout and Response Times (approved March 25, 2003) established goals for system turnout and response times.
- report continues on the next page -
CHART 3: EMS RESPONSE FROM FIRE COMPANIES (Average per Shift, by Qtr.)
4380, 94%
264, 6%
Suburban
Response Met
Response Exceeded
1147, 96%
51, 4%
Rural
Response Met
Response Exceeded
On average between July 2015 and June 2016, suburban fire companies responding to EMS-related incidents met response goals 94% of the time and rural fire companies met response goals 96% of the time.
5.1
4
5.8
8
5.2
3
5.9
6
5.3
4
6.2
2
5.2
8
6.4
2
5.4
0
5.6
6
5.8
8
6.0
3
6.4
0
6.5
6
5.8
5
6.8
4
6.7
5
7.5
5
6.9
6
6.6
8
6.8
0
7.2
8
7.8
1
4.9
0
02468
101214161820
Q1 Q2 Q3 Q4 Q1 Q2 Q3 Q4 Q1 Q2 Q3 Q4
Min
ute
s
Suburban Goal 10 Minutes Rural Goal 14 Minutes
6PM-6AM6AM-6PM WEEKENDS
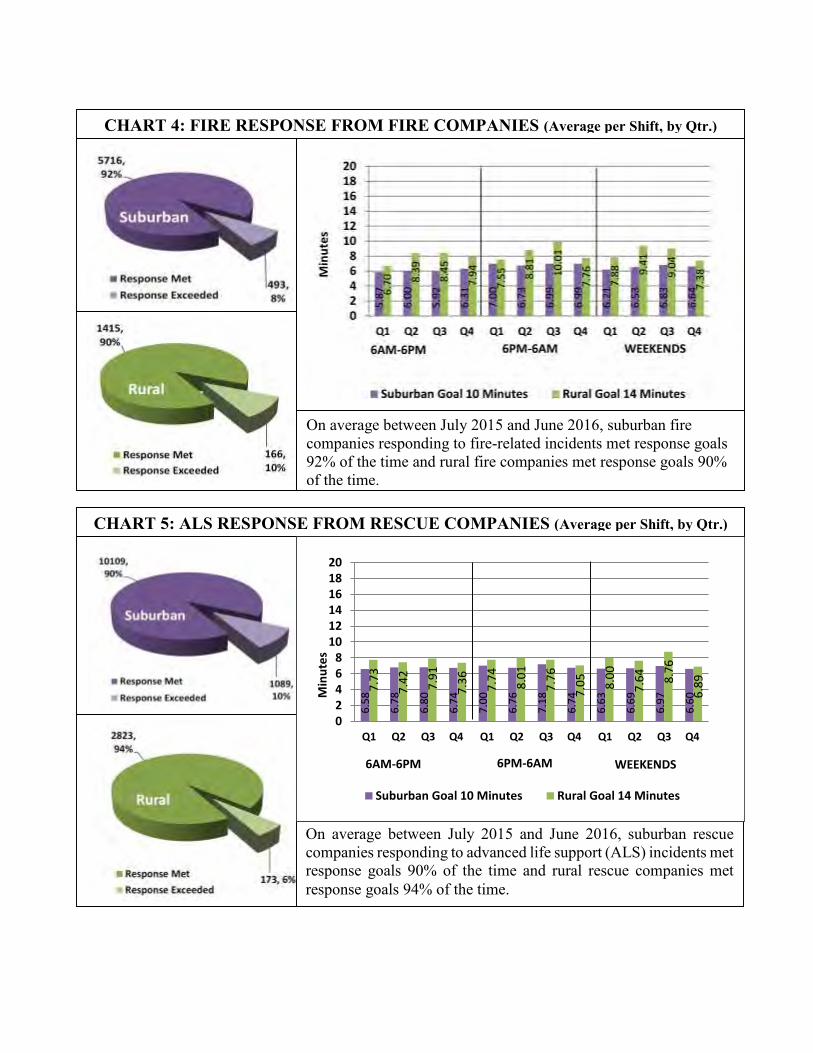
CHART 5: ALS RESPONSE FROM RESCUE COMPANIES (Average per Shift, by Qtr.)
On average between July 2015 and June 2016, suburban rescue companies responding to advanced life support (ALS) incidents met response goals 90% of the time and rural rescue companies met response goals 94% of the time.
CHART 4: FIRE RESPONSE FROM FIRE COMPANIES (Average per Shift, by Qtr.)
On average between July 2015 and June 2016, suburban fire companies responding to fire-related incidents met response goals 92% of the time and rural fire companies met response goals 90% of the time.
6.5
8
6.7
8
6.8
0
6.7
4
7.0
0
6.7
6
7.1
8
6.7
4
6.6
3
6.6
9
6.9
7
6.6
0
7.7
3
7.4
2
7.9
1
7.3
6
7.7
4
8.0
1
7.7
6
7.0
5
8.0
0
7.6
4
8.7
6
6.8
9
02468
101214161820
Q1 Q2 Q3 Q4 Q1 Q2 Q3 Q4 Q1 Q2 Q3 Q4
Min
ute
s
Suburban Goal 10 Minutes Rural Goal 14 Minutes
6AM-6PM 6PM-6AM WEEKENDS
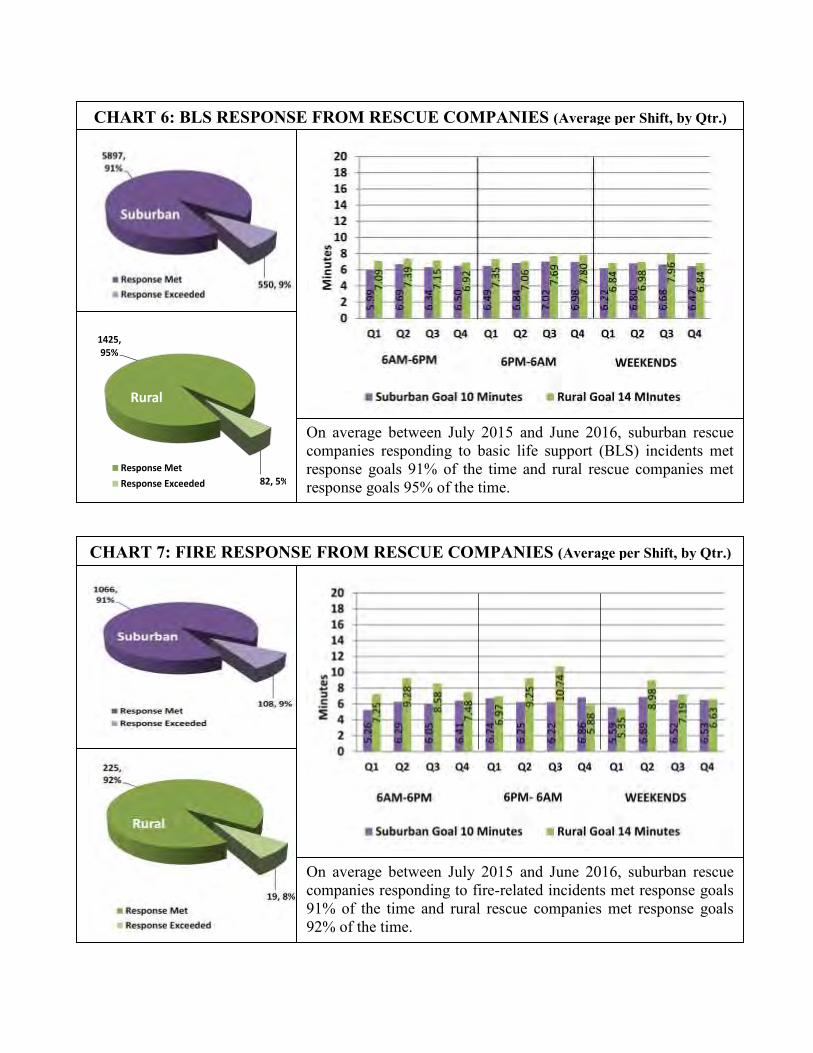
CHART 7: FIRE RESPONSE FROM RESCUE COMPANIES (Average per Shift, by Qtr.)
On average between July 2015 and June 2016, suburban rescue companies responding to fire-related incidents met response goals 91% of the time and rural rescue companies met response goals 92% of the time.
CHART 6: BLS RESPONSE FROM RESCUE COMPANIES (Average per Shift, by Qtr.)
On average between July 2015 and June 2016, suburban rescue companies responding to basic life support (BLS) incidents met response goals 91% of the time and rural rescue companies met response goals 95% of the time.
1425, 95%
82, 5%
Rural
Response Met
Response Exceeded
A3:1
Date of Meeting: July 21, 2016
#I-2 Attachment 3
BOARD OF SUPERVISORS BUSINESS MEETING
INFORMATION ITEM SUBJECT: SIGNIFICANT INCIDENT REPORT/Q4 FY2016/ Department of
Animal Services STAFF CONTACT: Nina Stively, Director, Department of Animal Services Mark Stacks, Chief, Department of Animal Services Amy Martin, Shelter Operations Manager, Department of Animal
Services BACKGROUND: Attached is a significant incident summary report for the Department of Animal Services (LCAS). This report provides the Board of Supervisors with comparative statistics and information for the fourth quarter of FY2016 (April 2016 through June 2016). The information includes departmental programs and services, including: animal control activities, animal sheltering data, adopter survey information and volunteer activities. Additionally, information regarding key activities and/or incidents that occurred during the fourth quarter of FY2016 is provided in the paragraphs below.
Overview
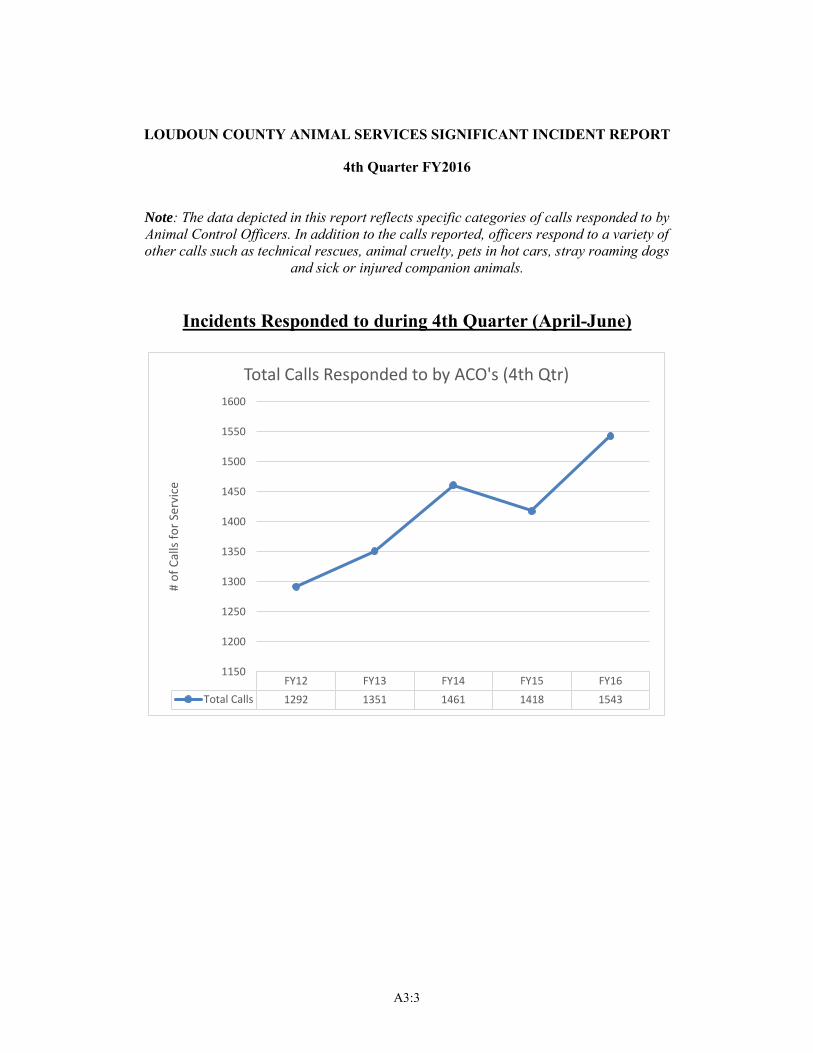
Overall, calls requiring an officer response were up 9% when compared to the 4th quarter of FY2015. The LCAS communications center received 6,151 phone calls, a slight decrease when compared to the 4th quarter of FY2015. Below are significant cases that were investigated by LCAS officers:
An officer investigated a case of animal cruelty involving chickens being sacrificed in an inhumane manner. A search warrant was executed at a home in Sterling, resulting in one live chicken being seized along with multiple pieces of evidence. The live chicken was awarded to LCAS during a seizure hearing in Loudoun County General District Court, that decision has been appealed, by the owner and is awaiting a new hearing in Circuit Court. The owner of the chickens has been charged with misdemeanor animal cruelty with a trial date set in August 2016.
A local veterinary hospital notified LCAS after treating a dog that had suffered a traumatic injury. The dog was humanely euthanized due to the extensive nature of its injuries. During the course of the investigation it was learned that the co-owner of the dog had picked it up and slammed it on the ground causing the injuries. The co-owner has been charged with felony animal cruelty, with a trial set for July 2016.
An officer investigated a ball python that was abandoned at a Petsmart store in Sterling. The owner was charged with abandonment and found guilty.
An officer responded to a complaint of a cat being cruelly treated on the balcony of an apartment in Leesburg. The investigation led to the cat being seized and it was determined that the cat had a broken femur. A seizure hearing has been set for July 2016. The matter is still under investigation, animal cruelty charges are pending.
A3:2
Officers initiated a cruelty investigation after receiving notification from a veterinary hospital that an owner had failed to provide emergency medical treatment for a dog. After being unable to make contact with the owner a search warrant was obtained and executed at a home in Ashburn. Contact was made with the owner and the dog was located. The dog is currently being treated by a veterinarian. This matter is still under investigation.
LCAS Programs and Events LCAS hosted a department wide compassion fatigue workshop for staff. Compassion Fatigue is emotional exhaustion, caused by the stress of caring for traumatized or suffering animals or people. Officers participated in several humane education presentations at Arcola Elementary, Discovery Elementary, Camp Real at Sugarland Elementary, McGruff Safety Camp at Countryside Elementary, Touch a Truck Event at Dominion High school and at the Dulles South Community Center and two presentations for students in the Monroe Technology program. Several officers received continuing education credits by attending an animal fighting training taught by the Virginia Animal Fighting Task Force. Staff from the Commonwealth Attorney’s office presented to officers on court room preparation and procedures.
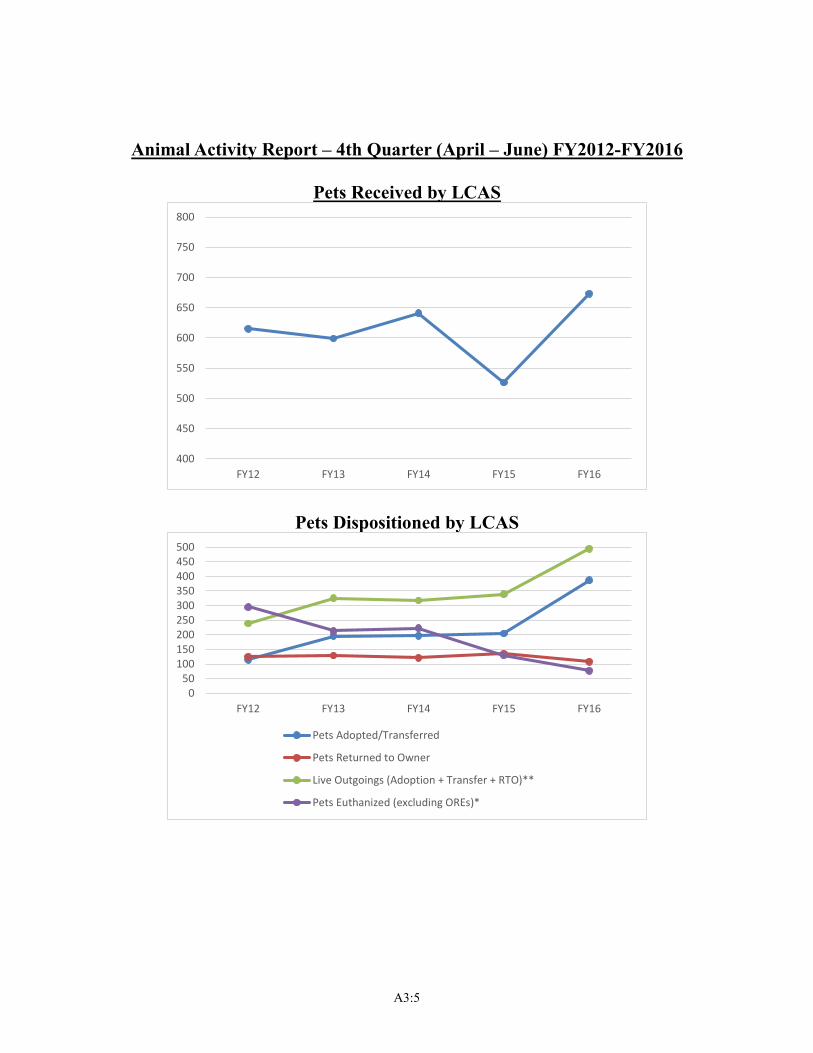
This quarter LCAS saw a 28% increase in the number of pets received over Q4 of FY15. This increase in the number of pets necessitated creative marketing of shelter pet adoptions in addition to efforts to reduce the number of pets brought into the shelter. Promotions included a “Dog Days of Summer” and “U Can Haz Cheezeburger” adoption promotion which partnered with local business, MELT Gourmet Cheeseburgers to encourage adoption. LCAS also partnered with local businesses Loudoun Cat Care and Animal Medical Center of Cascades to promote microchip identification through “Operation Chip-A-Kitty.” The partnership promoted reduce cost microchipping for Loudoun County residents. Overall, the efforts were tremendously successful and led to an increase of over 46% in the live release rate for the Department (the percentage of animals which leave the shelter through adoption, transfer or reunion with owners vs euthanasia).
ATTACHMENT:
SIGNIFICANT INCIDENT REPORT/Q4 FY2016/Department of Animal Services
A3:3
LOUDOUN COUNTY ANIMAL SERVICES SIGNIFICANT INCIDENT REPORT
4th Quarter FY2016
Note: The data depicted in this report reflects specific categories of calls responded to by Animal Control Officers. In addition to the calls reported, officers respond to a variety of other calls such as technical rescues, animal cruelty, pets in hot cars, stray roaming dogs
and sick or injured companion animals.
Incidents Responded to during 4th Quarter (April-June)
FY12 FY13 FY14 FY15 FY16
Total Calls 1292 1351 1461 1418 1543
1150
1200
1250
1300
1350
1400
1450
1500
1550
1600
# o
f C
alls
fo
r Se
rvic
e
Total Calls Responded to by ACO's (4th Qtr)
A3:4
Percentage Change From Period to Period
April-June FY12 Compared To April-
June FY13
April-June FY13 Compared To April-
June FY14
April-June FY14 Compared To April-
June FY15
April-June FY15 Compared To April-
June FY16
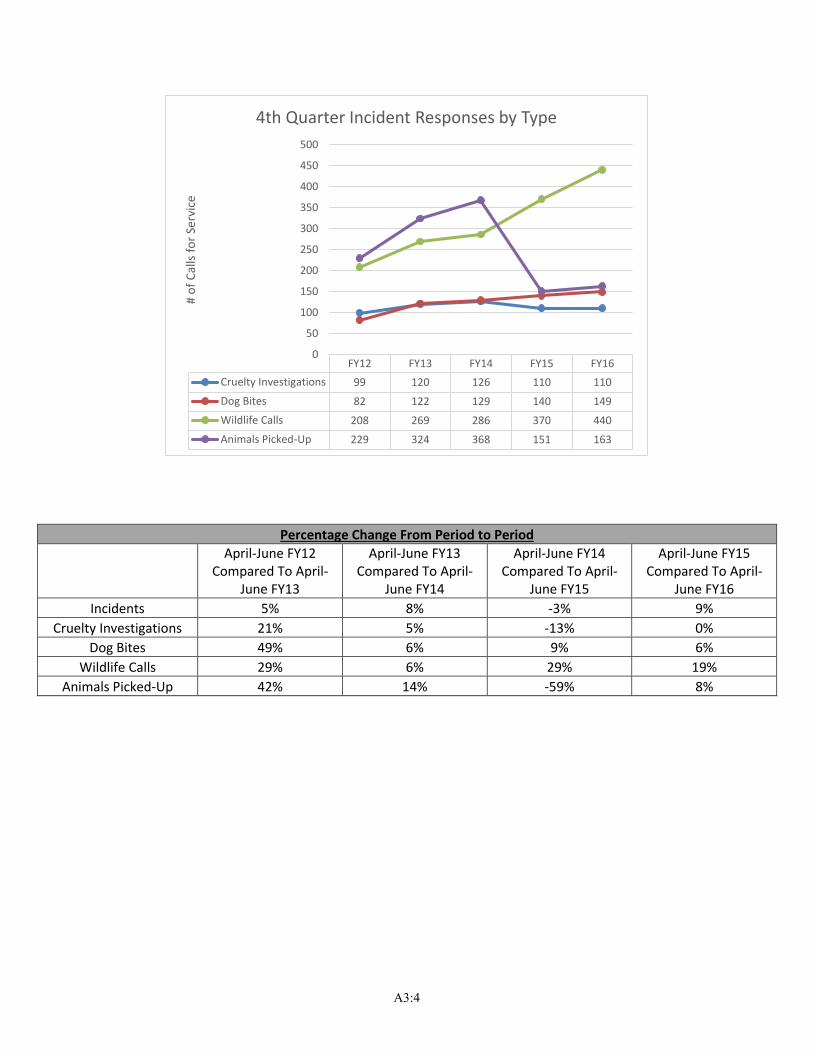
Incidents 5% 8% -3% 9%
Cruelty Investigations 21% 5% -13% 0%
Dog Bites 49% 6% 9% 6%
Wildlife Calls 29% 6% 29% 19%
Animals Picked-Up 42% 14% -59% 8%
FY12 FY13 FY14 FY15 FY16
Cruelty Investigations 99 120 126 110 110
Dog Bites 82 122 129 140 149
Wildlife Calls 208 269 286 370 440
Animals Picked-Up 229 324 368 151 163
0
50
100
150
200
250
300
350
400
450
500
# o
f C
alls
fo
r Se
rvic
e
4th Quarter Incident Responses by Type
A3:5
Animal Activity Report – 4th Quarter (April – June) FY2012-FY2016
Pets Received by LCAS
Pets Dispositioned by LCAS
400
450
500
550
600
650
700
750
800
FY12 FY13 FY14 FY15 FY16
050
100150200250300350400450500
FY12 FY13 FY14 FY15 FY16
Pets Adopted/Transferred
Pets Returned to Owner
Live Outgoings (Adoption + Transfer + RTO)**
Pets Euthanized (excluding OREs)*
A3:6
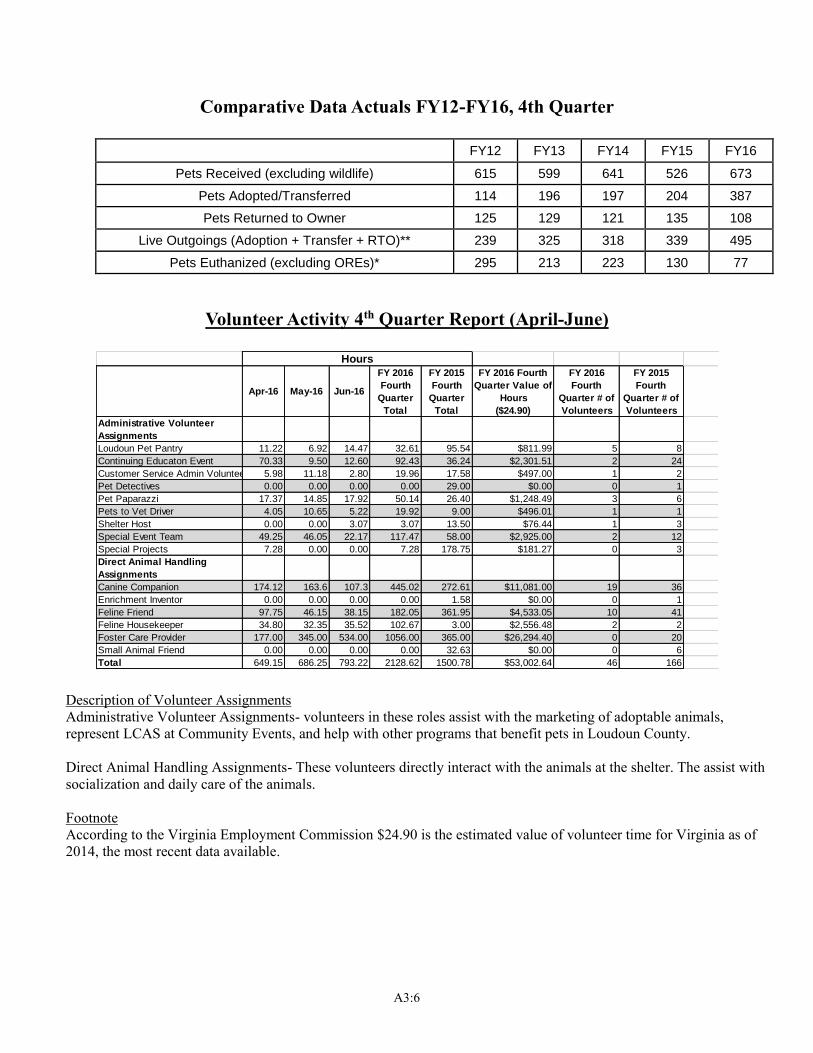
Comparative Data Actuals FY12-FY16, 4th Quarter
FY12 FY13 FY14 FY15 FY16
Pets Received (excluding wildlife) 615 599 641 526 673
Pets Adopted/Transferred 114 196 197 204 387
Pets Returned to Owner 125 129 121 135 108
Live Outgoings (Adoption + Transfer + RTO)** 239 325 318 339 495
Pets Euthanized (excluding OREs)* 295 213 223 130 77
Volunteer Activity 4th Quarter Report (April-June)
Description of Volunteer Assignments Administrative Volunteer Assignments- volunteers in these roles assist with the marketing of adoptable animals, represent LCAS at Community Events, and help with other programs that benefit pets in Loudoun County. Direct Animal Handling Assignments- These volunteers directly interact with the animals at the shelter. The assist with socialization and daily care of the animals. Footnote According to the Virginia Employment Commission $24.90 is the estimated value of volunteer time for Virginia as of 2014, the most recent data available.
Apr-16 May-16 Jun-16
FY 2016
Fourth
Quarter
Total
FY 2015
Fourth
Quarter
Total
FY 2016 Fourth
Quarter Value of
Hours
($24.90)
FY 2016
Fourth
Quarter # of
Volunteers
FY 2015
Fourth
Quarter # of
Volunteers
Administrative Volunteer
Assignments
Loudoun Pet Pantry 11.22 6.92 14.47 32.61 95.54 $811.99 5 8
Continuing Educaton Event 70.33 9.50 12.60 92.43 36.24 $2,301.51 2 24
Customer Service Admin Volunteer 5.98 11.18 2.80 19.96 17.58 $497.00 1 2
Pet Detectives 0.00 0.00 0.00 0.00 29.00 $0.00 0 1
Pet Paparazzi 17.37 14.85 17.92 50.14 26.40 $1,248.49 3 6
Pets to Vet Driver 4.05 10.65 5.22 19.92 9.00 $496.01 1 1
Shelter Host 0.00 0.00 3.07 3.07 13.50 $76.44 1 3
Special Event Team 49.25 46.05 22.17 117.47 58.00 $2,925.00 2 12
Special Projects 7.28 0.00 0.00 7.28 178.75 $181.27 0 3
Direct Animal Handling
Assignments
Canine Companion 174.12 163.6 107.3 445.02 272.61 $11,081.00 19 36
Enrichment Inventor 0.00 0.00 0.00 0.00 1.58 $0.00 0 1
Feline Friend 97.75 46.15 38.15 182.05 361.95 $4,533.05 10 41
Feline Housekeeper 34.80 32.35 35.52 102.67 3.00 $2,556.48 2 2
Foster Care Provider 177.00 345.00 534.00 1056.00 365.00 $26,294.40 0 20
Small Animal Friend 0.00 0.00 0.00 0.00 32.63 $0.00 0 6
Total 649.15 686.25 793.22 2128.62 1500.78 $53,002.64 46 166
Hours