DATE OF LAST ENTRY: 10/5/2005 · portions of the Yanacocha Norte, Yanacocha Sur and Encajon ore...
23
MINING OPERATIONS REPORT VERSION 2005 COPYRIGHT © 1990-2006 DAVID F. BRIGGS. ALL RIGHTS RESERVED. DATE OF LAST ENTRY: 10/5/2005 OPERATION NAME: Yanacocha Complex LOCATION Department: Cajamarca Province: Cajamarca Country: Peru 100,000:1 Scale Quad.: Chota, Cajamarca, Peru Celendin, Cajamarca, Peru Cajamarca, Cajamarca, Peru San Marcos, Cajamarca, Peru Carachugo - Latitude: 6 deg. 59.5' South Longitude: 78 deg. 29.5' West La Quinua - Latitude: 7 deg. 0.0' South Longitude: 78 deg. 30.0' West Peru Yanacocha Complex - Located at an elevation of approximately 10,700 to 13,800 feet, about 15.5 miles north-northeast of Cajamarca, Peru
Transcript of DATE OF LAST ENTRY: 10/5/2005 · portions of the Yanacocha Norte, Yanacocha Sur and Encajon ore...

MINING OPERATIONS REPORT VERSION 2005
COPYRIGHT © 1990-2006 DAVID F. BRIGGS. ALL RIGHTS RESERVED.
DATE OF LAST ENTRY: 10/5/2005
OPERATION NAME: Yanacocha Complex
LOCATION
Department: Cajamarca Province: Cajamarca Country: Peru
100,000:1 Scale Quad.: Chota, Cajamarca, Peru Celendin, Cajamarca, Peru Cajamarca, Cajamarca, Peru San Marcos, Cajamarca, Peru
Carachugo - Latitude: 6 deg. 59.5' South Longitude: 78 deg. 29.5' WestLa Quinua - Latitude: 7 deg. 0.0' South Longitude: 78 deg. 30.0' West
Peru
Yanacocha Complex - Located at an elevation of approximately 10,700 to 13,800feet, about 15.5 miles north-northeast of Cajamarca, Peru

GEOLOGY
Regional Geological Setting
Basement lithologies in the Yanacocha region are characterized by a deformedsequence of Cretaceous sediments, which were eroded down to a surface of very lowrelief prior to the deposition of the middle Miocene Yanacocha Volcanic Complexthat post dates locally intervening early Tertiary volcanics of the LlamaFormation. The Yanacocha Volcanic Complex (age - 11.8 to 12.5 Ma) has beensubdivided into a series of five eruptive/intrusive magmatic cycles. The basalLower Andesitic Sequence of the Yanacocha Volcanic Complex is characterized bya series of andesitic lavas and coeval andesitic flow dome complexes with lesseramounts of intercalated pyroclastic flows. The initial stage of volcanism wasfollowed by a period of eruptive quiescence, when early acidic hydrothermalactivity pervasively altered the Lower Andesitic Sequence. Sedimentation duringthis period was characterized by local occurrences of laminated colloidal silica,which were deposited in acidic lakes that developed within topographic lows orcraters, associated with early hydrothermal and volcanic vents. The period ofquiescence was followed by intense explosive volcanic activity, which resultedin the deposition of widespread quartz crystal-poor, andesitic ignimbritic flowsof the Upper Pyroclastic Sequence. These fragmental lithologies contain clastsof previously altered volcanics, suggesting that the initial phase of pervasive,acid sulfate alteration and silicification occurred prior to their eruption.Rare dacitic domes of the next magmatic cycle were emplaced within the UpperPyroclastic Sequence. Quartz crystal-bearing and lithic-rich pyroclastics arespatially associated with these dacitic domes. This magmatic stage superimposeda second period of acidic sulfate alteration and silicification on lithologiesof the Yanacocha Volcanic Complex. The final magmatic cycle of the YanacochaVolcanic Complex was characterized by violent, multiple-stage phreatic eruptions,which produced heterolithic, matrix-supported breccias that cut across all olderlithologies and alteration assemblages. Late multiple-stage, high and low-anglefluidized dikes cut the earlier stages of phreatic brecciation. The late stage,resurgent phase concluded with the emplacement of andesite/latite diatremes andfeldspar porphyry flow dome complexes.
Post mineral ash flow tuffs of the Huambos Formation (40Ar/39Ar age - 8.4 to 9.9Ma) are exposed around the outer perimeter of the Yanacocha Volcanic Complex andare also represented by minor coeval rhyodacitic intrusive bodies in theYanacocha Lake area. Later glaciation of the region has preferentially erodedless resistant argillic and granular quartz alteration assemblages, while massiveand vuggy quartz-rich lithologies are preserved as topographic highs. Extensivemoraines are exclusively filled with acid sulfate altered debris, derived fromthe Yanacocha Volcanic Complex.
High Sulfidation Epithermal Mineralization
High sulfidation epithermal-type gold ores of the Yanacocha mining district arehosted by the Upper Pyroclastic and Lower Andesitic sequences of the YanacochaVolcanic Complex. Subtle structural controls range from the main ENE trendingset of faults, cutting the Yanacocha Volcanic Complex, to local zones of dilationdeveloped along conjugate, northeast and northwest trending, strike-slipstructural zones. Post dating the multiple-stage phreatic eruptions and locallyspatially related to the emplacement of diatremes and feldspar porphyry dikesassociated with the late resurgent phase of andesite/latite flow dome complexes,ore grade mineralization at Yanacocha is localized within permeable zones

developed during the early stages of acid sulfate alteration, fault zones and inboth phreatic and hydrothermal breccias. Early massive quartz alteration formedan impermeable barrier, which was subsequently hydraulically fractured as thehydrothermal system matured. K-Ar and 40Ar/39Ar age dating on hypogene alunitehave yielded ages ranging from 10.9 to 11.5 Ma, which post date the main volcanicevent by approximately 1.0 million years.
Recognized alteration types at Yanacocha include residual quartz/silicification,advanced argillic, argillic and propylitic assemblages. Extensive and widespreadexposures of residual quartz and massive silicification are present at Yanacocha.Massive tabular bodies of pervasive silicification have completely replacedvolcanic lithologies as quartz saturated solutions cooled and precipitated quartzin the proximity of the water table. The presence of stacked tabular bodies ofsilicification suggests a rapidly fluctuating water table. Sub-vertical tovertical zones of massive silicification are related to structurally controlledhydrothermal breccias. Residual quartz alteration resulted from intense acidleaching and has been sub-divided into the following three types: 1) granularquartz, 2) vuggy quartz and 3) vuggy quartz overprinted by granular quartz.Extensive zones of sub-horizontal tabular bodies of vuggy quartz (up to 1,000feet thick) were developed below the water table as rising magmatic vaporscondensed to form acidic solutions, which leached feldspar and mafic minerals outof the rock, leaving a dense residual quartz matrix surrounding empty voids.Silicification was further enhanced by the silica component of the feldspars,which was absorbed into the matrix of the vuggy quartz alteration. Texturallyranging from a well-indurated sandstone to a beach sand, granular quartzalteration appears to have been mainly formed by post mineral supergeneprocesses. It occurs both above and below tabular zones of massive quartz.District-wide alteration zoning ranges from a central zone of massive to residualquartz alteration, which is successively displaced outward by advanced argillic(quartz-alunite + pyrophyllite + dickite-kaolinite-pyrite), argillic (quartz-kaolinite + illite-montmorillonite-opaline silica-pyrite) and propylitic(chlorite-mortmorillonite + illite-calcite) alteration assemblages. Opalinesilica replacement is common along the margins of the deposits and up to 660 feetabove the auriferous ores.
Disseminated and fracture-controlled auriferous mineralization at Yanacochatypically occurs as rootless bodies within structural zones. Some deposits arespatially associated with contacts of the clay-altered, coarse feldspar porphyryand diatreme intrusive bodies. Deposition of economic concentrations of goldduring the later stages of the hydrothermal system, post dates the main stage ofhypogene acid sulfate alteration. The hydrothermal solutions were channeledalong fault zones and through permeable zones hydrothermally altered rock. Therichest portion of the ore bodies is generally localized within zones of intensegranular and vuggy quartz and hydraulically fractured massive quartz. Althoughsub-vertical hydrothermal breccias are common within the auriferous ore bodies,not all contain economic concentrations of gold. Anomalous gold values decreaseoutward from the highly altered centers into a low grade halo developed withinthe peripheral quartz-alunite and argillic assemblages.
The hypogene sulfide mineral assemblage includes enargite, covellite, arsenianpyrite, digenite, tennantite and barite with minor amounts of galena andsphalerite. These minerals occur within leached voids, fractures and brecciamatrices. Gold occurs within silver-bearing enargite and arsenian pyrite. Deepsupergene oxidation within the upper portions of the system extends to depths ofmore than 1,300 feet. These supergene processes have completely removed copper

from the upper portions of the system, redepositing it as covellite andchalcocite within a zone of supergene enrichment along the redox boundary withnative sulfur. Other oxide minerals include argentiferous jarosite, scoroditeand beudantite. Micron and sub-micron gold are associated with quartz, goethite,mixed Fe-Ti oxides, colloform goethite and barite.
Glacial and Fluvial Sediment-Hosted Gold Mineralization
Auriferous ores at La Quinua were derived by glacial erosion of the upperportions of the Yanacocha Norte, Yanacocha Sur and Encajon ore bodies. Thismineralized material was redeposited as unconsolidated glacial and fluvial-glacial sediments in a fault-controlled basin, located southwest of CerroYanacocha. During glaciation, regional strike-slip fault displacement formed adeep extensional basin (rhomb graben) at La Quinua Central, which has beensubdivided into three structural blocks. A deep graben (up to 970 feet) wasdeveloped between the NNW trending La Quinua and Carbon fault zones. Highsulfidation epithermal ores at Cerro Yanacocha occur in the eastern footwall ofthe La Quinua fault zone. To the west, a horst block was developed between NNWtrending Carbon and El Tapado fault zones, where only 130 to 260 feet of basinalstrata are preserved. A second half graben with up to 600 feet of basinalsediments is developed west of the El Tapado fault zone. The La Quinua CentralBasin is bounded on the north and south by the east-west striking Norte and Surnormal faults, which exhibit displacements of 100 to 400 feet.
Sediments contained within the La Quinua Central Basin include mudflow, mudflow-clay, mudflow-clay-pyrite, ferricrete, gossan, paleosoils and bedded fines.Mudflows are characterized by poorly sorted, rapidly deposited sediments,composed of 50-70% silicified rock fragments (up to 7 feet in diameter) occurringwithin a matrix of fine to coarse-grained sand, silt and clay. They are locallyinterbedded with lenses of bedded fines, composed of alternating layers of mediumto fine-grained sand, silt and clay, which were deposited in small lakes andslow-moving streams.
The dominant lithology at La Quinua Norte and La Quinua Sur and in the deeperportions of La Quinua Central is the mudflow-clay unit. It was deposited in asimilar environment as the mudflows, but was derived from a different source.Composed of a mixture of fresh, propylitized, clay-altered, silicified and acidleached debris, they were derived from low grade material on the outer perimeterof Cerro Yanacocha. The mudflow-clay-pyrite lithologies are unoxidized, weaklypyritic equivalents of the mudflow-clay unit.
Paleosoils (thickness - up to 115 feet) were developed at the base of the mudflowand fines units throughout the La Quinua Central Basin. Composed of fine sand,silt, clay and organic carbon, paleosoils were formed during depositionalhiatuses, when the area was covered by vegetation, local swamps and ponds.Deposited within paleo-lakes and as terraces developed over iron saturatedsprings, gossans were also formed during depositional hiatuses, but consist oflenses (thickness - 15 to 115 feet) composed of more than 90% porous goethite,containing sparse of silicified clasts.
Ferricrete occurs as a horizontal zone of hematitic enrichment, containing 20-50%iron oxide, which was formed by iron rich solutions derived from the oxidationof the Yanacocha ore body. Formed at the top of a fluctuating paleo-water table,hematite was precipitated from iron saturated ground water. Commonly cuttingacross stratigraphic contacts; ferricrete post dates sedimentary deposition. Its

character ranges from a hematite stained coarse gravel to a well-indurated,hematite-cemented sediment. It occurs as a wedge-shaped body, which ranges upto 250 feet in thickness, adjacent to the La Quinua fault and thins westward.
The distribution of alteration products preserved within the stratigraphicsection at La Quinua Central is generally inverse to that of the high sulfidationalteration and mineralization at Cerro Yanacocha. Characteristic of the upperlevels of Cerro Yanacocha, lower grade, alunite and clay-rich alterationassemblages are preserved in the basal sediments of La Quinua Central, whiledebris from the gold-bearing, more siliceous deeper levels at Cerro Yanacochaoccur in the upper portion of the La Quinua Central stratigraphic section.Auriferous mineralization is very fine-grained (less than 150-microns). Itsdistribution is unusually homogeneous, which is attributed to the sedimentaryredeposition of mineralized material from Cerro Yanacocha. Although, there isno evidence of placer-style enrichment of gold, supergene processes haveremobilized silver from Cerro Yanacocha and redeposited it as a sub-horizontal,westward thinning, wedge-shaped zone of enrichment, developed along to the LaQuinua fault zone.
HISTORY
Year of Discovery Discovered By
Yanacocha Norte - 1986 Newmont Peru Ltd.Yanacocha Sur - 1986 Newmont Peru Ltd.Carachugo - 1988 Newmont Peru Ltd.Maqui Maqui - 1990 Newmont Peru Ltd.La Quinua - 1997 Minera Yanacocha S.A.Cerro Negro - 1998 Minera Yanacocha S.A.Corrimayo - 1998 Minera Yanacocha S.A.Cerro Quilish - 1999 Minera Yanacocha S.A.
Exploration Methods Leading to Discovery: The initial gold discoveries atYanacocha resulted from a systematic rock chip survey, which delineatedtwo anomalies of plus 0.015 oz. Au/ton gold at Yanacocha Norte and Sur in1985. Follow-up diamond drilling of these targets during 1986 encounteredsignificant gold mineralization at Yanacocha Norte and Sur.
Summary: Archeological records indicate that Inca, pre-Inca and probably pre-Cajamarca cultures had actively mined the Yanacocha area from 100 AD to 700 AD.At that time, fine-grained chalcedonic silica was recovered to make arrow heads.Extensive ancient workings around Carachugo, Cerro Quilish and Cerro Negro wereworked for cinnabar, which was used as a red pigment in paint. Minor workingsare also present at sites of small copper showings, barite and realgar veins andon semi-massive pyrite. Subsequent mining activities were conducted by theSpanish after their conquest of the Inca Empire in the 1530's.
Modern exploration of the Yanacocha area began in 1968, when the Nippon MiningCompany initially examined a porphyry copper exploration target at QuebradaEncajon. Further examination of the area occurred during a regionalreconnaissance stream sediment sampling program for base metals in northern Peruduring 1970. This project was conducted by the British Geological Survey incooperation with the Peruvian federal government. During 1973, St. Joe Mineralsconducted a TURAM electromagnetic survey and drilled three holes for base metalsbetween Cerro Quilish and Cerro Negro.

Cedimin S. A., the Peruvian subsidiary of the French state owned mining company,Bureau de Recherches Geologiques et Minieres, staked the initial claims in theYanacocha Norte area in 1981. Its initial exploration target was a lead-zincgeochemical anomaly defined by the British Geological Survey during 1970.Newmont's Peruvian subsidiary, Newmont Peru Ltd., and Compania de MinasBuenaventura S.A. entered a joint venture with Cedimin S.A. in 1983. Althoughtrenching and geological mapping at Carachugo during 1984 revealed the presenceof visible gold, initial results of this study were disappointing. Apercussion/diamond drilling program, testing silver geochem anomalies atYanacocha Norte and Oeste defined a resource of 3,445,000 tons of material,averaging 2.7 oz. Ag/ton. Gold was also present with the best intercept being23 feet of 0.28 oz. Au/ton. A systematic rock chip sampling program delineatedtwo gold anomalies at Yanacocha Norte and Sur during 1985. These anomalies weretested by seven diamond drill holes during 1986 with all holes encounteringsignificant oxide and sulfide gold mineralization to a depth of 820 feet. Afterseveral years of exploration, preliminary metallurgical studies began atCarachugo in 1989 and a pilot heap leach plant was subsequently erected at thesite. A feasibility study was completed and submitted to the InternationalFinance Corporation during 1991. Minera Yanacocha S.A. was formed in January1992 as a vehicle to develop and operate these properties. The decision to placethe property in production was made in late July 1992 and on-site constructioncommenced in August 1992. The first deposit to be mined was Carachugo Sur withthe first ore being delivered to the leach pads on June 28, 1993. Cyanidesolutions were first applied to the heaps on August 1, 1993. The first gold waspoured on August 7, 1993. The Maqui Maqui project was approved in December 1993and achieved production in October 1994 at a capital cost of $38.0 million. TheSan José deposit came on line in January 1996. By 1996, Yanacocha had becomethe world's largest gold heap leaching operation. Production was achieved atCerro Yanacocha (Yanacocha Norte) in December 1997 at a cost of approximately $75million. Yanacocha’s fifth mine, La Quinua, was commissioned in October 2001.Mining operations were temporarily halted at Maqui Maqui, San José and Carachugoin September 2000, late 2002 and early 2003, respectively.
In November 1993, the French government announced its intention to privatize themining assets of Bureau de Recherches Geologiques et Minieres. Bureau deRecherches Geologiques et Minieres decided to transfer its 24.7% equity interestin Minera Yanacocha to another entity. After a series of transactions withNormandy Mining Ltd. and PosGold Ltd., the assets of Bureau de RecherchesGeologiques et Minieres were transferred to the La Source Group in June 1995.However, during the restructuring of this agreement in November 1995, La Sources'Peruvian assets were transferred to Compagnie Miniere International Or SA, whichwas owned by BRGM (51%) and the Normandy Mining Ltd. (49%). In the meantime, theNewmont Gold Company and Compania de Minas Buenaventura S.A. filed a lawsuit inPeru to seek enforcement of a provision in the by-laws of Minera Yanacocha, whichgives the existing shareholders the preemptive rights on the proposed sale ortransfer of any shareholder’s interest. The appellate court issued apreliminary ruling in favor of the Newmont and Buenaventura in February 1995.The trail hearing was held in July 1996 and a ruling in Newmont andBuenaventura's favor was issued in September 1996. It permitted Newmont andBuenaventura to jointly purchase the Bureau de Recherches Geologiques etMiniere's 24.7% equity interest for US $109.3 million. An appeal of the decisionwas upheld by the Peruvian Superior Court in February 1997. In June 1998, thePeruvian Supreme Court upheld the lower court's decision.
Early Mines: Numerous old workings

Early Production: Limited historic production of cinnabar
SUMMARY OF RECENT MINING ACTIVITY
Deposits: Yanacocha Complex - Antonio, Carachugo (Norte, Sur and Este), CerroNegro (Este and Oeste), Cerro Quilish, Cerro Yanacocha (Norte, Sur andEncajon), Chaupicocha, Chaquicocha (Norte, Sur and Alta), Corimayo, ElTapado, La Quinua (Central, Norte and Sur), Maqui Maqui (Norte and Sur),Puca Rumi, Quecher and San José (Norte and Sur)
Present Status: Carachugo - Stand-by San José - Stand-by Maqui Maqui - Stand-by La Quinua - Producing Cerro Yanacocha - Producing
Commodities
Major Products: Gold By-products: Silver and Mercury
Operator
Name: Minera Yanacocha S.A.Address: Av. Camino Real 348, Torre el Pilar Piso 10 Lima 27 Peru
Phone: 51 (1) 442-8687
Mine Manager: Brant Hinze, General Manager
Owner(s)
Name(s): Newmont Mining Corporation (51.35%) Compania de Minas Buenaventura S.A. (43.65%) International Finance Corporation (5.00%)
Important Dates
Property Acquired/Discovered: 1986 (Initial Discovery)Decision to Proceed with Development: July 1992Mine Development Began: August 1992First Bullion Produced: August 1993 (Start-up)
Time from Acquisition/Discovery to Initial Production: 7 yearsInitial Development Time: 1 year
Work Force
Number of Employees: In house - 102 (1993) 308 (1997) 1,570 (2001) 157 (1994) 397 (1998) 1,810 (2002) 222 (1995) 1,044 (1999) 1,866 (2003) 235 (1996) 1,196 (2000) 2,243 (2004)
Contractors - 415 (1993) 1,398 (1996) 2,496 (1999) 5,751 (2002) 622 (1994) 3,775 (1997) 6,101 (2000) 5,726 (2003) 783 (1995) 3,184 (1998) 3,775 (2001) 6,802 (2004)
Union/Nonunion: Non-union (1993-2004) Union - Workers Union of Minera Yanacocha SRL (2004- )
Mining
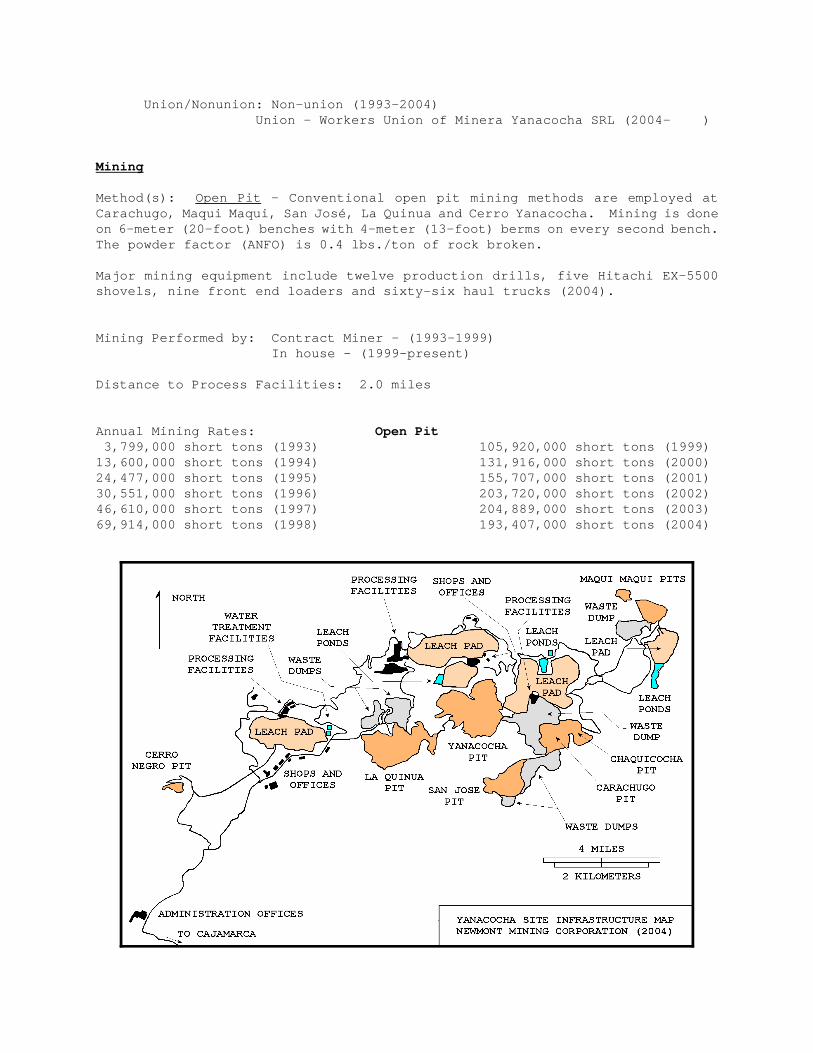
Method(s): Open Pit - Conventional open pit mining methods are employed atCarachugo, Maqui Maqui, San José, La Quinua and Cerro Yanacocha. Mining is doneon 6-meter (20-foot) benches with 4-meter (13-foot) berms on every second bench.The powder factor (ANFO) is 0.4 lbs./ton of rock broken.
Major mining equipment include twelve production drills, five Hitachi EX-5500shovels, nine front end loaders and sixty-six haul trucks (2004).
Mining Performed by: Contract Miner - (1993-1999) In house - (1999-present)
Distance to Process Facilities: 2.0 miles
Annual Mining Rates: Open Pit 3,799,000 short tons (1993) 105,920,000 short tons (1999) 13,600,000 short tons (1994) 131,916,000 short tons (2000)24,477,000 short tons (1995) 155,707,000 short tons (2001)30,551,000 short tons (1996) 203,720,000 short tons (2002)46,610,000 short tons (1997) 204,889,000 short tons (2003)69,914,000 short tons (1998) 193,407,000 short tons (2004)

Waste:Ore Ratio: Open Pit0.40:1 (1993) 0.29:1 (1996) 0.73:1 (1999) 0.37:1 (2002)0.49:1 (1994) 0.58:1 (1997) 0.59:1 (2000) 0.40:1 (2003)0.38:1 (1995) 0.65:1 (1998) 0.84:1 (2001) 0.43:1 (2004)
Cut-off Grade: 0.010 oz. Au/ton (1996)
Processing
Ore Type(s): Oxide
Method(s): Heap Leach (2004) - Run-of-mine ores from Carachugo, San José, CerroYanacocha and Maqui Maqui were stacked on dedicated leach pads in 10-meter liftswithout crushing or any additional treatment. Lime is added to the heaps inorder to maintain a pH of about 10.5. The ores are leveled and ripped by adozer, prior to leaching. A dilute cyanide solution (100 ppm NaCN at pH of 10.5)is applied to the pads by drip emitters at an application rate of approximately0.245 gallons per hour per square foot. The pregnant solutions flow via gravityto the pregnant solution ponds at their respective sites.
Commissioned in October 2001, the ores from the La Quinua were initially reducedby a crushing circuit and agglomerated with cement prior to stacking on the LaQuinua heap leach pad. This practice was suspended in May 2004, with futureproduction derived from uncrushed and unagglomerated ores. However, specialprocedures are followed to limiting the percentage of high clay material loadedonto each leach pad cell in order to ensure adequate permeability is maintained.
As of 12/31/2004, Minera Yanacocha operates a 410-million ton capacity leach padat Carachugo, a 60-million ton capacity leach pad at Maqui Maqui, a 460-millionton capacity leach pad at Cerro Yanacocha and a 400-million ton capacity leachpad at La Quinua. The Carachugo and Maqui Maqui facilities each have twosolution ponds and a storm water pond, located at the base of each of the pad,while the Cerro Yanacocha pad has four solution ponds, a storm water pond and rawwater excess pond. The La Quinua facility has three solution pond and a stormwater pond. Pregnant solutions from the Carachugo and Maqui Maqui leach pads isprocessed by a carbon column plant located at Pampa Larga (Carachugo), while thesolutions from the Cerro Yanacocha and La Quinua heap leach pads are each treatedat its own carbon column plant. Pregnant strip solutions from the various carboncolumn plants and high grade solutions derived directly from the leach pads arecombined and treated by two Merrill-Crowe plants, located at Pampa Larga andCerro Yanacocha. The gold-bearing precipitates are retorted to remove mercuryand smelted with fluxing agents at the Cerro Yanacocha facility to produce abullion product. A second refinery at Pampa Larga is currently on stand-by.
Minera Yanacocha SA operates on a positive water balance. Prior to its releaseinto the environment, the water must meet drinking water standards. It isinitially chlorinated and treated with sodium hypochlorite to eliminate thecyanide from the solution. This step is followed by the addition of sodiumhydrosulfite and ferric chloride to precipitate mercury and arsenic,respectively.
Reagent Consumption - Lime - 1.0 to 1.2 lbs./short ton (1994) Cyanide - 0.10 to 0.14 lbs./short ton (1994) Zinc Dust - 0.34 lbs./troy ounce Au (1994)

Design Capacity: Heap Leach15,000 short tons/day (1993- ) 81,500 short tons/day (1997- )
Actual Processing Rate: Heap Leach 14,471 short tons/day (1993) 168,129 short tons/day (1999) 23,855 short tons/day (1994) 226,842 short tons/day (2000) 48,655 short tons/day (1995) 232,159 short tons/day (2001) 64,850 short tons/day (1996) 406,293 short tons/day (2002) 80,567 short tons/day (1997) 398,014 short tons/day (2003)116,077 short tons/day (1998) 364,792 short tons/day (2004)
Note: Average heap leach rates are based on a 7 day/week (365 day/year) workschedule.
Metallurgical Recovery: Cumulative Heap Leach Recovery57.9% Au (1993) 69.9% Au (1996) 72.4% Au (1999) 71.2% Au (2002)63.2% Au (1994) 74.4% Au (1997) 71.7% Au (2000) 71.5% Au (2003)66.5% Au (1995) 72.9% Au (1998) 72.3% Au (2001) 74.2% Au (2004)
Note: Cumulative heap leach recoveries have been calculated from reportedproduction data. Estimated ultimate gold recoveries at Yanacocha range from 70-80%.
Bullion Content: 46-87% Au 13-54% Ag (1993-2004)
Financial Data
Method of Acquisition
Year Company Method
1981 Cedimin Cedimin S.A., the Peruvian subsidiary of the Frenchstate owned mining company, Bureau de RecherchesGeologiques et Minieres, staked the initial miningclaims (Chaupiloma No. 1 thru 11) in the YanacochaNorte area.
1983 Yanacocha JV Newmont Peru Ltd. and Compania de Minas BuenaventuraS.A. entered a joint venture agreement with CediminS.A. According to the terms of this agreement,Newmont and Buenaventura could earn a 45% and a 10%joint venture interest, respectively.
1992 IFC The International Finance Corporation acquired a 5.0%interest in the property from the joint venturepartners by providing the financing for the project.
1992 Yanacocha In January 1992, Minera Yanacocha S.A. was formed bythe exploration joint venture partners, as a vehicleto develop and operate the mine at Yanacocha. Equityownership of Minera Yanacocha was held by Newmont
Year Company Method
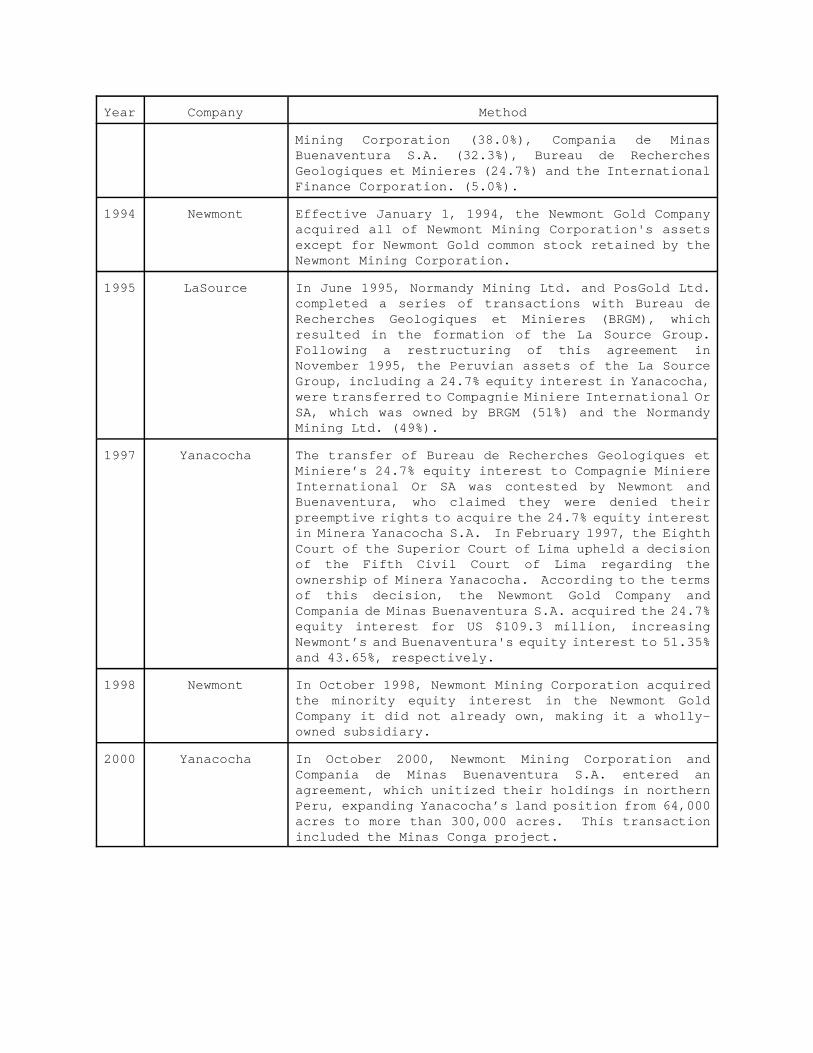
Mining Corporation (38.0%), Compania de MinasBuenaventura S.A. (32.3%), Bureau de RecherchesGeologiques et Minieres (24.7%) and the InternationalFinance Corporation. (5.0%).
1994 Newmont Effective January 1, 1994, the Newmont Gold Companyacquired all of Newmont Mining Corporation's assetsexcept for Newmont Gold common stock retained by theNewmont Mining Corporation.
1995 LaSource In June 1995, Normandy Mining Ltd. and PosGold Ltd.completed a series of transactions with Bureau deRecherches Geologiques et Minieres (BRGM), whichresulted in the formation of the La Source Group.Following a restructuring of this agreement inNovember 1995, the Peruvian assets of the La SourceGroup, including a 24.7% equity interest in Yanacocha,were transferred to Compagnie Miniere International OrSA, which was owned by BRGM (51%) and the NormandyMining Ltd. (49%).
1997 Yanacocha The transfer of Bureau de Recherches Geologiques etMiniere’s 24.7% equity interest to Compagnie MiniereInternational Or SA was contested by Newmont andBuenaventura, who claimed they were denied theirpreemptive rights to acquire the 24.7% equity interestin Minera Yanacocha S.A. In February 1997, the EighthCourt of the Superior Court of Lima upheld a decisionof the Fifth Civil Court of Lima regarding theownership of Minera Yanacocha. According to the termsof this decision, the Newmont Gold Company andCompania de Minas Buenaventura S.A. acquired the 24.7%equity interest for US $109.3 million, increasingNewmont’s and Buenaventura's equity interest to 51.35%and 43.65%, respectively.
1998 Newmont In October 1998, Newmont Mining Corporation acquiredthe minority equity interest in the Newmont GoldCompany it did not already own, making it a wholly-owned subsidiary.
2000 Yanacocha In October 2000, Newmont Mining Corporation andCompania de Minas Buenaventura S.A. entered anagreement, which unitized their holdings in northernPeru, expanding Yanacocha’s land position from 64,000acres to more than 300,000 acres. This transactionincluded the Minas Conga project.

Acquisition Expenditures
Year Costs$ US
Comments
Exploration Expenditures (Fiscal Years Ended 12/31)
Year Costs$ US
Comments
1984 - Exploration work consisted of trenching and mapping. Adrilling project at Yanacocha Norte and Oeste testedsilver anomalies. This program consisted of twenty-fivepercussion holes and eight diamond drill holes, whichdefined a resource of 3.445 million tons of materialaveraging 2.7 oz. Ag/ton.
1985 - A systematic rock chip sampling program defined two goldanomalies at Yanacocha Norte and Sur.
1986 - Gold anomalies at Yanacocha Norte and Sur were tested byseven diamond drill holes. All of the holes encounteredsignificant oxide and sulfide gold mineralization to adepth of 820 feet. Other work included geological mappingand rock chip sampling programs at Carachugo, San José andMaqui Maqui.
1987 - Two drill holes were completed at Yanacocha Norte.
1988 - Exploration activities included five drill holes atCarachugo Sur, Norte and Noreste.
1989 - A developmental drilling program of thirty holes wascompleted at Carachugo, defining a resource of 11 milliontons, averaging 0.040 oz. Au/ton. Also conductedpreliminary metallurgical tests on oxide ores atCarachugo.
1990 - Continued infill and delineation drilling program atCarachugo. The first eight drill holes were completed atMaqui Maqui Sur. Initial work on a prefeasibility studyand metallurgical testing at a pilot heap leach plant alsobegan during 1990.
1991 - Metallurgical studies were successfully completed at thepilot heap leach plant, achieving a gold recovery rate of83%. Additional drilling was completed at Carachugo andSan José. Rock chip geochemical sampling surveysidentified additional gold anomalies at Cerro Quilish,Cerro Negro and Puca Rumi. A bankable feasibility studywas also completed and submitted to the InternationalFinance Corporation.

Year Costs$ US
Comments
1994 4,200,000 Exploration expenditures for 1994 included approximately112 drill holes.
1995 17,000,000 Exploration expenditures for 1995 included about 164,000feet of drilling.
1996 23,200,000 Exploration (US $17.5 million) and mine geology atYanacocha totaled US $23.2 million in 1996.
1997 24,000,000 Exploration (US $10.8 million) and mine geology atYanacocha totaled US $24 million in 1997.
1998 27,800,000 Exploration (US $11.2 million) and mine geology atYanacocha totaled US $27.8 million in 1998.
1999 9,500,000 Exploration expenditures at Yanacocha totaled US $9.5million in 1999.
2000 10,300,000 Exploration expenditures at Yanacocha totaled US $10.3million in 2000.
2001 12,000,000 Exploration expenditures (US $12.0 million) included295,400 feet of diamond drilling at Yanacocha in 2001.
2002 11,100,000 Exploration expenditures (US $11.1 million) included331,500 feet of diamond drilling at Yanacocha in 2002.
2003 12,800,000 Exploration expenditures (US $12.8 million) for 2003.
2004 19,300,000 Exploration expenditures (US $19.3 million) for 2004included exploration near surface oxidized mineralizationat Cerro Quilish, expansion of the Antonio zone and anexamination of the Guiliana prospect.
Capital Expenditures (Fiscal Years Ended 12/31)
Year Costs$ US
Comments
1993 27,761,000 Additions in property, plant, equipment and minedevelopment totaled US $27.8 million. This workincluded construction of the Carachugo leach pad,operations pond, minor event pond, excess water pond,interconnecting canals, rainwater diversion canals,Merrill-Crowe plant and interconnecting pipes andpumps.
1992-1993 37,083,000 Total capital expenditures required to place theCarachugo deposit in production.
1994 40,973,000 Additions in property, plant, equipment and minedevelopment totaled US $41.0 million. These

Year Costs$ US
Comments
improvements included an expansion of the existingCarachugo leach pad. A 2.7-mile road wasconstructed, connecting Pampa Larga and Maqui Maqui.Improvements at Maqui Maqui included the constructionof a leach pad, an operations pond, a minor eventpond, interconnecting canals, rainwater diversioncanals and interconnecting pipes and pumps.
1995 35,244,000 Additions in property, plant, equipment and minedevelopment totaled US $35.2 million.
1996 45,060,000 Additions in property, plant, equipment and minedevelopment totaled US $45.1 million. It includedexpansion projects at Carachugo and Maqui Maqui.
1997 113,700,000 Capital expenditures for 1997 (US $113.7 million)included a water treatment plant and expansion of themine and processing facilities (US $78.4 million).Capitalized developmental drilling expenditures wereUS $14.0 million. This expansion included a thirdheap leach pad and a second Merrill-Crowe goldrecovery plant, which were commissioned at CerroYanacocha in December 1997.
1998 82,500,000 Capital expenditures for 1998 (US $82.5 million)included expansion of the mine and processingfacilities (US $47.8 million) and capitalizeddevelopmental drilling (US $16.4 million).
1999 126,300,000 Capital expenditures for 1999 (US $126.3 million)included costs to convert to owner mining (US $58.3million), leach pad expansion (US $41.2 million) andcapitalized development drilling and mine development(US $18.0 million).
2000 276,900,000 Capital expenditures for 2000 (US $276.9 million)included development of the La Quinua mine (US $144.2million), unitization of regional properties (US$45.7 million), leach pad expansion (US $30.8million), mine development (US $30.0 million) andother replacement capital.
2001 276,900,000 Capital expenditures for 2001 (US $276.9 million)included leach pad construction, crusher andagglomeration equipment for the La Quinua mine (US$128.4 million), Cerro Yanacocha leach pad operations(US $44.9 million), mining equipment (US $44.3million), Carachugo leach pad operations (US $19.3million) and other replacement capital.
2002 146,200,000 Capital expenditures for 2002 (US $146.2 million)included the expansion of leach pads (US $69.2million) at La Quinua (Stage 2 and 3), Cerro

Year Costs$ US
Comments
Yanacocha and Carachugo, mine development (US $16.7million), environmental measures (US $14.3 million),carbon columns and refinery (US $12.9 million) andother replacement capital.
2003 205,700,000 Capital expenditures for 2003 (US $205.7 million)included leach pad development at La Quinua (stages2 and 4 - US $40.6 million) and Cerro Yanacocha(stages 5 and 6 - US $32 million), construction oftwo new carbon column plants at La Quinua and two newcarbon plants at Cerro Yanacocha (US $18.3 million),US $24.4 million for environmental site and regionalwater management projects and US $30.3 million formining equipment.
2004 231,900,000 Capital expenditures for 2004 (US $231.9 million)included mine and leach pad expansion (US $79.4million) at the Cerro Yanacocha and La Quinua pits,environmental site and regional water managementprojects (US $33.4 million), mining equipment (US$46.0 million) and other on-going work.
Royalties: Production from the Yanacocha property is subject to 2% (increasedto 3% as of 1/1/94) royalty on the net sale value of all ore extractedfrom the active mining concessions, listed below, after deducting refineryand transportation costs. This royalty is paid to S.M.R.L. Chaupiloma Dosde Cajamarca, which is owned by Newmont Peru Ltd. (40%) and by Compania deMinas Buenaventura S.A. (20% directly and 40% through its wholly-ownedsubsidiary Cedimin).
Total royalties paid for 2000-2004 were US $14.8 million, US $15.3million, US $21.6 million, US $31.7 million, and US $37.9 millionrespectively.
Property Description: The mining rights to approximately 267,091 acres are heldunder 183 mining concessions and five provisional permits, assigned byS.M.R.L. Chaupiloma Dos de Cajamarca to Minera Yanacocha. MineraYanacocha has also acquired 37,634 acres of surface rights at Yanacochaand 11,174 acres of surface rights at Minas Conga (2004).
The Carachugo and San José mines are located on Chaupiloma Tres,Chaupiloma Cuatro and Chaupiloma Cinco. The Maqui Maqui mine is locatedon Chaupiloma Seis and Chaupiloma Doce. The Cerro Yanacocha mine islocated in Chaupiloma Uno, Chaupiloma Dos and Chupilomo Tres. The CerroQuinua mine is located Chaupiloma Dos, Chaupiloma Once, ChaupilomaVeintiuno, Chaupiloma Veintiuno A2, Chaupiloma Catorce, ChaupilomaCuarentidos, Chaupiloma Cincuenticuatro, Chaupiloma Trece, Mirtha III, LaProvidencia, and El Sol No. 4 mining concessions. The mining rights tothese concessions have been assigned to Minera Yanacocha under leaseagreements with initial terms of 20 years, expiring in 2012, 2021 and

2023. They are renewable upon Minera Yanacocha’s request for anadditional 20-year term.
Operation Costs and Revenues (Fiscal Years Ended 12/31)
Newmont Mining Corporation Data($ US/Oz. of Gold)
Year 1993 1994 1995 1996 1997 1998 1999 2000 2001 2002 2003 2004
Direct Mining andProduction Costs
140 122 107 92 80 91 100 85 113 127 126 144
Capitalized MiningCosts Adjustmentsand Other
2 1 1 1 1 - (1) (2) (1) (2) (3) (6)
Cash Operating Costs 142 123 108 93 81 91 99 83 112 125 123 138
Royalties &Production Tax
7 12 11 7 6 4 4 4 3 4 2 2
Total Cash Costs 149 135 119 100 87 95 103 87 115 129 125 140
Depreciation,Depletionand Amortization
29 22 28 30 49 52 49 45 48 53 56 65
Reclamation and MineClosure Accruals
2 2 2 3 3 3 3 3 3 3 2 2
Total ProductionCosts
180 159 149 133 139 150 155 135 166 185 183 207
Average SellingPrice Realized
376 384 385 387 327 294 280 280 271 313 366 412
Note: Newmont Mining Corporation’s unit cost data conform with the definitions of the Gold Institute ProductionCost Standard.
Production (Fiscal Years Ended 12/31)
Year Heap Leach Heap Leach Grade Au Ag Ore Stacked Au Troy Troy Short Tons Oz./T Oz. Oz.
1993 2,706,000 0.052 81,497 24,4671994 8,707,000 0.054 304,552 97,3491995 17,759,000 0.045 551,965 180,6191996 23,735,000 0.046 811,426 182,8791997 29,407,000 0.043 1,052,806 163,3661998 42,368,000 0.045 1,335,754 457,1831999 61,367,000 0.038 1,655,830 826,1202000 83,024,000 0.031 1,795,398 1,536,5872001 84,738,000 0.030 1,902,489 1,466,1722002 148,297,000 0.023 2,285,584 1,921,670

Production (continued)
Year Heap Leach Heap Leach Grade Au Ag Ore Stacked Au Troy Troy Short Tons Oz./T Oz. Oz.
2003 145,275,000 0.027 2,851,143 3,035,2752004 133,514,000 0.025 3,017,302 3,479,436
Total 780,897,000 0.030 17,645,746 13,371,123
Reserves (Fiscal Years Ended 12/31)
Total Reserves and Resources of Yanacocha Project
Proven and Probable Reserves Other Mineral Resources (Excludes Proven & Probable Reserves)
Year Tonnage Troy Oz. Contained Tonnage Troy Oz. Contained Short Tons Au/T Gold Short Tons Au/T Gold Troy Oz. Troy Oz.
1992 31,689,000 0.040 1,275,000 - - -1993 84,666,000 0.045 3,780,000 137,719,000 0.030 4,137,0001994 103,722,000 0.038 3,970,000 143,937,000 0.029 4,243,0001995 137,071,000 0.036 4,911,000 149,758,000 0.028 4,219,0001996 198,107,000 0.031 6,109,000 217,457,000 0.024 5,184,0001997 476,051,000 0.029 13,882,000 275,608,000 0.020 5,507,0001998 702,249,000 0.029 20,615,000 100,502,000 0.032 3,214,0001999 1,320,025,000 0.025 32,862,000 515,818,000 0.020 10,323,0002000 1,335,518,000 0.027 36,553,000 173,795,000 0.022 3,785,0002001 1,218,089,000 0.028 34,173,000 141,522,000 0.029 4,135,0002002 1,099,172,000 0.030 32,605,000 108,616,000 0.034 3,654,0002003 1,047,049,000 0.033 31,709,000 129,822,000 0.028 3,604,0002004 734,975,000 0.032 23,546,000 242,616,000 0.024 5,920,000
Individual Deposits
Carachugo
Proven and Probable Reserves Other Mineral Resources (Excludes Proven & Probable Reserves)
Year Tonnage Troy Oz. Contained Tonnage Troy Oz. Contained Short Tons Au/T Gold Short Tons Au/T Gold Troy Oz. Troy Oz.
1992 31,689,000 0.040 1,275,000 - - -1993 37,663,000 0.033 1,231,000 - - -

Reserves (continued)
Proven and Probable Reserves Other Mineral Resources (Excludes Proven & Probable Reserves)
Year Tonnage Troy Oz. Contained Tonnage Troy Oz. Contained Short Tons Au/T Gold Short Tons Au/T Gold Troy Oz. Troy Oz.
1994 45,264,000 0.027 1,209,000 9,203,000 0.023 212,0001995 35,459,000 0.025 896,000 - - -1996 43,686,000 0.029 1,268,000 14,186,000 0.019 270,0001997 34,018,000 0.035 1,179,000 10,763,000 0.023 248,0001998 55,691,000 0.027 1,491,000 22,190,000 0.028 621,0001999 139,310,000 0.028 3,907,000 47,887,000 0.027 1,293,0002000 141,460,000 0.033 4,732,000 8,353,000 0.024 200,0002001 76,986,000 0.039 2,993,000 5,810,000 0.035 203,0002002 71,795,000 0.040 2,898,000 - - -2003 63,976,000 0.048 2,762,000 - - -2004 66,405,000 0.042 2,777,000 - - -
Maqui Maqui
Proven and Probable Reserves Other Mineral Resources (Excludes Proven & Probable Reserves)
Year Tonnage Troy Oz. Contained Tonnage Troy Oz. Contained Short Tons Au/T Gold Short Tons Au/T Gold Troy Oz. Troy Oz.
1992 - - - - - -1993 44,930,000 0.056 2,497,000 13,195,000 0.021 277,0001994 56,612,000 0.047 2,680,000 1,680,000 0.023 39,0001995 47,652,000 0.047 2,238,000 - - -1996 32,164,000 0.047 1,519,000 - - -1997 20,632,000 0.042 875,000 - - -1998 9,789,000 0.041 400,000 4,753,000 0.024 114,0001999 5,379,000 0.033 180,000 11,438,000 0.022 252,0002000 7,589,000 0.025 192,000 - - -2001 - - - - - -2002 - - - - - -2003 - - - - - -2004 5,694,000 0.025 141,000 - - -

Reserves (continued)
San José
Proven and Probable Reserves Other Mineral Resources (Excludes Proven & Probable Reserves)
Year Tonnage Troy Oz. Contained Tonnage Troy Oz. Contained Short Tons Au/T Gold Short Tons Au/T Gold Troy Oz. Troy Oz.
1995 52,160,000 0.032 1,690,000 - - -1996 50,527,000 0.029 1,453,000 724,000 0.019 14,0001997 47,817,000 0.028 1,355,000 - - -1998 37,367,000 0.031 1,154,000 - - -1999 45,878,000 0.023 1,041,000 3,272,000 0.014 46,0002000 23,388,000 0.019 453,000 2,347,000 0.014 33,0002001 6,484,000 0.021 139,000 1,102,000 0.018 20,0002002 6,054,000 0.022 131,000 - - -2003 9,475,000 0.023 198,000 - - -2004 10,818,000 0.020 213,000 - - -
Cerro Yanacocha
Proven and Probable Reserves Other Mineral Resources (Excludes Proven & Probable Reserves)
Year Tonnage Troy Oz. Contained Tonnage Troy Oz. Contained Short Tons Au/T Gold Short Tons Au/T Gold Troy Oz. Troy Oz.
1995 - - - 108,828,000 0.031 3,359,0001996 71,664,000 0.026 1,866,000 161,617,000 0.025 4,040,0001997 245,596,000 0.029 7,167,000 14,958,000 0.028 419,0001998 290,028,000 0.032 9,227,000 2,404,000 0.018 43,0001999 575,063,000 0.024 13,794,000 137,365,000 0.023 3,159,0002000 534,946,000 0.026 14,058,000 36,403,000 0.035 1,274,0002001 486,001,000 0.027 13,045,000 33,516,000 0.018 603,0002002 366,868,000 0.029 10,807,000 - - -2003 311,979,000 0.035 9,783,000 - - -2004 257,363,000 0.032 8,328,000 - - -
La Quinua (Includes El Tapado)
Proven and Probable Reserves Other Mineral Resource (Excludes Proven & Probable Reserves)
Year Tonnage Troy Oz. Contained Tonnage Troy Oz. Contained Short Tons Au/T Gold Short Tons Au/T Gold Troy Oz. Troy Oz.
1996 - - - - - -

Reserves (continued)
Proven and Probable Reserves Other Mineral Resource (Excludes Proven & Probable Reserves)
Year Tonnage Troy Oz. Contained Tonnage Troy Oz. Contained Short Tons Au/T Gold Short Tons Au/T Gold Troy Oz. Troy Oz.
1997 120,943,000 0.025 3,002,000 208,957,000 0.019 3,970,0001998 273,061,000 0.026 7,128,000 5,655,000 0.015 85,0001999 400,828,000 0.023 9,285,000 268,365,000 0.016 4,294,0002000 455,522,000 0.026 12,039,000 78,975,000 0.015 1,185,0002001 456,766,000 0.027 12,533,000 16,170,000 0.016 259,0002002 419,597,000 0.027 11,491,000 - - -2003 372,739,000 0.028 9,394,000 - - -2004 275,157,000 0.027 7,388,000 - - -
Cerro Negro
Proven and Probable Reserves Other Mineral Resources (Excludes Proven & Probable Reserves)
Year Tonnage Troy Oz. Contained Tonnage Troy Oz. Contained Short Tons Au/T Gold Short Tons Au/T Gold Troy Oz. Troy Oz.
1997 - - - 22,196,000 0.024 533,0001998 23,943,000 0.027 657,000 378,000 0.019 7,0001999 22,511,000 0.030 667,000 230,000 0.012 3,0002000 23,976,000 0.028 682,000 352,000 0.010 4,0002001 19,494,000 0.032 631,000 448,000 0.012 5,0002002 19,034,000 0.033 626,000 - - -2003 20,329,000 0.035 642,000 - - -2004 253,000 0.031 8,000 - - -
Cerro Quilish
Proven and Probable Reserves Other Mineral Resources (Excludes Proven & Probable Reserves)
Year Tonnage Troy Oz. Contained Tonnage Troy Oz. Contained Short Tons Au/T Gold Short Tons Au/T Gold Troy Oz. Troy Oz.
1998 - - - 65,122,000 0.036 2,344,0001999 110,951,000 0.028 3,132,000 47,261,000 0.027 1,276,0002000 118,888,000 0.027 3,251,000 47,365,000 0.023 1,089,0002001 137,736,000 0.027 3,700,000 20,888,000 0.024 501,0002002 135,481,000 0.027 3,690,000 - - -2003 143,431,000 0.030 3,854,000 - - -2004 - - - - - -

Reserves (continued)
Corimayo
Proven and Probable Reserves Other Mineral Resources (Excludes Proven & Probable Reserves)
Year Tonnage Troy Oz. Contained Tonnage Troy Oz. Contained Short Tons Au/T Gold Short Tons Au/T Gold Troy Oz. Troy Oz.
2001 - - - 63,588,000 0.040 2,544,0002002 21,661,000 0.056 1,220,000 - - -2003 54,442,000 0.060 2,955,000 - - -2004 58,425,000 0.051 3,006,000 - - -
Quecher
Proven and Probable Reserves Other Mineral Resources (Excludes Proven & Probable Reserves)
Year Tonnage Troy Oz. Contained Tonnage Troy Oz. Contained Short Tons Au/T Gold Short Tons Au/T Gold Troy Oz. Troy Oz.
2003 1,028,000 0.042 42,000 - - -2004 - - - - - -
Antonio
Proven and Probable Reserves Other Mineral Resources (Excludes Proven & Probable Reserves)
Year Tonnage Troy Oz. Contained Tonnage Troy Oz. Contained Short Tons Au/T Gold Short Tons Au/T Gold Troy Oz. Troy Oz.
2003 2,186,0000 0.055 109,000 - - -2004 - - - - - -
Others
Proven and Probable Reserves Other Mineral Resource (Excludes Proven & Probable Reserves)
Year Tonnage Troy Oz. Contained Tonnage Troy Oz. Contained Short Tons Au/T Gold Short Tons Au/T Gold Troy Oz. Troy Oz.
1993 - - - 124,524,000 0.031 3,860,0001994 - - - 133,054,000 0.030 3,992,0001995 - - - 40,930,000 0.021 860,000

Reserves (continued)
Proven and Probable Reserves Other Mineral Resource (Excludes Proven & Probable Reserves)
Year Tonnage Troy Oz. Contained Tonnage Troy Oz. Contained Short Tons Au/T Gold Short Tons Au/T Gold Troy Oz. Troy Oz.
1996 - - - 40,930,000 0.021 860,0001997 - - - 18,734,000 0.018 337,000
Stockpiles and In Process
Proven and Probable Reserves Other Mineral Resources (Excludes Proven & Probable Reserves)
Year Tonnage Troy Oz. Contained Tonnage Troy Oz. Contained Short Tons Au/T Gold Short Tons Au/T Gold Troy Oz. Troy Oz.
1993 2,073,000 0.025 52,000 - - -1994 1,846,000 0.044 81,000 - - -1995 1,800,000 0.048 87,000 - - -1996 66,000 0.047 3,000 - - -1997 7,045,000 0.043 304,000 - - -1998 12,370,000 0.045 558,000 - - -1999 20,105,000 0.043 856,000 - - -2000 29,749,000 0.039 1,146,000 - - -2001 34,622,000 0.033 1,132,000 - - -2002 58,682,000 0.030 1,742,000 - - -2003 67,363,000 0.032 1,966,000 - - -2004 60,860,000 0.028 1,685,000 - - -
REFERENCES
Anonymous, 1994, Gold in Latin America: E&MJ, v. 195, n. 6, p. 26-28.
Compania de Minas Buenaventura S.A., Annual Reports, 1996-2004.
Compania de Minas Buenaventura S.A., 20-F Reports, 1996 and 1999-2004.
Harris, L., Livermore, D., Santa Cruz, C., Diaz, M., 1994, The YanacochaProject: Society for Mining, Metallurgy, and Exploration, Inc. Pre-print,n. 94-74, Paper Presented at SME Annual Meeting, Albuquerque, New Mexico,February 14-17, 1994, 20 p.
Harris, L., 1995, Yanacocha - Incas + 450 Years, A Model for Investment inPeruvian Mining: E&MJ, v. 196, n. 8, p. 32-36.

Harris, L., Conway, T., Santa Cruz, C., Schwalb, F., Diaz, M., Arguelles, L.,Cotts, N., Villanueva, M., Meza, F., Guerra, F., Orams, P., and Chang, J.,1996, Newmont's Yanacocha Project: The Joint Venture Three Years Later:Mining Engineering, v. 48, n. 2, p. 41-47.
Longo, A. A., 2000, The San José-Carachugo-Chaquicocha Gold Trend, YanacochaDistrict, Northern Peru; in Geology and Ore Deposits 2000: The Great Basinand Beyond: J. K. Clur, J. G. Price, E. M. Struhsacker, R. F. Hardyman andC. L. Morris (eds.) Geological Society of Nevada Symposium Proceedings,May 15-18, 2000, p. 201-220.
Murdy, W. W., and Bhappu, R. R., 1997, Risk Mitigation in Global MiningDevelopment: Mining Engineering, v. 49, n. 9, p. 30-34.
Newmont Gold Company, Annual Reports, 1993-1997.
Newmont Gold Company, 10-K Reports, 1993-1997.
Newmont Mining Corporation, Annual Reports, 1998-2004.
Newmont Mining Corporation, 10-K Reports, 1998-2004.
Newmont Mining Corporation, Information Handbooks, 2002-2005.
Rendu, J. M., 1998, Practical Geostatistics at Newmont Gold: A Story ofAdaptation: Mining Engineering, v. 50, n. 2, p. 40-45.
Turner, S., 1997, The Yanacocha Epithermal Gold Deposits, Northern Peru: High-Sulfidation Mineralization in a Flow Dome Setting: PhD. Thesis, ColoradoSchool of Mines, 341 p.
Williams, C. L., and Vicuna, E. C., 2000, La Quinua, Peru; in Geology and OreDeposits 2000: The Great Basin and Beyond: J. K. Clur, J. G. Price, E. M.Struhsacker, R. F. Hardyman and C. L. Morris (eds.) Geological Society ofNevada Symposium Proceedings, May 15-18, 2000, p. 1173-1176.
Yepez, Miguel, 1994, The Yanacocha District: Memo from U.S. Embassy in LimaPeru, 6 p.