Datassential -Seafood Keynote Report
26
SNAP! Keynote | Seafood 1 Contact Datassential: 312-655-0594 SEAFOOD THE KEYNOTE REPORT Brian Darr 312-655-0594 [email protected] September 2017 SNAP! KEYNOTE SAMPLE SLIDES get the full report: 312-655-0594 or [email protected]
Transcript of Datassential -Seafood Keynote Report

SNAP! Keynote | Seafood 1Contact Datassential: 312-655-0594
SEAFOODTHE KEYNOTE REPORT
Brian Darr
312-655-0594
September 2017SNAP! KEYNOTE
SAMPLE SLIDESget the full report: 312-655-0594 or [email protected]

SNAP! Keynote | Seafood 2Contact Datassential: 312-655-0594Datassential’s SNAP! Keynote Series leverages the power of SNAP’s tools and combines them with
exclusive consumer and operator survey data, from motivations to behaviors to opportunities, to
bring together trends, data, and insights in a comprehensive report that dives deep into key industry
topics and categories. SNAP! tools include:
• MenuTrends analyzes thousands of menus to track the top and fastest-growing foods and flavors.
• INSIDER tracks, analyzes, and reports on several thousand LTOs and new menu items per year.
• SCORES provides consumer ratings for every LTO and new menu item at hundreds of top chains.
• FLAVOR tracks consumer sentiment on thousands of foods, beverages, and ingredients.
• FIREFLY is a complex database of over 1.3 million operator profiles in the U.S. and Canada.
• LOCAL analyzes popular ingredients and flavors in major metro areas across the U.S.
• BrandFingerprints reveals the unique set of factors that determine which customers visit a chain
and why, including more than 100 key metrics for 130 chains.
For more details, please contact Brian Darr at 312-655-0594 or [email protected]
The Sandwiches Keynote takes a complete look at sandwiches both at home and away from
home by delving into perceptions and preferences regarding carriers, proteins, cheeses,
toppings, condiments, and accompaniments.
We combined opinions from over 1,000 consumers with hundreds of operator perceptions on
sandwiches and leveraged the power of MenuTrends, our trend-tracking menu database, for this
extensive report. It will be an invaluable resource to understand the sandwich landscape.
The Blueprint for LTO Success Keynote explores how limited-time offers have become a chain
restaurant mainstay and a consumer favorite. Learn the reasons why from more than 1,000
consumers and 300 operators, who shared their preferences and usage of LTOs, including their
favorite and most successful new menu items. You’ll also learn best practices around concept
development, backed up by analysis of thousands of actual LTOs launched since 2010.
Qualitative interviews with decision-makers from limited-service and full-service chains provide
insights into successful rollout of an LTO as well as mistakes to avoid. In addition, case studies of
chains with robust LTO programs reveal how they can lead to same-store sales growth.

SNAP! Keynote | Seafood 3Contact Datassential: 312-655-0594
SHOW, BUT DON’T GIVE OR LEAVE BEHIND
This report can be presented live or via webinar, but can not be distributed to outside companies.
If your company has purchased this report, you are encouraged to excerpt key exhibits and build them into your own presentations.
However, you should not provide significant sections of this report to any outside company without express written consent from Datassential.

4contact Brian Darr at
Datassential: [email protected]
Objectives & Methodology
Methodology
• Main fielding completed August 2017 (online)
• Consumers: 1001 respondents who consume fish and/or shellfish (GenPop)
• Operators: 348 operators who offer seafood (via the Datassential panel), including:
• 156 restaurant operators
• 166 on-site operators
• 26 retail operators
• Full respondent details available in the appendix
Objectives
• Identify consumer seafood consumption habits, preferences, and perceptions at home, in
restaurants, and in other away-from-home venues
• Understand consumer motivators for eating seafood at home and away from home
• Understand consumer perceptions and behaviors around purchasing seafood at retail and
preparing seafood at home
• Analyze operator motivators, preferences, and challenges with menuing seafood
• In-depth analysis of seafood’s presence on restaurant menus
• Identify supplier opportunities where operators and consumers have unmet needs

5contact Brian Darr at
Datassential: [email protected]
CONTENTS
5
seafood
landscape
SEAFOOD
LANDSCAPE
18
CONSUMERS:
SEAFOOD AT
RETAIL AND
AT HOME43
CONSUMERS:
SEAFOOD
AWAY FROM
HOME66
OPERATOR
PERSPECTIVES
78
SEAFOOD
114
MEGATRENDS
PERSPECTIVES
103
ON SEAFOODSUSTAINABILITY
executive
summaryKEY FINDINGS
10
THOUGHT
STARTERS
16
seafood
menu partsENTRÉES
128
APPETIZERS
141
SANDWICHES
149
SALADS
155
TACOS
166
BREAKFAST
160
appendices
APPENDIX 1:
OPERATOR
EXAMPLES
196
APPENDIX 2:
ADDITIONAL
FINDINGS
201
APPENDIX 4:
EXHIBIT GUIDE
209
SEAFOOD
189
OPPORTUNITIES
APPENDIX 3:
203
DEMOGRAPHY
7contact Brian Darr at
Datassential: [email protected]
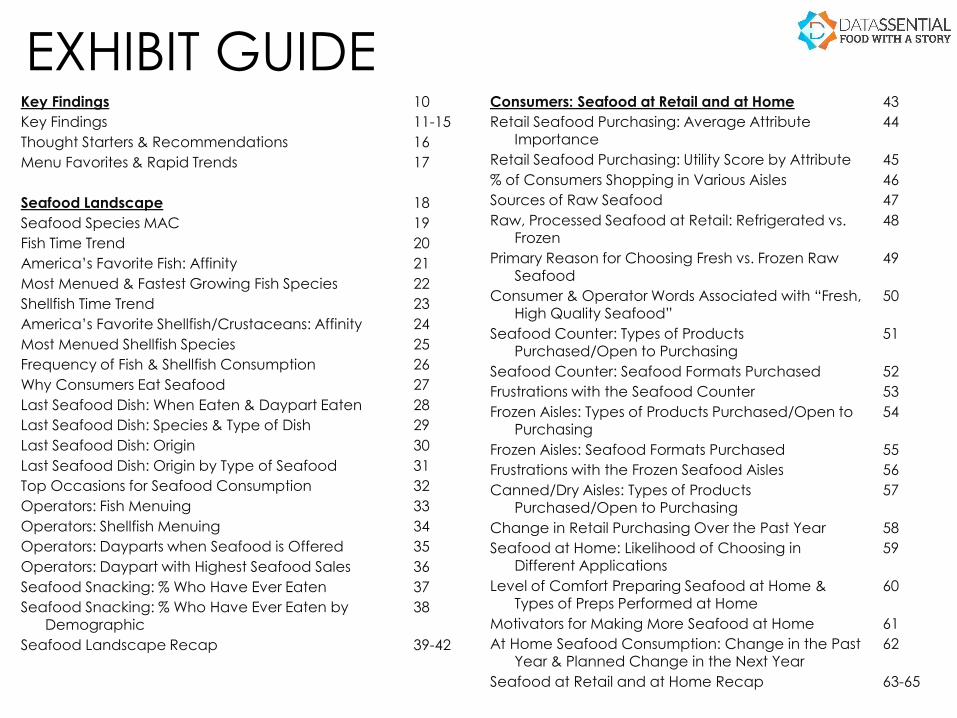
EXHIBIT GUIDEKey Findings
Key Findings
Thought Starters & Recommendations
Menu Favorites & Rapid Trends
Seafood Landscape
Seafood Species MAC
Fish Time Trend
America’s Favorite Fish: Affinity
Most Menued & Fastest Growing Fish Species
Shellfish Time Trend
America’s Favorite Shellfish/Crustaceans: Affinity
Most Menued Shellfish Species
Frequency of Fish & Shellfish Consumption
Why Consumers Eat Seafood
Last Seafood Dish: When Eaten & Daypart Eaten
Last Seafood Dish: Species & Type of Dish
Last Seafood Dish: Origin
Last Seafood Dish: Origin by Type of Seafood
Top Occasions for Seafood Consumption
Operators: Fish Menuing
Operators: Shellfish Menuing
Operators: Dayparts when Seafood is Offered
Operators: Daypart with Highest Seafood Sales
Seafood Snacking: % Who Have Ever Eaten
Seafood Snacking: % Who Have Ever Eaten by Demographic
Seafood Landscape Recap
10
11-15
16
17
18
19
20
21
22
23
24
25
26
27
28
29
30
31
32
33
34
35
36
37
38
39-42
Consumers: Seafood at Retail and at Home
Retail Seafood Purchasing: Average Attribute Importance
Retail Seafood Purchasing: Utility Score by Attribute
% of Consumers Shopping in Various Aisles
Sources of Raw Seafood
Raw, Processed Seafood at Retail: Refrigerated vs. Frozen
Primary Reason for Choosing Fresh vs. Frozen Raw Seafood
Consumer & Operator Words Associated with “Fresh, High Quality Seafood”
Seafood Counter: Types of Products Purchased/Open to Purchasing
Seafood Counter: Seafood Formats Purchased
Frustrations with the Seafood Counter
Frozen Aisles: Types of Products Purchased/Open to Purchasing
Frozen Aisles: Seafood Formats Purchased
Frustrations with the Frozen Seafood Aisles
Canned/Dry Aisles: Types of Products Purchased/Open to Purchasing
Change in Retail Purchasing Over the Past Year
Seafood at Home: Likelihood of Choosing in Different Applications
Level of Comfort Preparing Seafood at Home & Types of Preps Performed at Home
Motivators for Making More Seafood at Home
At Home Seafood Consumption: Change in the Past Year & Planned Change in the Next Year
Seafood at Retail and at Home Recap
43
44
45
46
47
48
49
50
51
52
53
54
55
56
57
58
59
60
61
62
63-65
8contact Brian Darr at
Datassential: [email protected]
EXHIBIT GUIDEConsumers: Seafood Away from Home
Away from Home Seafood Consumption: Change in the Past Year & Planned Change in the Next Year
Seafood AFH: Attitudes Toward Ordering Seafood
Seafood AFH: Likelihood of Choosing in Different Applications
Seafood AFH: Likelihood of Ordering from QSR & Retail
Seafood Purchase Intent by AFH Segment
Change in Seafood Purchasing by AFH Segment
Consumer Verbatims: Reason for Increasing Restaurant Seafood Purchasing
Consumer Verbatims: Innovating Restaurant Seafood Dishes
Seafood Away from Home Recap
Operator Perspectives
Operators: Frequency of Seafood Menuing
Operators: Change in Seafood Sales Over the Past Year
Operators: Importance of Seafood for Operational Goals
Operators Statement Agreement: Purpose of Seafood on Menu
Operators: Best-Selling & Most Profitable Seafood Species
Operators: Average Food Cost by Menu Part
Operators: Frequency of Changing Seafood Menu Offerings
Operators: Effective Methods of Promoting Seafood Items
66
67
68
69
70
71
72
73
74
75-77
78
79
80
81
82
83
84
85
86
Operator Verbatims: Seafood Marketing Methods
Operators: Most Important Seafood Characteristics
Operators: Fish Formats Purchased
Operators: Shellfish Formats Purchased
Operators: Raw Whole & Processed Seafood Purchasing: Refrigerated vs. Frozen
Operators: Freezing Seafood that was Received Fresh
Operators: Primary Reason for Choosing Fresh vs. Frozen Raw Seafood
Operators: Seafood Suppliers Used
Operators: Planned Changes to Seafood Menus
Operators: Biggest Seafood Challenges
Operators: Seafood Improvements to Address Pain Points
Operator Verbatims: Innovative Seafood Products
Operators: Seafood Information Sources
Operator Perspectives Recap
Perspectives on Sustainability
Sustainability Term Menu Penetration Time Trend
Consumers & Operators: Have You Consulted Sustainability Guidelines?
Consumers & Operators: Perceived Level of Knowledge About Seafood Origin
Consumers & Operators: Preference for Different Seafood Origins
Consumer & Operator Verbatims: Reasons for Preferring Farm-Raised Seafood
Consumer & Operator Verbatims: Reasons for Preferring Wild-Caught Seafood
87
88
89
90
91
92
93
94
95
96
97
98
99
100-102
103
104
105
106
107
108
109

9contact Brian Darr at
Datassential: [email protected]
EXHIBIT GUIDEPerspectives on Sustainability, continued
Consumer & Operator Verbatims: Reasons for Preferring Line-Caught Seafood
Operators: “I actively seek out seafood that…” & Reasons for Seeking Sustainable Seafood
Operator Verbatims: Meaning of Sustainability
Perspectives on Sustainability Recap
Seafood Megatrends
Seafood Megatrends MAC
Inception Megatrend: Sushi Burrito
Inception Megatrend: Seafood Jerky
Inception Megatrend: Seaweed Snacks
Adoption Megatrend: Poke
Adoption Megatrend: Shrimp & Grits
Proliferation Megatrend: Premium Breading
Proliferation Megatrend: Lobster Mac & Cheese
Ubiquity Megatrend: Surf & Turf
Ubiquity Megatrend: Fish Tacos
Seafood megatrends: Consumer Affinity vs. Operator Offerings
Seafood Menu Parts: Entrées
Seafood Entrées: Menu Penetration Time Trend
Fish Entrée Price Trend
America’s Favorite Seafood Dishes *& Seafood-Friendly Dishes
America’s Favorite Prep Methods
Top Terms & Ingredients on Fish Entrées
Fastest Growing Terms & Ingredients on Fish Entrées
Shellfish Entrée Price Trend
110
111
112
113
114
115
116
117
118
119
120
121
122
123
124
125-126
128
129
130
131
132
133
134
135
Top Terms & Ingredients on Shellfish Entrées
Most Menued Grains & Pastas in Shellfish Entrées
Fastest Growing Terms & Ingredients on Shellfish Entrées
Seafood Entrées Recap
Seafood Menu Parts: Appetizers
Seafood Appetizers: Menu Penetration Time Trend
Fish Appetizer Price Trend
Shellfish Appetizer Price Trend
America’s Favorite Seafood Appetizers
Top Terms & Ingredients in Seafood Appetizers
Fastest Growing Terms & Ingredients in Seafood Appetizers
Seafood Appetizers Recap
Seafood Menu Parts: Sandwiches
Seafood Sandwiches: Menu Penetration Time Trend
Most Menued & Fastest Growing Seafood Species on Sandwiches
Top Terms & Ingredients in Seafood Sandwiches
Fastest Growing Terms & Descriptors in Seafood Sandwiches
Seafood Sandwiches Recap
Seafood Menu Parts: Salads
Seafood in Green Salads: Menu Penetration Time Trend
Most Menued Seafood Species in Green Salads
Most Menued & Fastest Growing Terms & Ingredients in Seafood Green Salads
136
137
138
139-140
141
142
143
144
145
146
147
148
149
150
151
152
153
154
155
156
157
158

10contact Brian Darr at
Datassential: [email protected]
EXHIBIT GUIDESeafood Menu Parts: Salads, continued
Seafood Green Salads Recap
Seafood Menu Parts: Breakfast
Seafood on Breakfast Menus: Menu Penetration Time Trend
Most Menued & Fastest Growing Seafood Species on Breakfast Menus
Most Menued Seafood Dishes on Breakfast Menus
Most Menued & Fastest Growing Terms & Ingredients in Seafood Breakfast Dishes
Seafood on Breakfast Menus Recap
Seafood Menu Parts: Tacos
Seafood Tacos: Menu Penetration Time Trend
Most Menued Seafood Species on Tacos
Most Menued & Fastest Growing Terms & Ingredients in Seafood Tacos
Seafood Tacos Recap
Detailed Review of Seafood LTOs & New Menu Items
New Menu Item Type Grouping
SCORES Consumer Ratings Definitions
New Seafood Introductions Per Year, 2010-2016
Distribution of New Seafood Items Between LSRs & FSRs, 2010-2016
Top Chain Restaurants: New Seafood Items
New Seafood Item Distribution by Chain Restaurant Segment
The Lent Effect
New Seafood Item Distribution
159
160
161
162
163
164
165
166
167
168
169
170
171
172
173
174
175
176
177
178
179
Average Consumer Ratings for New Seafood Items by Menu Part
New Seafood Item Examples: Safe Experimentation
New Seafood Item Examples: Everyday Classics
New Seafood Item Examples: Ahead of the Curve
New Seafood Item Examples: Work in Progress
Effect of Brand on New Seafood Item Purchase Intent
Detailed Review of Seafood LTOs & New Menu Item Recap
Seafood Opportunities
Opportunity 1: Frozen Seafood
Opportunity 2: Ideas around Seafood Prep at Home
Opportunity 3: Sustainability Education
Opportunity 4: Creative Seafood Menu Items
Opportunity 5: Seafood on Breakfast Menus
Opportunity 6: Safe Experimentation
Appendix 1: Operator Examples
Seafood-Centric Operators: PB Catch & Brown Bag Seafood
Seafood-Centric Operators: Slapfish & Luke’s Lobster
Seafood-Centric Operators: Cajun Kitchen & Neptune Oyster
Seafood-Centric Operators: Coconut’s Fish Café & Greenpoint Fish & Lobster
Appendix 2: Additional Findings
Consumer Verbatims: Reasons for Avoiding Seafood Outside of Holidays
180
181
182
183
184
185
186-188
189
190
191
192
193
194
195
196
197
198
199
200
201
202

11contact Brian Darr at
Datassential: [email protected]
EXHIBIT GUIDEAppendix 2: Additional Findings, continued
Occasions for Seafood Consumption
Most Menued Fish Species by Segment & Region
Most Menued Shellfish Species by Segment & Region
Appendix 3: Demographics
Consumer Demographics
Operator Demographics
203
204
205
206
207
208

12contact Brian Darr at
Datassential: [email protected]
Definitions
Seafood Definitions
FishUnless a specific species is mentioned, “fish” refers to the entire category of fin fish. All MenuTrends, INSIDER, and
SCORES data include the following: ahi, cod, skate, anchovy, bass, branzino, catfish, flounder, grouper,
haddock, halibut, mackerel, mahi, perch, salmon, scrod, seabass, smelt, snapper, sole, swordfish, tilapia, trout,
tuna, whitefish, and yellowtail.
ShellfishUnless a specific species is mentioned, “shellfish” refers to crustaceans, mollusks, other difficult-to-categorize
seafood like sea urchins. All MenuTrends, INSIDER, and SCORES data includes the following: clam, camarone, conch, crab, crawfish, lobster, mussel, octopus, oyster, scallop, sea urchin/uni, shrimp, and squid/calamari.
Seafood Format Definitions
Raw, Further Processed Seafood“Raw, further processed” seafood refers to fresh or frozen seafood that is sold raw after being cleaned, such as
unseasoned raw fish fillets, headless peeled shrimp, etc.
Prepared Seafood“Prepared” refers to seafood that has been modified beyond cleaning and portioning, such as raw kebabs from
the refrigerated case, frozen fish sticks, etc. Prepared seafood can be fresh or frozen, cooked or raw.
Fresh vs. Frozen“Fresh” seafood refers to seafood that is sold un-frozen, regardless of whether or not it was previously frozen.
Frozen seafood refers to seafood that is purchased in a frozen state.

13contact Brian Darr at
Datassential: [email protected]
QSR Midscale (MDS) Casual (CAS) Fine Dine
Full Service Restaurants (FSR)
Fast Casual (FC)
Limited Service Restaurants (LSR)
Traditional Casual
Upper Casual
262,474 US units 113,413 US units 190,424 US units 13,974 US units63,488 US units
counter service with no
wait staff; focus on
speed and food often
served on disposables
waiter service at a
moderate price; often
breakfast-focused and
generally no alcohol
waiter service at a
higher price point than
midscale and often
offering a full bar
high-end table service
with chef-driven menu;
most entrées priced
$25 or higher
counter service with
focus on higher quality,
fresh ingredients, and
customization
*unit counts include both chains and independents, Datassential Firefly 2017
RESTAURANT SEGMENTS

14SNAP! Keynote | Seafoodcontact Brian Darr at
Datassential: [email protected]
50%
60%
70%
80%
90%
100%
2007 2008 2009 2010 2011 2012 2013 2014 2015 2016 2017
Fish can be found at four out of five restaurants, with much higher penetration
at FSRs than LSRs. Fish penetration remains steady in full-service while declining slightly at LSRs.
Fish* Time Trend
penetration time trend by segment
Fish
Penetration10-Year %
Change
FINE DINE: 98% -1%
TOTAL US: 80% -2%
MIDSCALE: 83% +1%
QSR: 62% -9%
CASUAL: 91% +2%
FAST CASUAL: 58% -18%
MENU PENETRATION: of all restaurants offering apps, entrées, or sides, % that offer fish
*Fish includes: ahi, cod, skate, anchovy, bass, branzino, catfish, flounder, grouper, haddock, halibut, mackerel, mahi, perch, salmon, scrod, seabass, smelt,
snapper, sole, swordfish, tilapia, trout, tuna, whitefish, and yellowtail.

Although salmon and tuna are consumers’ most loved fish, affinity is consistent
across many different varieties. Certain species, such as ahi tuna and sockeye salmon, rank
nearly as high as broader classifications such as cod and white fish.
America’s Favorite Fish: Affinity (% who love)
NOTE: Findings are from FLAVOR, a consumer rating tool covering more than 2,600 foods and ingredients.
For more information on how FLAVOR can help you decode consumer preferences, contact Brian Darr at
312-655-0594 or [email protected].
30%27%
24%22%
20%18%
14% 14% 13% 13% 12% 12% 12% 11% 11% 10%
Salmon Tuna Smoked
Salmon
Tilapia Catfish Cod White
Fish
Flounder Ahi
Tuna
Sockeye
Salmon
Halibut Trout Bass Mahi
Mahi
Perch Red
Snapper
Percentile rank (versus all foods and flavors)
5278 75 69 65 62 54 4749 49 49 4884 44 44 42

Seafood consumption is widespread and frequent. Eighty percent of consumers who
eat fish/shellfish had it within the past two weeks, mainly for dinner.
n=1001;
n=799
A1: When is the last time you had any type of SEAFOOD? Please consider all types of seafood: fish filets, shellfish, seafood salads (e.g., tuna salad, shrimp salad), soup (e.g., clam chowder), calamari, etc. A7: [Among those whose last seafood was in the last 2 weeks] Still thinking to this last seafood item. When did you eat it? Select one.
Last Seafood Dish: When Eaten Last Seafood Dish: Daypart Eaten
3%consumed
for breakfast
31%consumed
for lunch
62%consumed
for dinner
Within the Past Day 14%
Within the Past Week 53%
Within the Past 2 Weeks 13%
Longer than 2 Weeks Ago 20%
4%consumed
as a snack

All
OperatorsRestaurant On-Site Retail
348 156 152 40
Breakfast/Brunch 12% 17% 7% 13%
Mid Morning 13% 19% 3% 30%
Lunch 90% 86% 93% 93%
Mid Afternoon 34% 51% 9% 65%
Dinner 72% 90% 55% 68%
Late Night 11% 19% 5% 8%
statistically higher than the totalstatistically lower than the total
Lunch is by far the daypart most heavily menued with seafood. Restaurants are
more likely than other segments to menu seafood at dinner and off-peak hours.
Dayparts when Seafood is Offered (% offering)
n=variesA5 (Operator): During what hours do you offer seafood? Select all.

SNAP! Keynote | Seafood 18Contact Datassential: 312-655-0594
n=182;
n=303
D7 & D8: [Among those who have increased seafood purchasing at LSRs or FSRs] You mentioned that you are buying seafood at [D7:quick service restaurants] [D8: full-service restaurants] more often today than a year ago. Why have you increased your seafood purchasing? Please be as detailed as possible. Free text.
Selected Consumer Verbatims: Reasons for Increasing Restaurant Seafood Purchasing
“Wild-caught salmon being available from Captain D's is a good, quick, and healthy option.”
“I think quick service restaurants have vastly improved their seafood offerings over the past year, in both variety
and quality, so now I am more open to purchasing seafood options from them.”
“I am trying to eat less meat. So while I still don't go to places like this as much, I do go more than I did last year.”
“The variety is better than it has ever been. I love the different items that are available for purchase.”
“We are going out to eat more often now than we did a year ago, so I can order fish entrées I would not make at
home.”
“Joe’s Crab shack is a decent seafood chain for the quality and value. Preparation are offered in more of a
variety way. Switching up the diet is good.”
“I have a new taste for seafood and it has become one of my favorite things to eat. Most of the mentioned full-
service restaurants serve delicious meals that are full of all kinds of flavors.”
“We have begun going back to Red Lobster a few months back after a bad experience and so I've tried a
couple of newer dishes there but I prefer fine dining experiences when I am ordering a specialty fish dish.”

Operators who menu seafood usually do so all year long. The 20 percent who only
offer seafood as occasional specials or for holidays/special events may benefit competitively from moving fish/shellfish to their permanent menu.
Frequency of Seafood Menuing
n=348A4 (Operator): Which of the following describes the frequency with which you offer seafood? Select one.
81% 11% 9%
year-round on my
regular menu
occasionally
as a special
only during special occasions
I menu seafood…

Fresh seafood commonly ends up being frozen by the operator. This points to its
shorter shelf life but perhaps also to difficulty in planning purchases that match customer demand.
Freezing Seafood that was Received Fresh
n=210A20 (Operator): Do you ever end up freezing the fresh seafood that you purchase? Select one.
50%of operators who buy
fresh seafood end up
freezing it

Guidelines for buying sustainable seafood reach few operators and even
fewer consumers. Yet with strong interest in sourcing information, the point of purchase is a key
channel for communicating supplier practices.
n=1001;
n=348
B10: Have you ever consulted seafood purchasing guidelines published by industry, government, or environmental groups, such as Seafood Watch from the Monterey Bay Aquarium for information on seafood sustainability? Select one. B9 (Operator): Have you ever consulted seafood purchasing guidelines published by industry, government, or environmental groups, such as Seafood Watch from the Monterey Bay Aquarium for information on seafood sustainability?
Operator: Have You Consulted
Sustainability Guidelines?
Consumer: Have You Consulted
Sustainability Guidelines?
16%of consumers have consulted sustainability guidelines when
purchasing seafood
21%of operators have consulted sustainability guidelines when
purchasing seafood

adoptionDATASSENTIALMenu Adoption Cycle
*Data is from a survey of Datassential’s OPERA operator panel, which consists of restaurant, on-site, and retail operators.
POKETrendy anything-goes raw fish bowls
6% of operators who menu fish currently offer*
27% of consumers are familiar; 10% love
This versatile dish is catching on after poke-
focused urban fast casuals introduced the
nation to this traditional Hawaiian dish.

23SNAP! Keynote | Seafoodcontact Brian Darr at
Datassential: [email protected]
Breakfast is increasingly a showcase for seafood, with both fish and shellfish
rising steadily on menus. Seafood growth on breakfast and brunch menus is driven by seafood
benedicts, shrimp and grits, and upscale items like ceviche.
Seafood on Breakfast Menus
penetration time trend
15%
25%
35%
2007 2008 2009 2010 2011 2012 2013 2014 2015 2016 2017
Penetration on
Breakfast Menus10-Year %
Change
FISH*: 35% +44%
SHELLFISH**: 27% +40%
MENU PENETRATION: of all restaurants with breakfast menus, % that offer…
**Shellfish includes: clam, camarone, conch, crab, crawfish, lobster, mussel, octopus, oyster, scallop, sea urchin/uni, shrimp, and squid/calamari.
*Fish includes: ahi, cod, skate, anchovy, bass, branzino, catfish, flounder, grouper, haddock, halibut, mackerel, mahi, perch, salmon, scrod, seabass, smelt,
snapper, sole, swordfish, tilapia, trout, tuna, whitefish, and yellowtail.

FSRs represent the bulk of new seafood menuing. However, the LSR footprint has
increased since 2010.
2010 2011 2012 2013 2014 2015 2016
20162010
LSRs
FSRs
16%
84%
26%
74%
Distribution of New Seafood Items Between LSRs and FSRs
time trend in chain restaurants, 2010-2016*
*Data is from Datassential’s INSIDER database, which tracks LTOs and new menu items from the top 250 chain restaurants and c-stores on a monthly basis. The base size for all restaurant seafood LTOs is over 4,800.

SNAP! Keynote | Seafood 25Contact Datassential: 312-655-0594
Select Seafood-Centric Operator Examples
Want more? Many of these examples were highlighted in one of our many Trendspotting publications, which have
covered everything from modern bakeries to Asian fast casuals to airport foodservice. For more info or to subscribe,
contact Mike Kostyo at 312-219-6435 or [email protected].
Slapfish
9 locations
Huntington Beach, CA
(HQ)
Luke’s Lobster
27 locations
New York, NY (HQ)
PRO
TIP
Gruel opened the original Slapfish in a leased food truck, offering just three items on the menu – a fish sandwich, fish taco, and lobster roll.
PRO
TIP
Sustainability is a core value. Luke’s sister company, Cape Seafood, sources seafood from along the Northeastern U.S. and Canadian coasts caught in sustainable nets and traps.
Sustainable, Seasonal, and CustomizableSlapfish co-founder Andrew Gruel was working at Long Beach, CA’s Aquarium of the Pacific and learning about sustainable seafood when he got the idea to open Slapfish, taking inspiration from fast casual pioneer Chipotle. Billed as a “modern seafood shack,” Slapfish offers sustainably-sourced seafood at affordable prices. Some of its dishes have become iconic, like its Chowder Fries – natural-cut fries topped with the chain’s signature New England Clam Chowder and bacon.
On a Roll with a Regional ClassicFormer lobster fisherman Luke Holden opened his first shack in New York’s East Village in 2009. The concept has since expanded across the country and has even opened a unit in Japan. Lobster rolls are the star of the menu, although the crustacean also can be found on a grilled cheese sandwich, mixed into mac and cheese, and topping a grain bowl. Most units feature a “relaxed vibe and decor,” Holden told SouthFlorida.com, with weathered wood and chalkboard menus.

26contact Brian Darr at
Datassential: [email protected]
WE KNOW FOOD
for more information, contact BRIAN DARR at
312-655-0594 or [email protected]
DATASSENTIAL is your best source for food industry insights – from the
latest menu trends to the products shoppers want at the grocery store.