DataLend | Securities Finance Market Data
20
DATALEND
-
Upload
christopher-gohlke -
Category
Economy & Finance
-
view
223 -
download
5
Transcript of DataLend | Securities Finance Market Data

DATALEND
2 | DATALEND.COM
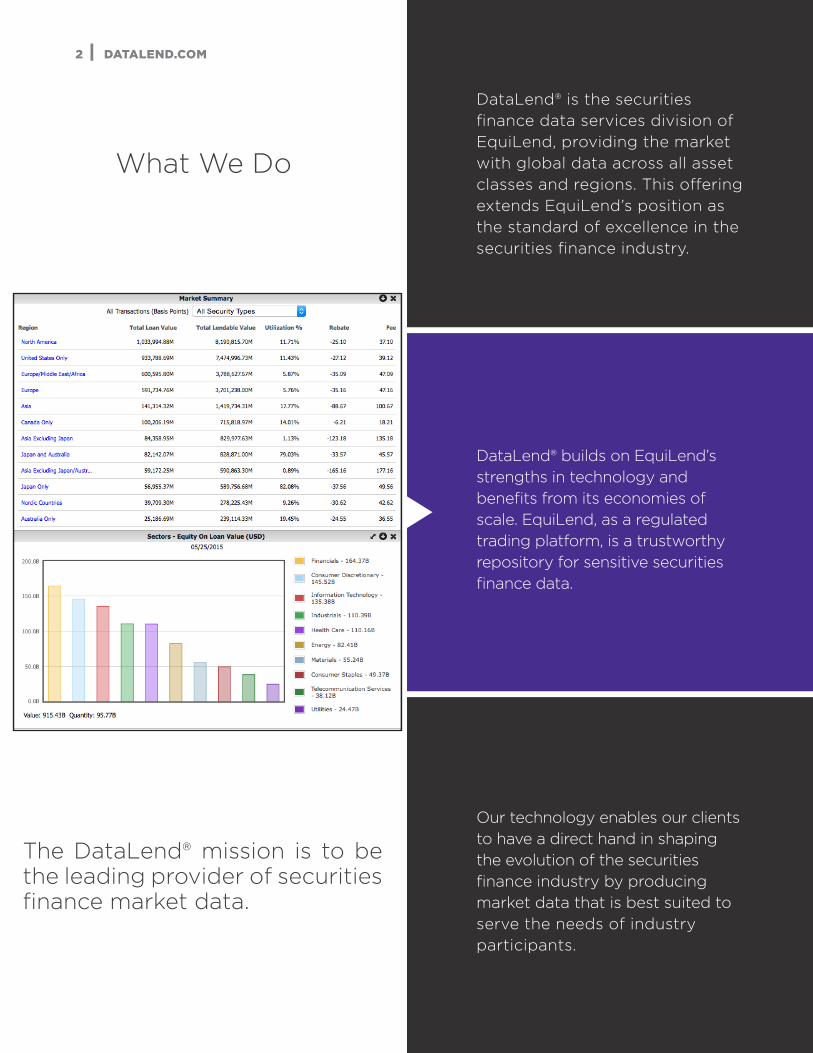
The DataLend® mission is to be the leading provider of securities finance market data.
DataLend® is the securities finance data services division of EquiLend, providing the market with global data across all asset classes and regions. This offering extends EquiLend’s position as the standard of excellence in the securities finance industry.
DataLend® builds on EquiLend’s strengths in technology and benefits from its economies of scale. EquiLend, as a regulated trading platform, is a trustworthy repository for sensitive securities finance data.
Our technology enables our clients to have a direct hand in shaping the evolution of the securities finance industry by producing market data that is best suited to serve the needs of industry participants.
What We Do

DATALEND.COM | 3
STANDARDS
DataLend® has taken an iterative approach to develop business rules that standardize data and maximize its usefulness.
Our standards help ensure that DataLend® meets its clients’ objectives for quality at all times.
• Exclude duplicate records: no double counting of records that may produce erroneous or inflated statistics
• Removal of invalid or incomplete data• Eliminate potential outliers that could
distort the data

4 | DATALEND.COM
This data is available on the next business day in formats including: data feed aggregated by security or security and dividend rate; intuitive user interface; and as an Excel® Add-In.
A s part of our implementation of the industry established “give to get” methodology, DataLend® provides a
secure site through which to transfer data. DataLend® provides inbound and outbound file specifications for client data (i.e., open contracts). It then accepts client data on a daily basis and provides a set of anonymous,
aggregated metrics by security, including volume-weighted average fees and rebates (1-day, 5-day, 10-day, 30-day, 90-day, All), days to cover, short interest, utilization, inventory value and quantity, loan value and quantity and exclusive DataLend metrics such as the DataLend Rate, re-rating information and all-in rates.
How It Works

Offers high-level metrics based on the previous business day’s trading activity.
Provides metrics such as the total number of records, unique securities, total on-loan and inventory values by region, asset class, sector and industry.
DATALEND.COM | 7
Data Dashboard
The DataLend Target 50The DL50 is available on the Data Dashboard. It is composed of the 50 most expensive equities to borrow for the
user-selected region determined by volume-weighted average fee/rebate rate and utilization. The DL50 is meant to be a benchmark utility to determine how the hottest securities in the securities lending market are trending over time.

The New Security Search screen provides current and historical data for a specific security
8 | DATALEND.COM
The New Security Search screen provides current and historical data for a specific security including on-loan and lendable quantity and values, utilization, short interest, volume-weighted average fees and rebate rates trending over time and re-rating information.
Security Search
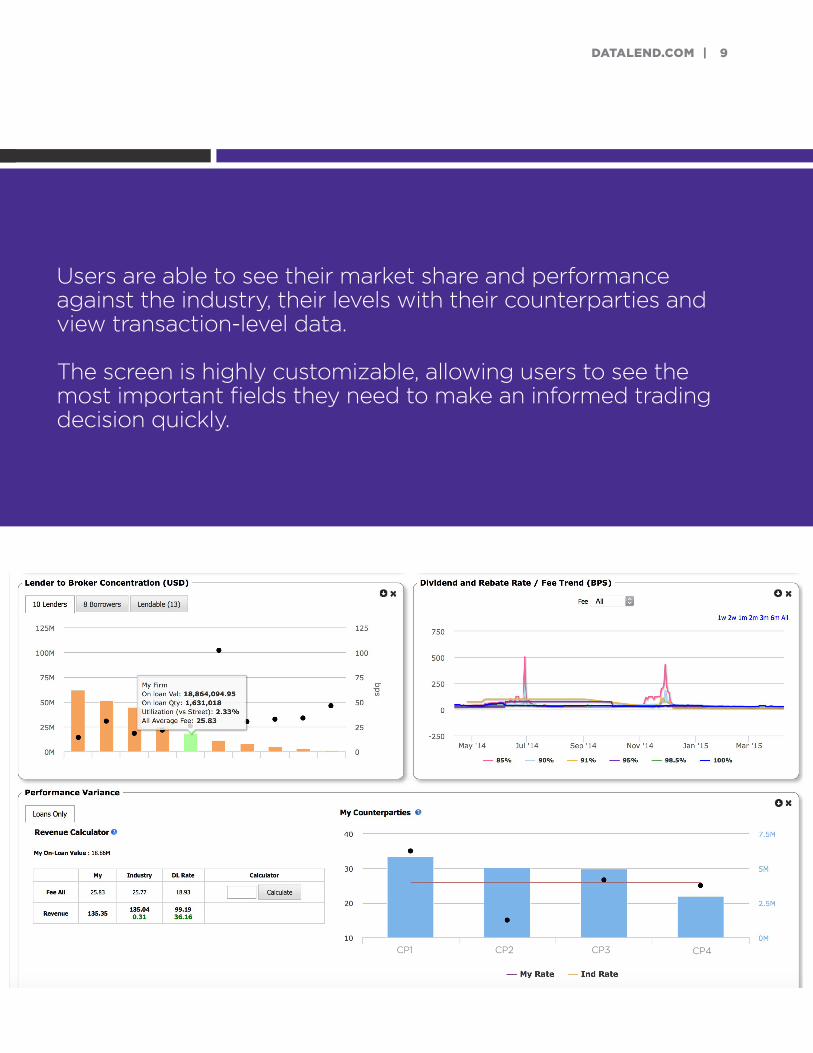
Users are able to see their market share and performance against the industry, their levels with their counterparties and view transaction-level data. The screen is highly customizable, allowing users to see the most important fields they need to make an informed trading decision quickly.
CP1 CP2 CP3 CP4
DATALEND.COM | 9

10 | DATALEND.COM
DataTrack
DataTrack provides quick access to lists of securities and their on-loan metrics with the ability to add and remove securities as desired.
Users can share their watch lists with other users within their firm.

DATALEND.COM | 1 1
Research ReportsKey features for all Research Reports include:
• Fully customizable screen layouts• Filters enable you to create and save filtered views for easy, one-time filter setup• Ability to pinpoint the largest changes in fees, rebates, on-loan value, short interest and
utilization from the previous business day, week or month within a selected asset class, region, country or sector
• Ability to benchmark yourself against the industry to see where you are under- or over-performing by asset class, region, country or sector
• Capability for an XLS upload of a list of securities such as the Russell 2000, Eurostoxx 600, S&P 500 or a customized list for pricing purposes
• All screens are downloadable to XLSX, XLS, CSV or TXT
The Deltas view allows you to spot securities with the largest changes in fee, rebate, on-loan value, lendable value, short interest and utilization from the previous business day, week or month. It can help users to quickly identify market trends no matter where they are or what they’re trading.
New! Deltas

12 | DATALEND.COM
The Industry Metrics view allows you to see the entire universe of securities on loan for a selected business date, including more than 41,000 unique securities. Users can filter and sort securities by fee, rebate, utilization, on-loan and inventory value, country, asset class and many other attributes.
Industry Metrics

DATALEND.COM | 1 3
A robust filter set can also show users where they may be under- or over-performing against the industry with just a few clicks. Users can filter and sort their positions by fee, rebate and daily P&L differences against the industry as well as market share, utilization, on-loan and inventory value, country, asset class and many other attributes.
Organization Variance
The Organization Variance report is a performance benchmarking tool that allows users to see their entire portfolio against all other DataLend participants for a selected business date.

14 | DATALEND.COM
Our screens provide fast, easy and intuitive tools to help users easily access and track securities finance market data.
The Add-In enables users to return results for a list of securities and also allows a download of historical data for individual securities. This data can be used for reporting or analysis purposes directly in Excel®.
Excel® Add-In
The DataLend® Excel® Add-In function allows users to run searchable queries across DataLend®’s securities finance dataset for a given business date. The Add-In allows users to return securities trading activity based on utilization, volume-weighted average rebate rate or fee, security type, sector and industry.

DATALEND.COM | 1 5
Beneficial Owner Reporting
Tools for comparing a beneficial owner’s securities lending performance against other beneficial owners with similar attributes.
Users can see their performance metrics compared to the industry in the areas of: total and average daily returns, daily average utilization, securities lending return to lendable, total return to lendable and volume-weighted average loan pricing.
Users can filter their own funds along with funds they are comparing against to get true “like-to-like” comparisons with the ability to define their time frame.
• Program Performance Report • Client Performance Report• Security Performance Report
Client Performance Reporting

Program Overview
The Program Overview enables users to quickly compare their entire lending program against all
other agent lenders on the DataLend platform on a yearly, quarterly, monthly or ad hoc basis.DataLend® accurately compares your performance against other agent lenders by matching their results based on only those securities you had out on loan. DataLend® also
takes the dividend rate(s) and loan duration of those securities into consideration. Finally, within the performance summary statistics, DataLend® “weighs” the group’s figures to your program by applying the group’s utilization and fee metrics to your firm’s inventory to determine how other agent lenders would have performed with your inventory.
16 | DATALEND.COM

DATALEND.COM | 1 7
• A period end snapshot of your lending program including utilization, volume-weighted average fee, securi-ties lending return to lendable and other metrics
• A performance summary versus other agent lenders by securities lending return to lendable, utilization, fees and total return to lendable
• A revenue summary for the current and previous quarter or month for your organization including daily average revenue and total revenue figures by securities lending and cash reinvestment activity
• Quarterly revenue figures split out by securities lending and cash reinvestment activity
• Top earning securities for the timeframe
• A performance attribution scorecard giving percentile-based metrics across fees, utilization, reinvestment rate, loan duration and return to lendable performance versus other agent lenders
The Program Overview is available in a printer-friendly XLS download, which can also be emailed directly to users.

18 | DATALEND.COM
For example, if a user wanted to see the performance of a client pension plan in the U.K., the user would select the “Peers” option in the Matching Group and DataLend® would include only U.K. pension plans in the comparison group.
DataLend® compares your client’s performance against other similar
clients by matching only those securities your client had out on loan against the compare group’s results. DataLend® also takes the dividend rate(s) and loan duration of those securities into consideration. The Client Overview contains similar performance metrics and functionality as the Program Overview.
The Client Overview enables users to quickly compare an individual beneficial owner’s portfolio against funds with similar legal structures and fiscal locations for a true “like-to-like” comparison group.
CPR: Client Overview

DATALEND.COM | 1 9
Client Performance Report Users can filter their own funds along with funds they are comparing against to get
true “like-to-like” comparisons with the ability to define their time frame.

Users can navigate to this screen via a tab at the top of the reporting suite or by clicking into any of the time series graphs in the Program or Client Overview screen.
20 | DATALEND.COM
CPR: Security Performance Report
The Security Overview screen is an investigative tool that allows the user to drill down to see their performance against the group of all securities out on loan for their entire lending program or a client portfolio on any given business date.
The Security Performance report screen displays program or client metrics against a peer group and displays the following data for both:
• Volume-weighted average fees• Utilization• Securities lending return to lendable• Daily revenue
Users also can elect to show their security-level performance against their specific peer group or all participants.
DATALEND.COM | 2 1
About
EquiLend is backed by 10 global financial institutions: BlackRock, Credit Suisse, Goldman Sachs, J.P. Morgan Clearing, J.P. Morgan, Bank of America Merrill Lynch, Morgan Stanley, Northern Trust, State Street and UBS.
Used by securities borrowers and lenders globally, the EquiLend platform (for equities)
and BondLend platform (for fixed income) automate formerly manual trading and post-trade processes in the securities finance industry. DataLend, the securities finance market data division of EquiLend, provides highly cleansed and standardized finance data covering all asset classes, regions and markets globally.
EquiLend is a leading provider of trading and post-trade services for the securities finance industry with offices in New York, London, Hong Kong and Toronto.

EquiLend LLC, EquiLend Europe Limited, and EquiLend Canada Corp. are subsidiaries of EquiLend Holdings LLC (collectively, “EquiLend”). EquiLend LLC is a member of the FINRA and SIPC. EquiLend Europe Limited is authorized and regulated by the Financial Conduct Authority. EquiLend Canada Corp. is authorized and regulated by IIROC. All services offered by EquiLend are offered through EquiLend LLC, EquiLend Europe Limited, and EquiLend Canada Corp. EquiLend and the EquiLend mark are protected in the United States and in countries throughout the world. © 2001-2015 EquiLend Holdings LLC. All Rights Reserved.
NEW YORK
+1 212 901 2200
LONDON
+44 207 426 4426
TORONTO
+1 416 865 3395
HONG KONG
+852 3101 7070
®DATALEND