DATABOOK - 大成建設株式会社 · DATABOOK. 2020. Contents. 1. IMPORTANT NOTE: Readers should...
23
DATABOOK 2020
Transcript of DATABOOK - 大成建設株式会社 · DATABOOK. 2020. Contents. 1. IMPORTANT NOTE: Readers should...

DATABOOK
2020

Contents
1
IMPORTANT NOTE:Readers should be aware that the information contained in this Data Book 2020 has not been audited or examined by the auditorof Taisei Corporation.
Page
Consolidated financial information
1. Consolidated financial summary 2
2. Consolidated balance sheets 3
3. Consolidated statements of income 6
4. Consolidated statements of cash flows 8
5. Segment information 10
Non-consolidated financial information
6. Non-consolidated financial summary 11
7. Non-consolidated balance sheets 12
8. Non-consolidated Statements of income 15
9. Amount of orders received
9-1.Amount of orders received 16
9-2.Breakdown of orders received by type 17
9-3.Breakdown of orders received by type of construction 18
9-4.Breakdown of orders received by industry 19
10. Net sales 20
11. Balance carried forward 21
12. Gross margin ratio 22

2
Consolidated Financial Information
*1 The Company conducted 1-for-5 consolidation of shares on October 1, 2017. Therefore, net assets per share and net income per share for the fiscal year ended 2017.3 reflects the impact of the consolidation of shares.
*2 Because of “Partial Amendments to Accounting Standard for Tax Effect Accounting, etc.” (Statement No.28, February 16, 2018) applied from the beginning of the fiscal year ended 2019.3, total assets and equity ratio for the fiscal year ended2018.3 is index after retrospectively applying the accounting standards.
1.Consolidated financial summary
(Millions of yen、%)
2016.3 2017.3 2018.3 2019.3 2020.3
Amount of order received 1,671,061 1,655,035 1,743,497 1,693,859 1,680,051
Net sales 1,545,889 1,487,252 1,585,497 1,650,877 1,751,330
Operating income 117,468 140,822 181,859 153,323 167,755
Ordinary income 117,703 144,591 185,349 157,936 173,347
Net income 77,045 90,566 126,788 112,571 122,087
Net assets 521,277 570,813 669,019 722,390 753,915
Total assets 1,660,821 1,760,078 1,910,597 1,846,176 1,889,995
Net assets per share (yen) 442.67 2,483.01 2,975.02 3,302.86 3,550.03
Net income per share (yen) 65.85 392.87 561.36 511.90 573.14
Operating margin ratio 7.6 9.5 11.5 9.3 9.6
Equity ratio 31.2 32.3 34.9 39.0 39.7
Return of equity 15.3 16.7 20.5 16.2 16.6
Cash flows from operating activities 95,360 218,158 207,020 (71,028) 77,475
Cash flows from investing activities (25,070) 6,296 (11,852) (82,288) 33,260
Cash flows from financing activities (35,171) (60,061) (41,682) (96,197) (66,647)
Number of employees (person) 13,748 13,977 14,032 14,433 14,562
Interest-bearing debt 254,695 238,145 247,379 217,423 208,145
D/E ratio (times) 0.5 0.4 0.4 0.3 0.3
Research & development 10,998 11,164 11,608 12,471 13,564
Depreciation 5,991 6,267 7,049 7,855 9,885
Capital expenditure (Cash basis) 10,221 7,226 9,354 - -
Capital expenditure (Accrual basis) 9,850 8,853 9,133 49,006 20,635
*1
*1
*2
*2

3
Consolidated Financial Information
* Deferred tax assets in current assets has been indicated as investments and other assets from the fiscal year ended 2018.3. Due to the effect of offsetting “deferred tax assets” and “deferred tax liabilities” by the same taxpayer, the total of deferred tax assets decreased by 20,227 million yen.
2.Consolidated balance sheets
(Millions of yen)
2016.3 2017.3 2018.3 2019.3 2020.3
Assets
Current assets
Cash and deposits 374,192 535,592 687,456 467,750 482,722
Notes receivable-trade and accounts receivable from completed construction contracts 443,635 420,131 441,630 542,009 615,037
Costs on uncompleted construction contracts 84,548 67,053 50,094 42,472 54,856
Real estate for sale and development projects in progress 107,771 102,742 86,207 96,749 105,487
Other inventories 4,008 3,462 2,757 3,804 3,096
Deferred tax assets 28,071 28,046 - - -
Other 70,429 66,842 59,514 47,772 37,988
Allowance for doubtful accounts (353) (297) (173) (121) (166)
Total current assets 1,112,304 1,223,572 1,327,486 1,200,436 1,299,022
Noncurrent assets
Property, plant and equipment
Buildings and structures 124,110 123,478 136,975 152,138 146,673
Machinery, vehicles, tools and fixtures 53,813 55,070 56,172 60,379 60,616
Land 121,155 119,825 119,963 135,938 120,572
Construction in progress 255 921 1,523 1,255 684
Accumulated depreciation (121,806) (123,314) (126,237) (129,966) (124,147)
Total property, plant and equipment 177,528 175,982 188,397 219,745 204,400
Intangible assets 4,875 5,084 11,553 13,027 14,288
Investments and other assets
Investment securities 321,320 309,014 337,382 367,626 317,621
Net defined benefit assets 10,944 10,777 9,560 11,387 13,205
Deferred tax assets 627 3,029 6,557 3,914 12,746
Other 36,483 35,082 31,412 31,805 30,219
Allowance for doubtful accounts (3,262) (2,464) (1,753) (1,768) (1,510)
Total investments and other assets 366,113 355,439 383,159 412,965 372,283
Total noncurrent assets 548,516 536,506 583,110 645,739 590,972
Total assets 1,660,821 1,760,078 1,910,597 1,846,176 1,889,995
*
*

4
Consolidated Financial Information
* Deferred tax liabilities in current liabilities has been indicated as noncurrent liabilities from the fiscal year ended 2018.3. Due to the effect of offsetting “deferred tax assets” and “deferred tax liabilities” by the same taxpayer, the total of deferred tax liabilities decreased by 20,227 million yen.
(Millions of yen)
2016.3 2017.3 2018.3 2019.3 2020.3
Liabilities
Current liabilities
Notes payable, accounts payable for construction contracts and other 442,758 424,493 509,576 507,335 491,569
Short-term loans payable 108,981 114,600 87,029 90,951 87,934
Short-term non-recourse loans 100 100 2,950 - 15
Current portion of bonds 10,000 10,000 10,000 - 10,000
Current portion of non-recourse bonds - - 500 - -
Lease obligations 259 269 273 315 240
Income taxes payable 23,633 31,138 30,843 18,981 31,955
Advances received on uncompleted construction contracts 160,172 175,689 148,515 99,745 121,645
Deposits received 120,205 171,132 182,142 155,030 146,539
Provision for warranties for completed construction 3,316 3,391 3,128 3,474 3,605
Provision for loss on construction contracts 22,117 15,666 9,393 2,761 2,269
Provision for loss on order received 43 14 3 - -
Provision for loss on Anti-Monopoly Act - - - 9,129 -
Other 36,190 40,497 38,270 37,065 61,662
Total current liabilities 927,777 986,994 1,022,625 924,791 957,437
Noncurrent liabilities
Bonds payable 40,000 30,000 40,000 40,000 30,000
Non-recourse bonds payable 500 500 - - -
Long-term loans payable 90,564 79,995 106,899 86,472 80,038
Long-term non-recourse loans payable 4,550 2,950 - - 158
Lease obligations 546 482 421 378 410
Deferred tax liabilities 8,262 11,350 1,430 6,199 240
Deferred tax liabilities for land revaluation 4,188 4,184 3,285 3,285 3,280
Provision for directors' retirement benefits 411 431 391 416 436
Provision for loss on business of subsidiaries and affiliates 39 66 40 15 -
Provision for environmental measures 119 89 89 43 1
Provision for loss on Anti-Monopoly Act - 11,035 10,693 - -
Net defined benefit liability 43,926 41,262 35,787 42,021 45,044
Other 18,657 19,921 19,913 20,160 19,030
Total noncurrent liabilities 211,766 202,270 218,951 198,994 178,642
Total liabilities 1,139,544 1,189,264 1,241,577 1,123,785 1,136,080
*
5
Consolidated Financial Information
(Millions of yen)
2016.3 2017.3 2018.3 2019.3 2020.3
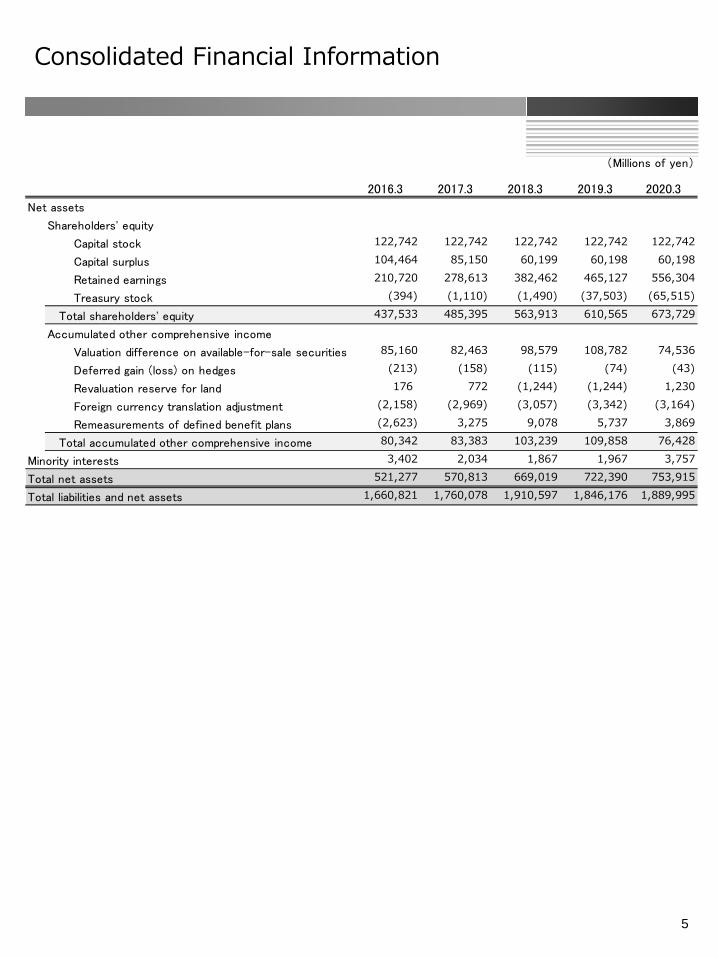
Net assets
Shareholders' equity
Capital stock 122,742 122,742 122,742 122,742 122,742
Capital surplus 104,464 85,150 60,199 60,198 60,198
Retained earnings 210,720 278,613 382,462 465,127 556,304
Treasury stock (394) (1,110) (1,490) (37,503) (65,515)
Total shareholders' equity 437,533 485,395 563,913 610,565 673,729
Accumulated other comprehensive income
Valuation difference on available-for-sale securities 85,160 82,463 98,579 108,782 74,536
Deferred gain (loss) on hedges (213) (158) (115) (74) (43)
Revaluation reserve for land 176 772 (1,244) (1,244) 1,230
Foreign currency translation adjustment (2,158) (2,969) (3,057) (3,342) (3,164)
Remeasurements of defined benefit plans (2,623) 3,275 9,078 5,737 3,869
Total accumulated other comprehensive income 80,342 83,383 103,239 109,858 76,428
Minority interests 3,402 2,034 1,867 1,967 3,757
Total net assets 521,277 570,813 669,019 722,390 753,915
Total liabilities and net assets 1,660,821 1,760,078 1,910,597 1,846,176 1,889,995
6
Consolidated Financial Information
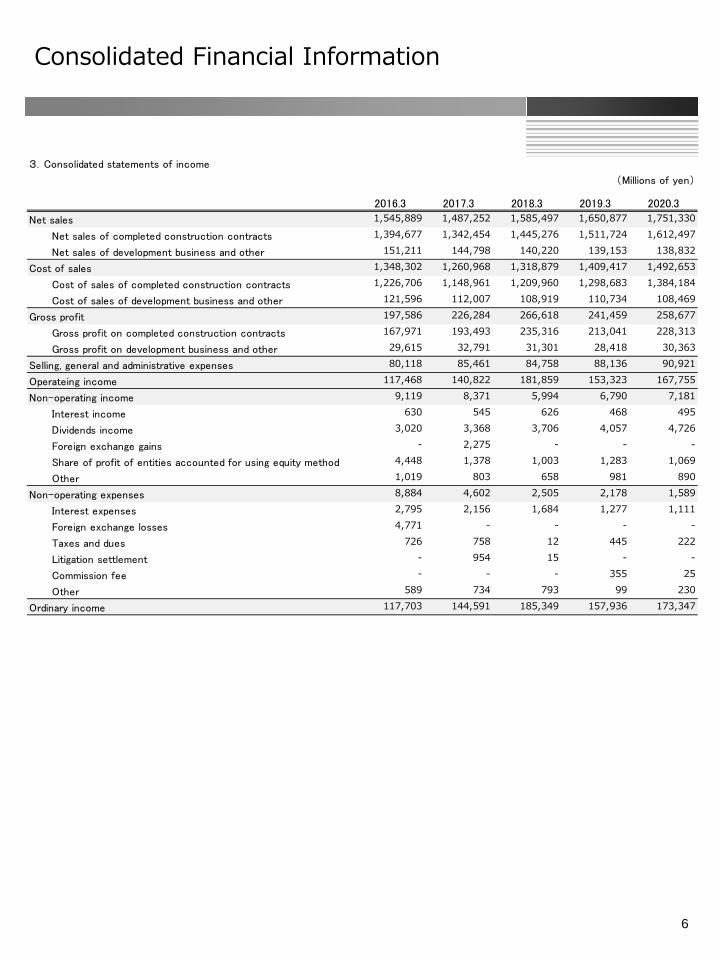
3.Consolidated statements of income
(Millions of yen)
2016.3 2017.3 2018.3 2019.3 2020.3
Net sales 1,545,889 1,487,252 1,585,497 1,650,877 1,751,330
Net sales of completed construction contracts 1,394,677 1,342,454 1,445,276 1,511,724 1,612,497
Net sales of development business and other 151,211 144,798 140,220 139,153 138,832
Cost of sales 1,348,302 1,260,968 1,318,879 1,409,417 1,492,653
Cost of sales of completed construction contracts 1,226,706 1,148,961 1,209,960 1,298,683 1,384,184
Cost of sales of development business and other 121,596 112,007 108,919 110,734 108,469
Gross profit 197,586 226,284 266,618 241,459 258,677
Gross profit on completed construction contracts 167,971 193,493 235,316 213,041 228,313
Gross profit on development business and other 29,615 32,791 31,301 28,418 30,363
Selling, general and administrative expenses 80,118 85,461 84,758 88,136 90,921
Operateing income 117,468 140,822 181,859 153,323 167,755
Non-operating income 9,119 8,371 5,994 6,790 7,181
Interest income 630 545 626 468 495
Dividends income 3,020 3,368 3,706 4,057 4,726
Foreign exchange gains - 2,275 - - -
Share of profit of entities accounted for using equity method 4,448 1,378 1,003 1,283 1,069
Other 1,019 803 658 981 890
Non-operating expenses 8,884 4,602 2,505 2,178 1,589
Interest expenses 2,795 2,156 1,684 1,277 1,111
Foreign exchange losses 4,771 - - - -
Taxes and dues 726 758 12 445 222
Litigation settlement - 954 15 - -
Commission fee - - - 355 25
Other 589 734 793 99 230
Ordinary income 117,703 144,591 185,349 157,936 173,347

7
Consolidated Financial Information
(Millions of yen)
2016.3 2017.3 2018.3 2019.3 2020.3
Extraordinary income 4,303 3,528 1,090 3,722 4,811
Gain on sales of noncurrent assets 119 617 183 1,649 1,186
Gain on sales of investment securities 18 2,878 779 153 496
Gain on return of assets from retirement benefit trust 4,021 - - - -
Reversal of allowance for loss on Anti-Monopoly Act - - 116 1,564 3,043
Other 143 32 11 355 85
Extraordinary loss 4,210 12,929 4,142 881 3,374
Impairment loss 3,018 684 3,631 339 1,337
Loss on retirement of non-current assets - - - 188 78
Loss on valuation of investment securities - - - 91 1,502
Losses on related businesses - - - 167 -
Loss on Anti-Monopoly Act - 11,640 - - -
Other 1,192 604 511 94 456
Income before income taxes and minority interests 117,796 135,189 182,297 160,777 174,785
Income taxes-current 33,332 45,505 51,437 43,594 51,473
Income taxes-deferred 7,663 (712) 4,070 4,481 1,127
Total income taxes 40,995 44,793 55,508 48,075 52,600
Net income - 90,396 126,789 112,701 122,184
Profit (loss) attributable to non-controlling interests (244) (169) 1 129 96
Profit attributable to owners of parent 77,045 90,566 126,788 112,571 122,087
8
Consolidated Financial Information
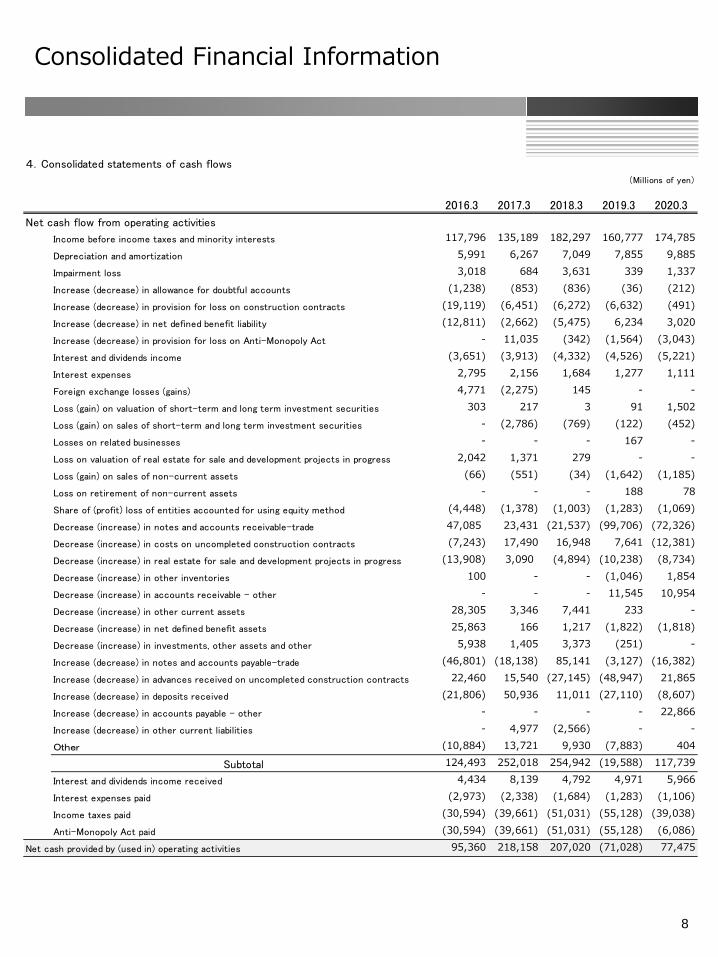
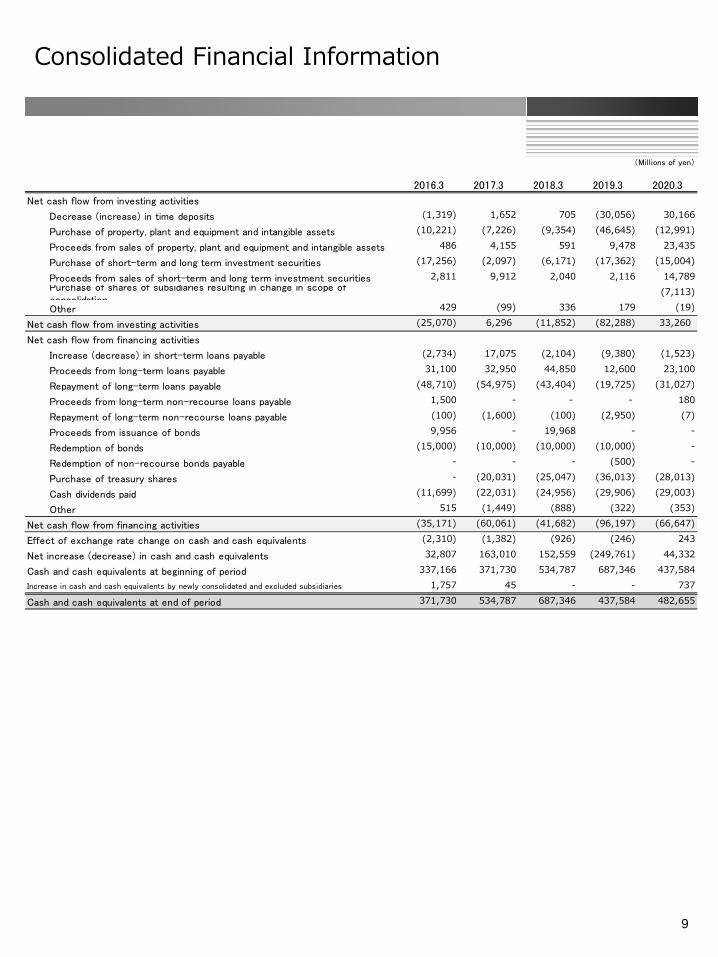
4.Consolidated statements of cash flows
(Millions of yen)
2016.3 2017.3 2018.3 2019.3 2020.3
Net cash flow from operating activities
Income before income taxes and minority interests 117,796 135,189 182,297 160,777 174,785
Depreciation and amortization 5,991 6,267 7,049 7,855 9,885
Impairment loss 3,018 684 3,631 339 1,337
Increase (decrease) in allowance for doubtful accounts (1,238) (853) (836) (36) (212)
Increase (decrease) in provision for loss on construction contracts (19,119) (6,451) (6,272) (6,632) (491)
Increase (decrease) in net defined benefit liability (12,811) (2,662) (5,475) 6,234 3,020
Increase (decrease) in provision for loss on Anti-Monopoly Act - 11,035 (342) (1,564) (3,043)
Interest and dividends income (3,651) (3,913) (4,332) (4,526) (5,221)
Interest expenses 2,795 2,156 1,684 1,277 1,111
Foreign exchange losses (gains) 4,771 (2,275) 145 - -
Loss (gain) on valuation of short-term and long term investment securities 303 217 3 91 1,502
Loss (gain) on sales of short-term and long term investment securities - (2,786) (769) (122) (452)
Losses on related businesses - - - 167 -
Loss on valuation of real estate for sale and development projects in progress 2,042 1,371 279 - -
Loss (gain) on sales of non-current assets (66) (551) (34) (1,642) (1,185)
Loss on retirement of non-current assets - - - 188 78
Share of (profit) loss of entities accounted for using equity method (4,448) (1,378) (1,003) (1,283) (1,069)
Decrease (increase) in notes and accounts receivable-trade 47,085 23,431 (21,537) (99,706) (72,326)
Decrease (increase) in costs on uncompleted construction contracts (7,243) 17,490 16,948 7,641 (12,381)
Decrease (increase) in real estate for sale and development projects in progress (13,908) 3,090 (4,894) (10,238) (8,734)
Decrease (increase) in other inventories 100 - - (1,046) 1,854
Decrease (increase) in accounts receivable - other - - - 11,545 10,954
Decrease (increase) in other current assets 28,305 3,346 7,441 233 -
Decrease (increase) in net defined benefit assets 25,863 166 1,217 (1,822) (1,818)
Decrease (increase) in investments, other assets and other 5,938 1,405 3,373 (251) -
Increase (decrease) in notes and accounts payable-trade (46,801) (18,138) 85,141 (3,127) (16,382)
Increase (decrease) in advances received on uncompleted construction contracts 22,460 15,540 (27,145) (48,947) 21,865
Increase (decrease) in deposits received (21,806) 50,936 11,011 (27,110) (8,607)
Increase (decrease) in accounts payable - other - - - - 22,866
Increase (decrease) in other current liabilities - 4,977 (2,566) - -
Other (10,884) 13,721 9,930 (7,883) 404
Subtotal 124,493 252,018 254,942 (19,588) 117,739
Interest and dividends income received 4,434 8,139 4,792 4,971 5,966
Interest expenses paid (2,973) (2,338) (1,684) (1,283) (1,106)
Income taxes paid (30,594) (39,661) (51,031) (55,128) (39,038)
Anti-Monopoly Act paid (30,594) (39,661) (51,031) (55,128) (6,086)
Net cash provided by (used in) operating activities 95,360 218,158 207,020 (71,028) 77,475
9
Consolidated Financial Information
(Millions of yen)
2016.3 2017.3 2018.3 2019.3 2020.3
Net cash flow from investing activities
Decrease (increase) in time deposits (1,319) 1,652 705 (30,056) 30,166
Purchase of property, plant and equipment and intangible assets (10,221) (7,226) (9,354) (46,645) (12,991)
Proceeds from sales of property, plant and equipment and intangible assets 486 4,155 591 9,478 23,435
Purchase of short-term and long term investment securities (17,256) (2,097) (6,171) (17,362) (15,004)
Proceeds from sales of short-term and long term investment securities 2,811 9,912 2,040 2,116 14,789Purchase of shares of subsidiaries resulting in change in scope ofconsolidation
(7,113)
Other 429 (99) 336 179 (19)
Net cash flow from investing activities (25,070) 6,296 (11,852) (82,288) 33,260
Net cash flow from financing activities
Increase (decrease) in short-term loans payable (2,734) 17,075 (2,104) (9,380) (1,523)
Proceeds from long-term loans payable 31,100 32,950 44,850 12,600 23,100
Repayment of long-term loans payable (48,710) (54,975) (43,404) (19,725) (31,027)
Proceeds from long-term non-recourse loans payable 1,500 - - - 180
Repayment of long-term non-recourse loans payable (100) (1,600) (100) (2,950) (7)
Proceeds from issuance of bonds 9,956 - 19,968 - -
Redemption of bonds (15,000) (10,000) (10,000) (10,000) -
Redemption of non-recourse bonds payable - - - (500) -
Purchase of treasury shares - (20,031) (25,047) (36,013) (28,013)
Cash dividends paid (11,699) (22,031) (24,956) (29,906) (29,003)
Other 515 (1,449) (888) (322) (353)
Net cash flow from financing activities (35,171) (60,061) (41,682) (96,197) (66,647)
Effect of exchange rate change on cash and cash equivalents (2,310) (1,382) (926) (246) 243
Net increase (decrease) in cash and cash equivalents 32,807 163,010 152,559 (249,761) 44,332
Cash and cash equivalents at beginning of period 337,166 371,730 534,787 687,346 437,584Increase in cash and cash equivalents by newly consolidated and excluded subsidiaries 1,757 45 - - 737
Cash and cash equivalents at end of period 371,730 534,787 687,346 437,584 482,655
10
Consolidated Financial Information
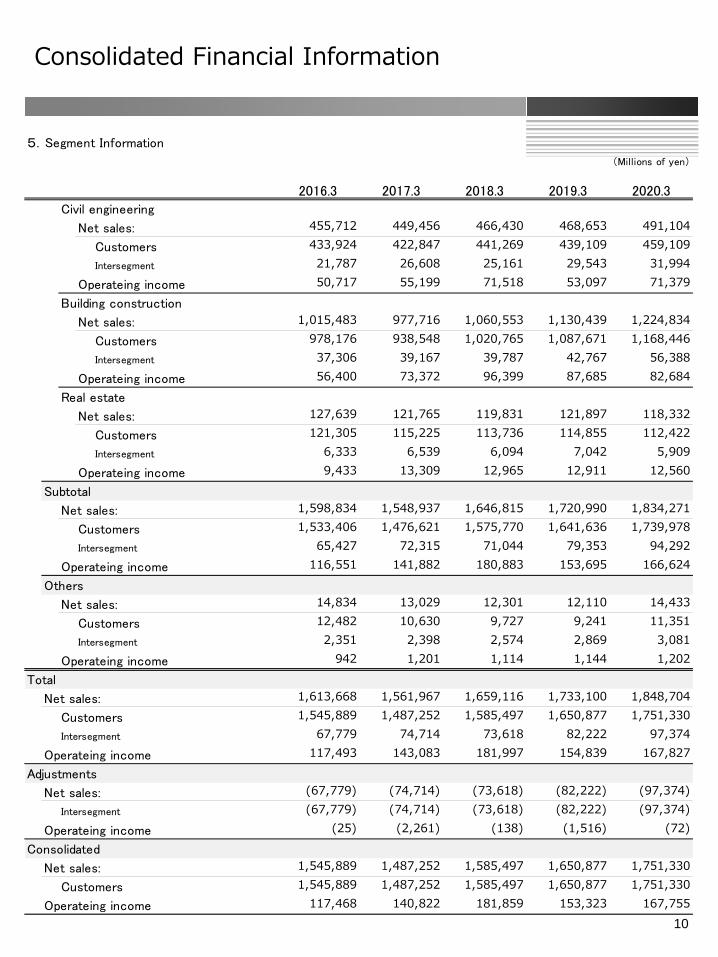
5.Segment Information
(Millions of yen)
2016.3 2017.3 2018.3 2019.3 2020.3
Civil engineering
Net sales: 455,712 449,456 466,430 468,653 491,104
Customers 433,924 422,847 441,269 439,109 459,109Intersegment 21,787 26,608 25,161 29,543 31,994
Operateing income 50,717 55,199 71,518 53,097 71,379
Building construction
Net sales: 1,015,483 977,716 1,060,553 1,130,439 1,224,834
Customers 978,176 938,548 1,020,765 1,087,671 1,168,446Intersegment 37,306 39,167 39,787 42,767 56,388
Operateing income 56,400 73,372 96,399 87,685 82,684
Real estate
Net sales: 127,639 121,765 119,831 121,897 118,332
Customers 121,305 115,225 113,736 114,855 112,422Intersegment 6,333 6,539 6,094 7,042 5,909
Operateing income 9,433 13,309 12,965 12,911 12,560
Subtotal
Net sales: 1,598,834 1,548,937 1,646,815 1,720,990 1,834,271
Customers 1,533,406 1,476,621 1,575,770 1,641,636 1,739,978Intersegment 65,427 72,315 71,044 79,353 94,292
Operateing income 116,551 141,882 180,883 153,695 166,624
Others
Net sales: 14,834 13,029 12,301 12,110 14,433
Customers 12,482 10,630 9,727 9,241 11,351Intersegment 2,351 2,398 2,574 2,869 3,081
Operateing income 942 1,201 1,114 1,144 1,202
Total
Net sales: 1,613,668 1,561,967 1,659,116 1,733,100 1,848,704
Customers 1,545,889 1,487,252 1,585,497 1,650,877 1,751,330Intersegment 67,779 74,714 73,618 82,222 97,374
Operateing income 117,493 143,083 181,997 154,839 167,827
Adjustments
Net sales: (67,779) (74,714) (73,618) (82,222) (97,374)Intersegment (67,779) (74,714) (73,618) (82,222) (97,374)
Operateing income (25) (2,261) (138) (1,516) (72)
Consolidated
Net sales: 1,545,889 1,487,252 1,585,497 1,650,877 1,751,330
Customers 1,545,889 1,487,252 1,585,497 1,650,877 1,751,330
Operateing income 117,468 140,822 181,859 153,323 167,755

11
Non-consolidated Financial Information
*1 The Company conducted 1-for-5 consolidation of shares on October 1, 2017. Therefore, net assets per share and net income per share for the fiscal year ended 2017.3 reflects the impact of the consolidation of shares.
*2 The amount of dividends per share for the fiscal year ended 2018.3 is the total of the amount of interim-end dividends per share of ¥10 carried out before consolidation of shares presented above and the amount of year-end dividend of ¥75 reflects the impact on consolidation of shares.
*3 Because of “Partial Amendments to Accounting Standard for Tax Effect Accounting, etc.” (Statement No.28, February 16, 2018) applied from the beginning of the fiscal year ended 2019.3, total assets and equity ratio for the fiscal year ended 2018.3 is index after retrospectively applying the accounting standards.
6.Non-consolidated financial summary
(Millions of yen、%)
2016.3 2017.3 2018.3 2019.3 2020.3
Amount of order received 1,351,810 1,348,221 1,417,554 1,336,596 1,339,685
Net sales 1,221,932 1,176,711 1,273,316 1,328,425 1,409,523
Operating income 94,470 118,632 157,645 133,769 141,598
Ordinary income 91,778 126,638 161,134 137,817 146,553
Net income 59,202 91,087 112,125 96,102 100,195
Paid-in capital 122,742 122,742 122,742 122,742 122,742
Number of shares outstanding(1000stocks) 1,171,269 1,146,753 224,541 224,541 224,541
Net assets 436,838 483,064 560,921 601,523 611,144
Total assets 1,413,943 1,518,693 1,678,085 1,613,082 1,669,936
Net assets per share (yen) 373.40 2,108.82 2,501.31 2,757.75 2,892.16
Dividends per share(yen/full year) 16.00 20.00 85.00 130.00 130.00
Net income per share (yen) 50.60 395.13 496.44 437.01 470.37
Operating margin ratio 7.7 10.1 12.4 10.1 10.0
Equity ratio 30.9 31.8 33.4 37.3 36.6
Return of equity 13.9 19.8 21.5 16.5 16.5
Price earning ratio(times) 14.7 10.3 10.9 11.8 7.0
Dividends payout ratio 31.6 25.3 25.2 29.7 27.6
Number of employees(person) 8,072 8,415 8,501 8,490 8,507
Interest-bearing debt 178,095 164,975 174,308 159,403 162,953
*1
*1
*3
*2
*3

12
Non-consolidated Financial Information
* Deferred tax assets in current assets has been indicated as investments and other assets from the fiscal year ended 2018.3. Due to the effect of offsetting “deferred tax assets” and “deferred tax liabilities” by the same taxpayer, the total of deferred tax assets decreased by 21,920 million yen.
7.Non-consolidated balance sheets
(Millions of yen)
2016.3 2017.3 2018.3 2019.3 2020.3
Assets
Current assets
Cash and deposits 322,199 486,206 639,063 426,771 448,378
Notes receivable-trade 7,554 19,771 7,983 7,261 15,675
Accounts receivable from completed construction contracts 367,089 329,705 368,412 454,972 513,402
Real estate for sale 51,484 43,260 19,777 20,582 25,391
Costs on uncompleted construction contracts 79,363 61,994 45,070 41,306 51,778
Development projects in progress 2,267 4,764 4,236 8,218 10,356
Deferred tax assets 24,991 25,001 - - -
Accounts receivable 59,801 - - - -
Other 9,338 64,668 57,263 47,568 38,617
Allowance for doubtful accounts (164) (170) (131) (99) (121)
Total current assets 923,926 1,035,202 1,141,676 1,006,582 1,103,479
Noncurrent assets
Property, plant and equipment
Buildings 52,732 53,712 68,934 84,940 88,389
Structures 2,673 2,672 2,978 3,399 3,516
Machinery and equipment 8,316 9,038 9,425 9,976 10,123
Vehicles 372 341 645 965 1,143
Tools, furniture and fixtures 7,887 7,999 8,292 8,456 8,508
Land 67,287 67,954 74,610 97,037 97,087
Construction in progress 143 799 1,357 1,012 404
Accumulated depreciation (49,300) (50,487) (53,416) (55,566) (58,009)
Total property, plant and equipment 90,111 92,029 112,825 150,219 151,161
Intangible assets 2,186 2,406 9,334 10,097 10,096
Investments and other assets
Investment securities 285,676 277,849 305,114 335,845 279,472
Stocks of subsidiaries and affiliates 77,885 78,255 77,790 78,236 87,220
Investments in other securities of subsidiaries and affiliates 6,391 6,364 7,900 8,562 15,427 Current portion of long-term loans receivable from subsidiaries and affiliates 8,697 8,993 9,025 9,594 10,158
Claims provable in bankruptcy, claims provable in rehabilitation and other 75 67 60 - -
Long-term prepaid expenses 434 397 267 198 289
Prepaid pension cost - - - - 1,082
Other 28,221 26,283 22,903 23,039 21,085
Allowance for doubtful accounts (9,662) (9,156) (8,813) (9,293) (9,537)
Total investments and other assets 397,719 389,055 414,248 446,182 405,198
Total noncurrent assets 490,017 483,491 536,409 606,500 566,456
Total assets 1,413,943 1,518,693 1,678,085 1,613,082 1,669,936
*

13
Non-consolidated Financial Information
* Deferred tax liabilities in current liabilities has been indicated as noncurrent liabilities from the fiscal year ended 2018.3. Due to the effect of offsetting “deferred tax assets” and “deferred tax liabilities” by the same taxpayer, the total of deferred tax liabilities decreased by 21,920 million yen.
(Millions of yen)
2016.3 2017.3 2018.3 2019.3 2020.3
Liabilities
Current liabilities
Notes payable-trade 87,528 84,936 25,117 14,788 10,302
Electronically recorded obligations-operating - - 89,488 85,777 61,777
Accounts payable for construction contracts 293,948 283,917 337,861 363,599 369,754
Short-term loans payable 64,505 70,261 53,700 65,965 66,678
Current portion of bonds 10,000 10,000 10,000 - 10,000
Lease obligations 178 199 197 245 170
Income taxes payable 21,490 28,833 29,084 16,282 29,009
Advances received on uncompleted construction contracts 149,157 166,471 136,271 90,358 110,986
Deposits received 155,192 210,814 248,156 204,813 226,429
Provision for warranties for completed construction 2,384 1,727 1,867 2,584 2,761
Provision for loss on construction contracts 21,347 14,968 8,558 1,815 2,039
Other 23,777 29,741 28,485 25,256 50,074
Total current liabilities 829,511 901,870 968,788 871,486 939,984
Noncurrent liabilities
Bonds payable 40,000 30,000 40,000 40,000 30,000
Long-term loans payable 63,590 54,714 70,608 53,438 56,274
Lease obligations 402 357 277 253 297
Provision for retirement benefits 14,845 20,865 25,057 24,870 24,461
Deferred tax liabilities 22,239 20,575 4,626 13,688 171
Provision for loss on business of subsidiaries and affiliates 1,225 1,139 1,010 819 476
Provision for environmental measures 105 70 30 - -
Other 5,186 6,036 6,762 7,002 7,126
Total noncurrent liabilities 147,593 133,758 148,374 140,072 118,807
Total liabilities 977,105 1,035,629 1,117,163 1,011,559 1,058,791
*

14
Non-consolidated Financial Information
(Millions of yen)
2016.3 2017.3 2018.3 2019.3 2020.3
Net assets
Shareholders' equity
Capital stock 122,742 122,742 122,742 122,742 122,742
Total capital surpluses 104,482 85,167 60,502 60,502 60,502
Legal capital surplus 66,832 30,686 30,686 30,686 30,686
Other capital surplus 37,650 54,481 29,816 29,816 29,816
Retained earnings
Other retained earnings
Reserve for advanced depreciation of noncurrent assets 1,414 1,414 1,414 1,414 1,414
General reserve 62,500 94,500 158,500 231,500 270,500
Retained earnings brought forward 63,193 100,249 123,417 116,613 148,805
Total retained earnings 127,107 196,163 283,331 349,527 420,719
Treasury stock (394) (1,110) (1,490) (37,503) (65,515)
Total shareholders' equity 353,937 402,962 465,086 495,268 538,448
Valuation and translation adjustments
Valuation difference on available-for-sale securities 82,900 80,101 95,842 106,253 72,694
Deferred gain (loss) on hedges - (0) (6) - 1
Total valuation and translation adjustments 82,900 80,101 95,835 106,254 72,695
Total net assets 436,838 483,064 560,921 601,523 611,144
Total liabilities and net assets 1,413,943 1,518,693 1,678,085 1,613,082 1,669,936
15
Non-consolidated Financial Information
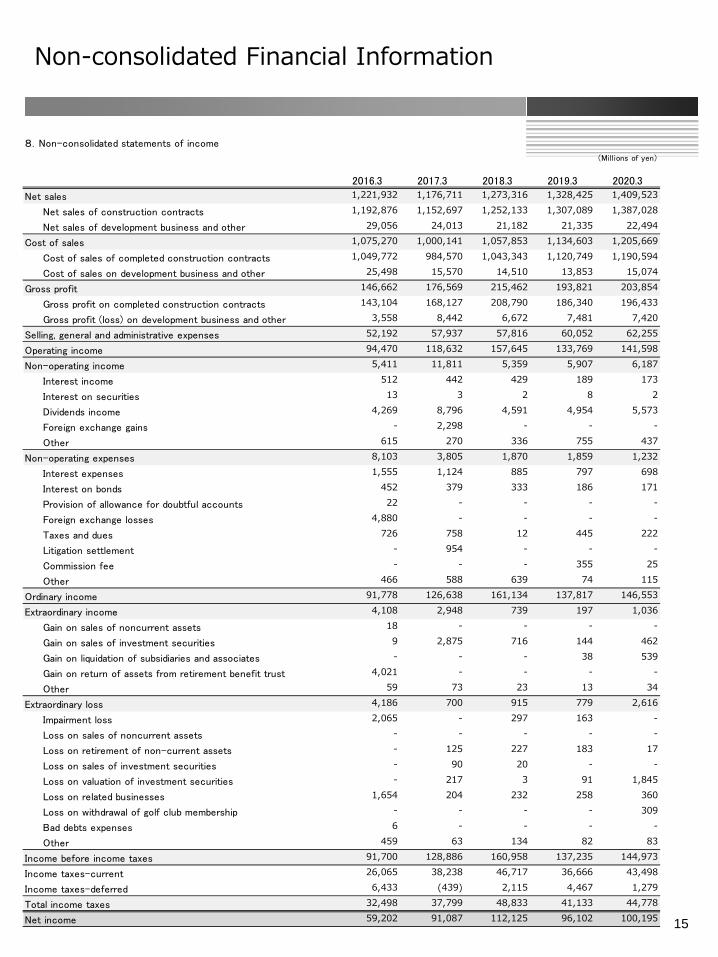
8.Non-consolidated statements of income
(Millions of yen)
2016.3 2017.3 2018.3 2019.3 2020.3
Net sales 1,221,932 1,176,711 1,273,316 1,328,425 1,409,523
Net sales of construction contracts 1,192,876 1,152,697 1,252,133 1,307,089 1,387,028
Net sales of development business and other 29,056 24,013 21,182 21,335 22,494
Cost of sales 1,075,270 1,000,141 1,057,853 1,134,603 1,205,669
Cost of sales of completed construction contracts 1,049,772 984,570 1,043,343 1,120,749 1,190,594
Cost of sales on development business and other 25,498 15,570 14,510 13,853 15,074
Gross profit 146,662 176,569 215,462 193,821 203,854
Gross profit on completed construction contracts 143,104 168,127 208,790 186,340 196,433
Gross profit (loss) on development business and other 3,558 8,442 6,672 7,481 7,420
Selling, general and administrative expenses 52,192 57,937 57,816 60,052 62,255
Operating income 94,470 118,632 157,645 133,769 141,598
Non-operating income 5,411 11,811 5,359 5,907 6,187
Interest income 512 442 429 189 173
Interest on securities 13 3 2 8 2
Dividends income 4,269 8,796 4,591 4,954 5,573
Foreign exchange gains - 2,298 - - -
Other 615 270 336 755 437
Non-operating expenses 8,103 3,805 1,870 1,859 1,232
Interest expenses 1,555 1,124 885 797 698
Interest on bonds 452 379 333 186 171
Provision of allowance for doubtful accounts 22 - - - -
Foreign exchange losses 4,880 - - - -
Taxes and dues 726 758 12 445 222
Litigation settlement - 954 - - -
Commission fee - - - 355 25
Other 466 588 639 74 115
Ordinary income 91,778 126,638 161,134 137,817 146,553
Extraordinary income 4,108 2,948 739 197 1,036
Gain on sales of noncurrent assets 18 - - - -
Gain on sales of investment securities 9 2,875 716 144 462
Gain on liquidation of subsidiaries and associates - - - 38 539
Gain on return of assets from retirement benefit trust 4,021 - - - -
Other 59 73 23 13 34
Extraordinary loss 4,186 700 915 779 2,616
Impairment loss 2,065 - 297 163 -
Loss on sales of noncurrent assets - - - - -
Loss on retirement of non-current assets - 125 227 183 17
Loss on sales of investment securities - 90 20 - -
Loss on valuation of investment securities - 217 3 91 1,845
Loss on related businesses 1,654 204 232 258 360
Loss on withdrawal of golf club membership - - - - 309
Bad debts expenses 6 - - - -
Other 459 63 134 82 83
Income before income taxes 91,700 128,886 160,958 137,235 144,973
Income taxes-current 26,065 38,238 46,717 36,666 43,498
Income taxes-deferred 6,433 (439) 2,115 4,467 1,279
Total income taxes 32,498 37,799 48,833 41,133 44,778
Net income 59,202 91,087 112,125 96,102 100,195

16
Non-consolidated Financial Information
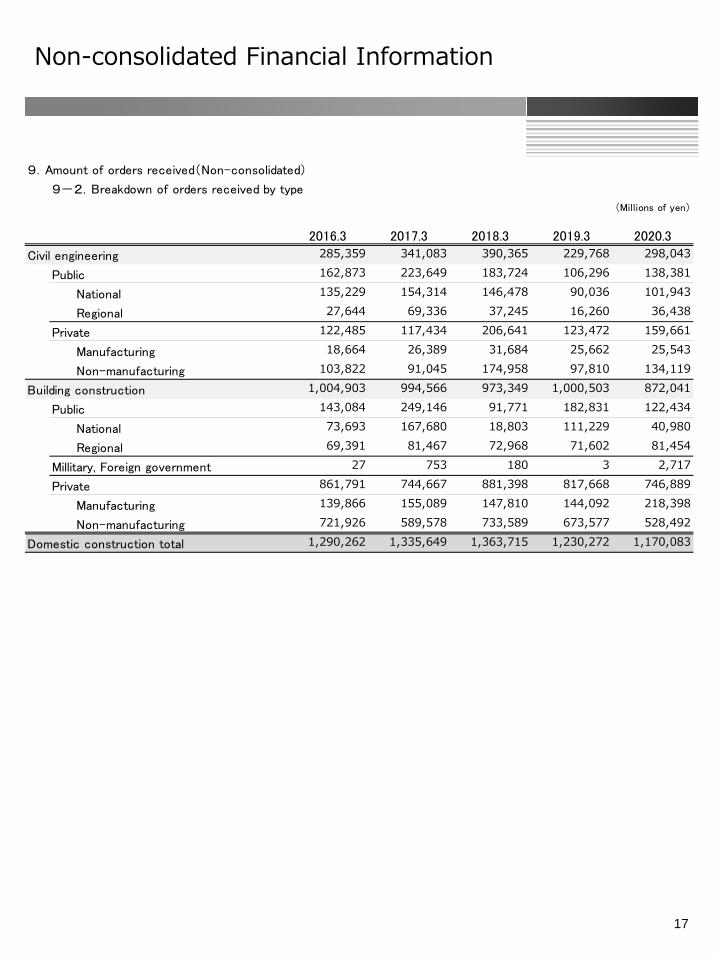
9.Amount of orders received(Non-consolidated)
9-1.Amount of orders received
(Millions of yen)
2016.3 2017.3 2018.3 2019.3 2020.3
Construction
Civil engineering 323,881 315,291 391,534 271,892 301,710
Domestic public 162,873 223,649 183,724 106,296 138,381
Domestic private 122,485 117,434 206,641 123,472 159,661
Domestic total 285,359 341,083 390,365 229,768 298,043
Overseas 38,522 (25,791) 1,168 42,123 3,667
Building construction 1,006,974 1,008,847 1,004,938 1,033,442 1,012,479
Domestic public 143,084 249,146 91,771 182,831 122,434
Domestic private 861,818 745,419 881,578 817,671 749,606
Domestic total 1,004,903 994,566 973,349 1,000,503 872,041
Overseas 2,071 14,281 31,588 32,939 140,438
Construction total 1,330,856 1,324,139 1,396,472 1,305,334 1,314,189
Domestic public 305,957 472,796 275,495 289,127 260,815
Domestic private 984,304 862,853 1,088,220 941,144 909,268
Domestic total 1,290,262 1,335,649 1,363,715 1,230,272 1,170,083
Overseas 40,594 (11,510) 32,757 75,062 144,106
Real estate 8,894 13,886 11,579 21,910 16,226
Other 12,059 10,195 9,502 9,352 9,268
Total 1,351,810 1,348,221 1,417,554 1,336,596 1,339,685
17
Non-consolidated Financial Information
9.Amount of orders received(Non-consolidated)
9-2.Breakdown of orders received by type
(Millions of yen)
2016.3 2017.3 2018.3 2019.3 2020.3
Civil engineering 285,359 341,083 390,365 229,768 298,043
Public 162,873 223,649 183,724 106,296 138,381
National 135,229 154,314 146,478 90,036 101,943
Regional 27,644 69,336 37,245 16,260 36,438
Private 122,485 117,434 206,641 123,472 159,661
Manufacturing 18,664 26,389 31,684 25,662 25,543
Non-manufacturing 103,822 91,045 174,958 97,810 134,119
Building construction 1,004,903 994,566 973,349 1,000,503 872,041
Public 143,084 249,146 91,771 182,831 122,434
National 73,693 167,680 18,803 111,229 40,980
Regional 69,391 81,467 72,968 71,602 81,454
Millitary, Foreign government 27 753 180 3 2,717
Private 861,791 744,667 881,398 817,668 746,889
Manufacturing 139,866 155,089 147,810 144,092 218,398
Non-manufacturing 721,926 589,578 733,589 673,577 528,492
Domestic construction total 1,290,262 1,335,649 1,363,715 1,230,272 1,170,083

18
Non-consolidated Financial Information
9.Amount of orders received(Non-consolidated)
9-3.Breakdown of orders received by type of construction
(Millions of yen)
2016.3 2017.3 2018.3 2019.3 2020.3
Civil engineering 285,359 341,083 390,365 229,768 298,043
Flood preventation 25,547 53,246 22,514 26,004 60,300
Railroad 37,073 23,237 87,280 47,483 53,785
Water supply 5,724 13,976 21,015 1,830 6,025
Land development 13,310 5,835 18,477 31,933 13,299
Port development 5,914 6,809 12,072 7,191 7,114
Road 80,712 93,114 86,645 60,414 81,496
Electirc power line 6,683 3,554 5,059 1,909 7,273
Others 110,396 141,312 137,303 53,006 68,751
Building construction 1,004,903 994,566 973,349 1,000,503 872,041
Office 417,252 276,587 322,521 401,991 247,428
Accomodation 3,130 97,047 62,813 47,433 45,230
Shop 56,670 69,675 42,855 47,651 30,232
Factory&Power plant 126,950 147,049 149,660 123,802 167,546
Warehouse 50,958 28,622 70,209 49,902 34,445
Housing 55,912 69,075 40,216 20,227 95,611
Educational facility 79,551 35,724 26,112 113,189 71,211
Medical&Welfare 101,639 26,426 19,921 63,124 21,114
Amusement 35,572 165,204 67,148 46,073 64,103
Others 77,269 79,157 171,896 87,111 95,122
Domestic construction total 1,290,262 1,335,649 1,363,715 1,230,272 1,170,083
19
Non-consolidated Financial Information
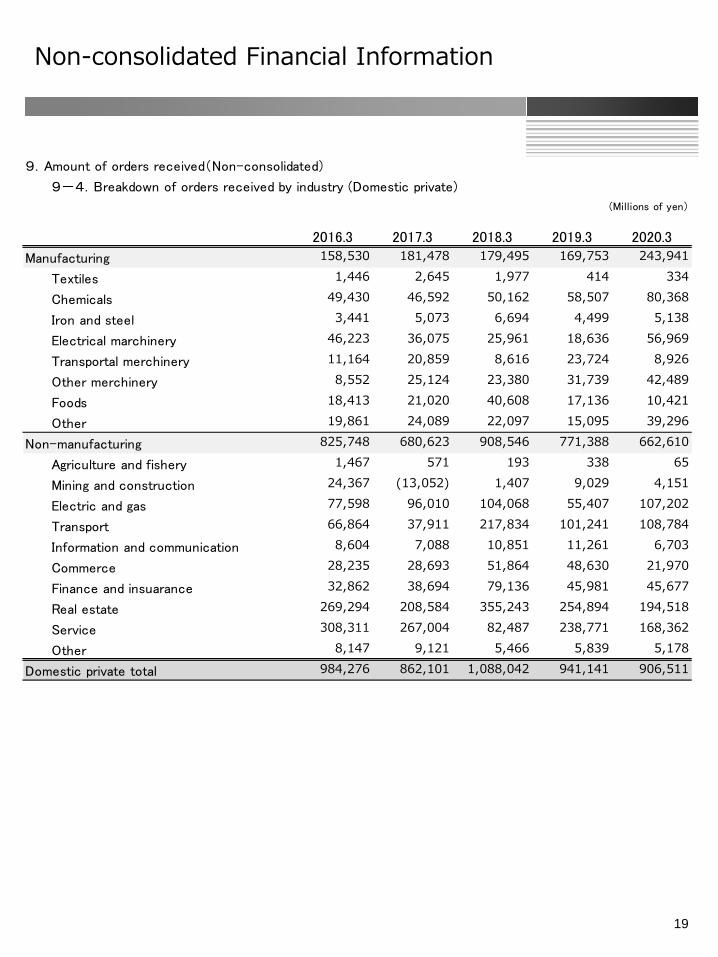
9.Amount of orders received(Non-consolidated)
9-4.Breakdown of orders received by industry (Domestic private)
(Millions of yen)
2016.3 2017.3 2018.3 2019.3 2020.3
Manufacturing 158,530 181,478 179,495 169,753 243,941
Textiles 1,446 2,645 1,977 414 334
Chemicals 49,430 46,592 50,162 58,507 80,368
Iron and steel 3,441 5,073 6,694 4,499 5,138
Electrical marchinery 46,223 36,075 25,961 18,636 56,969
Transportal merchinery 11,164 20,859 8,616 23,724 8,926
Other merchinery 8,552 25,124 23,380 31,739 42,489
Foods 18,413 21,020 40,608 17,136 10,421
Other 19,861 24,089 22,097 15,095 39,296
Non-manufacturing 825,748 680,623 908,546 771,388 662,610
Agriculture and fishery 1,467 571 193 338 65
Mining and construction 24,367 (13,052) 1,407 9,029 4,151
Electric and gas 77,598 96,010 104,068 55,407 107,202
Transport 66,864 37,911 217,834 101,241 108,784
Information and communication 8,604 7,088 10,851 11,261 6,703
Commerce 28,235 28,693 51,864 48,630 21,970
Finance and insuarance 32,862 38,694 79,136 45,981 45,677
Real estate 269,294 208,584 355,243 254,894 194,518
Service 308,311 267,004 82,487 238,771 168,362
Other 8,147 9,121 5,466 5,839 5,178
Domestic private total 984,276 862,101 1,088,042 941,141 906,511
20
Non-consolidated Financial Information
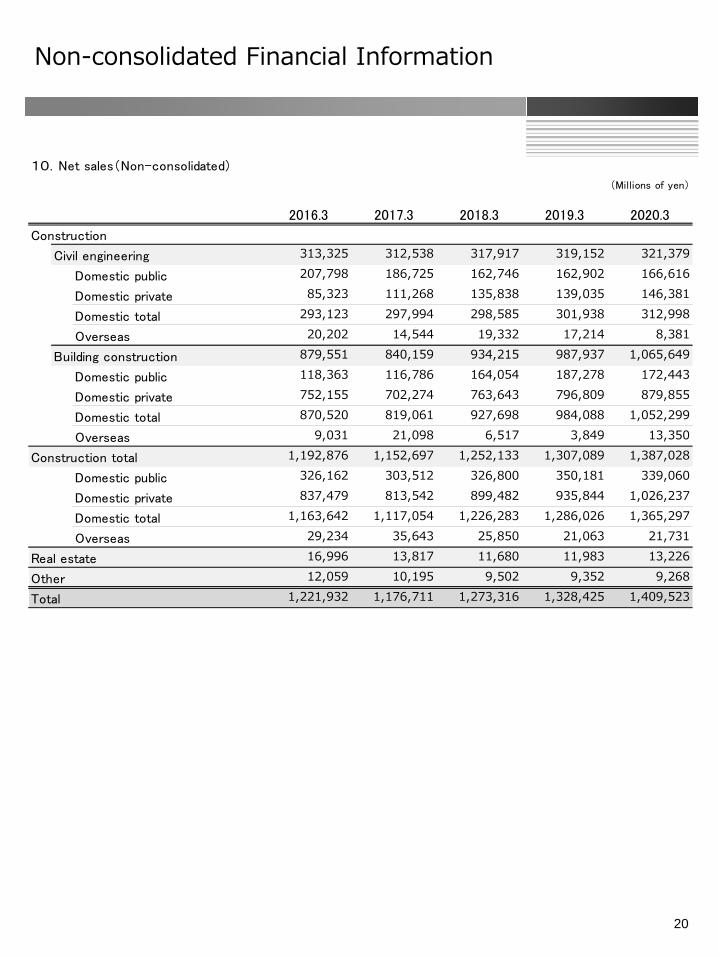
10.Net sales(Non-consolidated)
(Millions of yen)
2016.3 2017.3 2018.3 2019.3 2020.3
Construction
Civil engineering 313,325 312,538 317,917 319,152 321,379
Domestic public 207,798 186,725 162,746 162,902 166,616
Domestic private 85,323 111,268 135,838 139,035 146,381
Domestic total 293,123 297,994 298,585 301,938 312,998
Overseas 20,202 14,544 19,332 17,214 8,381
Building construction 879,551 840,159 934,215 987,937 1,065,649
Domestic public 118,363 116,786 164,054 187,278 172,443
Domestic private 752,155 702,274 763,643 796,809 879,855
Domestic total 870,520 819,061 927,698 984,088 1,052,299
Overseas 9,031 21,098 6,517 3,849 13,350
Construction total 1,192,876 1,152,697 1,252,133 1,307,089 1,387,028
Domestic public 326,162 303,512 326,800 350,181 339,060
Domestic private 837,479 813,542 899,482 935,844 1,026,237
Domestic total 1,163,642 1,117,054 1,226,283 1,286,026 1,365,297
Overseas 29,234 35,643 25,850 21,063 21,731
Real estate 16,996 13,817 11,680 11,983 13,226
Other 12,059 10,195 9,502 9,352 9,268
Total 1,221,932 1,176,711 1,273,316 1,328,425 1,409,523

21
Non-consolidated Financial Information
11.Balance carried forward(Non-consolidated)
(Millions of yen)
2016.3 2017.3 2018.3 2019.3 2020.3
Construction
Civil engineering 610,002 612,755 686,372 639,112 619,443
Domestic public 308,042 344,966 365,944 309,337 281,101
Domestic private 216,874 223,040 293,843 278,281 291,560
Domestic total 524,917 568,006 659,788 587,619 572,663
Overseas 85,085 44,749 26,584 51,493 46,780
Building construction 1,356,907 1,525,596 1,596,318 1,641,823 1,588,653
Domestic public 277,995 410,355 338,072 333,625 283,616
Domestic private 1,069,206 1,112,351 1,230,286 1,251,148 1,120,899
Domestic total 1,347,202 1,522,707 1,568,359 1,584,774 1,404,515
Overseas 9,705 2,889 27,959 57,049 184,138
Construction total 1,966,910 2,138,352 2,282,691 2,280,935 2,208,097
Domestic public 586,038 755,321 704,017 642,963 564,718
Domestic private 1,286,081 1,335,392 1,524,130 1,529,429 1,412,460
Domestic total 1,872,119 2,090,714 2,228,147 2,172,392 1,977,179
Overseas 94,791 47,638 54,544 108,543 230,918
Real estate 297 366 265 10,192 13,192
Total 1,967,208 2,138,718 2,282,956 2,291,127 2,221,289

22
Non-consolidated Financial Information
12.Gross margin ratio(Non-consolidated)
(%)
2016.3 2017.3 2018.3 2019.3 2020.3
Construction 7.5 12.0 14.6 16.7 14.2
Civil engineering 10.3 16.3 18.9 23.7 23.5
Building construction 6.4 10.5 13.0 14.3 11.3
Real estate 23.4 13.9 50.6 45.0 43.5
Other 5.4 10.0 14.3 14.8 18.0
Gross margin ratio 7.8 12.0 15.0 16.9 14.5