Databases Food CompositionThe Different Uses of · databases The table opposite outlines the...
48
Synthesis report No 2: The Different Uses of Food Composition Databases By Claire Williamson British Nutrition Foundation This work was completed on behalf of the European Food Information Resource (EuroFIR) Consortium and funded under the EU 6th Framework Food Quality and Safety thematic priority. Contract FOOD-CT- 2005-513944.
Transcript of Databases Food CompositionThe Different Uses of · databases The table opposite outlines the...
© European Food Information Resource Consortium (EuroFIR) 2006.
No part of this publication may be reproduced without prior written
permission from the EuroFIR Project Management Office,
Institute of Food Research, Norwich Research Park,
Norwich, Norfolk, NR4 7UA, UK.
Synthesis report No 2:
The Different Uses ofFood Composition
DatabasesBy Claire Williamson
British Nutrition Foundation
This work was
completed on behalf
of the European
Food Information
Resource (EuroFIR)
Consortium and
funded under the
EU 6th Framework
Food Quality
and Safety
thematic priority.
Contract FOOD-CT-
2005-513944.

Acknowledgements
The author would like to thank colleagues from the EuroFIR consortium who havekindly helped review the text for this report, including Paul Finglas (Institute of FoodResearch), Dr Monique Raats, Anja Fragodt and Dr Bernadette Egan (University ofSurrey), Susan Church and colleagues from the British Nutrition Foundation.
The images appearing on pages 10, 26, 33, 35 and 38 are copyright of the BritishNutrition Foundation.

Synthesis report No 2:
The Different Uses ofFood Composition
DatabasesBy Claire Williamson
British Nutrition Foundation
Contents
1. Introduction 3
2. The different uses of food composition databases 4
2.1 Clinical practice 6Analysing the diets of patients 6Devising special diets for patients 7Patient information 9
2.2 Epidemiological research 11
2.3 Public health and education 16Monitoring food and nutrient availability 16Public health assessment and dietary surveys 19Development of dietary guidelines 21Food regulations and food safety 22Consumer education 25Educational materials 26
2.4 Food industry 27Food labelling and nutrient claims 27Product development and reformulation 31Consumer information and marketing 31
2.5 Other uses 33Consumer uses 33Food service industry 33Planning of institutional diets 34Sports nutrition and expeditions 35
3. Limitations of food composition databases 36
4. Future developments and the EuroFIR project 38
1
The Dif ferent Uses of Food Composition Databases

2
The Dif ferent Uses of Food Composition Databases

1. Introduction
Food composition databases (FCDBs) provide detailed information on thenutritional composition of foods, usually from a particular country. Foodcomposition data may be available in different formats e.g. paper-based,often referred to as food composition tables, or electronic versions, known asnutrient databases or databanks. FCDBs provide values for energy andnutrients (e.g. protein, vitamins and minerals) and other important foodcomponents (e.g. fibre) for each of the foods listed. These values are basedon chemical analyses which are carried out in analytical laboratories or areestimated from other appropriate data. The figure below shows an extractfrom the UK food composition tables, as an example.
Composition of food per 100g edible portion
No Food Protein Fat Carbohydrate Energy Energyg g g kcal kJ
952 Grapefruit, raw 0.8 0.1 6.8 30 126
953 canned in juice 0.6 Tr* 7.3 30 120
954 canned in syrup 0.5 Tr* 15.5 60 257
955 Grapes, average 0.4 0.1 15.4 60 257
956 Guava, raw 0.8 0.5 5.0 26 112
* Trace amount of nutrient
Source: FSA (2002) McCance and Widdowson’s The Composition of Foods,6th Summary Edn. Cambridge: Royal Society of Chemistry.
© Crown copyright. Reproduced with the permission of the Controller of HMSO.
3
The Dif ferent Uses of Food Composition Databases

Data on the composition of foods are essential for a variety of purposes inmany different fields of work, for example the assessment of energy andnutrient intake in individuals or groups. They are also necessary to assessthe effect of diet on health and disease outcomes and therefore are anessential pre-requisite to epidemiological research. Ultimately, they help inthe development of dietary guidelines for population groups and in planningmenus for schools, hospitals, prisons and the armed forces. They have evenbeen used to plan the food ration requirements for polar expeditions. Thewide range of applications in a variety of other sectors include clinicaldietetic practice, sports nutrition, the food industry (e.g. productdevelopment and food labelling), government food and health departments(e.g. target setting) and in nutrition education and health promotion.
This report aims to:
● outline the different ways in which FCDBs are used
● consider the current limitations of FCDBs
● discuss potential future developments and the role of EuroFIR.
2. The different uses of food compositiondatabases
The table opposite outlines the different uses of food composition databasesand tables, within each of the main sectors of use (see table 1). There aresome general uses of food composition data, which apply to most users,including estimating the nutrient content of foods, comparing different foodsfor their nutrient composition and identifying which foods are good sources ofparticular nutrients. Some uses are unique to a particular sector, such asdevising special diets for patients within clinical practice. Each of the mainuses of FCDBs will be covered in more detail, throughout this section.
4
The Dif ferent Uses of Food Composition Databases
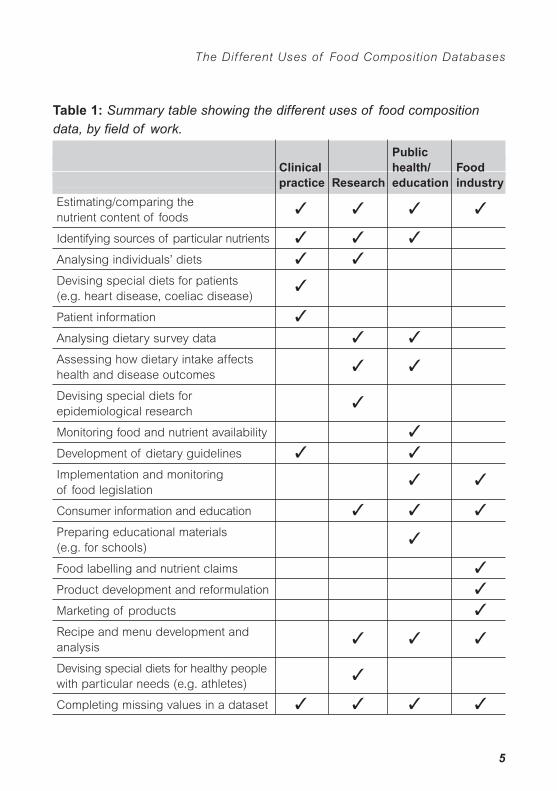
Table 1: Summary table showing the different uses of food compositiondata, by field of work.
PublicClinical health/ Food practice Research education industry
Estimating/comparing the nutrient content of foods
✓ ✓ ✓ ✓
Identifying sources of particular nutrients ✓ ✓ ✓
Analysing individuals’ diets ✓ ✓
Devising special diets for patients(e.g. heart disease, coeliac disease)
✓
Patient information ✓
Analysing dietary survey data ✓ ✓
Assessing how dietary intake affects health and disease outcomes
✓ ✓
Devising special diets for epidemiological research
✓
Monitoring food and nutrient availability ✓
Development of dietary guidelines ✓ ✓
Implementation and monitoring of food legislation
✓ ✓
Consumer information and education ✓ ✓ ✓
Preparing educational materials(e.g. for schools)
✓
Food labelling and nutrient claims ✓
Product development and reformulation ✓
Marketing of products ✓
Recipe and menu development and analysis
✓ ✓ ✓
Devising special diets for healthy peoplewith particular needs (e.g. athletes)
✓
Completing missing values in a dataset ✓ ✓ ✓ ✓
5
The Dif ferent Uses of Food Composition Databases

2.1 Clinical practice
Analysing the diets of patients
Dietary assessment is carried out in clinical practice, usually by a dietitian,in order to assess a patient’s nutritional status or nutritional risk. Thisassessment is then used as a basis for providing dietary advice or nutritionalsupport. The method used for dietary assessment depends on thecharacteristics of the patient (e.g. their age, ethnic background, cognitiveability), the clinical circumstances and the purpose of assessment, whichcould be any of the following:
● to assess overall dietary balance
● to obtain a quantitative estimate of energy and/or specific nutrientintakes
● to identify nutritional deficiencies or excesses
● to assess the risk of malnutrition
● to monitor compliance with dietary advice.
A typical method of dietary assessment used in the clinical setting isobtaining a dietary history, such as a 24-hour recall, where the patient isasked to recall all the foods and drinks they consumed over a 24-hour period.This method has the advantage of being quick and simple to perform, whichis an important consideration in clinical practice, and is also not burdensomeon the patient. Although a single 24-hour recall is not usually sufficient toprovide a quantitative estimate of nutrient intake, it can be used to revealmajor dietary inadequacies or excesses and can be a starting point todetermine whether further investigation is needed (Thomas, 2001).
Other dietary assessment methods include asking the patient to complete adiet diary, which they take away and fill in over a period of 3 or more days.
6
The Dif ferent Uses of Food Composition Databases

This can be useful for investigating food intolerances or to monitor theeffectiveness of a dietary treatment or compliance with dietary advice.However, to obtain an accurate, quantitative measure of nutrient intake, aweighed food record is required, usually collected over a period of 5 to 7days. However, this method has its drawbacks, in particular it is moreburdensome on the patient, but is more precise than other methods as gramweights are obtained for each of the foods consumed (for a more detaileddiscussion of different dietary assessment methods, see Nelson 2000). Thedietary data can then be entered into a dietary analysis programme (utilisingdetailed food composition data) to determine the patient’s energy andnutrient intake and assess whether the diet is meeting the patient’s nutritionalrequirements.
Devising special diets for patients
The assessment of patients’ energy and nutrient intakes is important in thedetermination of appropriate dietary advice or prescription of a therapeuticdiet. There are a number of clinical conditions that require therapeutic diets.Therapeutic diets need to be nutritionally balanced, while controlling orrestricting the intake of specific nutrients and/or food components, thereforetheir prescription requires a thorough understanding of the compositionof foods.
Some typical examples of clinical conditions that require therapeutic dietsare listed in table 2, together with the dietary components that may need tobe controlled. Unfortunately, most food composition tables and databasesdo not list all of the components shown in the table (e.g. gluten andmonoamines are usually not listed). In these cases, additional primary datasources may need to be consulted for this information (Greenfield &Southgate 2003).
7
The Dif ferent Uses of Food Composition Databases

Table 2: Clinical conditions that require food composition data for theplanning of therapeutic diets
Clinical condition Food composition information requiredmay include:
Requiring general dietary controlDiabetes mellitus Energy, available carbohydrate, fat, protein, fibreObesity Energy, fatHypertension Energy, sodium, potassium, proteinRenal (kidney) disease Protein, sodium, potassium
Deficiency statesAnaemia Iron, folate, vitamin B12
Vitamin deficiencies Specific vitamins
Metabolic disordersHaemochromatosis IronHyperlipidaemias Fat, fatty acids, cholesterolInborn errors of amino acid metabolism e.g. phenylketonuria Specific amino acidsGout, xanthinuria PurinesGall bladder disease Fat, calcium, cholesterol, fibreWilson’s disease Copper
IntolerancesMonosaccharides, disaccharides Individual sugars (e.g. sucrose, lactose, fructose)Gluten (and other specific proteins) Gluten, specific proteinsMigraine Monoamines
Allergies Specific protein sourcese.g. nut allergy
Source: adapted from Greenfield & Southgate (2003).
8
The Dif ferent Uses of Food Composition Databases
The use of food composition data in the development of therapeutic dietshas been facilitated by advances in information technology, particularly thedevelopment of nutritional analysis and meal planning software (Church2006).
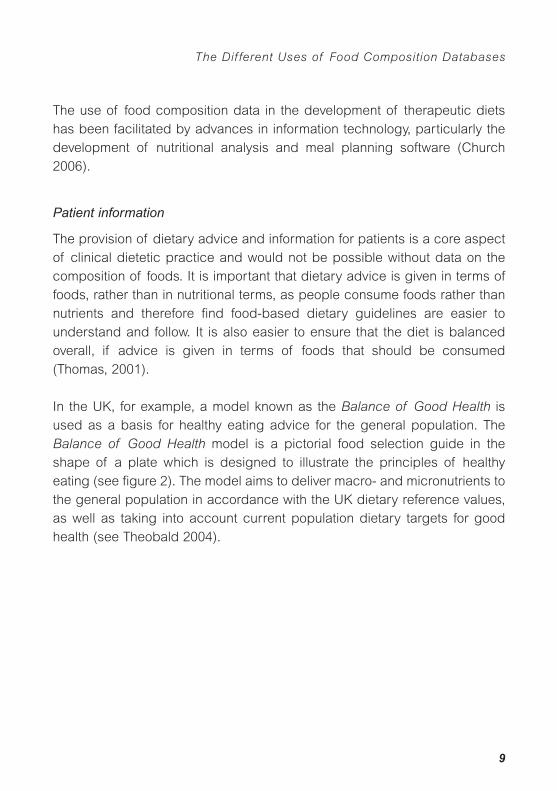
Patient information
The provision of dietary advice and information for patients is a core aspectof clinical dietetic practice and would not be possible without data on thecomposition of foods. It is important that dietary advice is given in terms offoods, rather than in nutritional terms, as people consume foods rather thannutrients and therefore find food-based dietary guidelines are easier tounderstand and follow. It is also easier to ensure that the diet is balancedoverall, if advice is given in terms of foods that should be consumed(Thomas, 2001).
In the UK, for example, a model known as the Balance of Good Health isused as a basis for healthy eating advice for the general population. TheBalance of Good Health model is a pictorial food selection guide in theshape of a plate which is designed to illustrate the principles of healthyeating (see figure 2). The model aims to deliver macro- and micronutrients tothe general population in accordance with the UK dietary reference values,as well as taking into account current population dietary targets for goodhealth (see Theobald 2004).
9
The Dif ferent Uses of Food Composition Databases

Figure 2: The UK Balance of Good Health model
The Balance of Good Health model can be modified to provide advice todifferent client groups or sectors of the population, such as the elderly orpeople from particular ethnic groups. This can be achieved by giving moreor less emphasis to the different food groups, to achieve an increase ordecrease in energy or nutrients. For example, in the case of anaemia, dietaryadvice would emphasise sufficient choices from the ‘meat and alternatives’group and highlight other good sources of iron, together with plenty of foodsfrom the ‘fruit and vegetables’ group to supply vitamin C (which enhancesthe absorption of iron). The model is also being used increasingly as a basisfor dietary management of more complex diseases such as diabetes orcoeliac disease (Thomas, 2001).
10
The Dif ferent Uses of Food Composition Databases

Other countries have developed their own pictorial food guides, includingGermany, Sweden, Portugal, the United States (US), Canada, Mexico, China,Korea, the Philippines and Australia (see Painter et al. 2002). These arediscussed further in the section on public health and education (section 2.3).
Food composition data are also used by dietitians to construct diet sheetswith information to help patients manage particular conditions, such as heartdisease, diabetes, obesity, hypertension or food allergies. In all cases, aknowledge of, as well as access to, good quality food composition data isessential for the delivery of appropriate nutritional advice.
2.2 Epidemiological research
McCance & Widdowson in 1940 are quoted assaying “a knowledge of the chemicalcomposition of foods is the firstessential in the dietary treatment ofdisease or in any quantitative study ofhuman nutrition” (McCance &Widdowson 1940). This indicates theoriginal motivation behind food composition studies, which were carried outto identify and determine the chemical nature of the food components thataffect health and the mechanisms whereby chemical constituents exert theirinfluence.
Such studies remain central to nutrition research into the role of foodcomponents in health and disease, but at an ever-increasing level ofsophistication and complexity (Church 2005). The validity of nutritionalepidemiological studies depends on accurate food composition and foodintake data. Therefore a comprehensive FCDB that is representative ofavailable foods is an essential pre-requisite for quantitative nutritionalresearch (Greenfield & Southgate 2003).
11
The Dif ferent Uses of Food Composition Databases
Nutritional epidemiology provides a means for identifying relationshipsbetween dietary factors and health in human populations consuming usualamounts of foods and nutrients. The main purpose is to identify potentialcauses of diet-related diseases (e.g. cardiovascular disease, cancer,diabetes) so that these can be modified in order to reduce the burden ofdisease. Most studies in nutritional epidemiology are observational, whereresearchers assess differences in the exposure and outcome of interest tosee whether a relationship exists. Although such studies cannot provideevidence of causality, they can be used to identify dietary factors that maybe involved in the onset of disease.
For example, case-control studies compare past dietary exposure to aparticular dietary factor between groups of individuals with and without thedisease outcome. However, the problem with these types of studies is that theyare susceptible to recall and selection biases, in that recalling past diet is notvery reliable and also people with the disease may recall their diet differentlyfrom healthy individuals. Cohort (or prospective) studies do not have thisproblem and therefore their findings are considered to be more reliable,although, these studies take a long time and are expensive to carry out.
Dietary data collection is a challenging part of nutritional epidemiology –accuracy in measurement of food and nutrient intake is important in order todetect true associations. Most cohort or prospective studies use foodfrequency questionnaires (FFQs) to assess food intake as it would not bepractical to use a more detailed method (e.g. 7-day weighed food diary) ona large cohort of participants. FFQs attempt to assess usual or typical foodintake over a longer time period than is usually possible using other dietaryassessment methods. Foods are listed in a questionnaire format or multiple-response grid and respondents are asked to estimate how often theyconsume each food and how much they usually consume (using householdunits) (see table 3). The FFQ is a useful method for assessing the nutrientintake of a population or group or for classifying individuals e.g. into tertiles
12
The Dif ferent Uses of Food Composition Databases

of intake. However, it is less accurate for estimating the nutrient intakes ofindividuals (see Bingham et al. 1994).
Table 3: Example of a section of a food frequency questionnaire (FFQ)
In the last month... how often have you eaten any of the following types ofbread or rolls?
Never or 1-3 days 1-2 days 3-4 days 5-6 days Amount< once per per per per PER DAYper month week week week on daysmonth eaten
White bread and rolls
Brown/wholemeal/granary bread and rolls
Other breads e.g. naan, paratha,chapatti, pitta
Scones, currant bread, currant buns, teacakes
The data on amount and frequency of foods consumed are then entered intoa specially designed data entry programme which converts the fooddescriptions and portion size estimates into weights. This information islinked to codes for foods in tables of food composition. The final dataproduced by this process is the average intake of food, energy and nutrients,by day and individual. Epidemiologists are then able to examine patterns offood and nutrient intake and how these relate to health and diseaseoutcomes.
13
The Dif ferent Uses of Food Composition Databases
Epidemiologists and those assessing nutritional status at a population levelhave particularly benefited from the development of computerised FCDBs.These can not only hold a much greater volume of data compared withprinted tables, but hugely facilitate the manipulation of data, both in terms ofadding new values and for the calculation and analysis of nutrient intakes(Church 2005).
Example – the EPIC study
The European Prospective Investigation into Cancer and Nutrition (EPIC)study is an example of a large prospective cohort study that has been setup to investigate the relationship between dietary factors and the incidenceof different types of cancer (see www.iarc.fr/epic). EPIC is a pan-Europeanstudy with around 520 000 participants taking part from 10 differentEuropean countries. This is of sufficient size to investigate even the rarestcancers and provides enough statistical power to investigate anyinteractions, for example with genetic polymorphisms (see Bingham 2005).
Previous cohort studies looking at diet and cancer have not been able todetermine strong associations between dietary factors and different types ofcancer. This is partly due to the complexity of modern food supplies but alsodue to the fact that many different food items have been associated withdifferent cancers. All of these different food items have different errorsassociated with their measurement which can cause dietary associations tobe weakened. The EPIC study attempts to overcome the effects ofmeasurement error in a number of ways. It is the largest prospective studyever undertaken to investigate the relationship between diet and cancer andthe large sample size means that statistical power is increased, enhancingthe chance of identifying associations. Furthermore, because it involvesparticipants from 10 European countries, there is a wide variation in dietaryhabits within the cohort which also increases the likelihood of detectingassociations. Measurement error is further minimised by correcting results
14
The Dif ferent Uses of Food Composition Databases

using more detailed dietary estimates (standardised 24-hour recall) from arepresentative sub-sample of the cohort (Bingham & Riboli 2004).
Most countries in Europe have their own national FCDBs which have beencompiled using country-specific procedures and aim to provide comparablenutrient composition data at the national level (Charrondiere et al. 2002).However, in order to establish relationships between food and nutrientintakes and disease in the EPIC study, a standardised European FCDB wasneeded. Since such a database does not currently exist, the EPIC study hadto develop a method for improving the comparability of the food compositiondata from the different participating countries. This involved building newmatrices using detailed food lists derived from the standardised(computerised) 24-hour recall data collected from a representative samplefrom each of the EPIC cohorts (approx 35 000 respondents). This helped toovercome the problem of trying to reduce differences between food lists inthe different databases. Furthermore, all recipe data was systematicallybroken down into constituent ingredients in order to optimise comparisonbetween countries. The compilation of nutrients was carried out usingstandardised sources of nutrient data or algorithms. For foods common toseveral countries, the same nutrient values could be used, but for country-specific foods, nutrient values specific to that country were used (Slimani etal. 2000).
The EPIC study has so far shown that saturates intake is linked to breastcancer in women (Bingham et al. 2003). It has also found that dietary fibreand fish appear to be protective against colorectal cancer, while high intakesof red and processed meat appear to increase the risk of large bowelcancer (Norat et al. 2005). International epidemiological studies, such as theEPIC study, have highlighted the need for the standardisation of foodcomposition data produced at the national level (Deharveng et al. 1999). Themethodology utilised in the EPIC study to improve comparability betweenEuropean FCDBs is now being used as a basis to develop protocols forestablishing a pan-European database within the EuroFIR project.
15
The Dif ferent Uses of Food Composition Databases
Furthermore, the increase in research into the associations between diet andchronic disease has led to an increase in demand for complete, up-to-dateand reliable food composition data, and for information on a far greatervariety of food components, including bioactive compounds, such asisoflavones, carotenoids and other phytochemicals. Characterisation ofthese compounds and the levels found in foods therefore represents a wholenew challenge for database compilers.
To quote Dr Barbara Burlingame of the United Nations (UN) Food andAgriculture Organisation: “In addressing the diet and chronic diseaserelationship, two things should be clear: food composition data form thebasis by which intakes, and hence diet-disease relationships, are assessed,and food composition data are the fundamental information by which dietaryintake goals can be achieved. Without sufficient quantity and quality ofcompositional data – past, present and future – all diet/disease evidencewould be insufficient” (Burlingame 2003).
2.3 Public health and education
Monitoring food and nutrient availability
National governments hold responsibility for monitoring and recording theavailability of food and nutrients to their populations, and this is carried outat various levels:
a) Food balance sheets
Food balance sheet information is based on statistical data on theproduction, import and export of foods and is published quarterly by the UNFood and Agriculture Organisation (see www.fao.org). These data provide adisaggregated picture of food availability at a national level and areconverted to energy and nutrient availability to compare national foodsupplies across countries and over time. These data provide an assessment
16
The Dif ferent Uses of Food Composition Databases

of the gross adequacy or inadequacy of the national food supply, indicatingwhere there are excesses or shortfalls, but do not provide a precise estimateof actual consumption.
b) Household expenditure surveys
Household expenditure surveys provide data on food expenditure andpurchases at the household level that are converted to nutrient availability, sothat comparisons of food and nutrient availability within a population can bemade by income, region or other household parameters and over time.These types of surveys do not measure food intake directly, only the foodentering the household over the study period, but they are an invaluablemeasure of food purchasing trends over time. Some surveys, e.g. the oneconducted annually in the UK, give a more complete picture by alsoproviding data on out-of-home consumption. In this survey, a special codingframe for food purchases has been developed based on the UK foodcomposition tables (see www.statistics.gov.uk/ssd/surveys/expenditure_food_survey.asp).
c) Dietary surveys
Dietary surveys (or food consumption surveys) provide the most detailedestimation of food and nutrient intake at the population level (see below).Sometimes they also provide valuable accompanying data on nutritionalstatus, physical activity levels and dental health. However, these types ofsurveys are expensive and time-consuming to carry out, so few countries areable to conduct them on a regular basis.
The conversion of food consumption data to nutrient intake data requires anadequate FCDB, regardless of the level at which information on foodavailability is collected. FCDBs need to be representative of national foodsupplies, as well as being up-to-date and accessible, in order to be of usein analysis of food and nutrient availability at the national level. Food
17
The Dif ferent Uses of Food Composition Databases

composition tables that are updated on a regular basis also provide themeans to assess long-term changes in the food supply. For example, therehave been changes to the fat and iron content of meat in developedcountries over recent years, due to changes in animal husbandry andbutchering methods (e.g. Higgs 2000). Comparison of current foodcomposition data with past food tables enables changes in the food supplyto be explored and monitored (Greenfield & Southgate 2003).
However, changes in the methodology used to assess nutrient levels occurfrom time to time, as methods are improved and new technology becomesavailable, and this must be taken into account when examining changes infood composition over time. Furthermore, when compiling past food tables,database compilers may have analysed different varieties or samples (e.g.different varieties of fruit) and used different sample preparation methods(e.g. cooking methods) so the data may not be directly comparable. Whenexamining changes in nutrient composition, therefore, several comparisonstudies would be required in order to provide evidence of true changes innutrient levels over time.
Ideally, high quality FCDBs representative of local foods would be developedfrom scratch for each country or region, but this would be extremelyexpensive, and therefore many countries (including most developingcountries) have to ‘borrow’ data which they combine with local and regionaldata to create their own national database. However, the problem with‘borrowing’ data from other countries is that local foods do not always havea similar nutrient composition to comparable foods from elsewhere, for whichdata exist. Also, the particular products available in some countries may befortified or enriched with specific nutrients, therefore many databases thatare currently being used are very limited in terms of their local applicability.For example, vitamin D is added to milk in the US but not typically elsewhere,and therefore US data on the vitamin D content of milk are not applicable toother countries. Similarly, wheat grown in the US has a naturally higher
18
The Dif ferent Uses of Food Composition Databases
selenium content than wheat grown in Europe, so US data on selenium levelswould not be applicable to countries elsewhere.
A useful development would be for countries that maintain the most completedatabases to document fully the contribution of fortification to nutrient values,as well as provide modifiable recipes for composite foods, so thatappropriate adaptations can be made locally (Harrison 2004).
Public health assessment and dietary surveys
With the growing recognition of the effects of diet on health, many countrieshave developed national programmes (or dietary surveys) to assess diet andnutritional status at the population level. Dietary surveys aim to providecomprehensive, cross-sectional information on the dietary habits andnutritional status of a population. The results of dietary surveys can be usedas a basis for the development of nutrition policies and contribute to theevidence base for government advice on healthy eating.
Dietary surveys carried out in European countries include the DanishNational Dietary Survey, the Dutch National Food Consumption Survey andthe North/South Ireland Food Consumption Survey. In the US there is a newsurvey called ‘What We Eat in America’ which is an integration of twonationwide dietary surveys – the Continuing Survey of Food Intakes byIndividuals (CSFII) and the National Health and Nutrition Examination Survey(NHANES). This new integrated survey will be carried out on a continuousyearly basis (a rolling programme).
19
The Dif ferent Uses of Food Composition Databases
In the UK, there is a nationwide government survey known as the NationalDiet and Nutrition Survey (NDNS) (see www.food.gov.uk/science/101717/ndnsdocuments). The aims of the NDNS programme include the following:
● to provide detailed quantitative information on food and nutrient intakes,sources of nutrients and nutritional status of the population under study,as a basis for government policy.
● to describe the characteristics of individuals with intakes of nutrients thatare above or below the national average.
● to monitor the diet of the population under study to establish whether itis adequate nutritionally.
● to help determine potential relationships between diet and nutritionalstatus and risk factors for disease in later life.
● to assess physical activity levels in the population under study.
Previously, the NDNS programme surveyed four different age groupsseparately, with each sample selected to be nationally representative, andcollected dietary data via a weighed intake record covering 4 or 7 days,depending on the age group. Dietary data are analysed using the NDNSdatabase, a FCDB that has been developed specifically for the NDNSprogramme and is continually updated as new surveys are carried out,during survey fieldwork. However, dietary data collection using 7-dayweighed intakes is very onerous on participants and response rates on theNDNS have been falling, so changes are about to occur to tackle this.Multiple pass 24-hour recalls will be employed instead to obtain dietaryintake data and the survey will become a rolling programme, eventuallyincluding individuals across all age groups simultaneously. The survey willprobably be carried out on an annual cycle, similar to the model used in theUS (see Dwyer et al. 2003). These changes will be the subject of a futureEuroFIR web feature.
20
The Dif ferent Uses of Food Composition Databases

In addition, numerous smaller dietary surveys are undertaken in differentcountries, for example to assess nutritional status at a local level or in specificpopulation sub-groups. These may require food composition data specific tothe sub-group being studied (e.g. traditional or ethnic foods). In manycountries, these dietary survey programmes have provided the impetusneeded for continued support of food composition work.
Development of dietary guidelines
Evidence from epidemiological studies and assessments of nutritional statushas led to an increasing amount of information and educational advice onchoosing a healthy diet. Reliable and comprehensive FCDBs that arerepresentative of available foods are an essential tool for the development offood based dietary guidelines. The need for good quality nutrient data toimprove public health was outlined in the keynote address at the 26thNational Nutrient Databank Conference (NNDC) and the Dietary Approachesto Stop Hypertension (DASH) trial that led to the development of the ‘DASH’diet to control and prevent hypertension was used as an illustrative exampleof the importance of FCDBs (Ryan & Champagne 2003).
The DASH trial, carried out in the US, sought to investigate how differentdietary patterns (rather than specific nutrients) affected blood pressure.Evidence from previous epidemiological studies, together with clinical trials,had demonstrated that vegetarian dietary patterns are associated withhealthy blood pressure levels. This was hypothesised to be due to the factthat vegetables are rich in minerals, such as potassium and magnesium,while also being low in fat and high in fibre, and that these constituents helpto lower blood pressure (Harlan et al. 1984). Three dietary patterns werecompared: The Average American Diet, the Fruit and Vegetable Diet(providing potassium and magnesium at levels close to the 75th percentile ofUS consumption) and the Combination Diet (also referred to as the ‘DASH’diet). The DASH diet provided 9 servings of fruit and vegetables per day, 3servings of low fat dairy products per day and had reduced amounts of total
21
The Dif ferent Uses of Food Composition Databases

fat, saturates and cholesterol. It also provided potassium, magnesium andcalcium at levels close to the 75th percentile of US consumption and washigh in protein and fibre. Each diet provided 3 to 3.5g of sodium per day andthe diets were energy adjusted so that respondents maintained their weightwhile on the trial.
A database known as the MENu (Moore’s Extended Nutrient) database wasused to design recipes and food items for nine meals for each of the threediets. Meals were then prepared and analysed for their nutrient composition.Based on the food analysis results, the recipes and menus were thenadjusted to ensure that the nutrient composition met the targets that hadbeen set. Full details of the methodology used are published elsewhere (seeAppel et al. 1997). The DASH diet lowered systolic blood pressure by 5.5mmHg and diastolic blood pressure by 3.0mm Hg, compared to the other twodiets. This effect was seen within 2 weeks and continued for the duration ofthe study (Ryan & Champagne 2003).
The DASH diet has now been endorsed by the American Heart Association(Krauss et al. 2000). It has been shown to be effective in both men andwomen and reduces blood pressure to the same extent as that achievedthrough medication, as well as being safe and cost effective. However, thiscould not have been achieved without the availability of food compositiondata and illustrates the importance of high-quality nutrient databases inpublic health nutrition research and the development of dietary guidelinesfor population groups.
Food regulations and food safety
Many public health nutrition decisions depend on the availability of adequatedata on the food and nutrient intake of populations in different countries.These include decisions on the enrichment or fortification of foods and onissues of food safety.
22
The Dif ferent Uses of Food Composition Databases

Fortification with folic acid
One example of the use of food composition data in the development ofpublic health policy is the issue of folic acid fortification. It is now wellrecognised that for pregnant women, taking folic acid during the peri-conceptional period can reduce the incidence of neural tube defects(NTDs), such as spina bifida, in the developing fetus and it is currentlyrecommended in the UK that all women who may become pregnant shouldtake a folic acid supplement (400µg/day) prior to and up until the 12th weekof pregnancy (DH 2000). However, although there have been severalgovernment campaigns to increase awareness of the importance of folicacid supplementation, many pregnancies are still unplanned and, in thesecases, women often do not start taking folic acid supplements until it is toolate (Buttriss 2004). Furthermore, there is also evidence from national dietarysurvey data of widespread marginal folate status in the UK population(particularly among young women and the elderly) which could also beaddressed with fortification. For these reasons, the statutory fortification offlour with folic acid is currently being debated for a second time in the UK,as well as a number of other countries, including Ireland, Switzerland,Australia and New Zealand (SACN 2005).
There is now evidence from countries that have introduced fortificationpolicies, such as the USA, Canada and Chile, that fortification of flour canreduce the incidence of NTDs by around 27-50%. The UK Food StandardsAgency (FSA) has so far not proceeded with fortification, primarily due toconcerns about the possibility of masking vitamin B12 deficiency anaemia inthe elderly population, although the issue is now being reconsidered. TheFSA has used food composition data, together with dietary intakeinformation, to model likely folic acid intakes in different groups, shouldfortification go ahead. The UK government’s Scientific Advisory Committeeon Nutrition (SACN) has recently published a draft report on folate anddisease prevention, which again concludes that there is a need, on balance,
23
The Dif ferent Uses of Food Composition Databases

for the introduction of mandatory fortification of flour with folic acid in the UK(SACN 2005), reaffirming earlier government advice (DH 2000).
Food safety – example of oily fish
Food safety hazards from naturally occurring compounds or environmentalcontaminants are another reason why data on the composition of foods arenecessary. Several natural food components present safety risks ifconsumed in excess (e.g. salt and vitamin A) but there are otherenvironmental food contaminants that have been detected in certain foods,such as dioxins and PCBs (polychlorinated biphenyls).
Data on contaminants in foods are limited in most countries and not alllaboratories are able to analyse foods for contaminants as well as nutrientcomposition. In order to estimate exposure for particular subgroups of thepopulation, data on food contaminants (where available) has to be mappedonto food consumption data on intake of particular foods and nutrients, andassumptions made where contaminant data is not available (Harrison 2004).
An example of this is the UK advice on oily fish consumption for the generalpopulation that was issued by the FSA in 2004 and included specific advicefor certain groups, such as women of childbearing age. This new advice wasbased on a joint report from SACN and the Committee on Toxicity (COT)which considered the risks and benefits of fish consumption, in particularoily fish (SACN 2004). The current advice for the general UK population is toconsume at least two portions of fish per week, one of which should be oily.However, the new advice recommended, for the first time, maximum intakesof oily fish for different groups. For example, pregnant women and those whomay become pregnant are now advised to consume no more than 2 portionsof oily fish per week.
24
The Dif ferent Uses of Food Composition Databases

The basis for these SACNrecommendations is that theconsumption of fish, particularlyoily fish, confers significant healthbenefits in terms of a reduction inthe risk of cardiovascular disease.This is thought to be due to thelong-chain n-3 fatty acids found infish, levels of which are particularlyhigh in oily fish. However, themaximum limit on oily fish consumption is due to the risk of exposure topollutants, such as dioxins and PCBs, which have been found in oily fish.These are persistant compounds that may accumulate over time in the bodyand could have adverse effects on health if consumed at high levels over along period of time.
Consumer education
Food composition data are also important for the provision of dietaryguidelines and advice on healthy eating for the general population. It isusually the responsibility of national governments to provide healthy eatinginformation for the general public, but this is also carried out by public healthcharities and non-government organisations, as well as the food industry.
As described earlier (see section 2.1), healthy eating advice in the UK isbased on a model known as the Balance of Good Health. This is a pictorialfood guide showing the proportion and types of foods that are needed tomake up a healthy, balanced diet. It is based on the UK dietary referencevalues for energy and nutrients and is applicable to all healthy adults andchildren over the age of 5 years. Similar models exist in other countries, suchas the food pyramid model used in the US. Such models are used as thebasis for healthy eating leaflets and information provided via other media,such as the internet.
25
The Dif ferent Uses of Food Composition Databases
Other European countries that have developed their own pictorial food guideillustrations include Germany, Portugal and Sweden. Most Europeancountries use a circular format, similar to the Balance of Good Health model,such as the German Nutrition Circle. Although there are differences in theshapes and food groupings of different food guide illustrations around theworld, the core recommendations are similar – that is that the diet should bebased on large amounts of grains, fruit and vegetables, with a moderateintake of milk and dairy products and meat (Painter et al. 2002).
The results of epidemiological research (see section 2.2) are used as thebasis for the development of more specific guidelines for particular groupsof the population (e.g. certain ethnic groups) or government healthcampaigns to increase awareness about important aspects of the diet, suchas limiting salt intake or increasing fruit and vegetable consumption.
Educational materials
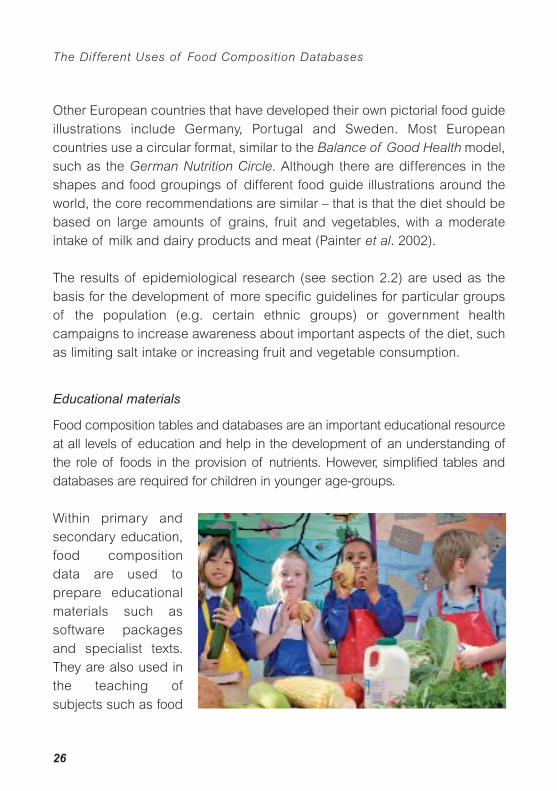
Food composition tables and databases are an important educational resourceat all levels of education and help in the development of an understanding ofthe role of foods in the provision of nutrients. However, simplified tables anddatabases are required for children in younger age-groups.
Within primary andsecondary education,food compositiondata are used toprepare educationalmaterials such assoftware packagesand specialist texts.They are also used inthe teaching ofsubjects such as food
26
The Dif ferent Uses of Food Composition Databases

technology and home economics. Within undergraduate and postgraduateeducation, food composition databases and tables are used in the teachingof courses in a range of nutrition-related subjects, including nutrition anddietetics, public health nutrition, and food science and technology courses.
2.4 Food industry
Increasing levels of international trade have led to a greater need to accessdata for foods from other countries. For example, governments need to knowthe composition of imported foods in order to ensure the nutritional valueand safety of foods available to the population. Similarly, food retailers andmanufacturers need to know the composition of foods or ingredientsimported in order to meet food labelling requirements as well as nationalstandards and regulations. Standards such as Codex Alimentarius1 utilisefood composition data at an international level.
Food labelling and nutrient claims
FCDBs are now a widely used source of information for food labelling. Mostcountries (including European countries) now permit the use of data from an‘authoritative source’ for food labelling purposes. Some food manufacturersand retailers carry out their own food analyses, but this is a costly and time-consuming process and therefore the use of data from existing food tablesis an alternative method which is much more economical for manufacturers(Southgate 2000).
The Codex Alimentarius Committee on Food Labelling, which is responsiblefor drawing up internationally agreed standards and codes of practice, hasdeveloped uniform methods for the use of food composition data on food
27
The Dif ferent Uses of Food Composition Databases
1 The Codex Alimentarius is a collection of internationally adopted food standards,codes of practice, guidelines and recommendations which have been created forthe purpose of protecting the health of consumers and ensuring fair practices inthe food trade.
labels, emphasising the importance of current and valid food compositioninformation for international trade. Data on the composition of ingredients iscritical for predicting the composition of finished products. This information,in turn, is required to verify the nutritional information provided on the label.
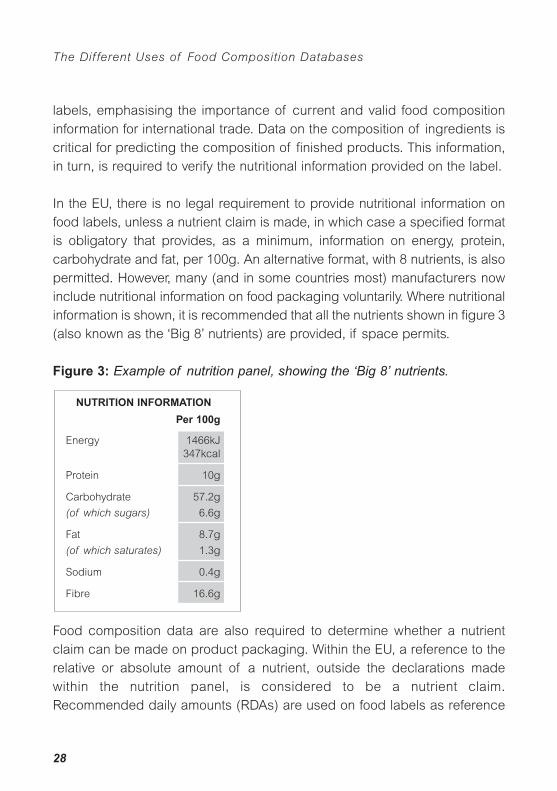
In the EU, there is no legal requirement to provide nutritional information onfood labels, unless a nutrient claim is made, in which case a specified formatis obligatory that provides, as a minimum, information on energy, protein,carbohydrate and fat, per 100g. An alternative format, with 8 nutrients, is alsopermitted. However, many (and in some countries most) manufacturers nowinclude nutritional information on food packaging voluntarily. Where nutritionalinformation is shown, it is recommended that all the nutrients shown in figure 3(also known as the ‘Big 8’ nutrients) are provided, if space permits.
Figure 3: Example of nutrition panel, showing the ‘Big 8’ nutrients.
Food composition data are also required to determine whether a nutrientclaim can be made on product packaging. Within the EU, a reference to therelative or absolute amount of a nutrient, outside the declarations madewithin the nutrition panel, is considered to be a nutrient claim.Recommended daily amounts (RDAs) are used on food labels as reference
NUTRITION INFORMATION
Per 100g
Energy 1466kJ347kcal
Protein 10g
Carbohydrate 57.2g
(of which sugars) 6.6g
Fat 8.7g
(of which saturates) 1.3g
Sodium 0.4g
Fibre 16.6g
28
The Dif ferent Uses of Food Composition Databases

values for selected vitamins and minerals. RDAs are estimates of the amountof vitamins and minerals sufficient to meet (or more than meet) the needs ofgroups of adults, rather than individuals. RDAs are part of the NutritionLabelling for Foodstuffs Directive (90/496/EEC) and reflect the variation inopinion across Europe as to the precise values to use. There is only onefigure for each nutrient, derived from figures for adults. Table 4 lists the RDAsfor vitamins and minerals and also shows the criteria for micronutrient claims.
Table 4: RDA values and criteria for micronutrient claims
RDA Source claim Rich source(1/6 of the RDA) (50% of the RDA)
Vitamin A (µg) 800 133 400
Vitamin D (µg) 5 0.83 2.5
Vitamin E (mg) 10 1.7 5
Vitamin C (mg) 60 10 30
Thiamin (mg) 1.4 0.23 0.7
Riboflavin (mg) 1.6 0.27 0.8
Niacin (mg) 18 3 9
Vitamin B6 (mg) 2 0.3 1
Folic acid (µg) 200 33.3 100
Vitamin B12 (µg) 1 0.16 0.5
Biotin (mg) 0.15 0.025 0.075
Pantothenic acid (mg) 6 1 3
Calcium (mg) 800 133 400
Phosphorus (mg) 800 133 400
Iron (mg) 14 3 7
Magnesium (mg) 300 50 150
Zinc (mg) 15 2.5 7.5
Iodine (µg) 150 25 75
29
The Dif ferent Uses of Food Composition Databases

There are also international guidelines relating to nutrient claims. The Codexcommittee on food labelling proposed draft regulations for nutrition claims in2001 to ensure that nutrition labelling is effective in providing the consumerwith information to enable them to make wise food choices. Nutrition labellingshould not present information which is in any way false or misleading. It isalso a requirement of the Codex guidelines that if a nutritional claim is made,nutrition labelling is adequate. For more information, see the EuroFIR monthlyweb features on Food Labelling and Nutrition and Health Claims(EuroFIR 2005).
The European Commission announced its intention to review and streamlinecurrent labelling legislation in 2004. This is likely to be a long-term exercisewith an expected completion date of 2010. The main objectives of theCommission’s proposal are to achieve a higher level of consumer protectionas well as to increase legal security for economic operators, to ensure faircompetition in the area of foods and to promote and protect innovation in thearea of foods. By adopting rules that regulate the information about foodsand their nutritional value appearing on the label, consumers will be able tomake informed and meaningful choices. This also contributes to a higherlevel of protection of human health.
The labelling of foods with nutritional information is now widespread andindeed mandatory in some countries (e.g. most pre-packaged foods in theUSA). This development has largely been driven by the demand for point-of-purchase information to ensure that consumers can make informed choices.The use of food composition data from national FCDBs for food labellingpurposes has not only expanded the user base, but has also hadimplications for the production of databases, since it strengthens the needfor current, reliable and representative data. This has influenced researchinto, as well as the presentation of, food composition data in most Europeancountries (Church 2005).
30
The Dif ferent Uses of Food Composition Databases

Product development and reformulation
When developing new products, food regulators may use food compositiondata as a reference point for desirable levels of nutrients in the new product.For example, it may be considered desirable that a newly formulated dairyproduct should provide similar levels of calcium and riboflavin to a similar,traditional dairy food. New food processing techniques should notsignificantly adversely affect the nutritional quality of a well-recognisedproduct (Greenfield & Southgate 2003). Food manufacturers and retailersare constantly developing new ranges of products. Food composition dataare particularly relevant to the development of ‘healthier’ ranges ofprocessed foods which must meet certain specifications on the amount offat, sugar and/or salt they contain. Analytical data on food composition arealso used to help formulate foods that are fortified with certain levels ofnutrients, such as certain breads and breakfast cereals.
Furthermore, existing products are often reformulated to improve taste or tomeet certain nutritional criteria. For example, food manufacturers andretailers have recently been working towards reducing the levels of salt inmany of their products (e.g. soups, ready meals, meat products) to meetgovernment targets. National food composition tables and databases,therefore, need to be constantly updated to reflect changes in productcomposition as well as new novel ingredients (e.g. polyols and noveloligosaccharides) and this is very difficult to achieve. Few national authoritieshave the resources to keep up-to-date with all the developments/advances inthe current food supply.
Consumer information and marketing
There has been a growing interest in food and nutrition amongst consumersover recent years and this has been a motivating force behind foodmanufacturers and distributors providing more information on the nutrientcontent of their products. Within the food industry, the use of data on food
31
The Dif ferent Uses of Food Composition Databases

composition is critical to enable food producers to meet consumers’ needs.Consumers are particularly interested in information on the composition ofchildren’s foods, but there is also a demand for information in relation to theprevention of diet-related diseases, such as cardiovascular disease anddifferent types of cancer. There is also increasing concern over weightcontrol and the prevention of obesity and consumers are now demandingmore information, particularly on the fat, sugar and salt content of foods.
Food manufacturers and retailers, in turn, use information on the nutritionalcomposition of foods to market and promote their products, through nutritionand health claims. Nutrient claims, such as ‘low in salt’, ‘reduced fat’, ‘noadded sugar’, ‘high in fibre’ or ‘source of folic acid’ are often seen onpackaging and are used to inform consumers and encourage them tochoose one product over another (see above for more information on nutrientclaims). Furthermore, food manufacturers often provide further informationon the nutrient composition of their products on company websites, togetherwith more general information on diet and nutrition.
Health claims are statements about the beneficial effects of a food or itsingredients on the body, although there is dispute regarding how far healthclaims can go. Manufacturers are developing products that may have healthbenefits beyond the provision of nutrients for general health and wellbeingand are drawing attention to this through health claims on the front of foodpackaging. Examples include n-3 fatty acids and heart health, probiotics andgut health, and the cholesterol lowering properties of soya protein. There iscurrently no specific legislation about health claims in the EU (although theyare covered in the general labelling regulations), but the law states that anyclaim must be true and not misleading. Labels are not allowed to claim thatfood can treat, prevent or cure any disease or medical condition, as these areconsidered to be ‘medicinal claims’. There are also Codex guidelines whichare followed by many other European countries, and a European Directive isnow at an advanced stage. For further information, see the EuroFIR monthlyweb feature on Nutrition and Health Claims (EuroFIR 2005).
32
The Dif ferent Uses of Food Composition Databases

2.5 Other uses
Consumer uses
Many consumers have an interest in food, nutrition and health relatedmatters, particularly issues around weight control, and a wide range ofbooklets and guides are now available which show the calorie content offoods. Some guides also show the fat content of foods and possibly othernutrients as well. These guides are based on national food composition data,as well as data from manufacturers on the calorie content of commonlyconsumed products.
Food composition informationis now more widely available toconsumers in some countriesthrough the use of portablecomputer technology. Newsoftware can now be used toenable consumers to find outthe nutrient composition offoods and learn how foodchoices affect their nutrientintake (Harrison 2004). Theseproducts are likely to become more popular in the future with increasingconcern amongst consumers about how diet affects health and thesubsequent demand for more information about the nutritional compositionof foods.
Food service industry
The food service industry includes catering companies that provide mealsfor schools and other institutions, as well as cafeterias, restaurants andhotels. As the links between diet and health have become increasingly
33
The Dif ferent Uses of Food Composition Databases
recognised, consumers are becoming ever more concerned with their dietand looking for healthier options when eating out. There is therefore anincreased demand on chefs and caterers to provide healthier meal optionswithin schools, workplace cafeterias and restaurants. Within the cateringindustry, food composition data is used for menu planning and recipeanalysis to provide meals that meet certain nutritional criteria. For example,caterers may want to develop recipes and menus that meet certainrecommendations for energy, salt, fat or saturates. Specialised dietaryanalysis software that is user-friendly has been developed for this purposee.g. Saffron Nutrition (see www.fdhospitality.com/software-solutions/saffron-nutrition.php).
There is also an increased demand on food companies that supply foodproducts to the catering industry, to provide more information on thenutritional composition of their products. There is an increased requirementfor products that meet certain nutritional criteria (e.g. lower in salt, fat orsaturates) and again, specialised software packages are now available toenable catering companies to calculate the nutritional composition of theirproducts.
Planning of institutional diets
Food composition data have also become increasingly important forplanning institutional diets as the links between diet and health have becomeever more recognised. Large groups of the population are provided withfood in this way, for example in hospitals, prisons, military establishments,schools and day-care centres. In the case of the armed services, FCDBsmay be used to develop ration scales for troops and expeditions.
34
The Dif ferent Uses of Food Composition Databases

There has recently been anincreased focus on schoolmeals as concerns overchildren’s diets and health(particularly obesity) havegrown. In Scotland, forexample, the governmenthas now introducednutrient-based standardsfor school meals underthe Hungry for Successscheme. Specialised nutritional analysis software is now in use to help schoolcaterers to plan meals that meet these guidelines, for example, a softwareprogramme known as Nutmeg is currently being used in Scotland. Newstandards for school meals in England, which are both nutrient and food-based, are due to be introduced in 2006 (see Buttriss 2005).
Sports nutrition and expeditions
Food composition data are also used within the sports and fitness industryto help plan diets for athletes and sports professionals. Athletes need toincrease their energy and nutrient intake to meet the extra demands placedon them by intensive sports activities. This increased food intake should benutritionally balanced and particular attention paid to carbohydrate and fluidintake. This is not always straightforward and requires careful dietaryplanning. Without good nutrition, athletes will not be able to meet their fullpotential (see BNF 2001). Moreover, FCDBs may also be used to plan foodrequirements for endurance expeditions, such as transatlantic and round-the-world boat races.
35
The Dif ferent Uses of Food Composition Databases

3. Limitations of Food Composition Databases
The limitations of food composition tables or databases are often poorlyunderstood by users. All foods are biological materials and therefore shownatural variability in their composition. This variation may be due todifferences in the animal or plant species assessed, environmental factors(e.g. soil and climate), variations in agricultural practices or the storage,processing and preparation of foods. Even processed foods which areproduced under very controlled conditions show some variability due todifferences in the composition of ingredients and variations in processing,packaging and storage.
The degree of variation in nutrient composition also varies for differentnutrients. Micronutrient (vitamin and mineral) values vary more widely thanmacronutrient (carbohydrate and protein) values, with the exception of fat,which is extremely variable, particularly in meats where the lean to fat ratiocan vary widely. Vitamin C and folate show wide natural variability in foodsand are particularly unstable, levels being affected by both heat and light.This is such that FCDBs can only give an approximate or typical indication ofthe levels of these nutrients (Southgate 2000). This therefore limits theirusefulness for both scientific and regulatory purposes.
Widdowson and McCance once wrote: “There are two schools of thoughtabout food tables. One tends to regard the figures in them as having theaccuracy of atomic weight measurements; the other dismisses them asvalueless on the grounds that a foodstuff may be so modified by the soil, theseason, or its rate of growth that no figure can be a reliable guide to itscomposition. The truth, of course, lies somewhere between these two pointsof view.” (Widdowson & McCance 1943).
36
The Dif ferent Uses of Food Composition Databases
In addition to the nutrient content of foods, there is now increasing interest inthe potential health benefits of phytonutrients or bioactive compounds, foundin many plant foods, e.g. isoflavones and carotenoids. Emerging data from invitro and animal studies suggests that these compounds may play a role inthe prevention of chronic diseases, such as cardiovascular disease andsome types of cancer. However, most national databases contain little, if any,data on bioactive compounds and therefore it is difficult to assess intakes inhuman epidemiological studies and relate these to health outcomes.
Furthermore, over recent years, there has been a substantial increase in theamount of manufactured foods consumed and one of the biggestchallenges for compilers is keeping databases up-to-date with newproducts. In addition, as already discussed (section 2.4), productformulations are constantly changing so data on existing products needs tobe updated on a regular basis. However, it can be very difficult for databasecompilers to keep up with the pace of change in the food industry and it istherefore likely that estimates of nutrient intake are becoming increasinglyless representative of actual nutrient intake (Greenfield & Southgate 2003).
37
The Dif ferent Uses of Food Composition Databases

4. Future Developments and the EuroFIR Project
Diets worldwide have changed dramatically since food composition datawere first produced. The food supply is now more dynamic than ever. Tradeis undertaken on a global level, which has major implications for the foodsconsumed within each country. For example, exotic fruit and vegetables andindeed new varieties of indigenous produce, are now commonly availablearound the world, often all year round. The diverse ethnic populations inmany countries have brought with them their own food cultures, andincreased the diversity of food outlets in the countries to which they havemigrated. Processed foods are now widely consumed and the variety ofavailable products is continually increasing. New ingredients and newprocessing methods have been developed and, more recently, there hasbeen increasing interest in functional foods (Church 2005).
Food composition data are currently being used in multi-centre studies andin ways which were not previously anticipated (e.g. within specialised fieldsof health, agriculture, environmental sciences and economics). Furthermore,environmental events such as diminishing crop biodiversity, the developmentof genetically modified organisms and climate change will also require theattention of database compilers. Key aspects that need to be re-examinedinclude the representativeness of foods, the completeness of FCDBs (i.e. the
38
The Dif ferent Uses of Food Composition Databases
need to generate data for missing foods) and an integrated approach toFCDB development internationally (see Burlingame 2004).
Although their have been major efforts over the past two decades tostandardise food descriptions, nutrient terminology, analytical techniquesand compilation methods, nutrient values in different FCDBs are still notreadily comparable across countries (Greenfield & Southgate 2003). Severalrecent initiatives from the European Commission, such as FLAIR (Food-Linked Agro-Industrial Research) and INFOODS (International Network ofFood Data Systems) have so far led to greater collaboration betweenEuropean countries, but there is still a lack of permanent structures tosupport this type of work and relatively poor links between the variousnational database compilers, policy makers and end-users of the data.
Europe urgently needs a single, accessible and reliable food compositioninformation resource in order that the relationships between dietary intakesand health can be further explored and the burden of chronic disease andassociated health and social costs reduced. A single, comprehensive andvalidated FCDB will enable the full interpretation and exploitation of researchfindings from pan-European studies and effective dissemination to variousstakeholders such as consumers, the food industry, educators, policymakers and health professionals.
EuroFIR (short for ‘European Food Information Resource Network’) is a five-year project funded by the European Commission through the EU SixthFramework Programme. The main objective of EuroFIR is to develop anintegrated, comprehensive and validated databank or food informationresource which will provide a single, authoritative source of food compositiondata in Europe for nutrients and newly emerging bioactive compounds withpotential health benefits. This objective is an essential underpinningcomponent of all food and health research in Europe.
39
The Dif ferent Uses of Food Composition Databases

EuroFIR is a partnership involving 40 universities, research institutes andsmall-to-medium sized enterprises (SMEs) from 21 European countries. Themain aims of the project include:
● strengthening the scientific and technological excellence in fooddatabank systems and tools in Europe.
● identifying and providing new information on missing data for nutrientsand bioactive compounds for all food groups, including traditional andethnic foods.
● training a new generation of European scientists in the development,management and application of food databank systems.
● communicating with all user and stakeholder groups to develop fooddatabank systems for the benefit of European food and nutritionresearch.
● disseminating and exploiting new scientific and technological knowledgeto create a sustainable and durable body.
As a Network of Excellence, EuroFIR aims to address some of the problemsthat have hindered the development of a pan-European database in thepast, including developing partnerships with the private sector, therebyhelping to accelerate the progress of nutrition and health research. TheEuroFIR Network has an important role in supporting the development ofFCDBs and ensuring their future viability, as well as providing guidelines forand supporting national database compilers (Church 2006).
For further information, see the EuroFIR website: www.eurofir.net
40
The Dif ferent Uses of Food Composition Databases

References
Appel LJ, Moore TJ, Obarzanek E, Vollmer WM, Svetkey LP, Sacks FM, BrayGA, Vogt TM, Cutler JA, Windhauser MM, Lin PH, Karanja N (1997) A clinicaltrial of the effects of dietary patterns on blood pressure. DASH CollaborativeResearch Group. New England Journal of Medicine 336(16): 1117-24.
Bingham SA, Gill C, Welch A, Day K, Cassidy A, Khaw KT, Sneyd MJ, Key TJ,Roe L, Day NE (1994) Comparison of dietary assessment methods innutritional epidemiology: weighed records v. 24 h recalls, food-frequencyquestionnaires and estimated-diet records. British Journal of Nutrition. 72:619-43.
Bingham SA, Luben R, Welch A, Wareham N, Khaw KT, Day N (2003) Areimprecise methods obscuring a relation between fat and breast cancer?Lancet 362(9379): 212-4.
Bingham SA & Riboli E (2004) Diet and cancer - the European ProspectiveInvestigation into Cancer and Nutrition. Nature 4: 206-215.
Bingham S (2005) Annual BNF Lecture: What do people eat? Adventures innutritional epidemiology. Nutrition Bulletin. 30: 217-221.
BNF (British Nutrition Foundation) (2001) Briefing paper: Nutrition and Sport.British Nutrition Foundation, London.
Burlingame B (2003) Evidence for diet and chronic disease relationshipsrequires food composition data (Editorial). Journal of Food Composition andAnalysis 16: 109.
Burlingame B (2004) Fostering quality data in food composition databases:visions for the future. Journal of Food Composition and Analysis 17: 251-258.
Buttriss JL (2004) Strategies to increase folate/folic acid intake in women: anoverview. Nutrition Bulletin 29: 234-244.
41
The Dif ferent Uses of Food Composition Databases
Buttriss JL (2005) Facts behind the headlines: Government promises schoolmeals will be transformed. Nutrition Bulletin 30: 211-214.
Charrondiere UR, Vignat J, Møller A, Ireland J, Becker W, Church S, FarranA, Holden J, Klemm C, Linardou A, Mueller D, Salvini S, Serra-Majem L, SkeieG, van Staveren W, Unwin I, Westenbrink S, Slimani N, Riboli E (2002) TheEuropean Nutrient Database (ENDB) for Nutritional Epidemiology. Journal ofFood Composition and Analysis 15: 435-451.
Church S (2005) The History of European Food Composition Databases.European Food Information Resource Consortium (EuroFIR). Available at:www.eurofir.net
Church S (2006) The history of food composition databases. NutritionBulletin 31: 15-20.
Deharveng G, Charrondiere UR, Slimani N, Southgate DA, Riboli E (1999)Comparison of nutrients in the food composition tables available in the nineEuropean countries participating in EPIC. European Journal of ClinicalNutrition 53(1): 60-79.
DH (Department of Health) (2000) Report on Health and Social Subjects No.50. Folic Acid and the Prevention of Disease 2000. Report of the Committeeon Medical Aspects of Food Policy. The Stationary Office, London.
Dwyer J, Picciano MF, Raiten DJ; Members of the Steering Committee;National Health and Nutrition Examination Survey (2003) Collection of foodand dietary supplement intake data: What We Eat in America-NHANES.Journal of Nutrition 133(2): 590S-600S.
EuroFIR (2005) Monthly web feature: Informing the Consumer: FoodLabelling and Food Composition Databases. Available at: www.eurofir.net
EuroFIR (2005) Monthly web feature: Nutrition and Health Claims. Availableat: www.eurofir.net
42
The Dif ferent Uses of Food Composition Databases

FSA (Food Standards Agency) (2002) McCance and Widdowson’s TheComposition of Foods. Sixth summary edition. Royal Society of Chemistry,Cambridge.
Greenfield H & Southgate DAT (2003) Food composition data: production,management and use. Second edition. Rome: FAO.
Harlan WR, Hull AL, Schmouder RL, Landis JR, Thompson FE, Larkin FA(1984) Blood pressure and nutrition in adults. The National Health and NutritionExamination Survey. American Journal of Epidemiology 120(1): 17-28.
Harrison GG (2004) Fostering data quality in food composition databases:applications and implications for public health. Journal of Food Compositionand Analysis 17: 259-265.
Higgs J (2000) The changing nature of red meat: 20 years of improvingnutritional quality. Trends in Food Science and Technology 11: 85-95.
Krauss RM, Eckel RH, Howard B, Appel LJ, Daniels SR, Deckelbaum RJ,Erdman JW Jr, Kris-Etherton P, Goldberg IJ, Kotchen TA, Lichtenstein AH,Mitch WE, Mullis R, Robinson K, Wylie-Rosett J, St Jeor S, Suttie J, Tribble DL,Bazzarre TL (2000) AHA Dietary Guidelines: revision 2000: A statement forhealthcare professionals from the Nutrition Committee of the American HeartAssociation. Circulation 102(18): 2284-99.
McCance RA & Widdowson EM (1940) The Chemical Composition of Foods.Medical Research Council Special Report Series no. 235. HMSO: London.
Nelson M (2000) Methods and validity of dietary assessment. In: Garrow JS,James WPT & Ralph A (2000) Human Nutrition and Dietetics. ChurchillLivingstone, UK.
Norat T, Bingham S, Ferrari P, Slimani N, Jenab M, Mazuir M, Overvad K,Olsen A, Tjonneland A, Clavel F, Boutron-Ruault MC, Kesse E, Boeing H,Bergmann MM, Nieters A, Linseisen J, Trichopoulou A, Trichopoulos D,Tountas Y, Berrino F, Palli D, Panico S, Tumino R, Vineis P, Bueno-de-MesquitaHB, Peeters PH, Engeset D, Lund E, Skeie G, Ardanaz E, Gonzalez C,
43
The Dif ferent Uses of Food Composition Databases
Navarro C, Quiros JR, Sanchez MJ, Berglund G, Mattisson I, Hallmans G,Palmqvist R, Day NE, Khaw KT, Key TJ, San Joaquin M, Hemon B, Saracci R,Kaaks R, Riboli E (2005) Meat, fish, and colorectal cancer risk: The EuropeanProspective Investigation into Cancer and Nutrition. Journal of the NationalCancer Institute 97(12): 906-16.
Painter J, Rah JH & Lee YK (2002) Comparison of international food guidepictorial representations. Journal of the American Dietetic Association102(4): 483-9.
Ryan DH & Champagne C (2003) Better nutrient data improves public health:evidence and examples from the Dietary Approaches to Stop Hypertension(DASH) Trial. Journal of Food Composition and Analysis 16: 313-321.
SACN (Scientific Advisory Committee on Nutrition) (2004) Advice on fishconsumption: benefits and risks. Accessed via www.sacn.gov.uk
SACN (Scientific Advisory Committee on Nutrition) (2005) Folate and diseaseprevention (draft report). Accessed via www.sacn.gov.uk
Slimani N, Charrondière UR, van Staveren W, Riboli E (2000) Standardizationof Food Composition Databases for the European Prospective Investigationinto Cancer and Nutrition (EPIC): General Theoretical Concept. Journal ofFood Composition and Analysis 13: 567-584.
Southgate DAT (2000) Food composition tables and nutritional databases. In:Garrow JS, James WPT & Ralph A (2000) Human Nutrition and Dietetics.Churchill Livingstone, UK.
Theobald H (2004) A whole diet approach to healthy eating. Nutrition Bulletin29: 44-49.
Thomas B (2001) Manual of Dietetic Practice, Third Edition. BlackwellScience Ltd, Oxford.
Widdowson EM & McCance RA (1943) Food tables, their scope andlimitations. Lancet i: 230-232.
44
The Dif ferent Uses of Food Composition Databases

© European Food Information Resource Consortium (EuroFIR) 2006.
No part of this publication may be reproduced without prior written
permission from the EuroFIR Project Management Office,
Institute of Food Research, Norwich Research Park,
Norwich, Norfolk, NR4 7UA, UK.
Synthesis report No 2:
The Different Uses ofFood Composition
DatabasesBy Claire Williamson
British Nutrition Foundation
This work was
completed on behalf
of the European
Food Information
Resource (EuroFIR)
Consortium and
funded under the
EU 6th Framework
Food Quality
and Safety
thematic priority.
Contract FOOD-CT-
2005-513944.