Chapter 5: Modeling Complex Relationships Data Modeling and Database Design.

1
Database Modeling and Design
3 rd Edition
Toby J. TeoreyUniversity of Michigan
Lecture Notes(last revision 10/24/98)
Contents
I. Database Systems and the Life Cycle (Chapter 1)……………………… 2 Introductory concepts; objectives of database management 2Relational database life cycle 3Characteristics of a good database design process 7
II. Requirements Analysis (Chapter 3)…………………………………………….. 8
III. Entity-Relationship (ER) Modeling (Chapters 2-4)……………… 11Basic ER modeling concepts 11Schema integration methods 22Entity-relationship 26Transformations from ER diagrams to SQL Tables 29
IV. Normalization and normal forms (Chapter 5)…………………………. 35
First normal form (1NF) to third normal form (3NF) and BCNF 353NF synthesis algorithm (Bernstein) 42Fourth normal form (4NF) 47
V. Access Methods (Chapter 6)…………………………………………………… 50Sequential access methods 50Random access methods 52Secondary Indexes 58Denormalization 62Join strategies 64
VI. Database Distribution Strategies (Chapter 8)………………………….. 66Requirements of a generalized DDBMS: Date’s 12 Rules 68Distributed database requirements 72The non-redundant “ best fit” method 74The redundant “all beneficial sites” method 77
VII. Data Warehousing, OLAP, and Data Mining (Chapter 9)…… 79Data warehousing 79On-line analytical processing (OLAP) 86Data mining 90

2
I. Database Systems and the Life Cycle
Introductory Concepts
data—a fact, something upon which an inference is based (information or knowledge has value, data hascost)
data item—smallest named unit of data that has meaning in the real world (examples: last name, address,ssn, political party)
data aggregate (or group) -- a collection of related data items that form awhole concept; a simple group is a fixed collection, e.g. date (month, day, year); a repeating group is avariable length collection, e.g. a set of aliases.
record—group of related data items treated as a unit by an application program (examples: presidents,elections, congresses)
f i le—collection of records of a single type (examples: president, election)
database—computerized collection of interrelated stored data that serves the needs of multiple users withinone or more organizations, i.e. interrelated collections of records of potentially many types.Motivation for databases over files: integration for easy access and update, non-redundancy, multi-access.
database management system (DBMS) -- a generalized software system for manipulating databases.Includes logical view (schema, sub-schema), physical view (access methods, clustering), data manipulationlanguage, data definition language, utilities - security, recovery, integrity, etc.
database administrator (DBA) -- person or group responsible for the effective use of databasetechnology in an organization or enterprise. Motivation: control over all phases of the lifecycle.
Objectives of Database Management
1. Data availability—make an integrated collection of data available to a wide variety of users* at reasonable cost—performance in query update, eliminate or control data redundancy* in meaningful format—data definition language, data dictionary* easy access—query language (4GL, SQL, forms, windows, menus);embedded SQL, etc.; utilities for editing, report generation, sorting
2. Data integrity—insure correctness and validity* checkpoint/restart/recovery* concurrency control and multi-user updates* accounting, audit trail (financial, legal)
3. Privacy (the goal) and security (the means)* schema/sub-schema, passwords
4. Management control—DBA: lifecycle control, training, maintenance
5. Data independence (a relative term) -- avoids reprogramming of applications, allows easier conversion andreorganization
* physical data independence—program unaffected by changes in the storage structure or access methods

3
* logical data independence—program unaffected by changes in the schema
* Social Security Administration example (1980ís)- changed benefit checks from $999.99 to $9999.99 format- had to change 600 application programs- 20,000 work hours needed to make the changes (10 work years)
* Student registration system—cannot go to a 4-digit or hexadecimal course numbering system because ofdifficulty changing programs
*Y2K (year 2000) problem—many systems store 2-digit years (e.g. ‘02-OCT-98’) in their programs anddatabases, that give incorrect results when used in date arithmetic (especially subtraction), so that ‘00’ isstill interpreted as 1900 rather than 2000. Fixing this problem requires many hours of reprogramming anddatabase alterations for many companies and government agencies.
Relational Database Lifecycle
1. Requirements formulation and analysis* natural data relationships (process-independent)* usage requirements (process-dependent)* hardware/software platform (OS, DBMS)* performance and integrity constraints* result: requirements specification document, data dictionary entries
2. Logical database design2.1 ER modeling (conceptual design)2.2 View integration of multiple ER models2.3 Transformation of the ER model to SQL tables2.4 Normalization of SQL tables (up to 3NF or BCNF)*result: global database schema, transformed to table definitions
3. Physical database design* index selection (access methods)* clustering
4. Database distribution (if needed for data distributed over a network)* data fragmentation, allocation, replication
5. Database implementation, monitoring, and modification

4
5

6

7
Characteristics of a Good Database Design Process
* iterative requirements analysis- interview top-down- use simple models for data flow and data relationships- verify model
* stepwise refinement and iterative re-design
* well-defined design review process to reduce development costs review team -database designers
-DBMS software group-end users in the application areas when to review - after requirements analysis & conceptual design- after physical design- after implementation (tuning) meeting format- short documentation in advance- formal presentation- criticize product, not person- goal is to locate problems, do solutions off line- time limit is 1-2 hours

8
II. Requirements Analysis
Purpose - identify the real-world situation in enough detailto be able to define database components. Collect two types of data: natural data (input to the database) andprocessing data (output from the database).
Natural data requirements (what goes into the database)
1. Organizational objectives - sell more cars this year- move into to recreational vehicle market
2. Information system objectives- keep track of competitors’ products and prices- improve quality and timing of data to management regarding production schedule delays, etc.- keep track of vital resources needed to produce and market a product
3. Organizational structure/chart
4. Administrative and operational policies- annual review of employees- weekly progress reports- monthly inventory check- trip expense submission
5. Data elements, relationships, constraints, computing environment
Processing requirements (what comes out of the database)
1. Existing applications - manual, computerized
2. Perceived new applications
* quantifies how data is used by applications
* should be a subset of data identified in the natural relationships (but may not be due to unforeseen applications)
* problem - many future applications may be unknown

9
Data and Process Dictionary Entries for Requirements Analysis in the Database Design LifecycleEntity Description (possibly in a data dictionary)Name customerReference-no 4201Cardinality 10,000Growth rate 100 per monthSynonyms user, buyerRole (or description) someone who purchases or rents a
product made by the company.Security level 0 (customer list is public)Subtypes adults, minorsKey attribute(s) cust-noNon-key attribute(s) cust-name, addr, phone, payment-status Relationship to other entities
salesperson, order, productUsed in which applications billing, advertising
Attribute description (data elements in a data dictionary)Name cust-noReference-no 4202Range of legal values 1 to 999,999Synonyms cno, customer-numberData type integerDescription customer id number set by the company.Key or nonkey keySource of data table of allowable id numbersUsed in applications billingAttribute trigger /*describes actions that occur when a
data element is queried or updated*/
Relationship descriptionName purchaseReference-no 511037Degree binaryEntities and connectivity customer(0,n), product(1,n)Synonyms buyAttributes (of the relationship) quantity, order-noAssertions a customer must have purchased at
least one product, but some products may not have been purchased as yet by any customers.
Process (application) descriptionName payrollReference-no 163Frequency bi-weeklyPriority 10Deadline noon FridaysData elements used emp-name, emp-salaryEntities used employeeData volume (how many entities) implicit from entity cardinality
Interviews at different levels

10
Top management - business definition, plan/objectives, future plans
Middle management - functions in operational areas, technical areas, job-titles, job functions
Employees - individual tasks, data needed, data out
Specific end-users of a DBMS - applications and data of interest
Basic rules in interviewing
1. Investigate the business first
2. Agree with the interviewee on format for documentation (ERD, DFD, etc.)
3. Define human tasks and known computer applications
4. Develop and verify the flow diagram(s) and ER diagram(s)
5. Relate applications to data (this helps your programmers)
Example: order entry clerk
Function: Take customer orders and either fill them or make adjustments.Frequency: dailyTask Def Volume Data Elements
1. Create order 2000 A, B, E, H2. Validate order 2000 A, B, G, H, J3. Fill out error form 25 A, C4. Reserve item/price 6000 A, D, H5. Request alternate items 75 A, E, I, K,M6. Enter unit price 5925 A, F, J, N

11
III. Entity-Relationship (ER) Modeling
Basic ER Modeling Concepts
Entity - a class of real world objects having common characteristics and properties about which we wish to recordinformation.
Relationship - an association among two or more entities
* occurrence - instance of a relationship is the collective instances of the related entities
* degree - number of entities associated in the relationship (binary, ternary, othern-ary)
* connectivity - one-to-one, one-to-many, many-to-many
* existence dependency (constraint) - optional/mandatory
Attribute - a characteristic of an entity or relationship
* Identifier - uniquely determines an instance of an entity
* Identity dependence - when a portion of an identifier is inherited from another entity
* Multi-valued - same attribute having many values for one entity
* Surrogate - system created and controlled unique key (e.g. Oracle’s “create sequence”)

12

13

14
Constraints

15
Super-class (super-type)/subclass (subtype) relationship
Generalization
* similarities are generalized to a super-class entity, differences are specialized to a subclass entity, called an “ISA”relationship (“specialization” is the inverse relationship)
* disjointness constraint - there is no overlap among subclasses
* completeness constraint - constrains subclasses to be all-inclusive of the super-class or not (i.e. total or partialcoverage of the superclass)
* special property: hierarchical in nature
* special property: inheritance - subclass inherits the primary key of the super-class, super-class has common nonkeyattributes, each subclass has specialized non-key attributes
Aggregation
* “part-of” relationship among entities to a higher type aggregate entity (“contains” is the inverse relationship)
* attributes within an entity, data aggregate (mo-day-year)
* entity clustering variation: membership or “is-member-of” relationship

16

17
Constraints in ER modeling
* role - the function an entity plays in a relationship
* existence constraint (existence dependency) - weak entity
* exclusion constraint - restricts an entity to be related to only of several other
* entities at a given point in time
- mandatory/optional- specifies lower bound of connectivity of entity instances- participating in a relationship as 1 or 0
* uniqueness constraint – one-to-one functional dependency among key attributes in a relationship: binary, ternary, or higher n-ary

18

19

20

21
Schema Integration Methods
Goal in schema integration

22
- to create a non-redundant unified (global) conceptual schema
(1) completeness - all components must appear in the global schema(2) minimality - remove redundant concepts in the global schema(3) understandability - does global schema make sense?
1 . Comparing of schemas
* look for correspondence (identity) among entities
* detect possible conflicts
- naming conflictshomonyms - same name for different conceptssynonyms - different names for the same concept
- structural conflictstype conflicts - different modeling construct for the same concept (e. g. “order” as an entity, attribute,relationship)
- dependency conflicts - connectivity is different for different views (e.g. job-title vs. job-title-history)
- key conflicts - same concept but different keys are assigned (e.g. ID-no vs. SSN)
- behavioral conflicts - different integrity constraints (e.g. null rules for optional/mandatory: insert/delete rules)
* determine inter-schema properties
- possible new relationships to combine schemas
- possible abstractions on existing entities or create new super-classes (super-types)
2. Conforming of schemas
* resolve conflicts (often user interaction is required)
* conform or align schemas to make compatible for integration
* transform the schema via- renaming (homonyms, synonyms, key conflicts)- type transformations (type or dependency conflicts)- modify assertions (behavioral conflicts)
3. Merging and restructuring
* superimpose entities
* restructure result of superimposition

23

24

25

26
Entity-Relationship Clustering
Motivation
* conceptual (ER) models are difficult to read and understand for large and complex databases, e.g. 10,000 or more dataelements
* there is a need for a tool to abstract the conceptual database schema (e. g. clustering of the ER diagram)
* potential applications
- end user communication
- application design team communication
- documentation of the database conceptual schema (in coordination with the data dictionary)
Clustering Methodology
Given an extended ER diagram for a database.....
Step 1. Define points of grouping within functional areas.
Step 2. Form entity clusters* group entities within the same functional area* resolve conflicts by combining at a higher functional grouping
Step 3. Form higher entity clusters.
Step 4. Validate the cluster diagram.* check for consistency of interfaces.* end-users must concur with each level.

27

28

29
Transformations from ER diagrams to SQL Tables
* Entity – directly to a SQL table
* Many-to-many binary relationship – directly to a SQL table, taking the 2 primary keys in the 2entities associated with this relationship as foreign keys in the new table
* One-to-many binary relationship – primary key on “one” side entity copied as a foreign key in the“many” side entity’s table
* Recursive binary relationship – same rules as other binary relationships
* Ternary relationship – directly to a SQL table, taking the 3 primary keys of the 3 entities associatedwith this relationship as foreign keys in the new table
* Attribute of an entity – directly to be an attribute of the table transformed from this entity
* Generalization super-class (super-type) entity – directly to a SQL table
* Generalization subclass (subtype) entity – directly to a SQL table, but with the primary key ofits super-class (super-type) propagated down as a foreign key into its table
* Mandatory constraint (1 lower bound) on the “one” side of a one-to-manyrelationship – the foreign key in the “many” side table associated with the primary key in the “one” sidetable should be set as “not null” (when the lower bound is 0, nulls are allowed as the default in SQL)

30

31

32

33

34

35
IV. Normalization and Normal Forms
First normal form (1NF) to third normal form (3NF) and BCNF
Goals of normalization1. Integrity2. Maintainability
Side effects of normalization* Reduced storage space required (usually, but it could increase)* Simpler queries (sometimes, but some could be more complex)* Simpler updates (sometimes, but some could be more complex)
First normal form (1NF) -- a table R is in 1NF iff all underlying domains contain only atomic values, i.e. there are no repeating groups in a row.
functional dependency —given a table R, a set of attributes B is functionally dependent on another set of attributesA if at each instant of time each A value is associated with only one B value. This is denoted by A -> B. A trivialFD is of the form XY --> X (subset).
super-key - - a set of one or more attributes, which, when taken collectively, allows us to identify uniquely anentity or table.
candidate key —any subset of the attributes of a super-key that is also a super-key, but not reducible.
primary key -- arbitrarily selected from the set of candidate keys, as needed for indexing.
Third normal form (3NF) -- a table is in 3NF if, for every nontrivial FD X --> A, either:
(1) attribute X is a super-key, or(2) attribute A is a member of a candidate key (prime attribute)
Boyce-Codd normal form (BCNF)-- a table is in BCNF if, for every nontrivial FD X --> A,
(1) attribute X is a super-key.

36
Tables, Functional Dependencies, and Normal Forms
First Normal FormTABLE SUPPLIER_PART (100k rows, 73 bytes/row => 7.3 MB)SNUM SNAME STATUS CITY PNUM PNAME WT QTY SHIPDATE S1 SMITH 20 LONDON P1 NUT 12 3 1-4-90S1 SMITH 20 LONDON P2 BOLT 22 2 2-17-90S1 SMITH 20 LONDON P3 WRENCH 27 6 11-5-89S1 SMITH 20 LONDON P4 WRENCH 24 2 6-30-91S1 SMITH 20 LONDON P5 CLAMP 22 1 8-12-91S1 SMITH 20 LONDON P6 LEVEL 19 5 4-21-91S2 JONES 10 PARIS P1 NUT 12 3 5-3-90S2 JONES 10 PARIS P2 BOLT 22 4 12-31-90S3 BLAKE 10 PARIS P3 WRENCH 27 4 3-25-91S3 BLAKE 10 PARIS P5 CLAMP 22 2 3-27-91S4 CLARK 20 LONDON P2 BOLT 22 2 10-31-89S4 CLARK 20 LONDON P4 WRENCH 24 3 7-14-90S4 CLARK 20 LONDON P5 CLAMP 22 7 8-20-90S5 ADAMS 30 ATHENS P5 CLAMP 22 5 8-11-91
Functional dependenciesSNUM --> SNAME, STATUS,CITYCITY --> STATUSPNUM --> PNAME, WTSNUM,PNUM,SHIPDATE --> QTY
Attribute sizes (bytes)SNUM 5 PNAME 10SNAME 20 WT 5STATUS 2 QTY 5CITY 10 SHIPDATE 8PNUM 8 Total size 73
37
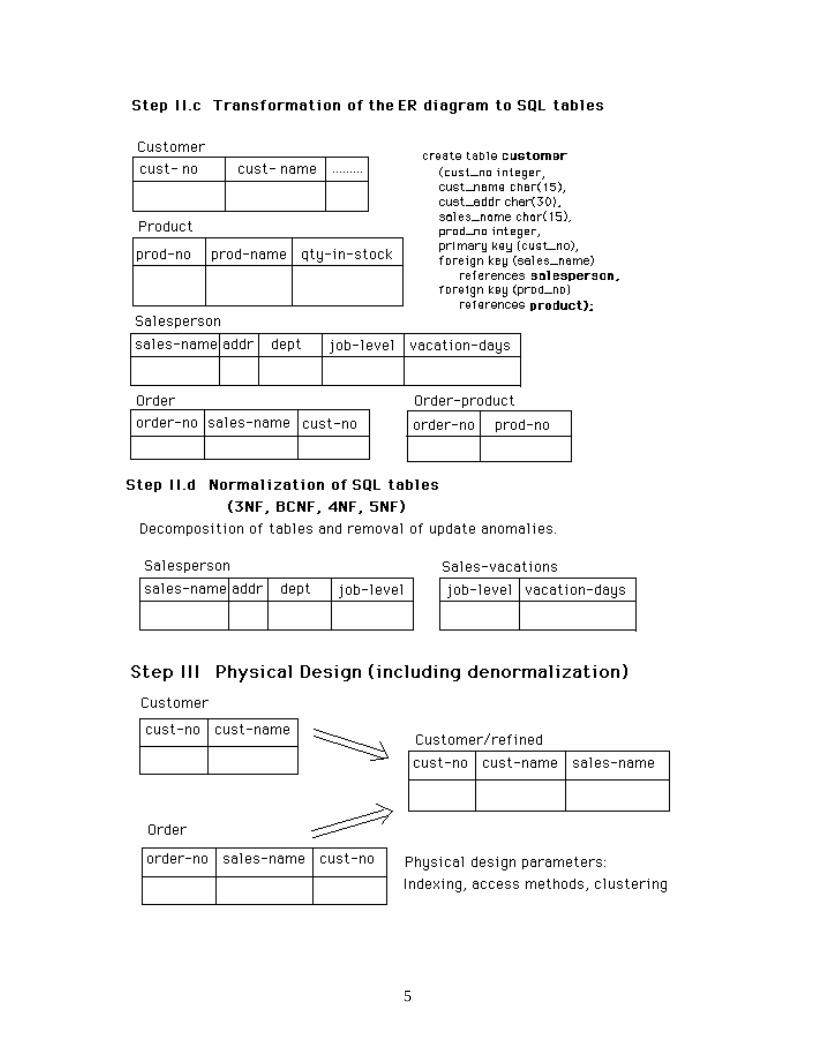
Third Normal Form
TABLE PART (100 rows, 23 bytes/row => 2.3 KB)PNUM PNAME WT Functional dependenciesP1 NUT 12 PNUM --> PNAME, WTP2 BOLT 17P3 WRENCH 17P4 WRENCH 24P5 CLAMP 12P6 LEVEL 19
TABLE SHIPMENT (100k rows, 26 bytes/row => 2.6 MB)SNUM PNUM QTY SHIPDATE Functional dependencyS1 P1 31-4-90 SNUM, PNUM, SHIPDATE--> QTYS1 P2 2 2-17-90S1 P3 6 11-5-89S1 P4 2 6-30-90S1 P5 1 8-12-91S1 P6 5 4-21-91S2 P1 3 5-3-90S2 P2 4 12-31-90S3 P3 4 3-25-91S3 P5 2 3-27-91S4 P2 2 10-31-89S4 P4 3 7-14-90S4 P5 7 8-20-90S5 P5 58-11-91
NOT Third Normal FormTABLE SUPPLIER (200 rows, 37 bytes/row => 7.4 KB)SNUM SNAME STATUS CITY Functional dependenciesS1 SMITH 20 LONDON SNUM --> SNAME, STATUS, CITYS2 JONES 10 PARIS CITY --> STATUSS3 BLAKE 10 PARISS4 CLARK 20 LONDONS5 ADAMS 30 ATHENSDecomposition of Table Supplier into two Third Normal Form (3NF) Tables
38
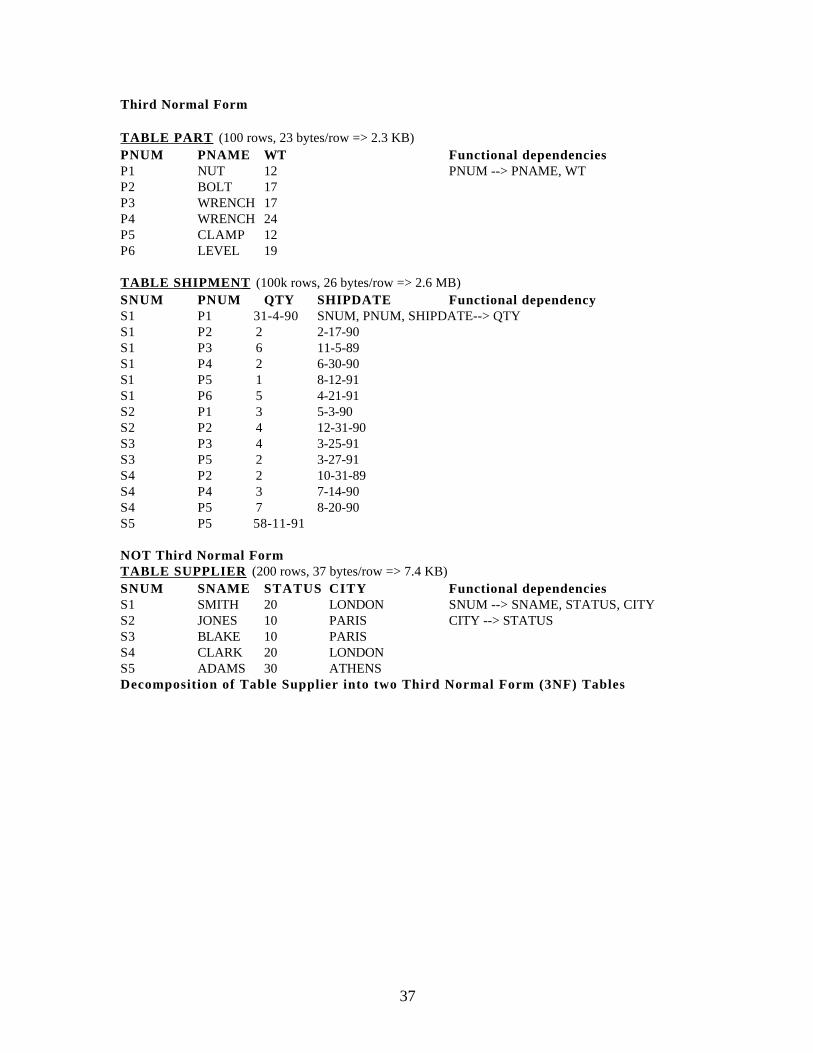
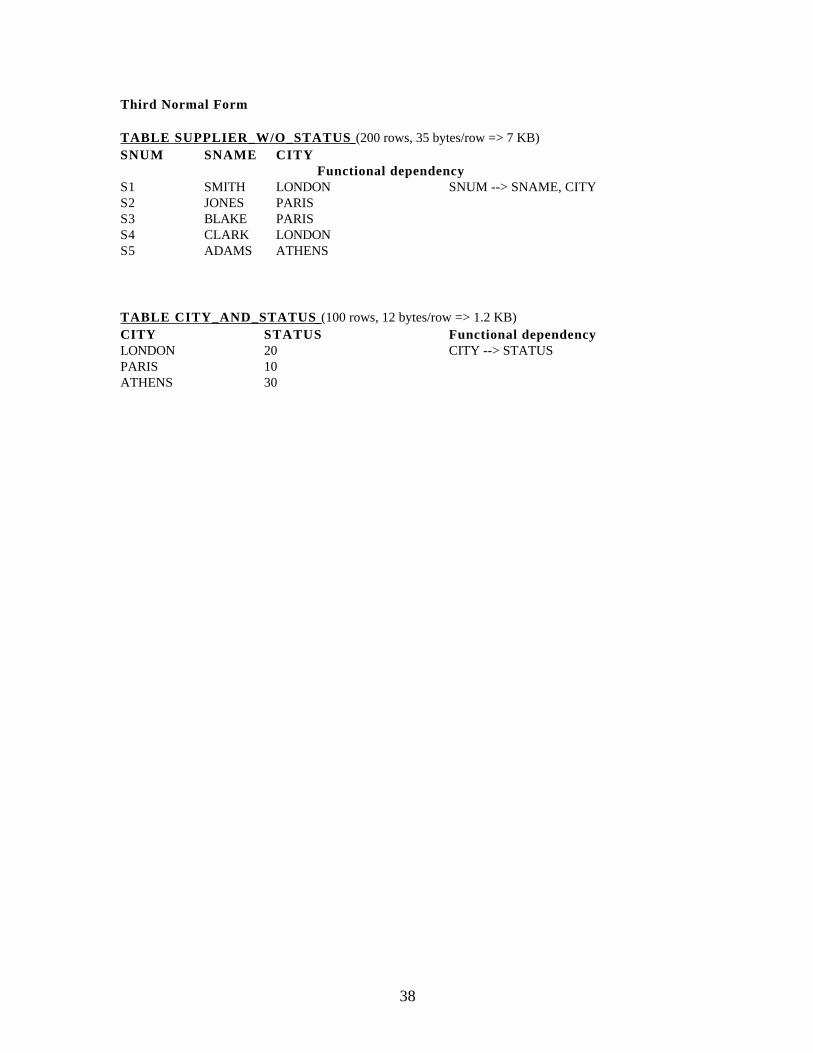
Third Normal Form
TABLE SUPPLIER_W/O_STATUS (200 rows, 35 bytes/row => 7 KB)SNUM SNAME CITY
Functional dependencyS1 SMITH LONDON SNUM --> SNAME, CITYS2 JONES PARISS3 BLAKE PARISS4 CLARK LONDONS5 ADAMS ATHENS
TABLE CITY_AND_STATUS (100 rows, 12 bytes/row => 1.2 KB)CITY STATUS Functional dependencyLONDON 20 CITY --> STATUSPARIS 10ATHENS 30


41
Functional Dependency Inference rules(Armstrong’s Axioms)
1. ReflexivityIf Y is a subset of the attributes of X, then X->Y.X = ABCD, Y = ABC => X->YX->X trivial case
2. AugmentationIf X->Y and Z is a subset of table R (i.e. Z is any set of attributes in R), then XZ -> YZ .
3. TransitivityIf X->Y and Y->Z then X->Z.
4. Pseudo-transitivityIf X->Y and YW->Z then XW->Z.(transitivity is a special case of pseudo-transitivity when W is null)
5. UnionIf X->Y and X->Z then X->YZ.
6. DecompositionIf X->YZ then X->Y and X->Z.
Superkey Rule 1. Any FD involving all attributes of a table definesa super-key on the LHS of the FD.
Given: any FD containing all attributes in the table R(W,X,Y,Z), i.e. XY -> WZ.Proof:(1) XY -> WZ given(2) XY -> XY by the reflexivity axiom(3) XY -> XYWZ by the union axiom(4) XY uniquely determines every attribute in table R, as shown in (3)(5) XY uniquely defines table R, by the definition of a table as having no duplicate rows(6) XY is therefore a super-key, by the definition of a super-key.
Super-key Rule 2. Any attribute that functionally determines aSuper-key of a table, is also a super-key for that table.
Given: Attribute A is a super-key for table R(A,B,C,D,E), and E -> A.Proof:(1) Attribute A uniquely defines each row in table R, by the def. of a super-key(2) A -> ABCDE by the definition of a super-key and a relational table(3) E -> A given(4) E -> ABCDE by the transitivity axiom(5) E is a super-key for table R, by the definition of a super-key.

42
3NF Synthesis Algorithm (Bernstein)
Basic definitionsg e H set of FDs
H+ closure of H - set of all FDs derivable from H using all the FD inference rules
H’ cover of H - any set of FDs from which every FD in H+ can be derived
H’(non-redundant) – non-redundant cover of H, i.e. a cover which contains no proper subset which is also a cover.
Can be determined with quadratic complexity O(n2).
ExampleGiven a set of FDs H, determine a minimal set of tables in 3NF,while preserving all FDs and maintaining only lossless decomposition/joins.H: AB->C DM->NP D->KL
A->DEFG D->ME->G L->DF->DJ PR->SG->DI PQR->ST
Step 1: Eliminate any extraneous attributes in the left hand sides of the FDs. We want to reduce the left hand sides of as many FDs as possible. In general: XY->Z and X->Z=> Y is extraneous (Reduction Rule 1)
XYZ->W and X->Y => Y is extraneous (Reduction Rule 2)For this example we mix left side reduction with the union and decomposition axioms:
DM->NP => D->NP => D -> MNPD->M D->M
PQR->ST => PQR->S, PQR->T => PQR->.TPR->S PR->S PR->S
Step 2: Find a non-redundant cover H’ of H, i.e. eliminate any FD derivable from others in H using the inference rules (most frequently the transitivity axiom).
A->E->G => eliminate A->G from the coverA->F->D => eliminate A->D from the cover
Step 3: Partition H’ into tables such that all FDs with the same left side are in one table, thus eliminating any non-fully functional FDs. (Note: creating tables at this pointwould be a feasible solution for 3NF, but not necessarily minimal.)
R1: AB->C R4: G->DI R7: L->DR2: A->EF R5: F->DJ R8: PQR->TR3: E->G R6: D->KLMNP R9: PR->S

43
Step 4: Merge equivalent keys, i.e. merge tables where all FD’s satisfy 3NF.
4.1 Write out the closure of all LHS attributes resulting from Step 3, based on transitivities.
4.2 Using the closures, find tables that are subsets of other groups and try to merge them. Use Rule 1 and Rule 2 toestablish if the merge will result in FDs with super-keys on the LHS. If not, try using the axioms to modify the FDsto fit the definition of super-keys.
4.3 After the subsets are exhausted, look for any overlaps among tables and apply Rules 1 and 2 (and the axioms)again.
In this example, note that R7 (L->D) has a subset of the attributes of R6 (D->KLMNP). Therefore we merge to asingle table with FDs D->KLMNP, L->D because it satisfies 3NF: D is a super-key by Rule 1 and L is a super-keyby Rule 2.
Final 3NF (and BCNF) table attributes, FDs, and candidate keys:R1: ABC (AB->C with key AB) R5: DFJ (F->DJ with key F)R2: AEF (A->EF with key A) R6: DKLMNP (D->KLMNP, L->D, w/keys D, L)R3: EG (E->G with key E) R7: PQRT (PQR->T with key PQR)R4: DGI (G->DI with key G) R8: PRS (PR->S with key PR)
Step 4a. Check to see whether all tables are also BCNF. For any table that is not BCNF, add theappropriate partially redundant table to eliminate the delete anomaly.

44
Maier’s Example using 3NF Synthesis[Maier,D. The Theory of Relational Databases, Computer Science Press, 1983]R = {A,B,C,D,E,F,G,H,I,J,K }Functional dependencies (FDs):(1) E --> A B C D F G H I J K (7) H I --> J(2) A B C --> E D F G H I J K (8) I J --> H(3) A B D --> E C F G H I J K (9) H J --> I(4) G --> H I J(5) C F --> K(6) D F --> K
Step 1 - No reduction of determinants necessary.Step 2 - Find nonredundant cover.
(4) G->HIJ => eliminate HIJ from (1), (2), and (3)(7) HI->J => reduce (4) to G->HI, eliminating J from (4)(5) CF -> K => eliminate K from (1) and (3)(6) DF->K => eliminate K from (2)(1) E->DFG => eliminate DFG from (2)(1) E->CFG => eliminate CFG from (3)
Step 3 - Partition into groups with the same left side.G1: E->ABCDFG G6: DF->KG2: ABC->E G7: HI->JG3: ABD->E G8: IJ->HG4: G->HI G9: HJ->IG5: CF->K
Step 4 - Merge equivalent keys, forming new groups. Construct final set of tables, attributes, FDs, and candidate keys.R1: ABCDEFG ( E->ABCDFG, ABC->E, ABD->E with keys E, ABC, ABD)R2: GHI (G->HI with key G)R3: CFK (CF->K with key CF)R4: DFK (DF->K with key DFR5: HIJ (HI->J, IJ->H, HJ->I with keys HI, IJ, HJ)

45
Example of a 3NF table that is not BCNF,i.e. it has further anomalies:S = student, C = course, I = instructorSC -> I For each course, each student is taught by only one instructor. A course may be taught by more than oneinstructor.
I -> C Each instructor teaches only one course.
This table is 3NF with a candidate key SC:SCI student course instructor
Sutton Math Von NeumannSutton Journalism MurrowNiven Math Von NeumannNiven Physics FermiWilson Physics Einstein
Delete anomaly: If Sutton drops Journalism, then we have no record of Murrow teaching Journalism.How can we decompose this table into BCNF?
Decomposition 1 (bad).. . . . . . .eliminates the delete anomalySC (no FDs) and I -> C (two tables)Problems - 1. lossy join
2. dependency SC -> I is not preserved
SC student course IC instructor courseSutton Math Von Neumann MathSutton Journalism Murrow JournalismNiven Math Fermi PhysicsNiven Physics Einstein PhysicsWilson Physics
----------------join SC and IC ------------------SCI’ student course instructor
Sutton Math Von NeumannSutton Journalism MurrowNiven Math Von NeumannNiven Physics FermiNiven Physics Einstein (spurious row)Wilson Physics Fermi (spurious row)Wilson Physics Einstein

46
Decomposition 2 (better).. . . .eliminates the delete anomalySI (no FD) and I -> CAdvantages – eliminates the delete anomaly, losslessDisadvantage - dependency SC -> I is not preserved
SI student instructor IC instructor courseSutton Von Neumann Von Neumann MathSutton Murrow Murrow JournalismNiven Von Neumann Fermi PhysicsNiven Fermi Einstein PhysicsWilson Einstein Dantzig Math (new)Sutton Dantzig (new)
The new row is allowed in SI using unique(student,instructor) in the create table command, and the join of SI and IC islossless. However, a join of SI and IC now produces the following two rows:
student course instructorSutton Math Von NeumannSutton Math Dantzig which violates the FD SC -> I.
Oracle, for instance, has no way to automatically check SC->I, although you could write a procedure to do this at theexpense of a lot of overhead.
Decomposition 3 (tradeoff between integrity and performance)SC -> I and I -> C (two tables with redundant data)Problems -extra updates and storage cost

47
Fourth Normal Form (4NF)
Fourth normal form (4NF) -- a table R is in 4NF iff it is in BCNF and whenever there exists a nontrivial multi-valueddependency (MVD) in R, say X-->>Y, X is a super-key for R.
Multi-valued dependency (MVD)X -->> Y holds whenever a valid instance of R(X,Y,Z) contains a pair of rows that contain duplicate values of X,then the instance also contains the pair of rows obtained by interchanging the Y values in the original pair.
Multi-valued Dependency Inference rules(Berri, Fagin, Howard...1977 ACM SIGMOD Proc.)1. Reflexivity X -->> X2. Augmentation If X -->> Y, then XZ -->> Y.3. Transitivity If X -->>Y and Y -->> Z then X -->> (Z-Y).4. Pseudo-transitivity If X -->> Y and YW -->> Z then
XW -->> (Z-YW).(transitivity is a special case of pseudo-transitivity when W is null)
5. Union If X -->> Y and X -->> Z then X -->> YZ.6. Decomposition If X -->> Y and X -->> Z,
then X -->> Y n Z and X -->> (Z-Y)7. Complement If X -->> Y and Z=R-X-Y, then X -->> Z.8. FD => MVD If X -> Y, then X -->> Y.9. FD, MVD mix If X -->> Y and Z -->> W (where W is contained
in Y and Y n Z is not empty), then X->W.Note: n = intersect
Why is 4NF useful?Avoids certain update anomalies/inefficiencies.
1. delete anomaly - two independent facts get tied together unnaturally so there may be bad side effects of certaindeletes, e.g. in “skills required” the last record of a skill may be lost if employee is temporarily not working on anyprojects).
2. update inefficiency - adding a new project in “skills required” requires insertions for many records (rows) that toinclude all required skills for that new project. Likewise, loss of a project requires many deletes.
3. 4NF maintains smaller pieces of information with less redundancy.

48
Example of a ternary relationship (many-to-many-to-many) that can be BCNF or 4NF depending onthe semantics associated with it.Table NF 2-way 3-way Nontrivialname decomp. decomp. MVDs
skill_available BCNF yes yes 6skill_required BCNF yes yes 2skill_in_common 4NF no yes 0
Semantics and analysis of each relationshipskill_required—an employee must have all the required skills for a project to work on that project.skill_required empno projec t skill Nontrivial MVDs
101 3 A project->>skill101 3 B project->>empno101 4 A101 4 C102 3 A102 3 B103 5 D
empno project empno skill project skill101 3 101 A 3 A101 4 101 B 3 B102 3 101 C 4 A103 5 102 A 4 C
102 B 5 D103 D
2-way lossless join occurs when skill_required is projected over {empno, project} and {project, skill}. Projection over{empno, project} and {empno, skill}, and over {empno, skill} and {project, skill}, however, are not lossless. 3-waylossless join occurs when skill_required is projected over {empno, project}, {empno, skill}, {project, skill}.

49
skill_in_common—an employee must apply the intersection of available skills to the skills needed for different projects.In other words if an employee has a certain skill and he or she works on a given project that requires that skill, then he orshe must provide that skill for that project (this is less restrictive than skill_required because the employee need not supplyall the required skills, but only those in common).
skill_in_common empno project skill101 3 A101 3 B101 4 A101 4 B102 3 A102 3 B103 3 A103 4 A103 5 A103 5 C
empno project empno skill project skill101 3 101 A 3 A101 4 101 B 3 B102 3 102 A 4 A103 3 102 B 4 B103 4 103 A 5 A103 5 103 C 5 C
This has a 3-way lossless decomposition. There are no 2-way lossless decompositions and no MVDs, thus the table is in4NF.

50
V. Access Methods
Types of Queries
Query type 1: access all records of a given type“Increase everyone’s salary by 10%”access method: sequential processing
Query type 2: access at most one record“Find the address of John Smith,whose id number is 333-44-5555”
access methods: hashing, B+ tree index
Query type 3: access a subset of records of a given type“Find all employees who have C programming experience and over three years with the company”access method: secondary indexing (Oracle uses B+trees for this)
Sequential Access Methods
lra = n logical record accessessba = ceil(n/bf ) sequential block accessesrba = 0 random block accesses
iotime = sba*Tsba + rba*Trba seconds
where Tsba is the average disk i/o service time for a sequential block and Trba is the average disk i/o service time for a random block access
Disk service time in a dedicated environmentsequential block access:Tsba = rot/2 + bks/tr
where rot is the disk rotation time (for a full rotation),bks is the block size in bytes (bf*record size), andtr is the disk transfer rate in bytes per second.
Trba = seek(avg) + rot/2 + bks/trwhere seek(avg) is the average seek time over the extent of the file on disk

51
D isk service time in a shared environment
Tsba = Trba = seek(avg) + rot/2 + bks/trwhere seek(avg) is the average disk seek time over the extent of the entire disk.
Batch processing of k sequentially stored records
read the transaction file: lra = k where k = number of transaction recordssba = ceil(k/tfbf) where tfbf is the transaction file blocking factor
read the master file: lra = nsba = ceil(n/bf) where bf is the master file blocking factor
write a new master file: lra = n + adds - deletessba = ceil((n+adds-deletes)/bf)
where adds is the number of records added or inserted,and deletes is the number of records deleted.

52
Random Access Methods
Hashing
Basic mechanism – transformation of a primary key directly to a physical address, called a bucket (orindirectly via a logical address)
Collisions – handled by variations of chained overflow techniques
random access to a hashed file lra = 1 + overflow(avg)rba = 1 + overflow(avg)
insertion into a hashed file lra = 1 + overflow(avg) + rewriterba = 1 + overflow(avg)rba=1 for the rewrite

53
Extendible Hashing* number of buckets grow or contracts* bucket splits when it becomes full (based on first i bits of hash value)* collisions are resolved immediately, no long overflow chains* primary key transformed to an entry in the Bucket Address Table (BAT), typically in RAM* BAT has pointers to disk buckets that hold the actual data* Retrieve a single record = 1 rba (access the bucket in one step)
* Cost (service time) of I/O for updates, inserts, and deletes is the same as for B+-trees

54
B-trees and B+-trees
B-tree index basic characteristics* each node contains p pointers and p-1 records* each pointer at level i is for a data and pointer block at level i+1* i=1 denotes the root level (single node or block)• can be inefficient for searching because of the overhead in each search level

55
B+-tree index basic characteristics* eliminates data pointers from all nodes except the leaf nodes* each non-leaf index node has p pointers and p-1 key values* each pointer at level i is for an index block (of key/pointer pairs) at level i+1* each leaf index has a key value/pointer pair to point to the actual data block (and record) containingthat primary key value* leaf index nodes can be logically connected via pointers for ordered sequence search* hybrid method for efficient random access and sequential search
Example: B+ -treeTo determine the order of a B+-tree, let us assume that the database has 500,000 records of 200 byteseach, the search key is 15 bytes, the tree and data pointers are 5 bytes, and the index node (and datablock size) is 1024 bytes. For this configuration we havenon-leaf index node size = 1024 bytes = p*5 + (p-1)*15 bytesp = floor((1024+15)/20) = floor(51.95) = 51number of search key values in the leaf nodes = floor ((1024-5)/(15+5))=50h = height of the B+-tree (number of index levels, including the leaf index nodesn = number of records in the database (or file); all must be pointed at from the next to last level, h-1
ph-1(p-1) > n(h-1)log p + log(p-1) > log n(h-1)log p > log n-log(p-1)h > 1 + (log n-log(p-1)) / log ph > 1 + (log 500,000-log 49)/log 50 = 3.34, h=4 (nearest higher integer)
A good approximation can be made by assuming that the leaf index nodes are implemented with ppointers and p key values:
ph > nh log p > log nh > log n/log p
In this case, the result above becomes h > 3.35 or h = 4.

56
B+-tree performance
read a single record (B+-tree) = h+1 rba
update a single record (B+-tree) = search cost + rewrite data block= (h+1) rba + 1 rba
general update cost for insertion (B+-tree)=search cost (i.e., h+1 reads)
+simple rewrite of data block and leaf index node pointing to the data block (i.e., 2rewrites)+nos*(write of new split index node+ rewrite of the index node pointer to the new index node)+ nosb*(write of new split data block)
= (h+1) rba + 2 rba + nos*(2 rba) + nosb*(1 rba)
where nos is the number of index split node operations required and nosb is the number of data splitblock operations required
general update cost for deletion (B+-tree)= search cost (i.e., h+1 reads)
+ simple rewrite of data block and leaf index node pointing to the data block (i.e.,2 rewrites)+ noc*(rewrite of the node pointer to the remaining node)
= (h+1) rba + 2 rba + noc*(1 rba) where noc is the number of consolidations of index nodes required.
As an example, consider the insertion of a node (with key value 77) to the B+-tree shown in Fig.6.6. This insertion requires a search (query) phase and an insertion phase with one split node. Thetotal insertion cost for height 3 is
insertion cost = (3 + 1) rba search cost + (2 rba) rewrite cost+ 1 split *(2 rba rewrite cost)
= 8 rba
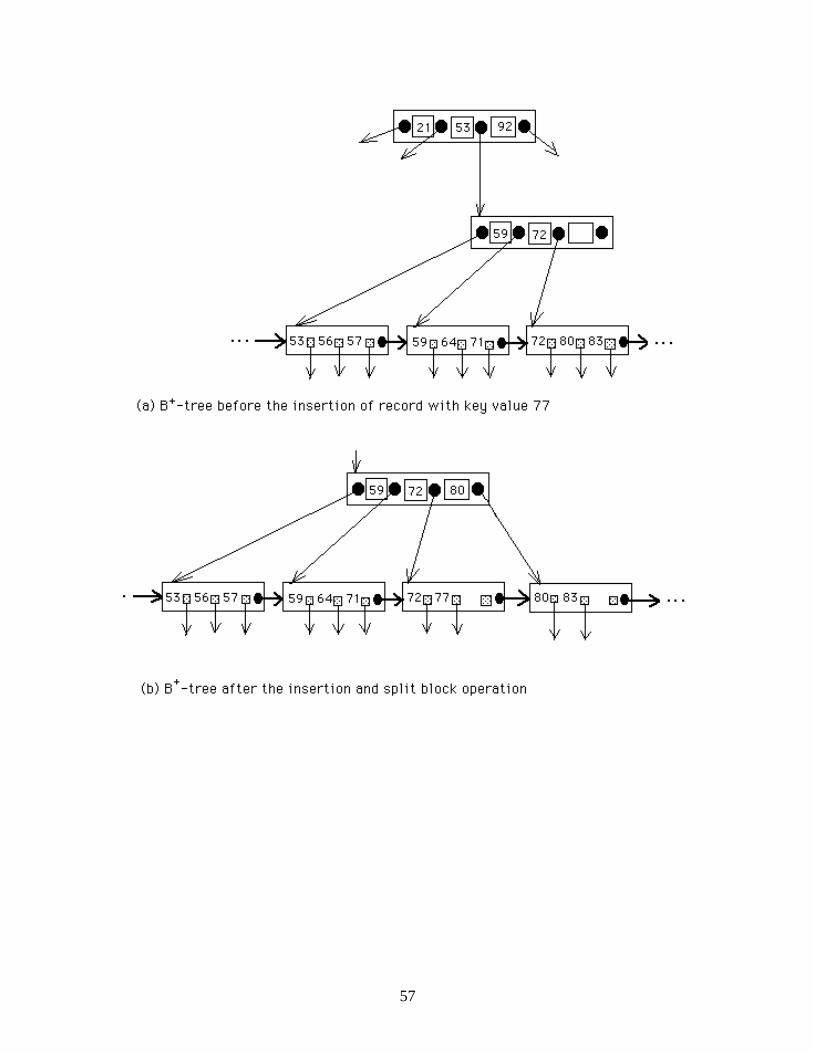
57

58
Secondary Indexes
Basic characteristics of secondary indexes* based on Boolean search criteria (AND, OR, NOT) of attributes that are not the primary key
* attribute type index is level 1 (usually in RAM)
* attribute value index is level 2 (usually in RAM)
* accession list is level 3 (ordered list of pointers to blocks containing records with the givenattribute value)
* one accession list per attribute value; pointers have block address and record offset typically
* accession lists can be merged to satisfy the intersection (AND) of records that satisfy more thanone condition
Boolean query cost (secondary index)
= search attribute type index + search attribute value index+ search and merge m accession lists + access t target records
= (0 + 0 + sum of m accession list accesses) sba + t rba
= (sum of m accession list cost) sba + t rbawhere m is the number of accession lists to be merged and t is the number of target recordsto be accessed after the merge operation.
accession list cost (for accession list j) = ceil(pj/bfac) sbawhere pj is the number of pointer entries in the jth accession list and bfac is the blockingfactor for all accession lists
bfac = block_size/pointer_size
* assume all accesses to the accession list are sequential
* ignore the error incurred by assuming the first record access is sequential
• use the 1% rule(any variable affecting the result by less than 1% is ignored)

59
Example: Mail Order BusinessAssume we have a file of 10,000,000 records of mail order customers for a large commercialbusiness. Customer records have attributes for customer name, customer number, street address, city,state, zip code, phone number, employer, job title, credit rating, date of last purchase, and totalamount of purchases. Assume that the record size is 250 bytes; block size is 5000 bytes (bf=20); andpointer size, including record offset, is 5 bytes (bfac=1000). The query to be analyzed is “Find allcustomers whose job title is ‘engineer’, city is ‘chicago’, and total amount of purchases is greaterthan $1,000.” For each AND condition we have the following hit rates, that is, records that satisfyeach condition:job title is ‘engineer’: 84,000 recordscity is ‘chicago’: 210,000 recordstotal amount of purchases > $1000: 350,000 recordstotal number of target records that satisfy all three conditions = 750
query cost (inverted file)= merge of 3 accession lists + access 750 target records

60
= [ceil(n1/bfac) + ceil(n2/bfac) + ceil(n3/bfac)] sba + 750 rba
= [ceil(84,000/1000) + ceil(210,000/1000) + ceil(350,000/1000] sba+ 750 rba
= (84+210+350) sba + 750 rba= 644 sba + 750 rba
If we assume Tsba is 10 milliseconds and Trba is 25 milliseconds, we obtainquery iotime (secondary index)
= 644 sba*10 ms + 750 rba*25 ms= 25190 ms= 25.19 sec (much more efficient than sequential scan, see below)
query iotime (sequential scan)= ceil(n/bf) sba *Tsba= ceil(10,000,000/20)*10 ms= 5,000,000 ms= 5000 sec

61
Secondary Indexes using B+-trees
* used by Oracle and many others for non-unique indexes
* index nodes contain key/pointer pairs in the same way as a primary key index using a B+-tree
* key at each level, leaf and non-leaf, is the concatenation of attributes used in the query , e.g.jobtitle, city, total_purchases (as attributes of consumer)
* leaf node pointers are to the blocks containing records with the given combination of attributevalues indicated in the concatenated keys
* analysis of queries and updates for this type of index proceeds in the same way as a primary key(unique) index, keeping in mind that the key formats are different in the two cases


63
Table Denormalization Algorithm
1. Select the dominant processes based on such criteria as high frequency of execution, high volumeof data accessed, response time constraints, or explicit high priority.
2. Define join tables, when appropriate, for the dominant processes.
3. Evaluate total cost for storage, query, and update for the database schema, with and without theextended table, and determine which configuration minimizes total cost.
4. Consider also the possibility of denormalization due to a join table and its side effects. If a jointable schema appears to have lower storage and processing cost and insignificant side effects, thenconsider using that schema for physical design in addition to the original candidate table schema.Otherwise use only the original schema.

64
Join Strategies
1. nested loop: complexity O(mn)2. merge-join: complexity O(n log2 n)
3. indexed join: complexity O(2m)4. hash-join: complexity O(m+n)
where m and n are the rows of the two tables to be joinedAssume
* assigned_to table has 50,000 rows* project table has 250 rows* let the blocking factors for the assigned_to and project tables be 100 and 50, respectively, andthe block size is equal for the two tables.* the common join column is project_name.
select project_name, emp_idfrom project as p, assigned_to as awhere p.project_name = a.project_name;
Nested Loop Case 1: assigned_to is the outer loop table.join cost = m/bfm + m*n/bfn
= 50,000/100 + 50,000*250/50= 500 + 250,000= 250,500 sequential block accesses (sba)
If a sequential block access requires an average of 10 ms, the total time required is 2505 seconds.
Nested Loop Case 2: project is the outer loop table.join cost = 250/50 + 250*50,000/100
= 5 + 125,000= 125,005 sequential block accesses (or 1250 seconds)
Note that this strategy does not take advantage of row order for these tablesMerge-Join Case 1: Both project and assigned_to are already ordered by project_name.
join cost = merge time (to scan both tables)= 50,000/100 + 250/50= 505 sequential block accesses (or 5 seconds)
Merge-Join Case 2: Only project is ordered by project_name.join cost = sort time for assigned_to + merge time (to scan both sorted tables)
= (50,000*log2 50,000)/100 + 50,000/100 + 250/50
= (50,000*16)/100 + 500 + 5= 8505 sequential block accesses (or 85 seconds)

65
Merge-Join Case 3: Neither project nor assigned_to are ordered by project_name.join cost = sort time for both tables + merge time for both tables
= (50,000*log2 50,000)/100 +(250*log2 250)/50 + 50,000/100
+ 250/50= 8000 + 40 + 500 + 5= 8545 sequential block accesses (or 85 seconds)
select project_name, emp_idfrom project as p, assigned_to as awhere p.project_name = a.project_nameand p.project_name = ‘financial analysis’;
Indexed join basic algorithm:join cost = scan entire first table (assigned_to)
+ access second table (project) qualifying rows = 50,000/100 sba + 100 rba =500 sba + 100 rba
If Tsba=10 ms and Trba=40 ms, then the total iotime is 9 seconds.As in the indexed join example above, let mt=100 and nt=5 qualifying rows for the first and secondtables, respectively.Hash join basic algorithm:join cost = scan first table (assigned_to) + scan second table (project)
+ access qualifying rows in the two tables = 50,000/100 sba + 250/50 sba +100 rba + 5 rba
= 505 sba + 105 rbaThus we get iotime of 9.25 seconds for this case when Tsba=10 ms and Trba=40 ms.

66
VI. Database Distribution Strategies
Overview of Distributed Databases
Distributed database - a collection of multiple, logically interrelated databases distributed over a computer network[OzVa91].
Distributed Database Management System (DDBMS) - a software system that permits the management of adistributed database and makes the distribution transparent to the users. If heterogeneous, it may allow transparentsimultaneous access to data on multiple dissimilar systems.
Advantages
1. Improves performance, e.g. it saves communication costs and reduces query delays by providing data at the sites where itis most frequently accessed.
2. Improves the reliability and availability of a system by providing alternate sites from where the information can beaccessed.
3. Increases the capacity of a system by increasing the number of sites where the data can be located.
4. Allows users to exercise control over their own data while allowing others to share some of the data from other sites.
5. Helps solve more complex database problems.
Disadvantages
1. Increases the complexity of the system and introduces several technical aswell as management challenges especially when geographical and organizational boundaries are crossed.
2. Makes central control more difficult and raises several security issues because a data item stored at a remote site can bealways accessed by the users at the remote site.
3. Makes performance evaluation difficult because a process running at one node may impact the entire network.

67

68
Requirements of a Generalized DDBMS: Date’s 12 RulesRule 1. Local Autonomy. Local data is locally owned and managed, even when it is accessible by a remote site.Security, integrity, and storage remain under control of the local system. Local users should not be hampered when theirsystem is part of a distributed system.Rule 2. No Central Site. There must be no central point of failure or bottleneck. Therefore the following must bedistributed: dictionary management, query processing, concurrency control, and recovery control.Rule 3. Continuous Operation. The system should not require a shutdown to add or remove a node from thenetwork. User applications should not have to change when a new network is added, provided they do not need informationfrom the added node.Rule 4. Location Independence (or Transparency). A common global user view of the database should besupported so that users need not know where the data is located. This allows data to be moved for performanceconsiderations or in response to storage constraints without affecting the user applications.Rule 5. Fragmentation Independence (or Transparency). This allows tables to be split among several sites,transparent to user applications. For example, we can store New York employee records at the New York site and Bostonemployees at the Boston site, but allow the user to refer to the separated data as EMPLOYEES, independent of theirlocations.Rule 6. Replication Independence (or Transparency). This allows several copies of a table (or portions thereof)to reside at different nodes. Query performance can be improved since applications can work with a local copy instead of aremote one. Update performance, however, may be degraded due to the additional copies. Availability can improve.Rule 7. Distributed Query Processing. No central site should perform optimization; but the submitting site,which receives the query from the user, should decide the overall strategy. Other participants perform optimization at theirown levels.Rule 8. Distributed Transaction Processing. The system should process a transaction across multiple databasesexactly as if all of the data were local. Each node should be capable of acting as a coordinator for distributed updates, and asa participant in other transactions. Concurrency control must occur at the local level (Rule 2), but there must also becooperation between individual systems to ensure that a “global deadlock” does not occur.Rule 9. Hardware Independence. The concept of a single database system must be presented regardless of theunderlying hardware used to implement the individual systems.Rule 10. Operating System Independence. The concept of a single database system must be presented regardlessof the underlying operating systems used.Rule 11. Network Independence. The distributed system must be capable of communicating over a wide variety ofnetworks, often different ones in the same configuration. Standard network protocols must be adhered to.Rule 12. DBMS Independence (Heterogeneity). The distributed system should be able to be made up ofindividual sites running different database management systems.

69
What are the basic issues in the design and implementation ofdistributed database systems?
* Data Distribution Strategies- Fragmentation- Data allocation- Replication- Network data directory distribution
* Query Processing and Optimization
* Distribution Transparency- location, fragmentation, replication, update
* Integrity- Transaction management- Concurrency control- Recovery and availability- Integrity constraint checking
* Privacy and Security- Database administrators
* Data Manipulation Languages- SQL is the standard- Forms coming into common use

70
Modified Life Cycle for Data Distribution
IV.1 Fragmentation (or partitioning). Define a fragmentation schema of the database based on dominantapplications’ “select” predicates (set of conditions for retrieval specified in a select statement). A fragmentation schemadescribes the one-to-many mapping used to partition each global table into fragments. Fragments are logical portions ofglobal tables which are physically located at one or several sites of the network.
IV.2 Data allocation. Create a data allocation schema that indicateswhere each copy of each fragment is to be stored. The allocation schema defines at which site(s) a fragment is located. Aone-to-one mapping in the allocation schema results in non-redundancy, while a one-to-many mapping defines a redundantdistributed database. The set of fragments of a global table, located at a given site, constitutes its physical image at thatsite.
FragmentationA table r is fragmented by partitioning it into a number of disjoint sub-tables (fragments) r1, r2, ..., rn. These fragments
contain sufficient information to reconstruct the original table r.
Horizontal fragmentation partitions the rows of a global table into subsets. A fragment r1 is a selection on the
global table r using a predicate Pi, its qualification. The reconstruction of r is obtained by taking the union of all
fragments.
Vertical fragmentation subdivides the attributes of the global table into groups. The simplest form of verticalfragmentation is decomposition. A unique row-id may be included in each fragment to guarantee that the reconstructionthrough a join operation is possible.
Mixed fragmentation is the result of the successive application of both fragmentation techniques.
Rules for Fragmentation
1. Fragments are formed by the select predicates associated with dominant database transactions. The predicates specify attribute values used in the conjunctive (AND) and disjunctive (OR) form of select commands, and rows (records) containing the same values form fragments.
2. Fragments must be disjoint and their union must become the whole table. Overlapping fragments are too difficult to analyze and implement.
3. The largest fragment is the whole table. The smallest fragment is a single record. Fragments should be designed to maintain a balance between these extremes.

71
Data DistributionData distribution defines the constraints under which data allocation strategies may operate. They are determined by thesystem architecture and the available network database management software. The four basic data distribution approachesare :* Centralized
In the centralized database approach, all the data are located at a single site. The implementation of this approach issimple. However, the size of the database is limited by the availability of the secondary storage at the central site.Furthermore, the database may become unavailable from any of the remote sites when communication failures occur, and thedatabase system fails totally when the central site fails.* Partitioned
In this approach, the database is partitioned into disjoint fragments, and each fragment is assigned to a particular site.This strategy is particularly appropriate where either local secondary storage is limited compared to the database size, thereliability of the centralized database is not sufficient, or operating efficiencies can be gained through the exploitation of thelocality of references in database accesses.* Replicated
The replicated data distribution strategy allocates a complete copy of the database to each site in the network. Thiscompletely redundant distributed data strategy is particularly appropriate when reliability is critical, the database is small, andupdate inefficiency can be tolerated.* Hybrid
The hybrid data distribution strategy partitions the database into critical and non-critical fragments. Non-criticalfragments need only be stored once, while critical fragments are duplicated as desired to meet the required level of reliability.

72
Distributed Database Requirements
Database Description
1. Conceptual schema (ER diagram)
2. Transactions: functions and data accessed
Configuration Information
1. Sources of data—where data can be located.
2. Sinks of data—where user transactions can be initiated and data transferred.
3. Transaction rate (frequency) and volume (data flow).
4. Processing capability at each site—CPU and I/O capability (speed).
5. Security—data ownership (who can update) and access authorization (who can query) for each transaction.
6. Recovery—estimated frequency and volume of backup operations.
7. Integrity—referential integrity, concurrency control, journaling overhead, etc.
Constraints
1. Network topology: ring, star, bus, etc.
2. Processing capability needed at each site.
3. Channel (link) transmission capacity.
4. Availability—related to mean-time-between-failures (MTBF) and mean-time-to-repair (MTTR).
Objective Functions
1. Response time as a function of transaction size.
2. Total system cost—communications, local I/O, cpu time, disk space.

73
The General Data Allocation Problem
Given1. the application system specifications - A database global schema and fragmentation schema.
- A set of user transactions and their frequencies.- Security, i.e. data ownership (who can update) and access authorization (who can query) for each transaction.- Recovery, estimated frequency and volume of backup operations.
2. The distributed system configuration and software:- The network topology, network channel capacities, and network control mechanism.- The site locations and their processing capacity (CPU and I/O processing).- Sources of data (where data can be located), and sinks of data (where user transactions can be initiated and datatransferred).- The transaction processing options and synchronization algorithms.- The unit costs for data storage, local site processing, and communications.
Findthe allocation of programs and database fragments to sites which minimizes C, the total cost:
C = Ccomm + Cproc + Cstorwhere:
Ccomm = communications cost for message and data.
Cproc = site processing cost (CPU and I/O).
Cstor = storage cost for data and programs at sites.
subject to possible additional constraints on:* Transaction response time which is the sum of communication delays, local processing, and all resource queuing
delays.* Transaction availability which is the percentage of time the transaction executes with all components available.

74
The Non-Redundant “Best Fit” Method
A general rule for data allocation states that data should be placed as close as possible to where it will be used, and thenload balancing should be considered to find a global optimization of system performance.
The non-redundant “best fit” method determines the single most likely site to allocate a fragment (which may be a file,table, or subset of a table) based on maximum benefit, where benefit is interpreted to mean total query and update
references. In particular, place fragment Fi at the site s* where the number of local query and update references by all the
user transactions are maximized.
ExampleSystem Parameters
Avg. Service Time Avg. Service Time Fragment Size Local Query(Update) Remote Query(Update) F1 300 KBytes 100 ms (150 ms) 500 ms (600 ms)F2 500 KBytes 150 ms (200 ms) 650 ms (700 ms)F3 1.0 Mbytes 200 ms (250 ms) 1000 ms (1100 ms)
User transactions are described in terms of their frequency of occurrence, which fragments they access, and whether theaccesses are reads or writes.
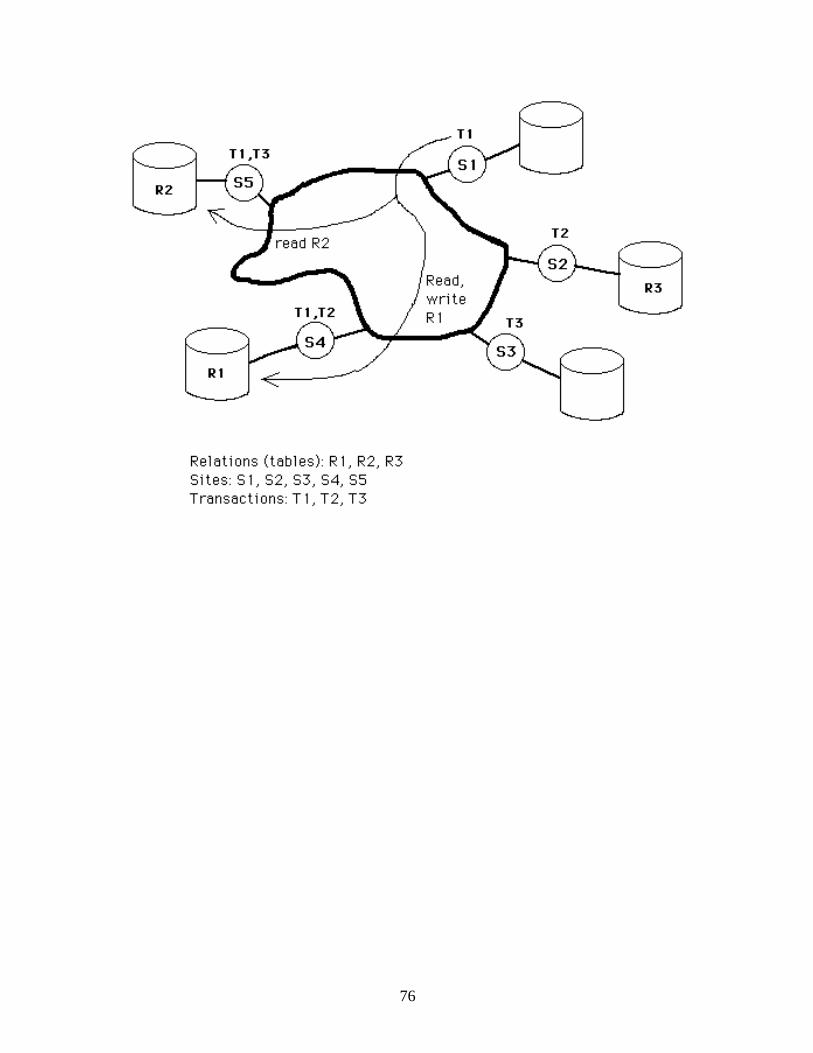
Transact Site(s) Frequency Fragment Accesses ( Reads,Writes)
T1 S1,S4,S5 1 F1 (3 reads, 1 write), F2 (2 reads)T2 S2,S4 2 F1 (2 reads), F3 (3 reads, 1 write)T3 S3,S5 3 F2 (3 reads, 1 write), F3 (2 reads)
Security: User transactions T1,T2,T3 can either query or update (no restrictions).
Sources of data: All sites S1 - S5.Sinks of data (possible locations of transactions): All sites S1 - S5.

75
Local Reference Computations
Our goal is to compute the number of local references to each fragment residing at each site, one by one. The site thatmaximizes the local references to a given fragment is chosen as the site where that fragment should reside.Fragment Site Trans. T1( freq) T2( freq) T3( freq) Total local refsF1 S1 3 read,1 write(1) 0 0 4
S2 0 2 read(2) 0 4S3 0 0 0 0S4 3 read,1 write(1) 2 read(2) 0 8 (max.)S5 3 read,1 write(1) 0 0 4
F2 S1 2 read(1) 0 0 2S2 0 0 0 0S3 0 0 3 read,1 write(3) 12S4 2 read(1) 0 0 2S5 2 read(1) 0 3 read,1 write(3) 14 (max.)
F3 S1 0 0 0 0S2 0 3 read,1 write(2) 0 8 (max.)S3 0 0 2 read(3) 6S4 0 3 read,1 write(2) 0 8 (max.)S5 0 0 2 read(3) 6
Table. Local references for each fragment at each of five possible sites.
Allocation Decision
Allocate F1 at site S4.Allocate F2 at site S5.Allocate F3 at either site S2 or S4 Additional information is needed to choose this allocation. For instance, if maximum availability of data is amajor consideration, then choose site S2 because site S4 already has fragment F1 allocated to it and putting F3 there aswell would decrease the potential availability of data should site S4 crash.
Advantages- simple algorithm
Disadvantages- number of local references may not accurately characterize time or cost (reads and writes given equal weights)- no insights regarding replication
76
77
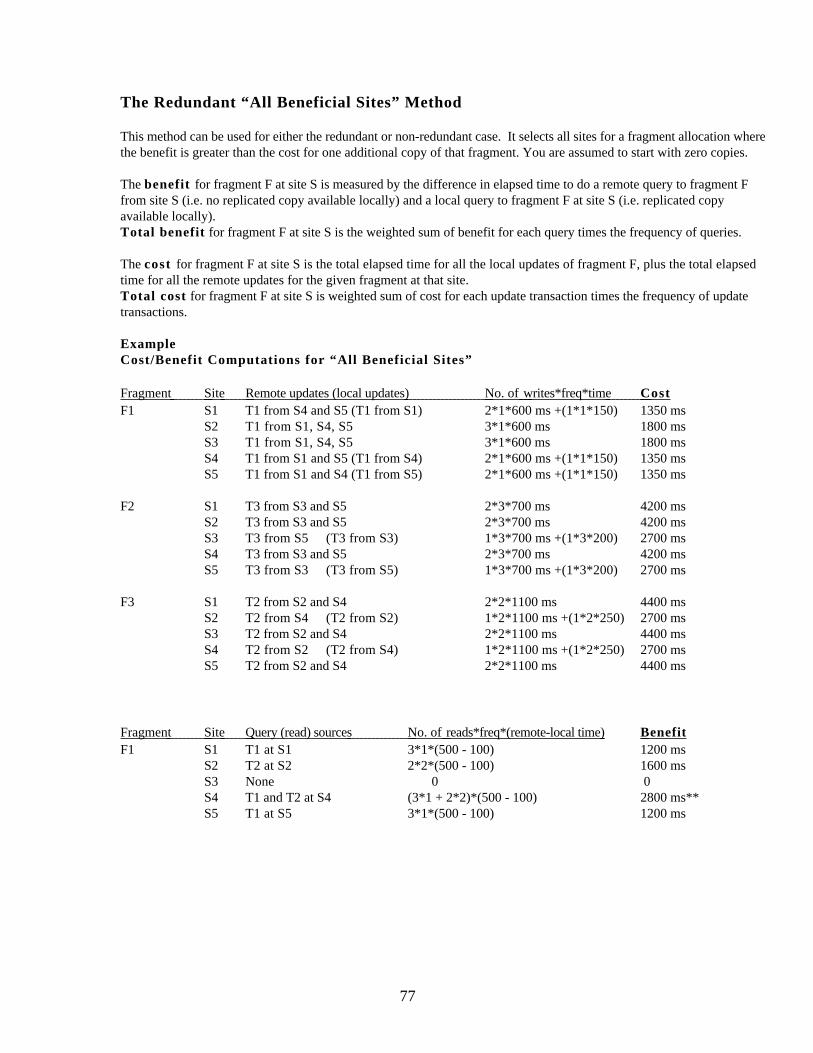
The Redundant “All Beneficial Sites” Method
This method can be used for either the redundant or non-redundant case. It selects all sites for a fragment allocation wherethe benefit is greater than the cost for one additional copy of that fragment. You are assumed to start with zero copies.
The benefit for fragment F at site S is measured by the difference in elapsed time to do a remote query to fragment Ffrom site S (i.e. no replicated copy available locally) and a local query to fragment F at site S (i.e. replicated copyavailable locally).Total benefit for fragment F at site S is the weighted sum of benefit for each query times the frequency of queries.
The cost for fragment F at site S is the total elapsed time for all the local updates of fragment F, plus the total elapsedtime for all the remote updates for the given fragment at that site.Total cost for fragment F at site S is weighted sum of cost for each update transaction times the frequency of updatetransactions.
ExampleCost/Benefit Computations for “All Beneficial Sites”
Fragment Site Remote updates (local updates) No. of writes*freq*time CostF1 S1 T1 from S4 and S5 (T1 from S1) 2*1*600 ms +(1*1*150) 1350 ms
S2 T1 from S1, S4, S5 3*1*600 ms 1800 msS3 T1 from S1, S4, S5 3*1*600 ms 1800 msS4 T1 from S1 and S5 (T1 from S4) 2*1*600 ms +(1*1*150) 1350 msS5 T1 from S1 and S4 (T1 from S5) 2*1*600 ms +(1*1*150) 1350 ms
F2 S1 T3 from S3 and S5 2*3*700 ms 4200 msS2 T3 from S3 and S5 2*3*700 ms 4200 msS3 T3 from S5 (T3 from S3) 1*3*700 ms +(1*3*200) 2700 msS4 T3 from S3 and S5 2*3*700 ms 4200 msS5 T3 from S3 (T3 from S5) 1*3*700 ms +(1*3*200) 2700 ms
F3 S1 T2 from S2 and S4 2*2*1100 ms 4400 msS2 T2 from S4 (T2 from S2) 1*2*1100 ms +(1*2*250) 2700 msS3 T2 from S2 and S4 2*2*1100 ms 4400 msS4 T2 from S2 (T2 from S4) 1*2*1100 ms +(1*2*250) 2700 msS5 T2 from S2 and S4 2*2*1100 ms 4400 ms
Fragment Site Query (read) sources No. of reads*freq*(remote-local time) BenefitF1 S1 T1 at S1 3*1*(500 - 100) 1200 ms
S2 T2 at S2 2*2*(500 - 100) 1600 msS3 None 0 0S4 T1 and T2 at S4 (3*1 + 2*2)*(500 - 100) 2800 ms**S5 T1 at S5 3*1*(500 - 100) 1200 ms

78
F2 S1 T1 at S1 2*1*(650 - 150) 1000 msS2 None 0 0S3 T3 at S3 3*3*(650 - 150) 4500 ms**S4 T1 at S4 2*1*(650 - 150) 1000 msS5 T1 and T3 at S5 (2*1 + 3*3)*(650 - 150) 5500 ms**
F3 S1 None 0 0S2 T2 at S2 3*2*(1000 - 200) 4800 ms**S3 T3 at S3 2*3*(1000 - 200) 4800 ms**S4 T2 at S4 3*2*(1000 - 200) 4800 ms**S5 T3 at S5 2*3*(1000 - 200) 4800 ms**
**sites where benefit > costTable. Cost and benefit for each fragment located at five possible sites.
Advantages- simple algorithm- can be applied to either redundant or nonredundant case- reads and writes given appropriate weights
Disadvantages- global averages of query and update time may not be realistic- network topology and protocols not taken into account

79
VII. Data Warehousing, OLAP, and Data Mining
Data warehouse – a large repository of historical data that can be integrated for decision support
OLTP Data Warehouse Transaction oriented Subject orientedThousands of users Few users (typically under 100)Small (MB up to several GB) Large (100s of GB up to several TB)Current data Historical dataNormalized data (many tables, Denormalized data (few tables,
few columns per table) many columns per table)Continuous updates Batch updatesSimple to complex queries Usually very complex queries
Table 9 1 Comparison between OLTP and Data Warehouse databases
80
Core Requirements for Data Warehousing
1. DWs are organized around subject areas.
2. DWs should have some integration capability.
3. The data is considered to be nonvolatile and should be mass loaded.
4. Data tends to exist at multiple levels of granularity.
5. The DW should be flexible enough to meet changing requirements rapidly. .
6. The DW should have a capability for rewriting history, that is, allowing “what-if” analysis.
7. A usable DW user interface should be selected.
8. Data should be either centralized or distributed physically.

81
Data Warehouse Life Cycle
I. Requirements analysis and specification
1.1 Analyze the end-user requirements and develop a requirements specification. This step follows the practice used byconventional relational databases (see Chapter 1).
1.2 Define the DW architecture and do some initial capacity planning for servers and tools. Integrate the servers, storageelements, and client tools.
1.3 Use enterprise data modeling
II. Logical database design
2.1 Design the enterprise DW schema and views.
2.2 Star schema is the most often used format –- good performance, ease of use
Fact table (one) – very large table containing numeric and/or non numeric attributes, including the primary keysfrom the dimension tables; similar to intersection tables between entities with many-to-many relationships
Dimension tables (several) - smaller tables containing mostly non numeric attributes; similar to relationaltables based on entities
2.3 Snowflake schema – similar to star schema, except dimension tables are normalized
2.4 Fact table family (constellation) – multiple fact tables interact with dimension tables

82

83
Figure 9.6 Snowflake schema for the “order” data warehouse
III. Physical database design
3.1 Indexing (access methods)
join indexes – used to map dimension tables to the fact table efficiently
bit map indexes – used for low selectivity queries
3.2 View materialization – associated with aggregation of data by one or more dimensions such as time or location
3.3 Partitioning – horizontal or vertical subsets of tables to enhance performance

84

85
IV. Data distribution
4.1 Define data placement, partitioning, and replication.
V. Database implementation, monitoring, and modification
5.1 Connect the data sources using gateways, ODBC drivers, etc.
5.2 Design and implement scripts for data extraction, cleaning, transformation, load, and refresh.
5.3 Populate the repository with the schema and view definitions, scripts, and other metadata.
5.4 Design and implement end-user applications. Rollout the DW and applications.

86
On-Line Analytical Processing (OLAP)
Common Features of Multidimensional Databases (MDD)
1. Dimensions –- perspectives or entities about the real world
2. Hypercubes –- basic structure for multidimensional databases
3. Hierarchies –- certain dimensions are hierarchical in nature
4. Formulas –- derived data values can be defined by formulas (sum, average, etc.)
5. Links – links are needed to connect hypercubes and their data sources
OLAP Logical Design
Step 1 – Analyze the end-user requirements and environment
Step 2 – Define cubes, dimensions, hierarchies, and links (high level)
Step 3 – Define dimension members (low level)
Step 4 – Define aggregations and other formulas (derived data)
Aggregation Issues
1. Which data to aggregate
2. How to store aggregate data
3. When to pre-aggregate derived data
• Pre-aggregate nothing
• Pre-aggregate nothing, but save the materialized view (dynamic)
• Pre-aggregate everything (static)
• Pre-aggregate selectively, based on known statistics

87

88

89

90
Data Mining
Definition – data mining is the activity of sifting through large files and databases to discover useful, nonobvious, andoften unexpected trends and relationships
The Knowledge Discovery in Databases (KDD) Process
1. Data selection and cleaning
2. Data transformation and reduction
3. Data mining
4. Interpretation and evaluation
5. Taking action on the discovery
Data Mining Methods
1. Predictive modeling
2. Database segmentation
3. Data summarization and link analysis
4. Dependency analysis or modeling
5. Change and deviation analysis
6. Optimization searching

91

92