DATABASE FOR WELLS AND UTILIZATION ... - · PDF file2.4.1 Creating a database ... (exploration...
28
Report 8, 1990 DATABASE FOR WELLS AND UTILIZATION OF WW TEMPERATURE GEOTHERMAL SOURCES Mohamed Magdy Mabgoub, UNU Geothermal Training Programme, Orkustofnun - National Energy Authority, Grensasvegur 9, 108 Reykjavik, ICELAND Pennanent address: "REGWA", Research Department, 19 Emad El Din Street, P.O.Box 747, Cairo, EGYPT
Transcript of DATABASE FOR WELLS AND UTILIZATION ... - · PDF file2.4.1 Creating a database ... (exploration...

Report 8, 1990
DATABASE FOR WELLS AND UTILIZATION OF WW TEMPERATURE GEOTHERMAL SOURCES
Mohamed Magdy Mabgoub, UNU Geothermal Training Programme, Orkustofnun - National Energy Authority, Grensasvegur 9, 108 Reykjavik, ICELAND
Pennanent address: "REGWA", Research Department, 19 Emad El Din Street, P.O.Box 747, Cairo, EGYPT

3
ABSTRACf
SQL "Structured Query Language", a relational database language, was used to design suitable database tables for the management of all data about geothermal wells in Egypt. These database tables and their corresponding queries, views, and indexes contain information about drilling data, casing design, chemical analysis of water, locations of wells, types of different logs done in each well and detailed lists of measurements. Data from 43 wells located in the Mosfellssveit low temperature field (15 km east of Reykjavik) were organized using the SQL tables. Discussed are some possible direct applications of using low temperature waters in Egypt. These applications include the piping of geothermal fluids, use of heat pumps and fundamentals of space heating design.

4
TABLE OF CONTENlS Page
ABSTRACT .....................•........... ... •..•..•..•..•..•...... . . 3
TABLE OF CONTENlS ...........•.. . ........•..•.... .. . . •..•..•..•..... 4
LIST OF F1GURES .............. . .........•..•..•.............. • .. • ..... 5
I. INTRODUcnON . . ... .............................. .. ....... . ....... 6
2. DATABASE STRUCTURE FOR INFORMATION ABOUT WELLS IN EGYPT ... 7 2.1 Introduction .................... . .............................. 7 2.2 Data organization . ............................................. _ 7 23 Choice of database: relational database, dBASE IV, SQL and PC ........... 9 24 Design of SQL database tables ....... .. . .. ... .. ............... . .... 9
2.4.1 Creating a database .......... . . ............... . .. ....... . 9 2.4.2 Creating tables .... . ....... .. .....•..•..•..• . .•..•.. . .. .. 9 24.3 Inserting data in created tables . . . . . . . . . . . . . . . .. . . . . . • . . . . . .. 9 2.4.4 Creating indexes. . . . . . . . . . . . . . . . . . . . . . . . . . . . . . . . . . . . . . .. 10 24.5 Creating views ...... .. . ... .. .. .............. . . .. . ... . .. 10 24.6 Perfonning queries ....•. . , . . .. . .. . . . . . .. . . . . . . . . . . . . . . .. 10 24.7 Plotting graphs. . . . . . . . . . . . . . . . . . . . . . . . . . . . . . . . . . . . . . . .. 10
3. UTILIZATION OF A LOW TEMPERATURE GEOTIIERMAL SOURCE ....... 12 3.1 Introduction ... ...................... .. . .. . ................... 12 3.2 Hot water transmission. . . . . . . . . . . . . . . . . . . . . . . . . . . . . . . . . . . . . . . . .. 12
3.2.1 Calculating the pressure drop through a pipeline . . .. . ... . ...... 13 3.2.2 Temperature losses through pipes ... ... . .... ........... .... 14
3.3 Use of heat pumps to upgrade a low temperature reservoir .... . .. .. ..... 15 3.4 Space heating design . ... .. ...... .... .. ............... . ......... 18
3.4.1 Introduction................... .. ............ . .. .. ..... 18 3.4.2 Design of panel heating system. . . . . . . . . . . . . . . . . . . . . . . . . . . .. 19
3.4.2.1 Main design parameters ........ ................ ... 19 3.4.22 Calculation of heat flow . .. . . .. . .. . .. . .. . .. . .. .. . . . 20 3.4.23 Calculation of mean water temperature and outlet temp. . . 20 3.4.24 Calculation of bot water mass flow required .. .......... 21 3.4.25 Calculation of pressure drop through heating pipes ...... 21 3.4.26 Regulation of floor temperature in the panel heating system 21
3.4.3 Design of air blower heating system . ........... ............. 22
4. CONCLUSIONS AND RECOMMENDATIONS . .. .. .. . .................... 24
ACKNOWLEDGEMENTS .................... . ... .... .................... 25
NOMENCLATURE ...................•..•................. .. ........... 26
REFERENCES. .. . . .. . . . .. . .. .. .. . . . . .. . .. . . .. . .. . .. . . .. . .. . .. . .. . . . ... 27
APPENDIX A: The LOCATION database table ............................... 29
APPENDIX B: An output example of the PRESSURE program ....... , . . . . . . . . . .. 30

5
UST OF FIGURES Page
1. Structures of the designed database tables . ... ............. . ........... . . . 8 2. Temperature map at lOO m depth for the Mosfellssveit geothermal field. . . . . . . .. 11 3. Possible direct uses of geothermal water in Egypt. . . . . . . . . . . . . . . . . . . . . . . . .. 12 4. Pressure drop through pipes . . . . . . . . . . . . . . . . . . . . . . . . . . . . . . . . . . . . . . . . .. 14 5. Use of isolated pipes in hot water transmission. . . . . . . . . . . . . . . . . . . . . . . . . . . . 15 6. Temperature drop in hot water pipes ......... ......... . .... .. .... . .. . . 16 7. Heat pump schematic diagram ................................. . . .. ... 16 8. Schematic diagram of an absorption refrigeration cycle . . . . . . . . . . . . . . . . . . . . .. 17 9. Coefficient of performance ................. . .......... . ......... . .. " 17 10. Combined panel heating and air heater systems ....................... . . .. 18 11. A cross-section through a panel heating system ........... .. .... . ......... 19 12. Pipeline distribution through a panel heating system ..... • . . • .. • .. •.. • .. ... 19 13. Control system in panel heating ........................ • . . • ..... • . .... 22 14. Simple design of an air heater ......... . ............• .. • .. • .. • .. • . .... 22 15. Basic components for circulating and heating cold air .... • . .•. .• . . • .. • ... .. 23

6
1. INTRODUCIlON
The author had the honour to participate in the UNU Geothermal Training Programme, held at Orkustofnun - the National Energy Authority, Iceland between April 30th and October 30th, 1990. The Geothermal Training Programme was designed and executed as follows:
• Introductory lectures for five weeks, including topics connected with geothermal research, i.c. geology (exploration and borehole), geophysics (exploration and borehole), geochemistry, drilling and reservoir engineering.
• Specialized training for four weeks including lectures and practical training on geophysics, reservoir engineering and modelling.
• Visits to some low and high temperature fields in Iceland. Lectures were given about the geothermal development of these fields.
• In the last two months the author undertook training in two phases: the first was the designing of the database system to manage all data about water wells in Egypt, using dBASE N and SOL languages; the second phase included selected topics about direct applications, using low temperature water. These topics included transmission of hot water in pipes, use of heat pumps and space heating design.

7
2 DATABASE STRUCI1JRE FOR INFORMATION ABOUT WELLS IN EGYPT
21 Introduction
Several hundreds of drilled water wells exist all over Egypt and about 25-30 new wells are drilled every year. The depth of these wells varies from 50 m for shallow wells to approximately 1000 m for deep wells. Consequently, the drilling and completion program varies significantly from one well to another. Water from these wells is mainly used in irrigation, for drinking and in some industries.
The main source of thermal water in Egypt is the deep artesian water wells located mainly in the oasis area in the Western Desert region. The average depth of these wells is 650 m; most of them are in free flow.
The General Company Of REsearch and Ground WAter "REGWA" is a national Egyptian drilling company, and is one of the pioneer companies in the Middle East for drilling water wells. It participates in many huge agricultural and research projects in Egypt and other arab countries, like Libya and Sudan.
There is a wide variety of data about drilled wells in Egypt. For example, drilling data contains information about bit sizes, drill string assemblies, rig used, drilling depth, casing and screen design, description of cementation processes and all equipment used upon well completion. Data about locations of wells contain the coordinate values for each well, mostly the elevation above mean sea level and a detailed description of the location. Also available are a lot of data about the chemical analysis of water samples from wells, logging measurements and pumping tests.
22 Data organization
The following database tables were created to manage data about geothermal wells in Egypt: l. The DRILLING table contains information about well identification (well key), bit sizes and the
start and finish depth of drilling. 2. The CASING table contains information about well key, casing and/or screen diameters, and their setting depths. 3. The CASINGTYPE table describes the materials of the casings (screens) and their properties. 4. The LOCATION table contains information about well key, well name, the coordinates, elevation above mean sea level, the grid number and a detailed description of the location. 5. The GRID table defines the boundaries of each grid number (longitudes and latitudes). 6. The JOB and JOBTYPE tables include information about all jobs done in the well like drilling, measurements, development, pumping test, work over ... etc. 7. The LOGDONE table (measurements in the well) includes all types of logs done, their numbers, start and completion dates, the equipment used in measurements and the logger name. Four tables are extracted from the LOGDONE table:
· The LOGV AL table contains detailed values measured, the measureme~lt number and measurement depth. · The LOGTYPE table describes the log type done and its identification number. · The LOGGER table gives the full name of the logger and his identification number. · The TOOLS table gives a full description of the equipment used and its identification number.

8
8. The CHEMIS1RY table contains data about cation and anion concentrations in different water samples for each well, however, the ultimate design of this table will be finalized according to the required elements to be analyzed in Egypt.
In designing the above mentioned tables, we tried to satisfy the following: - no redundant information to avoid update anomalies. - no repeating of columns to simplify processing. - minimum number of tables to minimize inter-table navigation.
Figure 1 shows the structures of the designed database tables.
~ JHD-HSp-9000-Magdy L'J:::J 9O.10.0499-T
DRIWNG
...., ..... ........ ".. ... -- -, _.
/-... .., ..... -~ - • - - "
LOCATlOH
..... -CASOHG
,,--.~ ".
- -- ~ ..... ' · ..... 1 ".-,
grid_no -~ .IOBTTPE - """ "". eft(8) ..... .. ..... , ,... .-
-~ ""30)
LOG""'"
..- -~ ...... - "'" GA'D - '" • - ~. .. .. ""-" -" " """ ~
~
/ 'OGV~
- - .... "" '" "' .• "' .• ""
FIGURE 1: Structures of the designed database tables
- • "--.... ... .• "' .• •
~nP< Le] • ",,30)
...,. - ..... "". """ "'.,
'OOLS

9
23 Choice of database: relational database, dBASE N, SQL and PC
In order to store all available types of data about wells and retrieve them in a quicker and more efficient way, it was decided to use dBASE N language (Ashton Gate, 1988) and focus mainly on its embedded SOL language.
Data storage, using dBASE Nand SQL languages gives valuable information about drilling conditions, locations of aquifers, approximate well design and expected productivity. It also saves a lot of effort and money in drilling and exploring new wells.
dBASE N is a database management system, a powerful tool for managing data. Electronic data processing means that vast amounts of information can be stored, related, manipulated and retrieved. This is usually accomplished by designing the database files and their corresponding forms, queries and reports.
SQL is an advanced relational database language that operates on data entirely as logical sets called tables. SQL has a small and concise set of commands able to display, define, update and print the information contained in way of what to do not how to do. An SQL database table is expressed as a collection of rows and columns. The intersection between each row and column contains a data value. An SQL view is a subset of rows and columns of one or more existing database tables. An SQL query is a normal SQL table which can display all or specific columns of a table in any order and even specific information (rows) can be selected within each column. SQL indexes provide a quicker and efficient retrieval of data from tables (see Sayles and Kerr, 1989).
A set of dBASE N commands can be used to enhance the performance of SQL
24 Design of SQL database tables
24.1 Creating a database
This is the first step in designing SQL tables and is performed by using the CREA1E DATABASE command. When a database is created, a subdirectory of the database name is created and a set of catalog tables are created in this directory.
242 Creating tables
After creating or specifying the database name in which the table to be created will exist, the CREATE command is used to specify each column name and the type of data that will be included in this column. The data type may be an integer, decimal, numeric, character, date or logical.
243 Inserting data into created tables
This is done by either using the INSERT command or the LOAD command to add new rows (fields) to the tables. Using the INSERT command we specify particular values to be inserted into the columns of a table, or insert data from specified roVlS qualified by a SELECf statement. The LOAD command appends data from an external file to an existing SQL table.

10
This external file may be either a database file (.DBI'), framework II database file (.FW2), delimited format ASCU file (DELIMITED), system data format ASCll file (SDF), Visicalc format files (DII'), or Lotus format file (WKS). Appendix A shows the LOCATION database table with inserted data using the WAD command.
24.4 Creating indexes
This is done by using the CREATE INDEX command in onc or more columns, called the index keys.
24.5 Creating views
The CREATE VIEW command is used to specify the optional columns to be displayed from one or morc tables.
24.6 Perfornting queries
Queries act as views but the result is not stored as in the case with views. SELECT is the basic command used to perform queries. Other commands are specified with the select command to build search or multi-search conditions with the aid of arithmetic, logical and relational operators. A complete syntax of a query may include the clauses: SELECf, FROM, WHERE, GROUP BY, HA VlNG, ORDER BY and SA VB TO TEMP.
Updating and deleting data in a table or a view is available by using the UPDATE and DELE1E commands, respectively. UPDA1E command replaces the old rows with the new specified conditions. DELETE removes rows in a similar way. Also the updating and deleting of tables is accomplished by using the ALTER command (to add a new column) and the DROP command to delete the table and its corresponding indexes, views and synonyms.
24.7 Plotting graphs
By exporting a report file to an ASCII file, it is possible to append this file to any graphical computer program and perform the required grapbs. Figure 2 shows a contour temperature map (in QC) at 100 m depth for the Mosfcllssvcit low temperature field.

~ JHD.HS~-OOOO.Magdy ~ 90.10.0507
, = Well Locolion
11
, I , I o 100 200 300m
FlGURE 2: Temperature map at lOO m depth for the Mosfellssveit low temperature field

12
3. UTILIZATION OF A LOW TEMPERAlURE GEOTIIERMAL SOURCE
3.1 Introduction
Since geothermal water in Egypt is generally characterized by very low temperature fields (30 . 45°C), the possible direct uses of this water are limited. However, the use of heat pumps would probably widen the spectrum of those direct uses, since it provides the necessary temperature boost for a low temperature water source. Figure 3 illustrates the possible direct uses suitable for the conditions of water temperature in Egypt.
In the following sections we are going to briefly describe hot water transmission in pipes, the use of heat pumps and the fundamentals of space heating design.
32 Hot water transmission
There are several factors controlling the design of a piping system for hot water transmission. The basic factors are the pipe material, dissolved chemical components in water, size, installation method, head loss and pumping requirements, as well as insulation effect.
Piping materials are of numerous types. The most common materials are carbon steel, ductile iron, fiber glass, (RTRP), asbestos cement (AC), polybutylene (PB), chlorinated polyvinyl chloride (CPVC), polyvinyl chloride (PVC) and polyethylene (PE).
Geothermal fields in Egypt are low temperature fields (35 - 500e). Water from most wells contains a slightly higher concentration of ferric oxides (0.5 mgll). POlybutylene pipe is recommended for transmitting thermal water from wells. This is because polybutylene is virtually
Water temperature, °C
o 10 20 30 40 50 60 70 60 90 100 110 120 130 140 150
Warm irrigation and greenhouses
L-J Soil warming
Animal husbandry
L....J Swimming pOOls
90.10.0418
FIGURE 3: Possible direct uses of thermal water in Egypt

13
impervious to most chemicals in water, lighter in weight than metallic pipes and less expensive in price and installation cost (6 USS/ft). This type of piping is available in sizes ranging from 2 - 18 inches_
321 Calculating pressure drop through a pipeline
In a single phase flow liquid, the pressure drop dp (m of water) through a circular pipe of a diameter d (m) and length I (m) resulting from a uniform flow rate m (kg/s) can be expressed by the following formula (see e_g. Kjartansson, 1984):
where:
dp= 2 flV>1 gd,
dp = pressure drop, m of water, f = friction factor, dimensioniess, I = pipe length, m, d = inside pipe diameter, rn, g = acceleration due to gravity, 9.8 m/s2,
v = fluid velocity, m/s.
Reynolds number (Re) is defined as follows:
where:
Re = yvdil' = 4mh,dl',
y = fluid density, kg/ml, m = mass flow rate, kg/s, I' = dynamic viscosity, kg/ms.
(3.1)
For rough pipes the coefficient of friction f could be calculated from the Colcbrook equation:
II.[f = -2 log 2.51/(Re.lf)+ 0.27 <Id, (3.2)
where: € = average pipe roughness height, mm.
Substituting the value of f obtained from Equation 3.2 in Equation 3.1, the value of dp can be calculated. Other methods for calculating dp include charts and the computer program PRESSURE (see Appendix B).
Figure 4 shoVlS the results of calculating the pressure drop through three different pipes of diameters 200 mm, 240 mm, and 320 mm, respectively, assuming a flow rate of 25 Vs hot water (4S°C) and a roughness height of O.OOS mm.
322 Temperature losses through pipes
Consider a constant flow of thermal water passing through a polybutylene pipe buried in the soil at depth h (m) from ground surface as shown in Figure 3.3, where r1 = inner radius of pipe, f2
= outer radius, and r3 = insulation radius, (m).

L W ~
o
11
10
• 9 -o VI L
.& 8 W
E
6
5
~ JHO-HSI>-9OO:)-Magdy ~ 9O.10.00497-T
~ r--------~
"'--
200 240 320
14
r--------r-------
~ ~ ~
mm dio m. mm die m. mm dio m.
o 200 400 600 800
Pipe length. m
"-
1000
FlGURE 4: Pressure drop through pipelines
1200
The temperature T of hot water passing through a pipe at any length I (m) is described by the following equation (for hlr3 greater than 1.5) (see Bjornsson, 1980; Holman, 1989):
where: T = temperature of water at length I, DC, Tao = outer air temperature, DC, T j = inlet water temperature (at I = 0), DC, k = thermal conductivity of the piping system, W/(mDC), m = mass flow of water, kg/s, cp = specific heat capacity at inlet water temperature, J/(kgDC).
(3.3)
We have to determine the value of k in order to solve Equation 3.3 for T. The thermal conductivity of the piping system k is the reciprocal of R, the thermal resistance of the piping system (moC/W). R, in turn, can be expressed as follows:
(3.4)
where the subscripts p, i, s indicate the thermal resistances ID pipe, insulator, and soil

15 Ground surface
T; T
Plastic cover Insulation
50:1
iill-'-'-'- _._._. I' //
FIGURE 5: Use of isolated pipes in hot water transmission
respectively and: Rp = In (r;zlr,)/21fjp Up = thermal conductivity of pipe material, W/m'C), Ri = In (r.,lr,)/21fj; Ui=thermal conductivity of insulator, W/m'C), R, = (In 2(h+r3)/r3)/21rj, U,=thermal conductivity of soil, W/m'C).
Values of jp, ji' js are taken from tables, and they depend on the materials used.
h
90.10.0416
Solving for the above values of R and substituting in Equation 3.4 we get R (piping thermal resistance) and the reciprocal of R is the value of k. Substitute in Equation 3.3 with the value of k and assuming different values for I (pipe length in m) we get the corresponding temperature T.
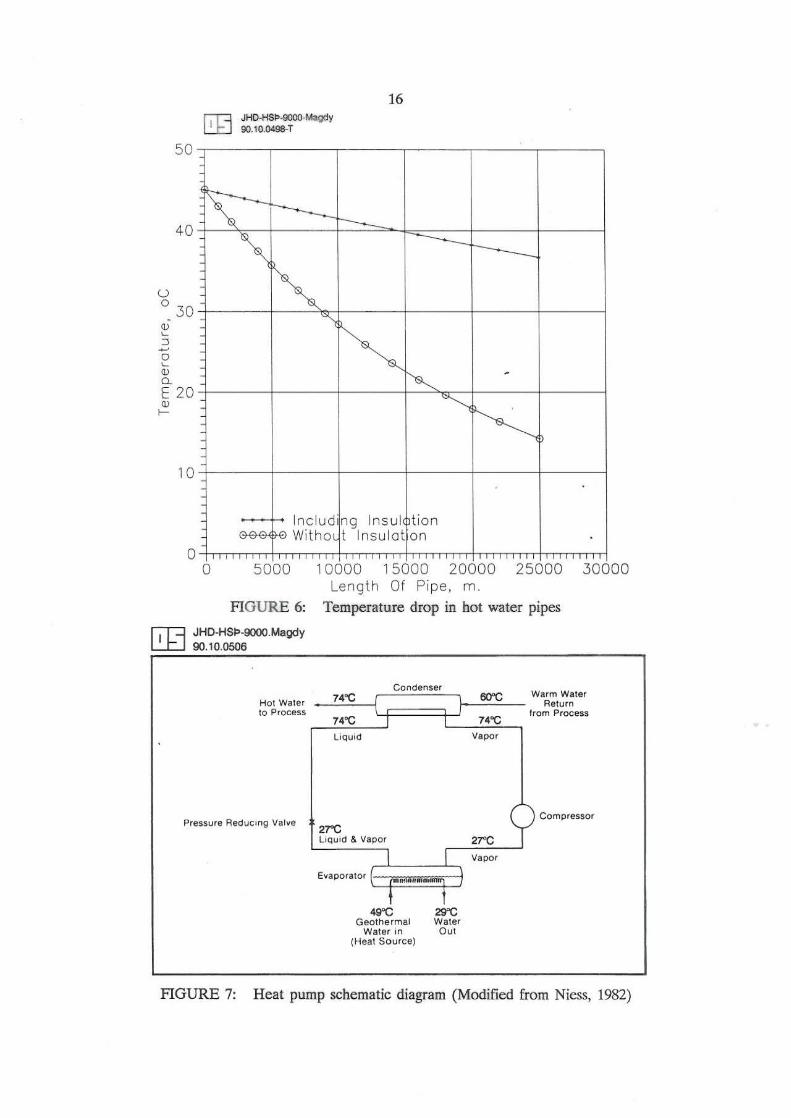
Figure 6 shows the results of calculating the temperature drop across a 4 inch polybutylene pipe both with insulation and without insulation, assuming the following values:
T1• [2> [3 = 0.0974, 0.11, 0.18 m respectively, Ti, Tao = 4SOC, O"C respectively, m = 8 kg/s, cp = 4182 J/kg'C, jp, j;, j, = 0.4, 0.026, 0.6 (W/m'C).
33 Use of heat pumps to upgrade a low temperature source
They are special kinds of pumps which provide the necessary temperature boost to concentrate the heat from a low temperature source (see e.g. Lienau and Lunis, 1989; McMullan and Morgan 1981).
In a heat pump cycle the heat from low temperature water is absorbed into the heat pump's evaporator by the working fluid, which is then increased in temperature and pressure by the compressor. From there it goes to the condenser where this heat is transferred to the hot water for providing heat up to 1l0"C. Figure 7 shows a schematic diagram of a heat pump using a condensable vapour as a refrigerant (vapour compression cycle).
50
40
u 0
30 ~ ~
o -o ~
<l> Cl.
E 20 <l> f-
10
o
JHD-HSp-9QOO-Magdy 9O.IO-0496-T
16
I"
o
.~
~
5000
~ "'"
-""-,
~
Includ ng Insu l t ion Wi thol t Insu lat on
10000 15000 20000 25000 30000 Leng th Of Pipe, m.
FIGURE 6: Temperature drop in hot water pipes
IjT'=l JHD-HSI'>-9000.Magdy L..:....CJ 90 1 0 0506
74"C 6O"C Warm Water Hot Water Return ,==~~==~~C~O~"~d'~"~"~'t;~~~~~ 10 Process trom Process
74"C 74"C
Pressure Reducong Valve
liqUId Vapor
27"C LiqUId & Vapo.
() Compressor
~-,2,,-7"C-,,----.J '( I I
EvaporatOr E~;;;;~3 -~ .. ,.J Jc
vapa.
Geothermal Water Water in Out
(Heat SOurce)
FIGURE 7: Heat pump schematic diagram (Modified from Niess, 1982)

Condenser
(7) Qc
Throttling valve
(8(
Evaporator
(6)
Woo, I solution t
(1)
17
Generator T.=Te. PJ=P4=PS
(4) L--'-__ -'\-___ -'
Regulating valve
(5( , _______ -,
Cooling QA ..... ater
(2)
(3)
t Strong . solution
Pump
90.10.0421
FIGURE 8: Schematic diagram of an absorption refrigeration cycle (Wark, 1988)
In an absorption refrigeration cycle the compressor is replaced by an absorber, a pump, a generator and a valve as shown in Figure 8. A secondary fluid or absorbent is used to circulate the refrigerant. When using ammonia as a refrigerant, water is considered the absorben t medium. When water is used as a refrigerant, lithium bromide is used as an absorbent medium. The measure of efficiency of a heat pump, called the coefficient of performance (COP), is shown in Figure 9. This is the ratio of the upgraded heat output to the thermal equivalent of the heat pump electrical input (COP) and ranges roughly from 3 to 7. An industrial waterto-water heat pump provides both heating and cooling.
Since geothermal fields in Egypt are referred to as low temperature reservoirs (temperatures range from 35-50"C, by applying the principals of heat pumps, it is possible to widen the temperature diagram and possible direct applications. There are two basic configuration sizes available commercially: reciprocating and centrifugal. Centrifugal machines are used for the largest applications while reciprocating are used for smaller capacities.
r.r::t JHO--HSp·9000.I.1agdy
Coeff icient of Performance (COP) ru 9O.IO.0505-GyOa
7
• ,
• 3
o 10 20 30 40 50 60 70
Leaving Source Temperature, °C
FIGURE 9: Coefficient of performance (Niess, 1982)

18
3.4 Space beating design
3.4.1 Introduction
Oasis areas, located in the Western Desert of Egypt, are considered the main sources of geothermal water. More than 250 wells exist in the oasis area and the temperature of water ranges from 35 - 500C. Water is mainly used for irrigation and bathing.
Oasis areas are characterized by a dry arid climate. During the summer, for example in July, a maximum temperature of 4SOC during the day and a minimum of 22°C at night is measured. In winter, for example in January, a maximum of 18QC and a minimum of ere is measured. During the colder months the source of heat for a farmer's house is mainly via stoves and gas, which are very inconvenient. Big buildings like hospitals, schools and governmental buildings suffer a lack of heating. Hot water coming from wells in such areas could be used as a heat supplying source for large buildings, houses, schools and factories.
The power demand for a space heating system depends on different factors, like wall construction and isolation, air infiltration and the difference between indoor and outdoor air temperature. For a given building, these factors can be calculated and summed up to give the total power demand in kW. Doing such calculations is out of the scope of this report. Instead an estimated value for the power demand per cubic meter of house volume is used. In Ice land, a value of 30 W/m3 is often used for houses with good insulation, with an indoor and outdoor temperature difference of 35°C. With reference to M. Rachedi (1989), a value of 66 W/m3 was calculated for houses with poor insulation, assuming a difference of 20°C between indoor and outdoor temperatures. Here, the power demand is estimated to be 50 W/m3.
To demonstrate the main steps in designing a space heating system, we consider a house with a floor area of 100 m2 and a wall height of 3 m, thus giving a house volume of 300 m3. The power demand is, therefore, 50 x 300 = 15 kW. Now we have to choose the heating equipment. Because the temperature of geothermal water is low, using radiators is not suitable. Instead we choose floor heating (panel heating), that is heating from a piping system in the floor which carries the hot geothermal water.
Because of the limitations on the allowable. floor surface temperature, we need supplementary equipment to fulfill the heat demand. A combined air heater and blower is chosen as a secondary heating system. An air heater takes a mixture of outer air and recirculated indoor
4S'C 35' C Air heater
35'0 ----1 Panel heating
fu Outlet water
90.10.0420
FIGURE 10: Schematic diagram of combined panel heating and air heater systems

19
floor surface
b
-~ 8 8 -0-I. a .1. a .1
concrete
90.10.0419
FlGURE 11: A cross-section through a panel heating system
air, heats it up and blows it into the room using a fan. The geothermal water is cooled down in the air heater to a temperature suitable for entry into the floor heating system. Thus, the geothermal water runs serially through both heating systems, as shown in Figure 10.
3.4.2 Design of panel heating system
3.4.2.1 Main design parameters
A cross-section of a floor with panel heating is shown in Figure 11. The pipes are made of plastic, either polybutylene or poJypropyJene. Two possible pipeline distributions are shown in Figure 12.
I
water in
outerwaU
I I
! i
I • I I _ . - f- _ .
C-
~ I water out
I i
~
I I
I
I I
water In
L
(
(
outer wall
I I
U
lJ I
I
water out
[.' , JHO_OOOO_ ~j 90.10.0423
FIGURE 12: Pipeline distribution through a panel heating system

20
The main design parameters for our panel heating design as seen from Figure 11 are:
pipe outer diameter d, 20 mm, spacing between pipe centres at 200 mm, buried depth of pipe (to the centre) 6, 40 mm, total pipe length I, 500 m, thermal conductivity of concrete le, 1.5 W/moC, inlet water temperature T i• 35°C, floor surface temperature T[) 26°C, indoor air temperature T ail 20"C.
3.4.2.2 Calculation of heat Dow
The maximum floor surface temperature T f has been chosen as 26°C. With this design condition, the heat flow from the panel heating system in Figure 11 can be calculated as follows:
where:
Of = h A (Tf - T,;),
Qc = heat flow from the floor, W. h = heat transfer coefficient, W/m20C, A = floor surface area, m2
•
(3.5)
In general, the heat transfer coefficient h depends on the geometry of the heat flow surface and on the temperature difference (Tr - Tai)' It can be taken from tables or calculated by empirical formulas.
With h = 9 W/m"'C, the heat flow from Equation 3.5 is:
Of = 9 x lOO x (26-20) = 5400 W = 5.4 kW.
3.4.23 Calculation of mean water temperature and outlet temperature
The thermal insulation under the floor is assumed to be so good that the heat flow downwards from the pipes can be neglected. Accordingly, the up heat flow can be described by the following equation (Halldorsson and Sigurjonsson, 1987):
where:
Or = A dTm 1[(1.15 a I .. k. log aI ... d) + RJ,
dTm
k R
= mean temperature difference between water temperature, °c,
= thermal conductivity of concrete, 1.5 W/moC, = thermal resistance above the pipe, (m20C/W).
(3.6)
temperature and indoor air
The thermal resistance R is composed of two parts: heat conduction from the pipe centre to the floor surface and heat convection from the floor surface to the air. It can be calculated as follows:
R = 6/k + l/h = 0.04/1.5 + 1/9 = 0.138 m"'C/W

21
The heat transfer calculated from Equation 3.5 must be equal to that calculated from Equation 3.6, thus dTm from Equation 3.6 is 9"C.
Now the outlet water temperature To can be calculated from the equation:
And we find that To = 25"C.
3.4.24 Caleulation of hot water mass flow requirod
Assuming m is the mass flow required (kgls) to produce an upbeat flow Or. then:
where: Or = upheat flow, 5400 W, cL = specific heat capacity of water at inlet, 4182 JlktC, dT = T;-To = 35-25 = 10"e.
Substitute with the above values in Equation 3.8 and we get m = 0.11 kg/so
3.4.25 Calculation of pressure drop through heating pipes
(3.7)
(3.8)
The length of the plastic pipes required for the design of a panel heating system as shown in Figure 11 is about 500 meters. So far we have calculated the flow rate through the plastic pipe (0.11 kgls) and the pipe length (500 mete,,). Using the computer program PRESSURE described in section 3.21, the value of pressure drop (dP) is found to be 12.6 m of water (see Appendix B).
3.4.26 Regulation of floor temperature in the panel heating system
When using a combination of a panel heating system and an air heater system, a breakdown or failure in the air heater system sometimes occurs. Thus, the inlet temperature for panel heating T j becomes much higher than the designed value (35QC), as the water entering the air heater system is not cooled (Figure to). Therefore, it is necessary to use a control system to maintain the designed inlet water temperature to the panel heating system. Figure 13 shows a schematic diagram of a simple control system, and as shown, returned water is partially thrown away through the control valve (B) and partially recirculated through the nOD-return valve (C). If the inlet water temperature is too high, the control valve (B) will close partially and more water will be circulated. This circulated water will lower the water inlet temperature. If the water inlet temperature is too low, the control valve (B) will open and the water inlet temperature will increase.

22
Inlet water (35°C)
A: Circulation pump B: Control vaNe c: Non return valve
FIGURE 13: Control system in panel heating
3.4.3 Design of an air blower heating system
:
Panel heating
90,10,0417
An air heater is actually a heat exchanger where hot water is cooled as it flows through pipes located in the heater. Air is heated as it is blown over the pipes by a fan as shown in Figure 14. Inlet air to the heater can be taken from the room or can be a mixture of room air and outdoor air as shown in Figure 15.
rn JHO t$ SIOOO Mlgdy 90.10.0422
sucked
sucked cold air
warm r • • .. air -- • .,. - •• - .. "G "IL;T .- :: .... ~-L ..
et hot water pipes $ hot water pipes
honzontal fan vertical fan
FIGURE 14: A simple design of an air heater

Air heaters (blowers) are commercially available. The designed power of the air heater, inlet water temperature T i,
and outlet water temperature To are the necessary parameters for choosing a suitable air heater type from catalogs. Catalogs also give the value of air temperature at inlet and outlet of the heater, the volume of air circulated, and the fan speed in r.p.m. The inlet air to the heater is actually a mixture of the indoor room air (recirculated) and the outdoor air. Usually in an air heater design, ventilation (mass of ventilated airlhour) is assumed double or triple the volume of the space to be heated.
So far we have calculated the following for our designed heating system:
The total power demand, 15 kW (see section 3.4.1);
The power required for panel heating system, 5.4 kW (Equation 3.5).
Thus, the designed power for the air heater system is:
total power demand - power required for panel heating = 15 - 5.4 = 9.6 kW.
23
90.10.0424
-< -U' -2 ~<E----3
r 1 AIr heater (blower) 2 Air mixing chamber 3 Recirculation air chamber
FIGURE 15: Basic components for circulating and heating of cold air
Now we have the following parameters from which to choose a suitable air heater design from readily available commercial types:
Power required = 9.6 kW, inlet water temperature = 45°C, outlet water temperature = 35°C.
For example, using the catalogs of NOVENCO air heaters published in November, 1989 we can easily choose type VNA - 82, which satisfies the above assumptions. From the catalog we can also find the value of the air temperature out of the heater and the value of the air temperature at inlet, in this case, 24°C and 15°C respectively.

24
4. CONCLUSIONS AND RECOMMENDATIONS
1. Management of data about geothermal wells in Egypt is of great importance, particularly in carrying out geothermal research and exploring new drilled wells. dBASE Nand SQL languages are powerful tools for managing all available data providing quicker, efficient ways to retrieve these data.
2. Geothermal studies of Egypt are few. An intensive study is recommended to cover the oasis areas (Western Desert of Egypt). A similar study is recommended in the Eastern Desert along the Red Sea coast and in the Sinai Peninsula. The purpose of this study is mainly to determine the best potential areas for geothermal water. This is accomplished by estimating the average value of the heat flow and the geothcrmal gradient for the recommended areas of study. Also, in addition to a microseismic study, a geochemicai study is recommended to estimate the reservoir base temperature.
3. Heat pumps are recommended to provide the necessary temperature boost for a low temperature water source. Water-ta-water heat pumps are also recommended to provide both heating and cooling effects.
4. Hot water from wells in the oasis areas can be used for space heating of large buildings such as hospitals, schools, and factories. This can be done by transmitting the hot water from wells through isolated pipelines and by combining panel heating and air heater systems.
5. Other possible direct uses of geothermal water in Egypt may include the use of hot water in soil warming, greenhouses, warm irrigation, animal husbandry and swimming pools.

25
ACKNOWLEDGEMENTS
I would like to express my deep thanks and gratitude to the respected staff of the UNU and to each member of OrkustofnuD. They were really very co-operative and did their best to ensure a successful training programme.
Special thanks go to Dr. Ingvar B. Fridleifsson who gave me the honour of being the first participant from Egypt to receive geothermal training in Iceland, and for his continuous follow up and care of all UNU Fellows.
I also mention with gratitude, the large efforts and valuable directions offered by Hilmar Sigvaldason, Svcrrir Thorhallsson, and Ami Ragnarsson.
I extend my thanks to Ludvik S. Georgsson and Marcia Kjartansson for their kind care for all UNU Fellows from the first day to the last day of training.
And finally my thanks and respects to Ali Werwer, manager of REGWA company, Egypt, who gave me the opportunity to participate in this course.

26
NOMENCLAlURE
A:
1,: dTm:
dp: f: g: h: jj: jp: j,: k: I: m: Of: R: R: Ri: Rp: R,: cl: [2: C3:
Tai:
Tao: Tf:
T,: To: v: y: 6: EO
1':
floor surface area (m') speeific heat capacity of water (J/ktC) pipe inside diameter (m) mean temperature difference eC) pressure drop (meters of water) friction loss factor (dimensionless) acceleration due to gravity (9.8 m/s') heat transfer coefficient (W/m"'C) thermal conductivity of insulating material (W/mOC) thermal conductivity of pipe material (W/mOC) thermal conductivity of soil material (W ImOC) thermal conductivity of piping system (W/m°C) pipe length (m) water mass flow (kg/s) heat flow (kW) thermal resistance of an isolated piping system (m°C/W) thermal resistance above the pipes in a panel heating system (m20ClW) thermal resistance of insulating material (m°C/W) thermal resistance of pipe material (m°ClW) thermal resistance of soil material (m°C/W) inner pipe radius (m) outer pipe radius (m) insulation radius (m) indoor air temperature (OC) outdoor air temperature (OC) floor surface temperature (OC) inlet water temperature eC) outlet water temperature eC) fluid velocity (m/s) fluid density (kg/m') buried depth of pipes in a panel heating system (m) average roughness height in pipes (mm) dynamic visensity (kg/ms)

27
REFERENCES
Ashton Tate, 1988: Using dBASE N. Ashton·Tate Corporation, U.SA
Bjornsson, 0., 1980: Cooling of water in pipes. Orirustofnun, report OS-8OOO8IJHD·04 (in Icelandic), Reykjavik, 40 pp.
Halld6rsson, G. and Sigu~6nsson, J., 1987: Space.heating. Ranns6knastofnun Byggingaridnadarins, report (in Icelandic), Reykjavik, 292 pp.
Holman, J. P., 1989: Heat transfer. McGraw-Hill Book Co., Singapore, 676 pp.
Kjartansson, 0., 1984: Programme for designing heating systems and calculating the feasibility. Orkustofnun, report OS-84094/JHD-18 (in Icelandic), Reykjavik, 110 pp.
Lienau, P. 1. and Lunis, B. C., 1989: Geothermal direct use engineering and design guidebook. U.S. Department of Energy, Idaho, 400 pp.
McMullan, J. T. and Morgan, R., 1981: Heat pumps. Adam Hilger Ltd., Bristol, 156 pp.
Niess, R. C, 1982: High temperature heat pumps can accelerate the use of geothermal energy. Geothermal Resources Council Bulletin, 11, 11, 9-14.
Rachedi, M., 1989: Design of a district heating system for the Hammam Righa spa, Algeria. UNU G.T.P, Iceland, Report 3, 56 pp.
Sayl .. , J. and Kerr, F., 1989: SQL for dBASE N. QED Information Science Inc., Massachusetts, 246 pp.
Wark, K., 1988: Thermodynamics. McGraw-Hill, USA, 787 pp.

29
APPENDIX A:. The LOCATION database table
Well Key Well Name X-Coordinate Y-Coordinate Elevation m a.s.l.
13724 SR-23 1754.433 1754.433 58.8 13721 SR-20 1751.803 1751.803 57.5 13710 SR-09 1761.222 1761.222 57.2 13711 SR-I0 1579.149 1579.149 57.3 13727 SR-26 1823.369 1823.369 56.9 13709 SR-08 1867.090 1867.090 57.9 13708 SR'()7 1868.886 1868.886 57.0 13707 SR-06 1874.090 1874.090 56.1 13706 SR-05 1974.372 1974.372 62.9 13705 SR-04 199O.Q28 1990.028 64.7 13704 SR-03 1999.048 1999.048 65.0 13703 SR-02 2006.665 2006.665 65.2 13702 SR-Ol 2043.574 2043.574 69.9 13719 SR-18 1668.542 1668.542 55.5 13452 SR-30 1621.617 1621.617 44.8 13712 SR-11 1621.015 1621.015 55.5 13714 SR-13 1758.936 1758.936 53.5 13725 SR-24 1924.750 1924.750 50.4 13726 SR-25 1901.703 1901.703 50.4 13728 SR-27 1981.655 1981.655 49.2 13729 SR-28 1972.839 1972.839 49.0 13730 SR-29 1990.080 1990.080 49.5 13723 SR-22 2009.876 2009.876 47.4 13720 SR-19 2079.651 2079.651 46.0 13722 SR-21 2099.086 2099.086 45.6 13453 SR-31 2107.486 2107.486 45.0 13454 SR-32 2126.324 2126.324 44.6 13731 SR-33 2161.618 2161.618 45.0 13732 SR-35 2252.881 2252.881 56.4 13485 SR-37 2344.099 2344.099 55.1 13733 SR-39 1992.511 1992.511 54.0 13734 SR-42 1964.062 1964.062 57.0 12851 SR-40 1935.947 1935.947 49.8 13458 SR-41 1511.810 1511.810 56.0 13456 SR-36 1580.282 1580.282 57.0 13455 SR-34 1603.132 1603.132 56.2 13713 SR-12 1575.806 1575.806 61.0 13459 SR-43 1191.327 1191.327 62.0 13716 SR-15 1327.826 1327.826 57.6 13717 SR-16 1437.277 1437.277 56.1 13718 SR-17 1374.337 1374.337 56.9 13457 SR-38 1356.290 1356.290 57.3 13715 SR-14 1371.751 1371.751 54.7

30
APPENDIX B: An output example of the PRESSURE program
••••••••••••••••••••••••••••••••••••••••••••••••••••••••
PRESSURE DROP IN PIPES
••••••••••••• ••••••••••• •••••••••••••••••••••••••••••••• Pipe outside diameter Pipe wall thickness Pipe length Pipe roughness Water temperature Water flow rate
(mm) (mm) (m) (mm) (0C) (Vs)
20.()()()() 1.8000
500.()()()() 0.0100
35.()()()() 0.1100
Water density (kg/mJ ) 994.0815 Water viscosity (poise) 0.0072 Water velocity (m/s) 0.5207 ReyDolds Dumber 11798.3242 Friction factor 0.0306 Pressure drop (mm H20) 12561.7949 = 12.6 (mH20) ••••••••••••••••••••••••••••••••••••••••••••••••••••••••