Database and Model of Coal-fired Power Plants in the ... Library/Research/Energy Analysis... · of...
40
NETL Contact: Phil DiPietro Office of Systems, Analyses and Planning i Database and Model of Coal-fired Power Plants in the United States for Examination of the Costs of Retrofitting with CO 2 Capture Technology DOE/NETL-402/030809 1 April 2009
Transcript of Database and Model of Coal-fired Power Plants in the ... Library/Research/Energy Analysis... · of...

NETL Contact: Phil DiPietro
Office of Systems, Analyses and Planning
i
Database and Model of Coal-fired Power Plants in the United States for Examination of
the Costs of Retrofitting with CO2 Capture Technology
DOE/NETL-402/030809
1 April 2009
Prepared by: Phil DiPietro
Christopher Nichols Situational Analysis and Benefits Division National Energy Technology Laboratory
Jeffrey Eppink and Michael Marquis
Enegis, LLC
Lynn Manfredo Research and Development Solutions, LLC
Contract Information: DE-AC26-04NT 41817
RDS SUBTASK R402.01.01 Modification D
Disclaimer
This report was prepared as an account of work sponsored by an agency of the United States Government. Neither the United States Government nor any agency thereof, nor any of their employees, makes any warranty, express or implied, or assumes any legal liability or responsibility for the accuracy, completeness, or usefulness of any information, apparatus, product, or process disclosed, or represents that its use would not infringe privately owned rights. Reference therein to any specific commercial product, process, or service by trade name, trademark, manufacturer, or otherwise does not necessarily constitute or imply its endorsement, recommendation, or favoring by the United States Government or any agency thereof. The views and opinions of authors expressed therein do not necessarily state or reflect those of the United States Government or any agency thereof.
Acknowledgements
This work was funded by the U.S. Department of Energy’s National Energy Technology Laboratory (U.S. DOE-NETL). The NETL sponsor for this project was Philip Dipietro, Director, Situational Analysis and Benefits Division, Office of Systems, Analyses and Planning (OSAP), who provided guidance and technical oversight for this study. The authors gratefully acknowledge the significant role played by U.S. DOE/NETL in providing the programmatic guidance and review of this report.
i

Coal-fired Power Plants: Costs of Retrofitting with CO2 Capture Technology
EXECUTIVE SUMMARY Given the importance of coal to power generation in the United States, where coal-fired power plants supply around 50 percent of the Nation’s electricity needs, examination of the costs and practicability for retrofit of existing pulverized coal power plants with CO2 capture technology is a valid exercise. To help elucidate this issue, this study defines a viable population of pulverized coal plants, which were examined individually to determine costs and space availability for retrofit. The task was to assess coal-fired power plants in the U.S. relative to the cost and feasibility for retrofitting with CO2 capture technology. The effort comprised the development of a database and geographic information systems (GIS) modeling analysis of coal-fired power plants in the U.S. to conduct the assessment. The viable population for the analysis was defined as those active plants with a combined unit generation capacity greater than 100 MW, an average heatrate below 12,500 Btu/kWh, and a location within 25 miles of a potential carbon sequestration opportunity. The resultant population totals 324 plants. Of these, 290 had the requisite data to complete the analyses, comprising 275 GW. The plants were then evaluated individually. The analysis is based upon the NETL 2007 publication Carbon Dioxide Capture from Existing Coal-Fired Power Plants (Conesville study) as a foundation for the application of carbon capture retrofit technology in terms of cost and layout. Central to the analysis is the quantitative GIS model, entitled the Carbon Capture Model (CCM). The CCM comprises programmatically linked databases, GIS map documents, and report spreadsheets that calculate capital expense (CAPEX), operating expense (OPEX), and parasitic load associated with retrofitted carbon capture technology. The model evaluates these parameters by scaling costs using the plant-specific parameters and algorithms derived based upon the Conesville study. A GIS imagery analysis of each plant was conducted to modify construction costs due to specific site requirements by assigning construction difficulty factors to retrofit components. Cost-supply curves relative to the viable population were developed. Results of the analysis indicate that, for the 50th percentile (142 GW) of the analyzed viable population, the CO2 capture total cost (calibrated to the Conesville study) would be about $61/tonne or less. To retrofit 90 percent of generation capacity (about 254 GW), the total capture cost would be about $80 per tonne or less. It should be noted that this study provides an overview of the plant sites. It is not an engineering-level analysis of individual plants and does not address the consequences of design.
1
1.0 Introduction The effort comprised the development of a database and geographic information systems (GIS) analysis of a defined population of coal-fired power plants in the U.S. to model the cost and assist in the assessment of the feasibility of retrofitting these plants with CO2
capture technology. This report covers data sources, methodology employed, modeling and results. 2.0 Methodology Fundamentally, this effort is based upon the NETL 2007 publication Carbon Dioxide Capture from Existing Coal-Fired Power Plants (Conesville study) as a foundation for the application of carbon capture retrofit technology in terms of cost and layout. As a central part of the database and analysis effort, the CCM comprises programmatically linked databases, GIS map documents, and report spreadsheets that calculate capital expense (CAPEX), operating expense (OPEX), and parasitic load associated with retro-fitted carbon capture technology. In addition to the Conesville Study, additional references for cost and other information include:
Cost and Performance Baseline for Fossil Energy Plants, (“Baseline Report”), DOE/NETL-2007/1281, Volume 1: Bituminous Coal and Natural Gas to Electricity, Final Report, Revision 1, August 2007
Pulverized Coal Oxycombustion Power Plants (Oxycombustion Report), NETL, Final Results, August 2007
Reduced Water Impacts Resulting from Deployment of Advanced Coal Power Technologies, (Water Report) NETL, Chris Nichols and Phil DiPietro, December 16, 2007
The primary source of data on physical plant parameters such as unit nameplate capacity, heat-rate, and emissions was Ventyx Corporation’s Energy Velocity (EV) Suite, a compilation of energy industry and market databases. 2.1 Viable Population The viable population for the study was initially defined to be operating U.S. coal-fired power plants greater than or equal to 100 MW total nameplate capacity with a weighted average heat-rate equal to or less than 12,500 Btu/kWh. This definition was refined to include a distance to sequestration opportunity criterion. A GIS analysis of each power plant’s proximity to each of three sequestration opportunities: oil and gas fields, saline aquifers, and existing CO2 pipelines was performed. The results show that a total of 324 (83.5%) plants of the viable population are within 25 miles of a sequestration opportunity.
2

Therefore, a 25 mile distance was used to represent a reasonable threshold for a viable transportation of CO2 within the CCM. This is more conservative than NETL’s Bituminous Baseline Final ReportF
1F, where 50 miles was used as an appropriate distance
for CO2 transportation to a saline aquifer. With the addition of distance to the sequestration criterion, the viable population consists of 324 plants. Of these 324 plants, suitable imagery was not available for three, and EV emissions data required for analysis was missing from 31, resulting in a final population of 290 plants that meet selection criteria and data requirements. 2.2 Model Development and Analysis The CCM was developed to merge and analyze the various disparate datasets. It functions by reading parameters from the EV datasets and GIS data sources for the population of plants. The model then calculates the required size and cost for the various CO2 capture components using the Conesville study to determine scaling functionality. Costs are adjusted for construction difficulty, water availability, and additional land requirements. Further detail on the derivation of specific parameters is presented below. The CCM is based upon the Conesville study, which examined the cost and physical footprint requirements of retrofitting the 463.5 MW AEP Conesville Unit 5 with amine-absorber carbon capture technology. Figure 1 illustrates the required equipment. Critical to the CCM is a GIS imagery analysis that identifies construction difficulties associated with space constraints and existing plant layout. This analysis was used to modify the estimated CAPEX to account for increased cost of engineering and construction and the cost of additional land if needed. The Conesville study examined four cases with varying effective CO2 absorption percentages of 90, 70, 50 and 30 percent. The CCM assumes that retrofitted plants will scrub 90 percent of the emitted CO2. Fortunately, the Conesville study assumed use of CO2 absorption equipment with a scrubbing capability of 90 percent—the study’s various cases were achieved by limiting the amount of flue gas diverted to the CO2 absorbers—which allowed an imputed calculation of power plant size if the equipment for each of the cases was operative at 90 percent capacity.
1 Cost and Performance Baseline for Fossil Energy Plants, DOE/NETL-2007/1281, 2007
3

Plant 1497, AES Conesville, ConesvilleOHPlant 1497, AEP Conesville, Conesville OH
Figure 1. Retrofit equipment layout for Conesville Unit 5 Additionally, based upon the Conesville study, the cost of CO2 scrubbers and absorbers did not vary among the scenarios. The assumption was made that these components are not sensitive to the amount of CO2 being scrubbed and therefore not sensitive to the size of the plant. Consistent with the Conesville study for initial purposes, a cost of $17.66 million per retrofitted unit was used in this analysis. These costs will be subject to further refinement. Other components were found to vary in cost among the cases or were dependant upon the presence and effectiveness of current sulfur and nitrous oxide emissions control equipment. A complete retrofit of Conesville Units 4, 5, and 6 was modeled using the Conesville study as a guide. Conesville then served as a baseline for comparison of retrofit difficulty at other plants. Figure 2 shows AEP Conesville retrofitted with carbon capture equipment on its three operating units.
4

45
6
Plant 1497, AEP Conesville, Conesville OHGeneration Units shown in Yellow
Figure 2. Complete Conesville retrofit 2.2.1 SO2 Removal SO2 removal is necessary for amine-absorber carbon capture technology. Accordingly, requirements for flue gas desulfurization (FGD) were assessed for each site for sulfur removal to a level of 98 percent was assessed in terms of cost and space. For sites that have FGD that do not remove sulfur to this level, or for sites without FGD, the need for required FGD equipment was assessed. In addition, to bring sulfur levels to the maximum 10 ppm requirement of the CO2 scrubbers, separate sulfur “polishing” was assessed. Calculations were made in the CCM as follows based upon costs found in literature:
In plants without primary FGD systems, new construction costs of $105.5 per kilowatt capacity for the primary FGD system designed to remove 98 percent SO2, and a value of $94.60/ton for the additional sulfur removed by sulfur polishing down to 10 ppm were used. An example is Conesville’s 841.5 MW Unit 3; currently without primary FGD. At a cost of $105.5/kW, the Conesville Unit 3 FGD would cost $88.5 million for installation of FGD.
In plants with current primary FGD systems, the current SO2 removal percentage was estimated using emissions and coal data from the EV datasets, the marginal SO2 removal needed to achieve 98 percent was calculated and the marginal additional removal requirement was prorated at a cost of $96.5 per kilowatt
5

capacity accordingly. The sulfur polishing cost of $94.60/ton was then applied to the additional sulfur reduction to 10 ppm.
2.2.2 NOx Removal Consistent with the Oxycombustion report, and to be compliant with environmental requirements, the CCM requires NOx emissions to be at or below 0.07 lbs NOx/ million Btu for purposes of CO2 capture. NOx emissions data for each unit was compared to this target rate to determine the additional NOx scrubbing requirement. Using the unit’s total Btu value and an installation cost of $300/tonne NOx, a value for NOx scrubbing cost was calculated. 2.2.3 Construction Difficulty Factors In analyzing the sampled plant sites it became apparent that some plants are more crowded than others. Two construction cost factors were determined to accommodate this situation—a “close-in” cost of construction difficulty factor and a “landscape” cost of construction difficulty factor. Close-in Construction. The letdown turbine, CO2 scrubbers and absorbers, as well as the primary and secondary FGD’s require construction in close proximity to the turbine and flue stack. The layout of some plants can easily accommodate these additional components. However, for plants where space is more crowded, an incremental factor was applied to account for anticipated difficulty in construction. These factors were ranged from 0 (easily constructed) to 40 percent (difficult to construct). Plants with a zero factor were determined to have a construction difficulty comparable to the Conesville baseline plant. Landscape Construction. At the Conesville plant, as depicted in Figure 2, designs were created to individually retrofit Units 4, 5, and 6 with all required components. However, it was assumed that CO2 compression and additional cooling facilities could be combined into larger plant (as opposed to unit) -servicing components. Note that, while some adjustments and accommodations will need to be made, there are no large structures or other significant obstacles to overcome or work around with close-in construction at the Conesville site. The CO2 compression facility and additional cooling towers can be built in proximity to the plant, allowing more latitude for siting them. Still, these components are by far the largest and require significant open space at a plant. Similar to the Close-in factor, values ranged from 0 to 30 percent. 2.2.4 Total Investment CAPEX In the model, Total Investment CAPEX for a plant is determined by the equation: [(Letdown Turbine Cost + CO2 Scrubber and Absorber Cost + FGD Cost + NOx Cost) *
(1+Close-In Construction Difficulty Factor)] * Multiple Unit Discount +
6

(CO2 Separation and Compression Cost + Additional Cooling Cost) * (1+Landscape Construction Difficulty Factor )+ Additional Land Cost
2.2.5 OPEX In the CCM model, OPEX is calculated as the sum of Fixed (Labor) cost, Variable (chemical, waste, and maintenance) costs, and Feedstock cost. Figures 3 to 5 show these costs as a function of the generation capacity of the power plant based on the scenarios in the Conesville study.
y = 2.9701e-0.003x
R² = 0.9597
$-
$0.50
$1.00
$1.50
$2.00
$2.50
$3.00
$3.50
0 200 400 600 800 1000
$/to
nn
e C
O2
MWs
Fixed (Labor) OPEX
Figure 3. Fixed OPEX cost function
y = 8.6317e-5E-04x
R² = 0.9833
$-$1.00 $2.00 $3.00 $4.00 $5.00 $6.00 $7.00 $8.00 $9.00
$10.00
0 200 400 600 800 1000
$/to
nn
e C
O2
MWs
Variable (chemicals, waste, maintenance) OPEX
Figure 4. Variable OPEX cost function
7

y = 0.3398e0.0001x
R² = 0.2984
$0.34 $0.34 $0.35 $0.35 $0.36 $0.36 $0.37 $0.37 $0.38 $0.38 $0.39 $0.39
0 200 400 600 800 1000
$/to
nn
e C
O2
MWs
Feedstock (natural gas) OPEX
Figure 5. Feedstock OPEX cost function 2.2.6 Parasitic Load The total parasitic load of the carbon capture retrofit is equal to the sum of the parasitic loads of the newly installed NOx and SO2 control equipment, the additional cooling, and the actual CO2 retrofit components. A parasitic loading function was developed based on Conesville study cases for the retrofit equipment. Figure 6 shows this as a function of nameplate capacity.
y = 0.0645x + 184.45R² = 0.9606
-
50
100
150
200
250
300
- 200 400 600 800 1,000
Par
asit
ic L
oad
(kW
-h/t
on
ne
CO
2
Original Capacity of System, MW
Parasitic Load Scaling
Figure 6. Parasitic load scaling for retrofit components
8
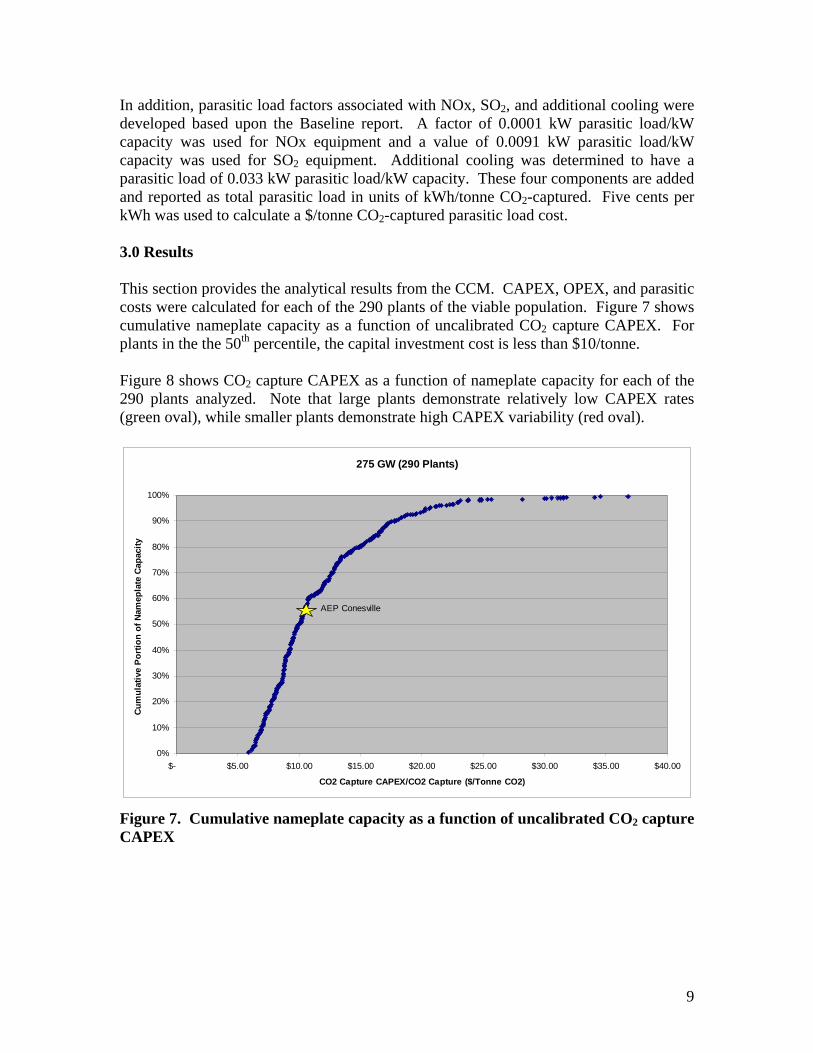
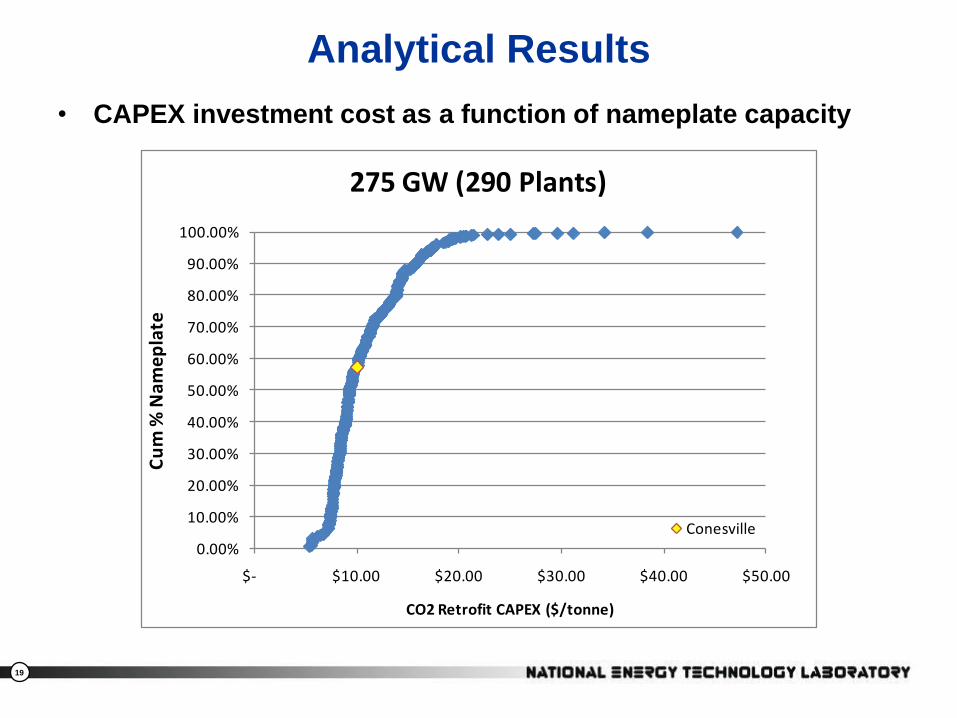
In addition, parasitic load factors associated with NOx, SO2, and additional cooling were developed based upon the Baseline report. A factor of 0.0001 kW parasitic load/kW capacity was used for NOx equipment and a value of 0.0091 kW parasitic load/kW capacity was used for SO2 equipment. Additional cooling was determined to have a parasitic load of 0.033 kW parasitic load/kW capacity. These four components are added and reported as total parasitic load in units of kWh/tonne CO2-captured. Five cents per kWh was used to calculate a $/tonne CO2-captured parasitic load cost. 3.0 Results This section provides the analytical results from the CCM. CAPEX, OPEX, and parasitic costs were calculated for each of the 290 plants of the viable population. Figure 7 shows cumulative nameplate capacity as a function of uncalibrated CO2 capture CAPEX. For plants in the the 50th percentile, the capital investment cost is less than $10/tonne. Figure 8 shows CO2 capture CAPEX as a function of nameplate capacity for each of the 290 plants analyzed. Note that large plants demonstrate relatively low CAPEX rates (green oval), while smaller plants demonstrate high CAPEX variability (red oval).
275 GW (290 Plants)
0%
10%
20%
30%
40%
50%
60%
70%
80%
90%
100%
$- $5.00 $10.00 $15.00 $20.00 $25.00 $30.00 $35.00 $40.00
CO2 Capture CAPEX/CO2 Capture ($/Tonne CO2)
Cu
mu
lati
ve P
ort
ion
of
Nam
epla
te C
apac
ity
AEP Conesville
Figure 7. Cumulative nameplate capacity as a function of uncalibrated CO2 capture CAPEX
9

290 Analyzed Plants (275 GW)
$-
$5.00
$10.00
$15.00
$20.00
$25.00
$30.00
$35.00
$40.00
$45.00
$50.00
- 500 1,000 1,500 2,000 2,500 3,000 3,500 4,000
Nameplate Capacity (MW)
CO
2 C
aptu
re C
AP
EX
/CO
2 C
aptu
re (
$/T
on
ne
CO
2)
Figure 8. Nameplate capacity as a function of uncalibrated CO2 capture CAPEX by plant Figures 9 and 10 show cumulative nameplate capacity as functions of CO2 OPEX and parasitic cost, respectively. Parasitic costs were calculated using a value for replacement electricity of $0.05 per kWh.
275 GW (290 Plants)
0%
10%
20%
30%
40%
50%
60%
70%
80%
90%
100%
$0.00 $5.00 $10.00 $15.00 $20.00 $25.00 $30.00 $35.00 $40.00
CO2 Capture OPEX/CO2 Capture ($/Tonne CO2)
Cu
mu
lati
ve P
ort
ion
of
Nam
epla
te C
apac
ity
AEP Conesville
Figure 9. Cumulative nameplate capacity as a function of CO2 capture OPEX
10

282 GW (324 Plants)
0%
10%
20%
30%
40%
50%
60%
70%
80%
90%
100%
$0.00 $5.00 $10.00 $15.00 $20.00 $25.00 $30.00 $35.00 $40.00
CO2 Capture Parasitic Cost/CO2 Capture ($/Tonne CO2)
Cu
mu
lati
ve P
ort
ion
of
Nam
epla
te C
apac
ity
AEP Conesville
Figure 10. Cumulative nameplate capacity as a function of uncalibrated CO2 capture parasitic cost Figure 11 shows cumulative nameplate capacity as a function of uncalibrated total CO2 capture cost. The CCM calculates total cost as the sum of CAPEX, OPEX, and parasitic cost. Cost of permitting and financing were not considered. For plants in the 50th percentile, the total CO2 capture cost is less than $29/tonne. To calibrate the results derived in Figure 11 to full costs relative to the Conesville study, a comparison of the total costs from Unit 5 at Conesville was made relative to the results from the CCM. This ratio was used to scale the total costs (Figure 12). Results of the analysis indicate that, for the 50th percentile (142 GW) of the analyzed viable population, the calibrated CO2 capture total cost would be about $61/tonne or less. To retrofit 90 percent of generation capacity (about 254 GW), the total capture cost would be about $80 per tonne or less. It should be noted that this study provides an overview of the plant sites. It is not an engineering-level analysis of individual plants and does not address the consequences of design. Analysis of the study population shows that if all operating plants greater than 100 MW in size were to increase their efficiencies to achieve a heat rate of 12,500 Btu/kWh, an additional 85 GW could be suitable for CO2 capture retrofits.
11

282 GW (324 Plants)
0.00%
10.00%
20.00%
30.00%
40.00%
50.00%
60.00%
70.00%
80.00%
90.00%
100.00%
$20.00 $25.00 $30.00 $35.00 $40.00 $45.00 $50.00 $55.00 $60.00 $65.00 $70.00 $75.00 $80.00
Total CO2 Capture Cost/CO2 Capture ($/Tonne CO2)
Cu
mu
lati
ve P
ort
ion
Nam
epla
te C
apac
ity
AEP Conesville
Figure 11. Cumulative nameplate capacity as a function of uncalibrated CO2 capture total cost
0.00%
10.00%
20.00%
30.00%
40.00%
50.00%
60.00%
70.00%
80.00%
90.00%
100.00%
$40.00 $45.00 $50.00 $55.00 $60.00 $65.00 $70.00 $75.00 $80.00 $85.00 $90.00 $95.00 $100.00
Cu
mu
lati
ve P
ort
ion
Nam
epla
te C
apac
ity
Calibrated Total CO2 Capture Cost/CO2 Capture ($/Tonne CO2)
282 GW (324 Plants)
AEP Conesville
Figure 12. Cumulative nameplate capacity as a function of calibrated CO2 capture total cost
12
Clearwater Coal Conference, June 2009
Coal-fired Power Plants in the U.S.:
Costs for Retrofit with CO2 Capture Technology
Jeffrey Eppink and Michael Marquis, Enegis, LLC
Philip DiPietro and Christopher Nichols, National
Energy Technology Laboratory

2
Rationale
• Given the importance of coal to power generation in
the United States, examination of the costs and
practicability for retrofit of existing pulverized coal
power plants with CO2 capture technology is critical.
• This study defines a viable population of pulverized
coal plants, where each plant was examined discretely
to determine costs and space availability for retrofit.
• The effort was designed to enhance DOE’s ability to
analyze the opportunity for carbon capture retrofit of
the nation’s PC plant fleet for general equilibrium
models.

3
Overview
• Base information (reports and datasets)
• Defining the viable population
• Model development and analysis
• Results
– CAPEX, OPEX, Parasitic costs
– LCOE
– CO2 costs (captured and avoided)
• Limitations
4
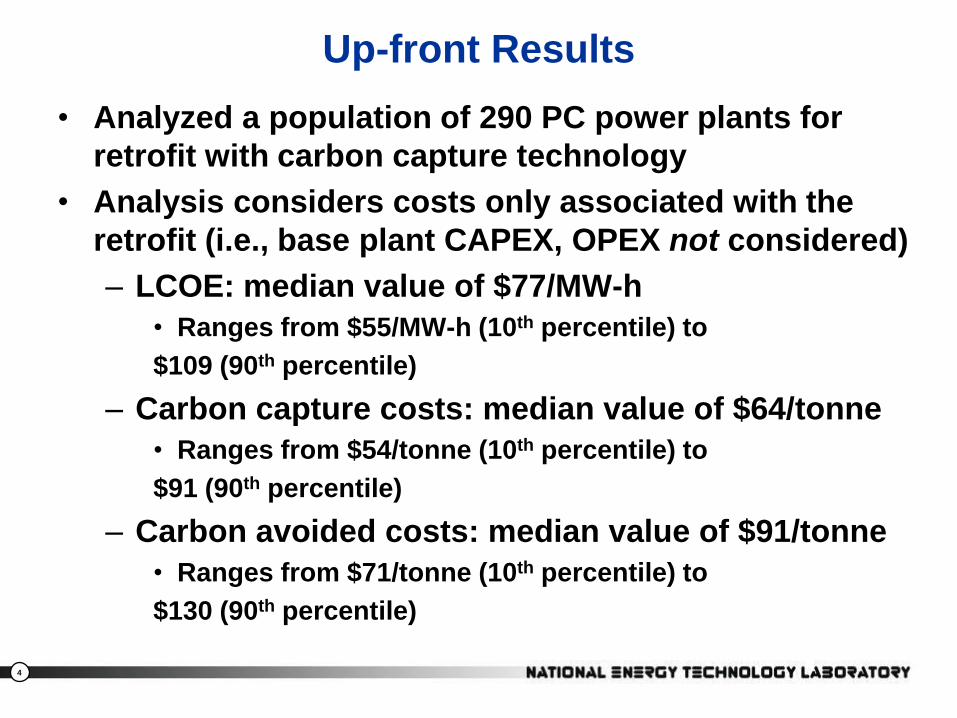
Up-front Results
• Analyzed a population of 290 PC power plants for
retrofit with carbon capture technology
• Analysis considers costs only associated with the
retrofit (i.e., base plant CAPEX, OPEX not considered)
– LCOE: median value of $77/MW-h
• Ranges from $55/MW-h (10th percentile) to
$109 (90th percentile)
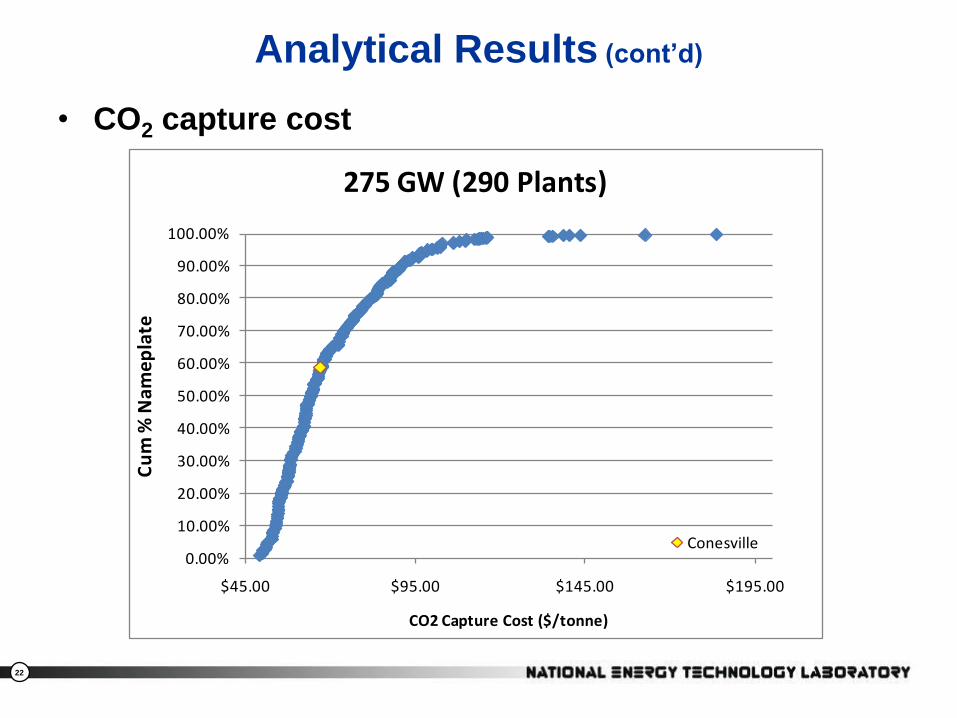
– Carbon capture costs: median value of $64/tonne
• Ranges from $54/tonne (10th percentile) to
$91 (90th percentile)
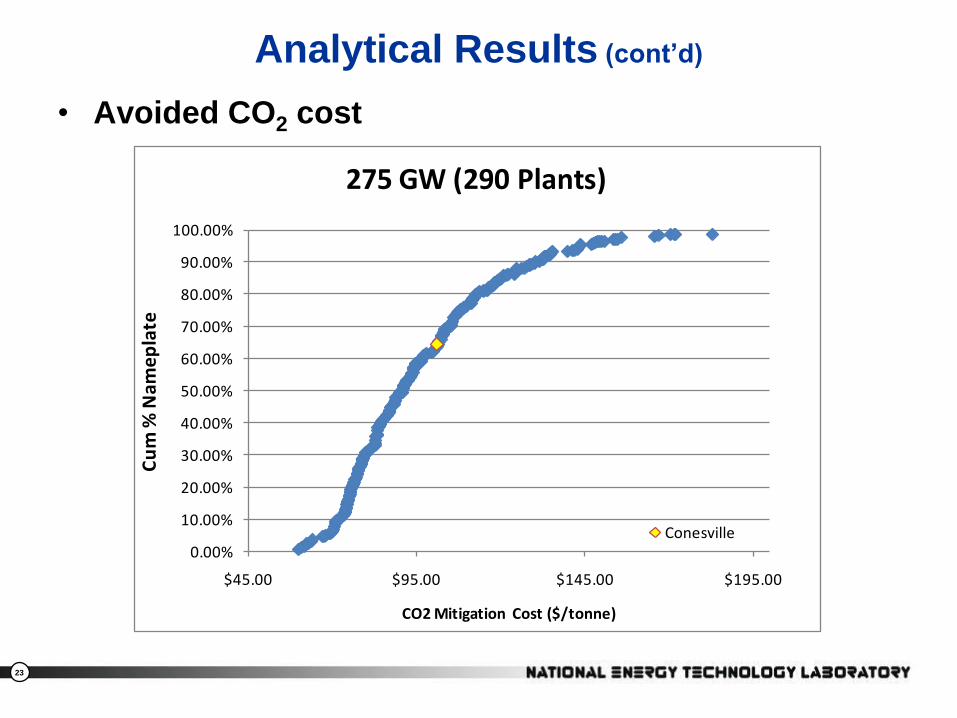
– Carbon avoided costs: median value of $91/tonne
• Ranges from $71/tonne (10th percentile) to
$130 (90th percentile)
5
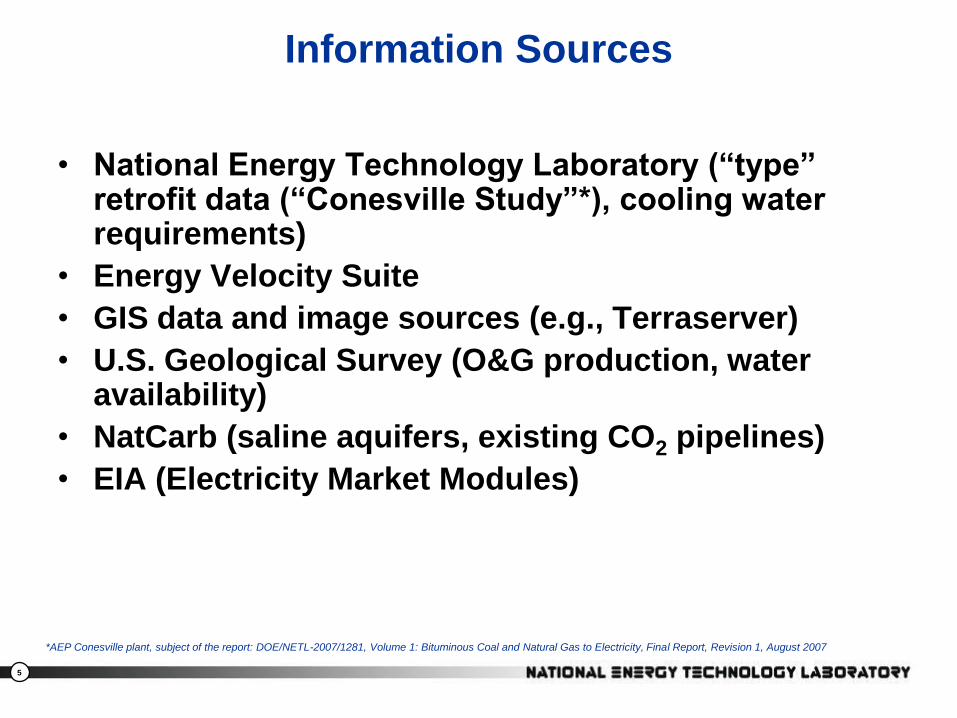
Information Sources
• National Energy Technology Laboratory (“type” retrofit data (“Conesville Study”*), cooling water requirements)
• Energy Velocity Suite
• GIS data and image sources (e.g., Terraserver)
• U.S. Geological Survey (O&G production, water availability)
• NatCarb (saline aquifers, existing CO2 pipelines)
• EIA (Electricity Market Modules)
*AEP Conesville plant, subject of the report: DOE/NETL-2007/1281, Volume 1: Bituminous Coal and Natural Gas to Electricity, Final Report, Revision 1, August 2007
6
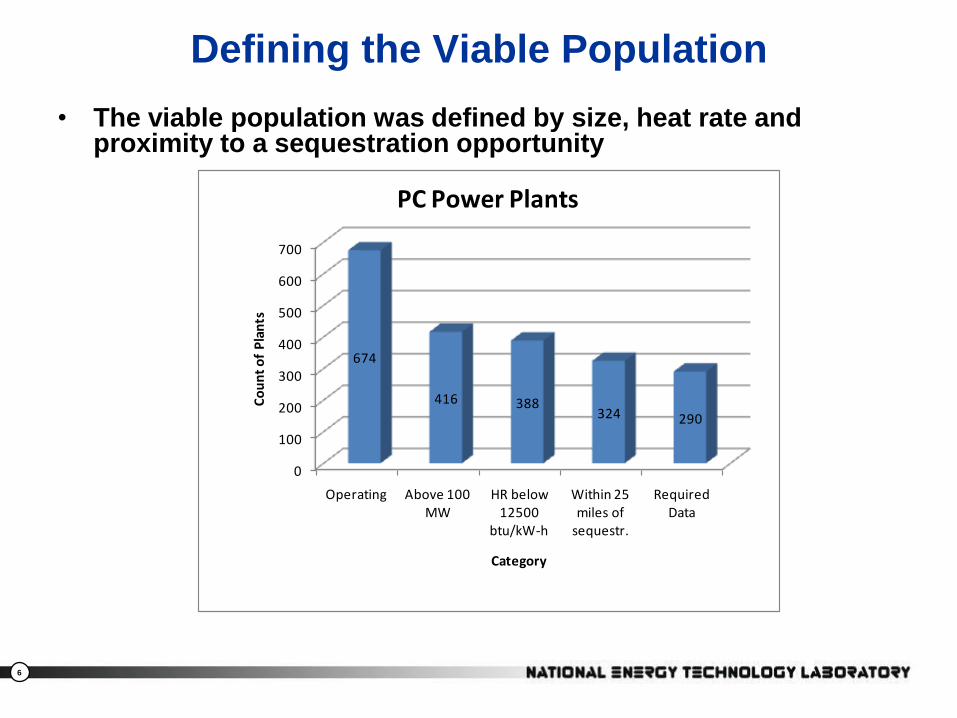
Defining the Viable Population
• The viable population was defined by size, heat rate and proximity to a sequestration opportunity
0
100
200
300
400
500
600
700
Operating Above 100 MW
HR below 12500
btu/kW-h
Within 25 miles of
sequestr.
Required Data
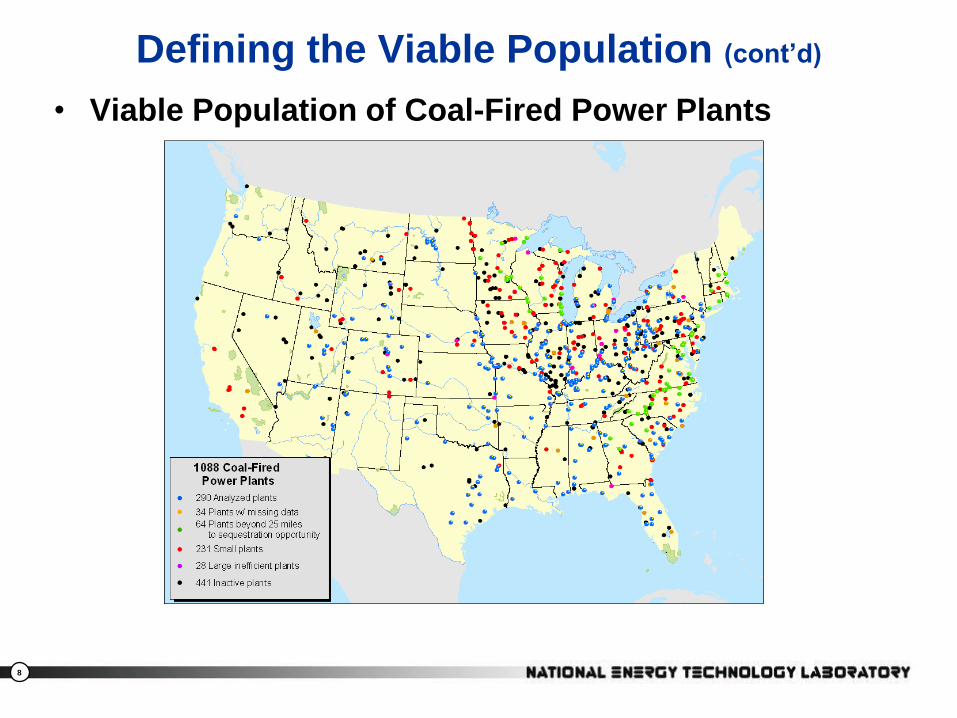
674
416 388324 290
Co
un
t o
f P
lan
ts
Category
PC Power Plants

7
Defining the Viable Population (cont’d)
• Defining the distance to potential sequestration opportunities
using an analytical GIS (geographic information system)—a 25
mile cutoff used
388 Plants (323 GW)
271
323
349
374 382
382
387
388
211
244
288
316
342
361 3
73 3
88
3 23 31
44 5
1 60
388
281
324
353
374 382
382
387
388
11
0
50
100
150
200
250
300
350
400
10 25 50 75 100 125 150 >150
Distance to Sequestration Opportunity (miles)
Cu
mu
lati
ve
Nu
mb
er
of
Pla
nts
Wit
hin
Dis
tan
ce
Oil and Gas
Saline Aq
Existing CO2 Pipeline
All Opportunities
8
Defining the Viable Population (cont’d)
• Viable Population of Coal-Fired Power Plants

9
Model Development and Analysis
• The Carbon Capture Model (CCM) was developed to
read and analyze the various disparate datasets
– Functions by reading parameters from the EV datasets
and GIS data sources for each plant in the viable
population
– CCM calculates the required size and cost for the
various CO2 capture components using the Conesville
study to determine scaling functionality
– Costs are adjusted for construction difficulty, water
availability, and additional land requirements
– Assumptions:
• A twenty-year future plant life
• 90 percent capture of carbon

10
Model Development and Analysis (cont’d)
• Physical Size and Cost Scaling
Plant 1497, AES Conesville, Coneville OHPlant 1497, AES Conesville, Coneville OH
– Required
equipment
geometries were
digitized from the
Conesville Study
so they could be
scaled, relocated,
and rotated to
accommodate
the remaining
plants in the
viable population
11
Model Development and Analysis (cont’d)
• SO2 Removal
– SO2 emissions required to be at or below 10 ppm for purposes of CO2 capture so that the amine process can function properly
– CCM determines the marginal SO2 for removal on a volumetric (molar) basis relative to the CO2 generated at each power plant
• Calculation of the marginal SO2 inherently incorporates primary FGD to the extent it exists at each unit
• SO2 removal “polishing” calculated discretely
– CCM also estimates a plant’s overall SO2 scrubbing efficiency
• NOx Removal
– NOx emissions to be at or below 0.07 lbs NOx/ million Btu for purposes of CO2 capture
– Installation cost of $300/tonne NOx used

12
Model Development and Analysis (cont’d)
• CO2 Compression and Separation Cost and Size Scaling
CO2 Compression and Separation
y = 0.0017x + 0.2433
R2 = 0.9767
0%
20%
40%
60%
80%
100%
120%
140%
160%
180%
200%
- 200 400 600 800 1,000
Original Capacity of System, MW
Co
st
rela
tive t
o C
on
esville
90%
case
– Separation and
compression handled
individually.
13
Model Development and Analysis (cont’d)
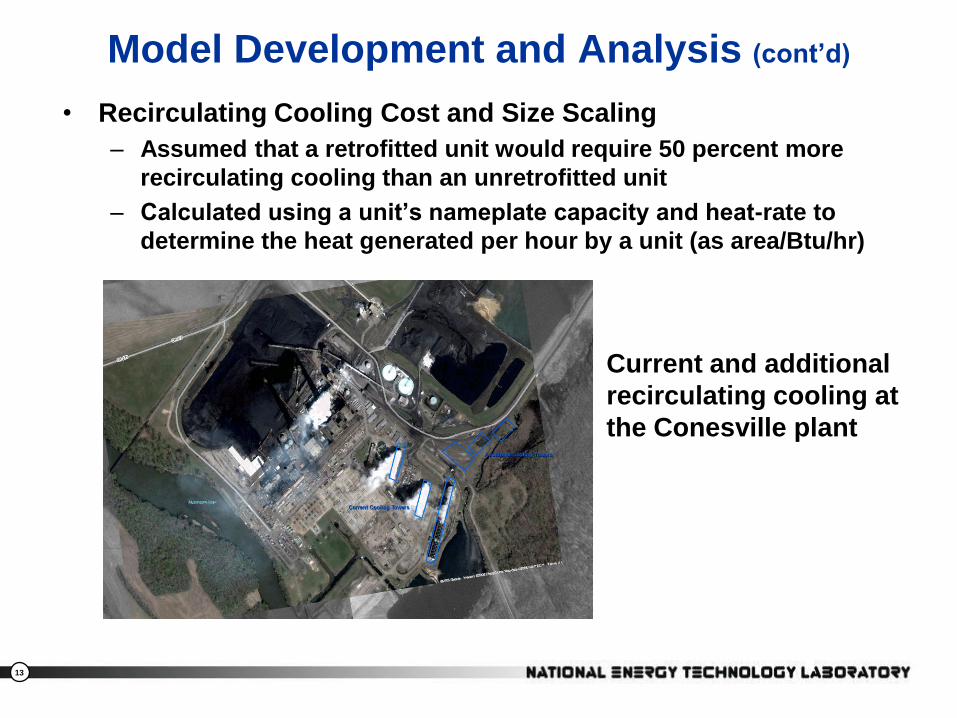
• Recirculating Cooling Cost and Size Scaling
– Assumed that a retrofitted unit would require 50 percent more
recirculating cooling than an unretrofitted unit
– Calculated using a unit’s nameplate capacity and heat-rate to
determine the heat generated per hour by a unit (as area/Btu/hr)
Current and additional
recirculating cooling at
the Conesville plant

14
Model Development and Analysis (cont’d)
• Additional cost and/or physical size scaling provided
for:
– Let-down turbine
– Discounting of incremental plant units
– Additional land requirements
– Water availability

15
Model Development and Analysis (cont’d)
• Construction Difficulty Factors
– In analyzing the sampled plant sites it becomes
readily apparent that some plants are more
crowded than others. Two incremental
construction cost factors were developed to
accommodate this situation:
– Close-in Construction
• The letdown turbine, separation equipment, CO2
scrubbers and absorbers, as well as the primary and
secondary FGDs require construction in close proximity
to the main turbine and flue stack.
• Ranged from 0 (easily constructed) to 40 percent (difficult
to construct) based on the examination of the GIS

16
Model Development and Analysis (cont’d)
• Construction Difficulty Factors (cont’d)
– Landscape Construction
• Addresses CO2 compression and additional cooling
facilities
• Ranges from 0-30 percent
– Construction factors applied incrementally, where
• Cost = Conesville costsscaled * (1+ Construction Difficulty
Factor)
– Overall, an estimated 8 to10 additional acres are
required for the retrofit technology footprint at the
average site
17
Model Development and Analysis (cont’d)
• Investment CAPEX—sum of capital items
• OPEX—calculated as the sum of
• Fixed, variable, feedstock
• Parasitic Load
– Computed as the sum of the parasitic loads of newly
installed NOx and SO2 control equipment, additional
cooling, and the CO2 retrofit components
• LCOE
– 20-year levelization; make-up power priced at $0.05/kW-h
• CO2 costs
– Capture
– Avoided (based on snapshot of conditions in EMMs)

18
RESULTS
19
Analytical Results
• CAPEX investment cost as a function of nameplate capacity
0.00%
10.00%
20.00%
30.00%
40.00%
50.00%
60.00%
70.00%
80.00%
90.00%
100.00%
$- $10.00 $20.00 $30.00 $40.00 $50.00
Cu
m %
Nam
ep
late
CO2 Retrofit CAPEX ($/tonne)
275 GW (290 Plants)
Conesville
20
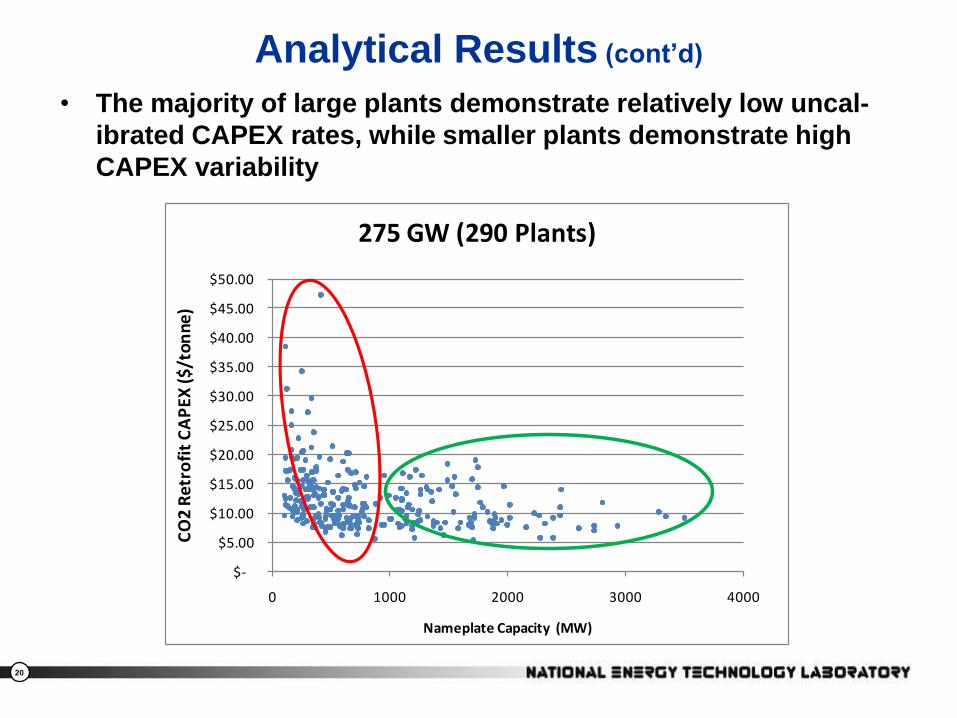
Analytical Results (cont’d)
• The majority of large plants demonstrate relatively low uncal-
ibrated CAPEX rates, while smaller plants demonstrate high
CAPEX variability
$-
$5.00
$10.00
$15.00
$20.00
$25.00
$30.00
$35.00
$40.00
$45.00
$50.00
0 1000 2000 3000 4000
CO
2 R
etr
ofi
t C
AP
EX ($
/to
nn
e)
Nameplate Capacity (MW)
275 GW (290 Plants)

21
Analytical Results (cont’d)
• LCOE for the retrofits (based on $0.05/kW-h make-up cost)
0.00%
10.00%
20.00%
30.00%
40.00%
50.00%
60.00%
70.00%
80.00%
90.00%
100.00%
$20.00 $45.00 $70.00 $95.00 $120.00 $145.00 $170.00 $195.00
Cu
m %
Nam
ep
late
LCOE ($/MWH)
275 GW (290 Plants)
Conesville
22
Analytical Results (cont’d)
• CO2 capture cost
0.00%
10.00%
20.00%
30.00%
40.00%
50.00%
60.00%
70.00%
80.00%
90.00%
100.00%
$45.00 $95.00 $145.00 $195.00
Cu
m %
Nam
ep
late
CO2 Capture Cost ($/tonne)
275 GW (290 Plants)
Conesville
23
Analytical Results (cont’d)
• Avoided CO2 cost
0.00%
10.00%
20.00%
30.00%
40.00%
50.00%
60.00%
70.00%
80.00%
90.00%
100.00%
$45.00 $95.00 $145.00 $195.00
Cu
m %
Nam
ep
late
CO2 Mitigation Cost ($/tonne)
275 GW (290 Plants)
Conesville
24
Limitations
– Study is indicative of cost structure of the
analyzed population relative to the Conesville
Study
– Study is not an engineering-level analysis of
individual plants; it does not address the
consequences of design

25
Acknowledgments
This work was funded by the U.S. Department of Energy’s
National Energy Technology Laboratory (U.S. DOE/NETL). The
NETL sponsor for this project, Philip DiPietro, Director of the
Situational Analysis and Benefits Division, Office of Systems,
Analyses and Planning (OSAP), provided guidance and
technical oversight for this study. The authors gratefully
acknowledge the significant role played by U.S. DOE/NETL in
providing the programmatic guidance and review of this study.
This work was performed under RDS Subtask 402.01.01,
contract DE-AC26-04NT-41817.
26
Enegis, LLC
3959 Pender Dr., Suite 300
Fairfax, VA 22030
phone: (703) 861.4189
fax: (703) 738.7022
email: [email protected]
www.Enegis.com