Data Warehousing and Data Mining - · PDF fileData Warehousing and Data Mining –...
67
J. Gamper, Free University of Bolzano, DWDM 2011-12 Data Warehousing and Data Mining – Multidimensional Modeling – • Motivation • Dimensions, facts, measures, and cubes • Granularity • Star and snowflake schema • DW design process • DW applications • DW implementation Acknowledgements: I am indebted to Michael Böhlen and Stefano Rizzi for providing me their slides, upon which these lecture notes are based.
Transcript of Data Warehousing and Data Mining - · PDF fileData Warehousing and Data Mining –...

J. Gamper, Free University of Bolzano, DWDM 2011-12
Data Warehousing and Data Mining– Multidimensional Modeling –
• Motivation• Dimensions, facts, measures, and cubes• Granularity• Star and snowflake schema• DW design process• DW applications• DW implementation
Acknowledgements: I am indebted to Michael Böhlen and Stefano Rizzi for providing me their slides, upon which these lecture notes are based.

J. Gamper, Free University of Bolzano, DWDM 2011-12 2
Why a New Model?/1
• We know ER and OO modeling• All types of data are “equal”• ER/OO models serve many purposes, thus are
Flexible General
• No difference between: What is important What just describes the important
• ER/OO models are large 50-1000 entities/relations/classes Hard to get an overview
• ER/OO models implemented in RDBMSes Normalized databases spread information When analyzing data, the information must be
integrated/joined again
J. Gamper, Free University of Bolzano, DWDM 2011-12 3
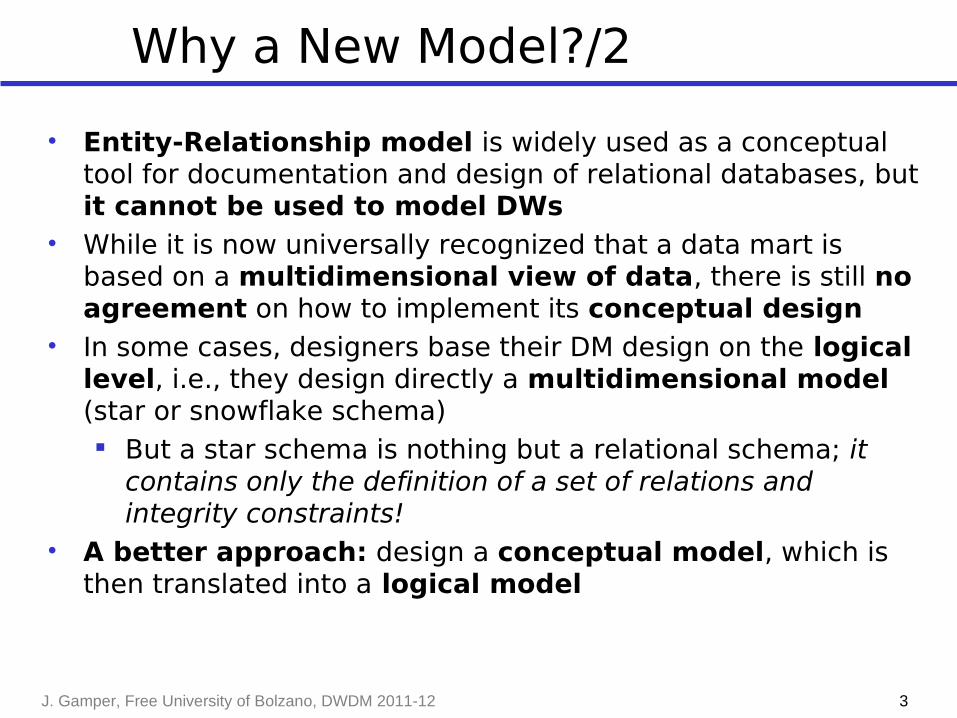
Why a New Model?/2
• Entity-Relationship model is widely used as a conceptual tool for documentation and design of relational databases, but it cannot be used to model DWs
• While it is now universally recognized that a data mart is based on a multidimensional view of data, there is still no agreement on how to implement its conceptual design
• In some cases, designers base their DM design on the logical level, i.e., they design directly a multidimensional model (star or snowflake schema)
But a star schema is nothing but a relational schema; it contains only the definition of a set of relations and integrity constraints!
• A better approach: design a conceptual model, which is then translated into a logical model
J. Gamper, Free University of Bolzano, DWDM 2011-12 4
The Dimensional Fact Model/1The DFM is a graphical conceptual model for data mart design, devised to:
1. lend effective support to conceptual design
2. create an environment in which user queries may be formulated intuitively
3. make communication possible between designers and end users with the goal of formalizing requirement specifications
4. build a stable platform for logical design (independently of the target logical model)
5. provide clear and expressive design documentation
The conceptual representation generated by the DFM consists of a set of fact schemata that basically model facts, measures, dimensions, and hierarchies
J. Gamper, Free University of Bolzano, DWDM 2011-12 5
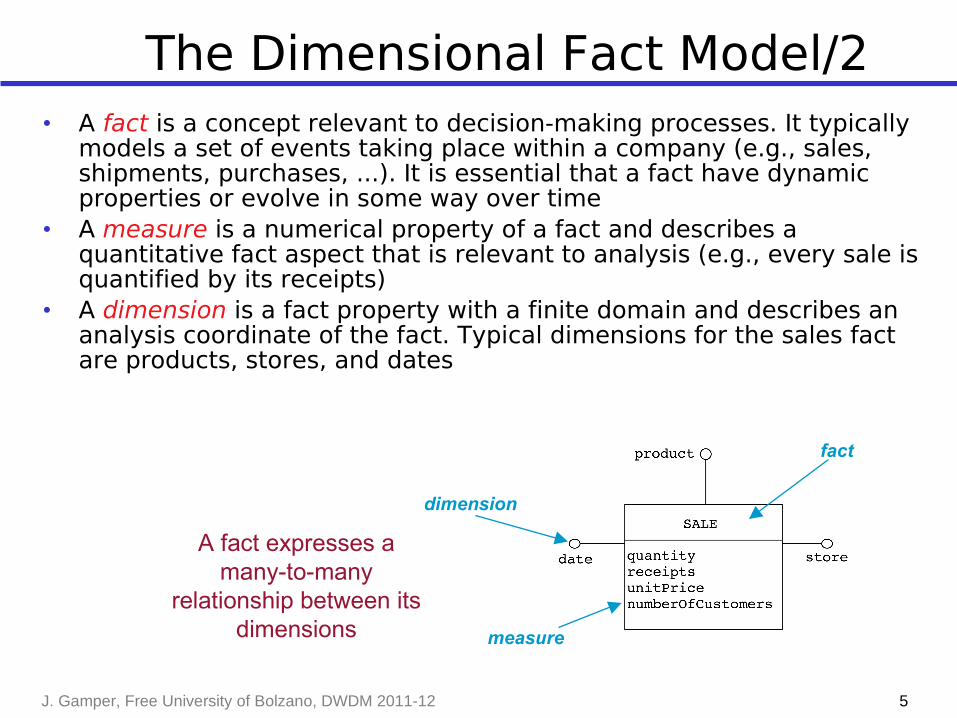
• A fact is a concept relevant to decision-making processes. It typically models a set of events taking place within a company (e.g., sales, shipments, purchases, ...). It is essential that a fact have dynamic properties or evolve in some way over time
• A measure is a numerical property of a fact and describes a quantitative fact aspect that is relevant to analysis (e.g., every sale is quantified by its receipts)
• A dimension is a fact property with a finite domain and describes an analysis coordinate of the fact. Typical dimensions for the sales fact are products, stores, and dates
dimension
measure
fact
A fact expresses a many-to-many
relationship between its dimensions
The Dimensional Fact Model/2
J. Gamper, Free University of Bolzano, DWDM 2011-12 6
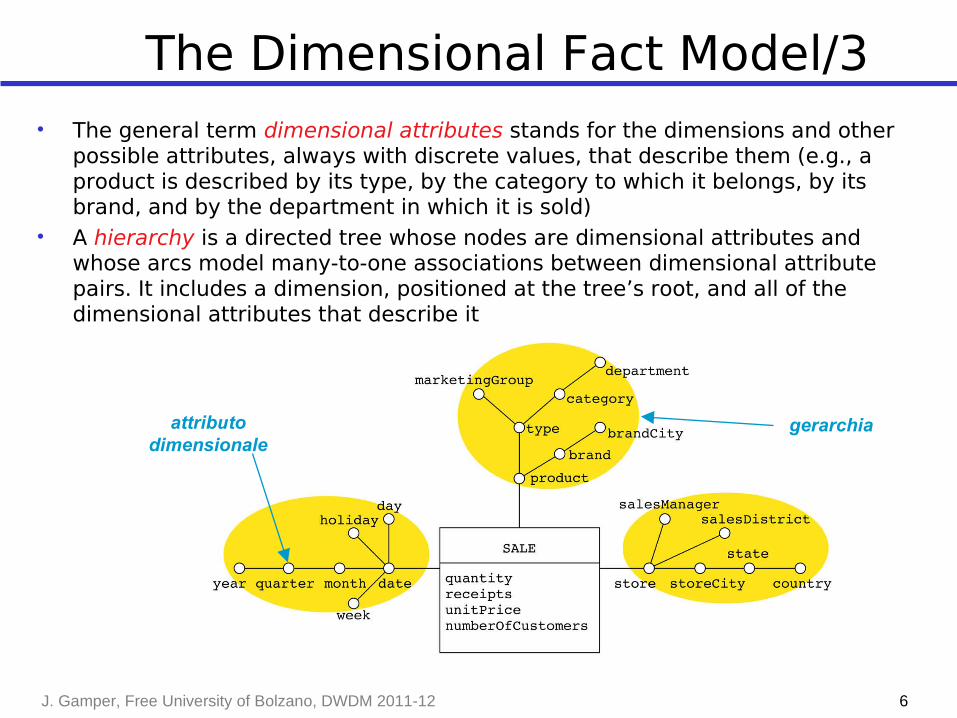
gerarchiaattributo dimensionale
• The general term dimensional attributes stands for the dimensions and other possible attributes, always with discrete values, that describe them (e.g., a product is described by its type, by the category to which it belongs, by its brand, and by the department in which it is sold)
• A hierarchy is a directed tree whose nodes are dimensional attributes and whose arcs model many-to-one associations between dimensional attribute pairs. It includes a dimension, positioned at the tree’s root, and all of the dimensional attributes that describe it
The Dimensional Fact Model/3

J. Gamper, Free University of Bolzano, DWDM 2011-12 7
The Dimensional Fact Model/4
8
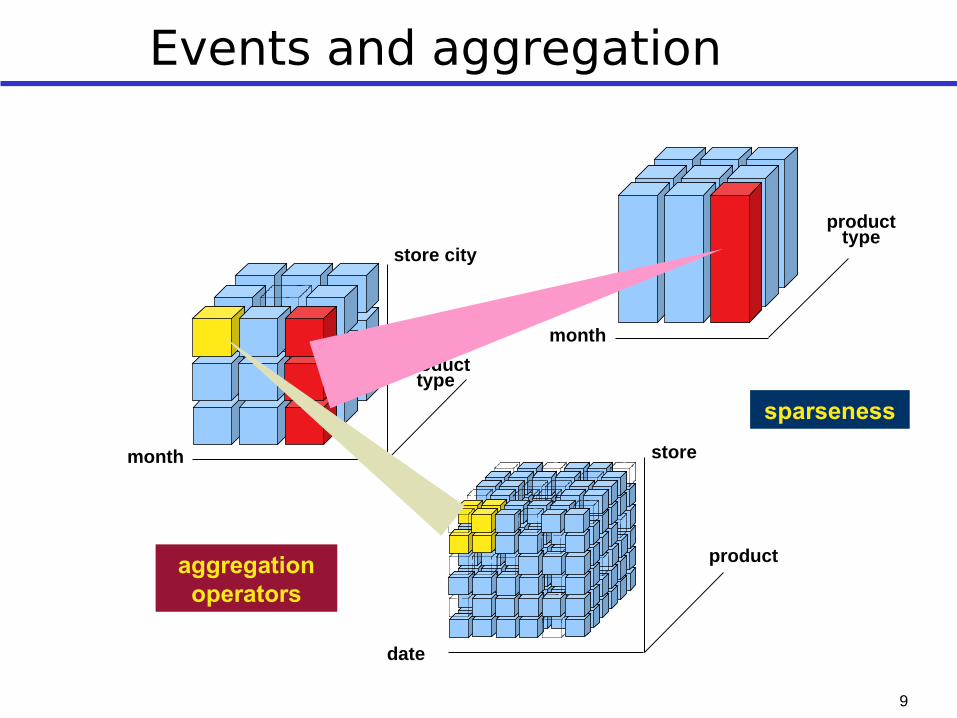
Events and aggregation
• A primary event is a particular occurrence of a fact, identified by one n-ple made up of a value for each dimension. A value for each measure is associated with each primary event
In reference to the sales example, a possible primary event records that 10 packages of Shiny detergent were sold for total sales of $25 on 10/10/2008 in the SmartMart store
• Given a set of dimensional attributes (group-by set), each n-ple of their values identifies a secondary event that aggregates all of the corresponding primary events. Each secondary event is associated with a value for each measure that sums up all the values of the same measure in the corresponding primary events
This makes it possible to use hierarchies to define the way you can aggregate primary events and effectively select them for decision-making processes. While the dimension in which a hierarchy takes root defines its finest aggregation granularity, the other dimensional attributes correspond to a gradually increasing granularity
9
Events and aggregation
product
date
store
month
product type
product type
month
store city
sparseness
aggregation operators
10
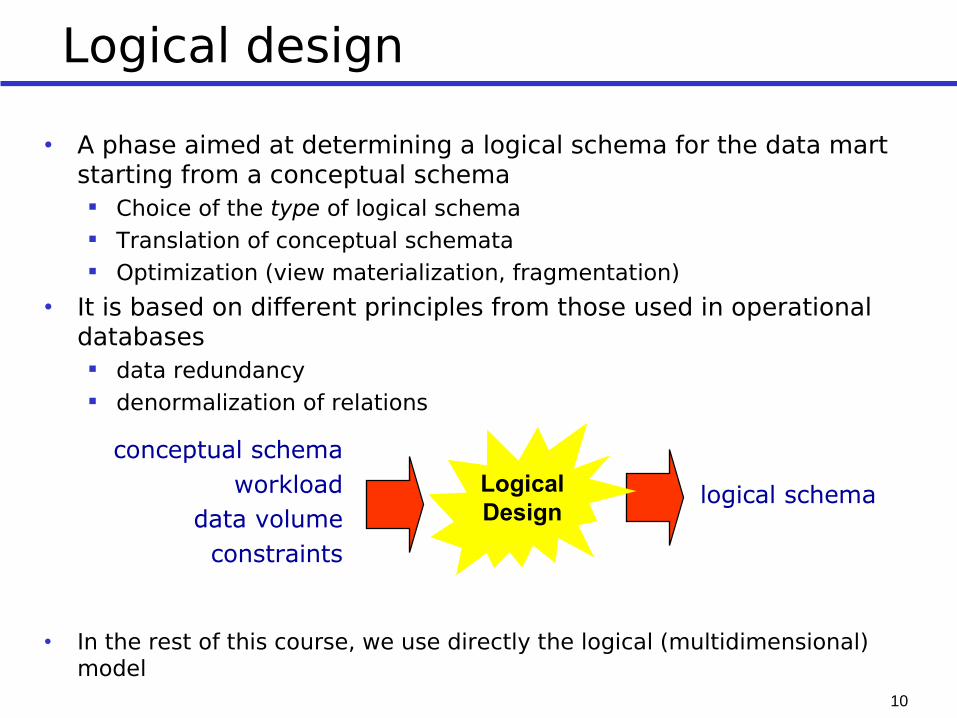
conceptual schemaworkload
data volumeconstraints
logical schemaLogicalDesign
Logical design
• A phase aimed at determining a logical schema for the data mart starting from a conceptual schema
Choice of the type of logical schema Translation of conceptual schemata Optimization (view materialization, fragmentation)
• It is based on different principles from those used in operational databases
data redundancy denormalization of relations
• In the rest of this course, we use directly the logical (multidimensional) model
J. Gamper, Free University of Bolzano, DWDM 2011-12 11
The Multidimensional Model/1
• Multidimensional Model is a logical model and has one purpose:
Data analysis
• Better at that purpose than ERM Less flexible Not suited for OLTP systems
• More built in “meaning” What is important What describes the important What we want to optimize Automatic aggregations means easy querying
• Most popular data model for DW• Recognized by OLAP/BI tools
Tools offer powerful query facilities based on MD design

J. Gamper, Free University of Bolzano, DWDM 2011-12 12
The Multidimensional Model/2• Data is divided into facts (with measures) and
dimensions• Facts
are the important entity, e.g., a sale have measures that can be aggregated, e.g., sales price
• Dimensions describe facts e.g., a sale has the dimensions Product, Store and Time
• Goal for dimensional modeling: Surround facts with as much context/dimensions as
possible (redundancy may be ok in well-chosen places) But you should not try to model all relationships in the
data (unlike ER and OO modeling!)
• Facts (data) “live” in a multidimensional cube
J. Gamper, Free University of Bolzano, DWDM 2011-12 13
Cube Example: Sales5
J. Gamper, Free University of Bolzano, DWDM 2011-12 14
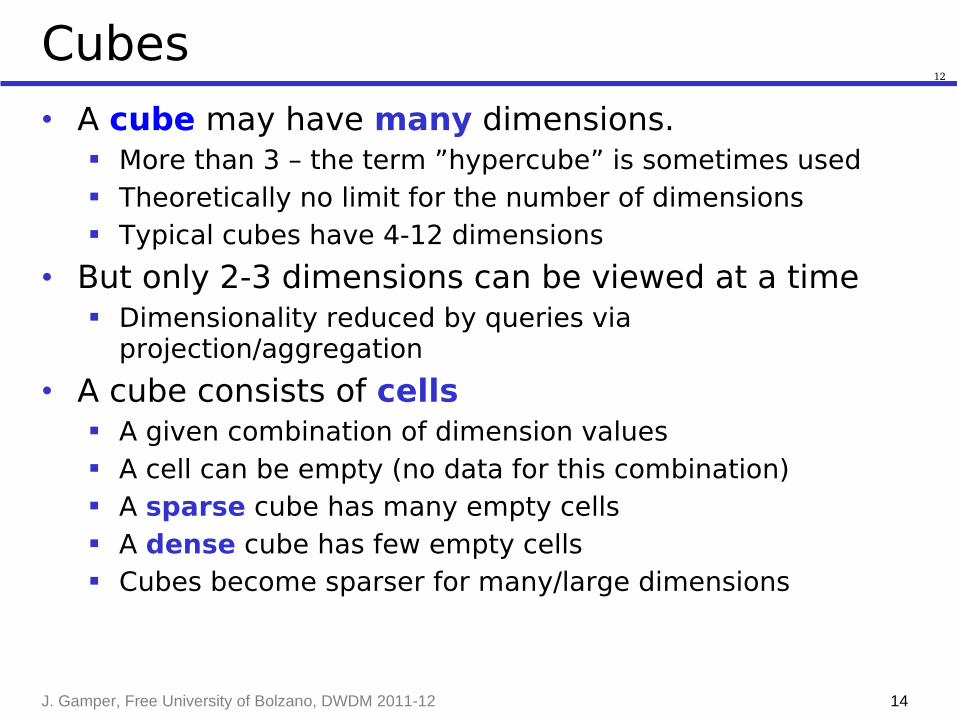
Cubes
• A cube may have many dimensions. More than 3 – the term ”hypercube” is sometimes used Theoretically no limit for the number of dimensions Typical cubes have 4-12 dimensions
• But only 2-3 dimensions can be viewed at a time Dimensionality reduced by queries via
projection/aggregation
• A cube consists of cells A given combination of dimension values A cell can be empty (no data for this combination) A sparse cube has many empty cells A dense cube has few empty cells Cubes become sparser for many/large dimensions
12
J. Gamper, Free University of Bolzano, DWDM 2011-12 15
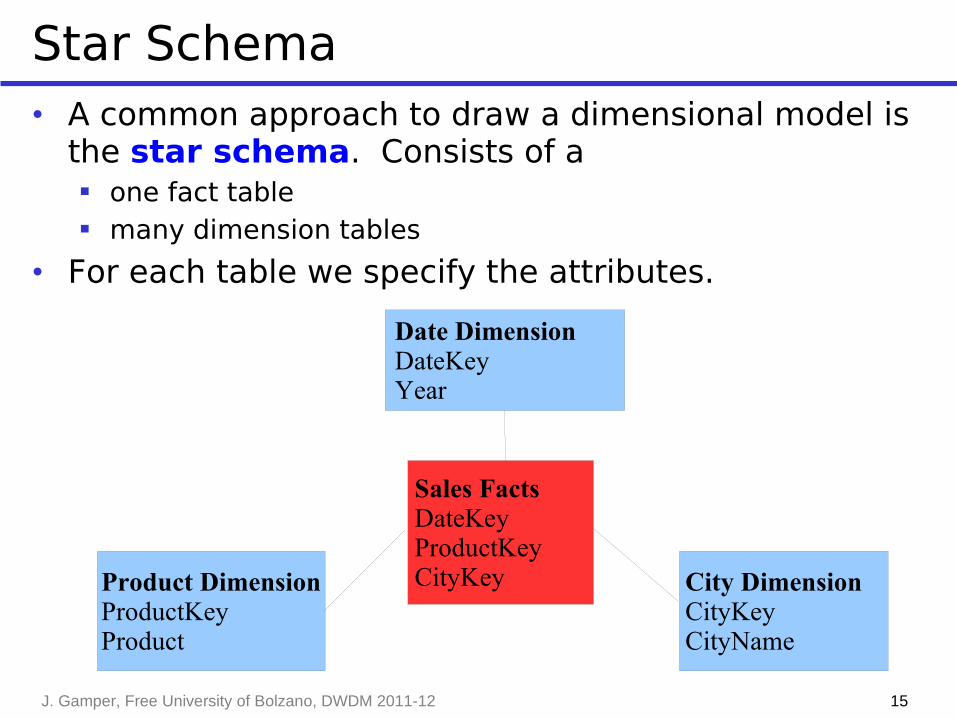
Star Schema• A common approach to draw a dimensional model is
the star schema. Consists of a one fact table many dimension tables
• For each table we specify the attributes.
Date DimensionDateKeyYear
Sales Facts DateKeyProductKeyCityKeyProduct Dimension
ProductKeyProduct
City Dimension CityKeyCityName
J. Gamper, Free University of Bolzano, DWDM 2011-12 16
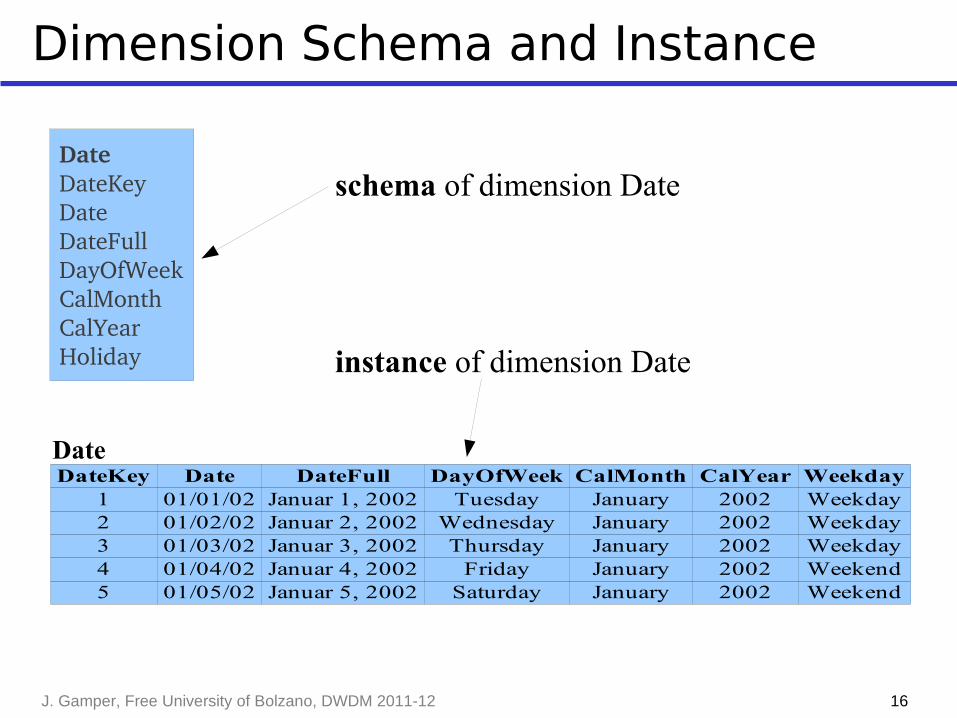
Dimension Schema and Instance
DateKey Date DateFull DayOfWeek CalMonth CalYear Weekday1 01/01/02 Januar 1, 2002 Tuesday January 2002 Weekday2 01/02/02 Januar 2, 2002 Wednesday January 2002 Weekday3 01/03/02 Januar 3, 2002 Thursday January 2002 Weekday4 01/04/02 Januar 4, 2002 Friday January 2002 Weekend5 01/05/02 Januar 5, 2002 Saturday January 2002 Weekend
DateDateKeyDateDateFullDayOfWeekCalMonthCalYearHoliday
schema of dimension Date
instance of dimension Date
Date
J. Gamper, Free University of Bolzano, DWDM 2011-12 17
Dimensions/1
• Dimensions are the core of multidimensional databases
Other types of databases do not support dimensions
• Dimensions are used for Selection of data Grouping of data at the right level of detail
• Dimensions consist of dimension values Product dimension has values ”milk”, ”cream”, … Time dimension has values ”1/1/2001”, ”2/1/2001”,…
• Dimension values may have an ordering Used for comparing cube data across values
◆ e.g., percentage of sales increase compared with last month Especially used for Time dimension

J. Gamper, Free University of Bolzano, DWDM 2011-12 18
Dimensions/2
• Dimensions encode hierarchies with levels Typically 3-5 levels (of detail) Dimension values are organized in a tree structure or
lattice◆ Product: Product > Type > Category◆ Store: Store > Area > City > County◆ Time: Day > Month > Quarter > Year
Dimensions have a bottom level and a top level (ALL)
• Levels may have attributes Simple, non-hierarchical information Day has Workday as attribute
• Dimensions should contain much information Time dimensions may contain holiday, season, events,… Good dimensions have 50-100 or more attributes/levels
J. Gamper, Free University of Bolzano, DWDM 2011-12 19
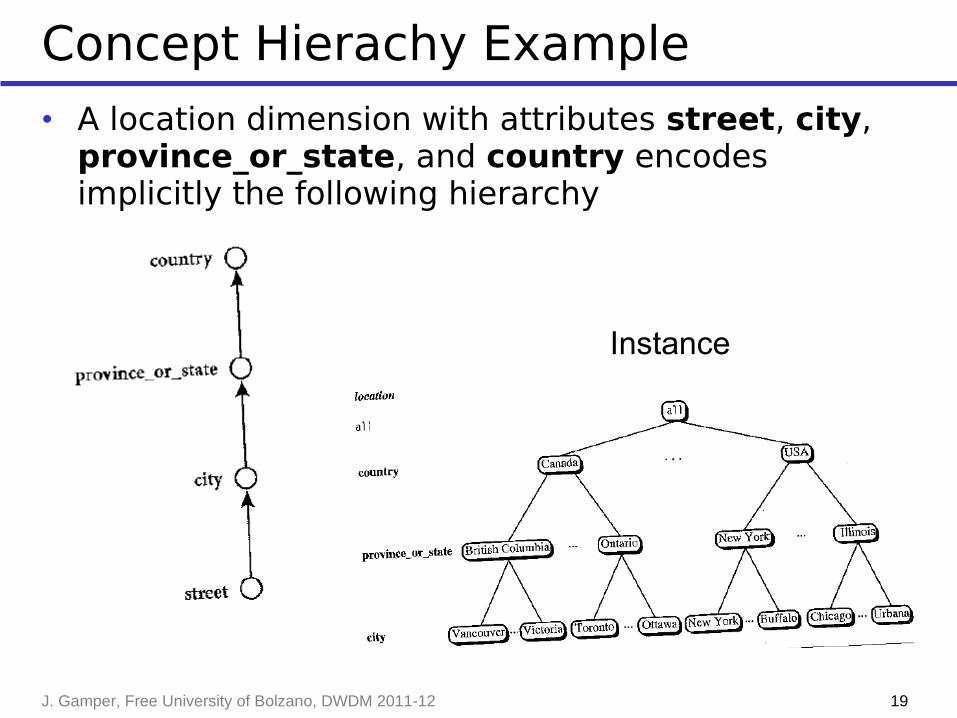
Concept Hierachy Example
• A location dimension with attributes street, city, province_or_state, and country encodes implicitly the following hierarchy
Instance
J. Gamper, Free University of Bolzano, DWDM 2011-12 20
Facts
• Facts represent the subject of the desired analysis The ”important” in the business that should be analyzed
• A fact is most often identified via its dimension values
A fact is a non-empty cell Some models give facts an explicit identity
• Generally a fact should Be attached to exactly one dimension value in each
dimension Only be attached to dimension values in the bottom
levels◆ e.g., if the lowest time granularity is day, for each fact the
exact day should be specified ◆ Some models do not require this
J. Gamper, Free University of Bolzano, DWDM 2011-12 21
Granularity
• Granularity of facts is important What does a single fact mean? Determines the level of detail Given by the combination of bottom levels
◆ e.g., ”total sales per store per day per product”
• Important for number of facts Scalability
• Often the granularity is a single business transaction
Example: sale Sometimes the data is aggregated (total sales per store
per day per product) Aggregation might be necessary due to scalability
• Generally, transaction detail can be handled Except perhaps huge clickstreams, etc.
J. Gamper, Free University of Bolzano, DWDM 2011-12 22
Measures
• Measures represent the fact property that the users want to study and optimize
e.g., the total sales price
• A measure has two components Numerical value: (sales price) Aggregation formula (SUM): used for aggregating /
combining a number of measure values into one
• Additivity is an important property for measures Single fact table rows are (almost) never retrieved, but
aggregations over millions of fact rows.
• Measure value determined by the combination of dimension values
Measure value is meaningful for all aggregation levels

J. Gamper, Free University of Bolzano, DWDM 2011-12 23
DW Design Steps
1. Choose the business process(es) to model Sales
2. Choose the granularity of the business process Items by Store by Promotion by Day Low granularity is needed Are individual transactions necessary/feasible ?
3. Choose the dimensions Time, Store, …
4. Choose the measures Dollar_sales, unit_sales, dollar_cost, customer_count
J. Gamper, Free University of Bolzano, DWDM 2011-12 24
The Grocery Store Example/1
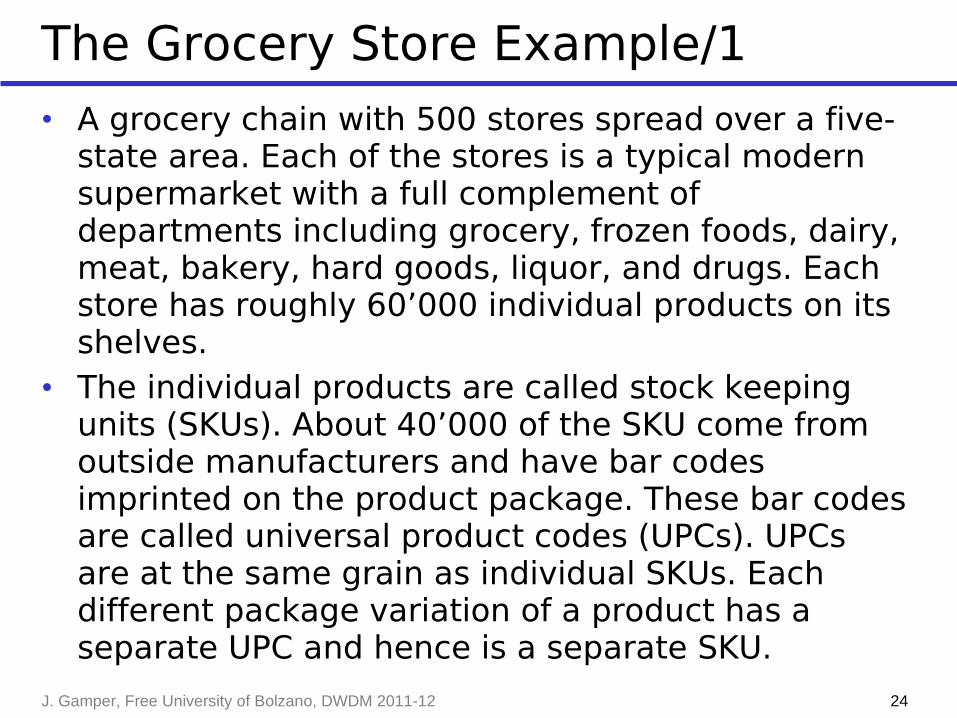
• A grocery chain with 500 stores spread over a five-state area. Each of the stores is a typical modern supermarket with a full complement of departments including grocery, frozen foods, dairy, meat, bakery, hard goods, liquor, and drugs. Each store has roughly 60’000 individual products on its shelves.
• The individual products are called stock keeping units (SKUs). About 40’000 of the SKU come from outside manufacturers and have bar codes imprinted on the product package. These bar codes are called universal product codes (UPCs). UPCs are at the same grain as individual SKUs. Each different package variation of a product has a separate UPC and hence is a separate SKU.
J. Gamper, Free University of Bolzano, DWDM 2011-12 25
The Grocery Store Example/2
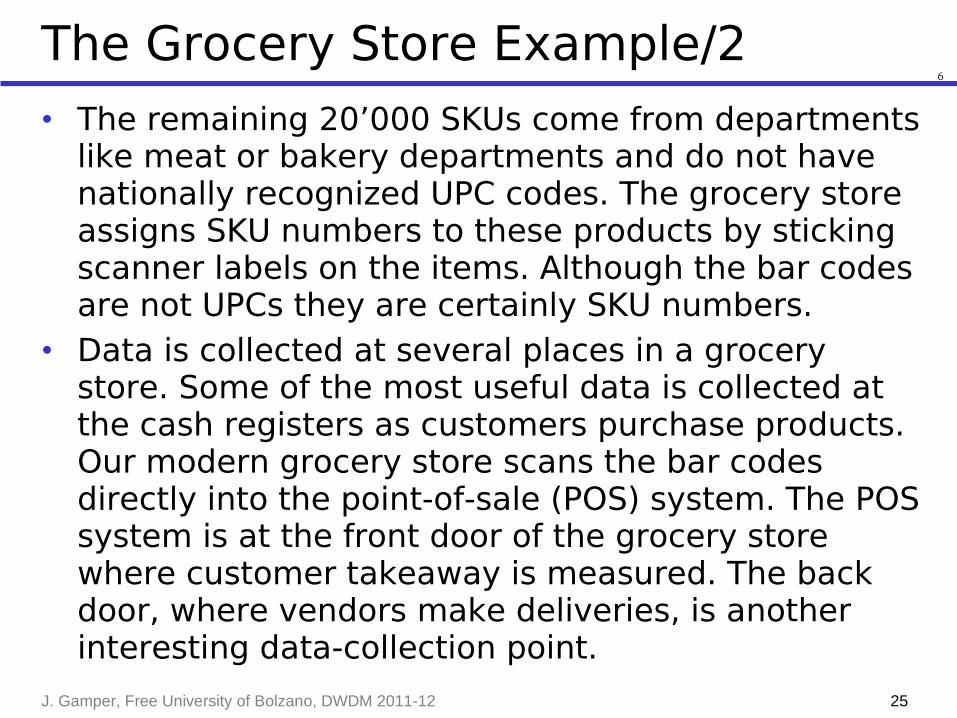
• The remaining 20’000 SKUs come from departments like meat or bakery departments and do not have nationally recognized UPC codes. The grocery store assigns SKU numbers to these products by sticking scanner labels on the items. Although the bar codes are not UPCs they are certainly SKU numbers.
• Data is collected at several places in a grocery store. Some of the most useful data is collected at the cash registers as customers purchase products. Our modern grocery store scans the bar codes directly into the point-of-sale (POS) system. The POS system is at the front door of the grocery store where customer takeaway is measured. The back door, where vendors make deliveries, is another interesting data-collection point.
6
J. Gamper, Free University of Bolzano, DWDM 2011-12 26
The Grocery Store Example/3
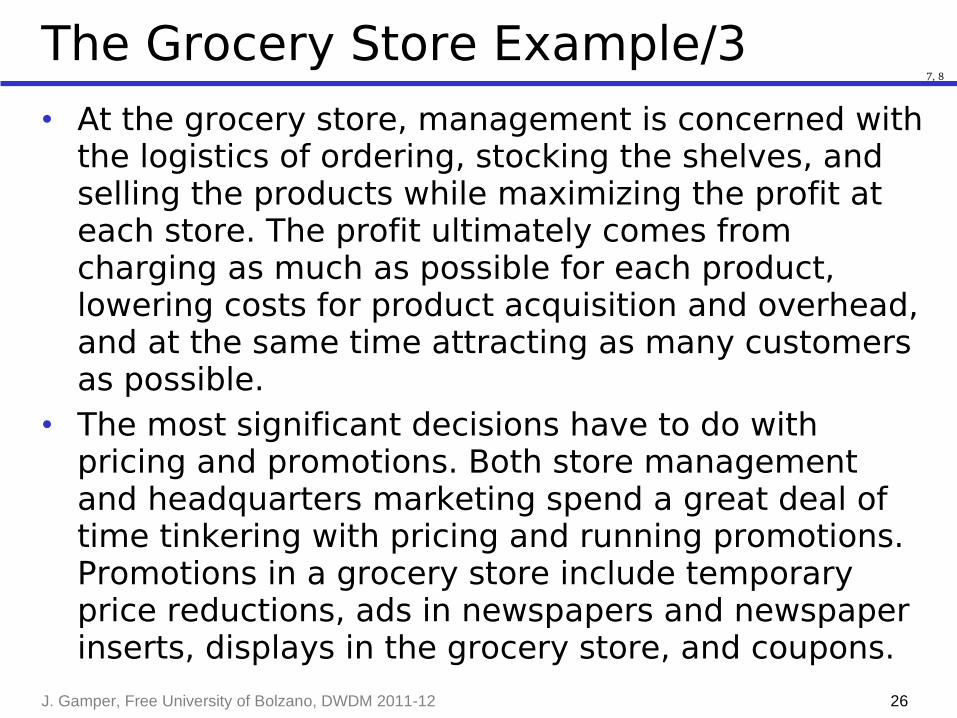
• At the grocery store, management is concerned with the logistics of ordering, stocking the shelves, and selling the products while maximizing the profit at each store. The profit ultimately comes from charging as much as possible for each product, lowering costs for product acquisition and overhead, and at the same time attracting as many customers as possible.
• The most significant decisions have to do with pricing and promotions. Both store management and headquarters marketing spend a great deal of time tinkering with pricing and running promotions. Promotions in a grocery store include temporary price reductions, ads in newspapers and newspaper inserts, displays in the grocery store, and coupons.
7, 8

J. Gamper, Free University of Bolzano, DWDM 2011-12 27
Choose the Business Process/1
• Step 1: Choose the business process The first dimensional model built should be the one with
the most impact It should answer the most pressing business questions
and be readily accessible for data extraction
7, 8

J. Gamper, Free University of Bolzano, DWDM 2011-12 28
Choose the Business Process/2
• The Grocery Store Example Management wants to better understand customer
purchases as captured by the POS system Business process: POS retail sales Allows us to analyze
◆ what products are selling ◆ in which stores ◆ on what days ◆ under what promotional conditions
7, 8

J. Gamper, Free University of Bolzano, DWDM 2011-12 29
Choose the Grain/1
• Step 2: Choose the grain of the business process Preferably develop dimensional models for the most
atomic information captured by a business process, not because queries report individual rows, but queries need to cut through the details in very precise ways.
The more detailed/atomic data is, the more things we know
Atomic data provides maximum analytic flexibility Can be constrained and rolled up in every way possible It is always possible to declare higher-level grains by
aggregation of atomic data However, the opposite is not true, and the less granular
model is vulnerable to unexpected user requests for more details
7, 8
J. Gamper, Free University of Bolzano, DWDM 2011-12 30
Choose the Grain/2
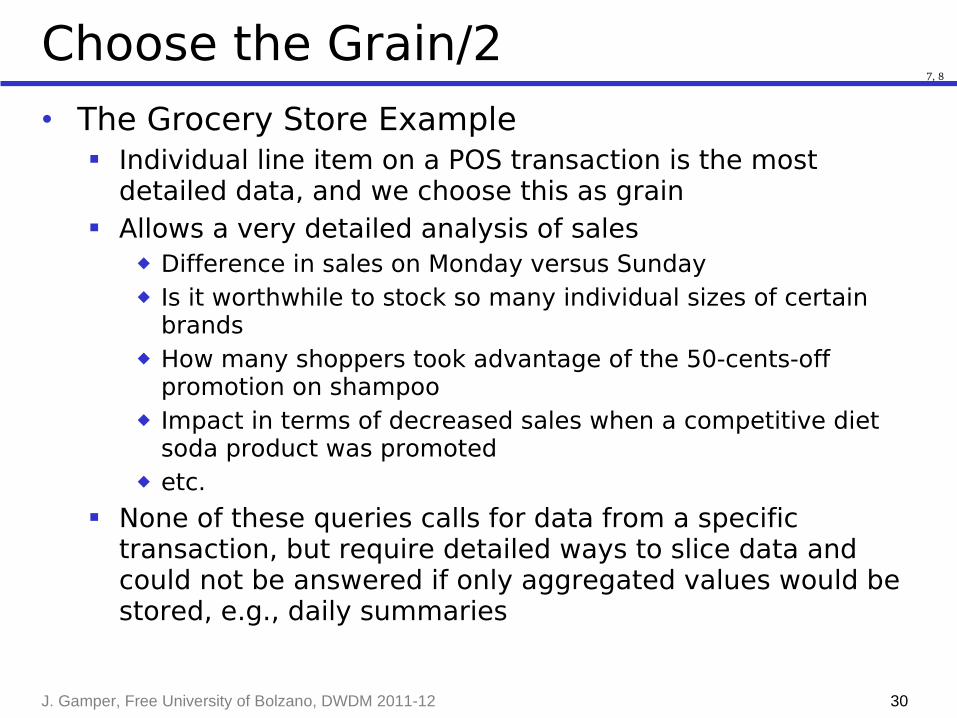
• The Grocery Store Example Individual line item on a POS transaction is the most
detailed data, and we choose this as grain Allows a very detailed analysis of sales
◆ Difference in sales on Monday versus Sunday◆ Is it worthwhile to stock so many individual sizes of certain
brands◆ How many shoppers took advantage of the 50-cents-off
promotion on shampoo◆ Impact in terms of decreased sales when a competitive diet
soda product was promoted◆ etc.
None of these queries calls for data from a specific transaction, but require detailed ways to slice data and could not be answered if only aggregated values would be stored, e.g., daily summaries
7, 8
J. Gamper, Free University of Bolzano, DWDM 2011-12 31
Choose the Dimensions/1
• Step 3: Choose the Dimensions A careful grain statement determines the primary
dimensionality of the fact table Often more dimensions can/might be added later Sometimes a revision of step 2 is required
7, 8
J. Gamper, Free University of Bolzano, DWDM 2011-12 32
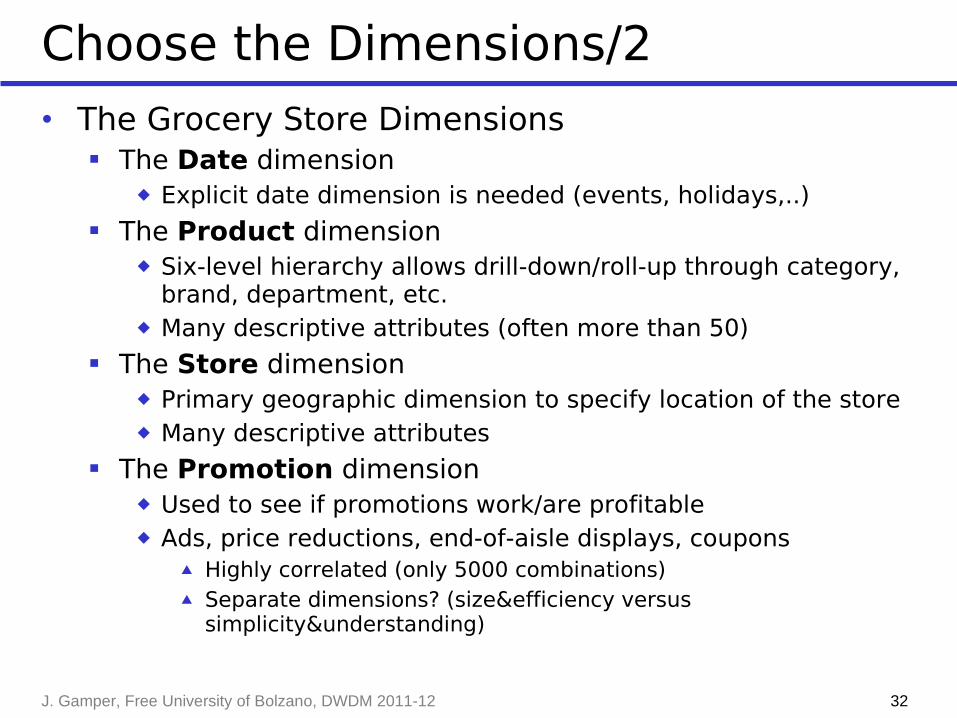
Choose the Dimensions/2
• The Grocery Store Dimensions The Date dimension
◆ Explicit date dimension is needed (events, holidays,..) The Product dimension
◆ Six-level hierarchy allows drill-down/roll-up through category, brand, department, etc.
◆ Many descriptive attributes (often more than 50) The Store dimension
◆ Primary geographic dimension to specify location of the store ◆ Many descriptive attributes
The Promotion dimension◆ Used to see if promotions work/are profitable◆ Ads, price reductions, end-of-aisle displays, coupons
▲ Highly correlated (only 5000 combinations)▲ Separate dimensions? (size&efficiency versus
simplicity&understanding)

J. Gamper, Free University of Bolzano, DWDM 2011-12 33
Choose the Dimensions/3
• Preliminary Grocery Store Schema (more details later)
Date DimensionDateKeyFull Date DescDay of WeekMonthYearQuartal...
POS Retail Sales Transaction Fact DateKey (FK)ProductKey (FK)StoreKey (FK)PromotionKey (FK)Facts TBD
Store DimensionStoreKey (PK)Store NameStore Street AddressStore CityStore Country...
Promotion Dimension PromotionKey (PK)Promotion NamePreice Reduction TypePrromotion Media TypeAd Type...
Product Dimension ProductKey (PK)Product DescrBrand DescripitonCategory DescriptionDepartment Description...
J. Gamper, Free University of Bolzano, DWDM 2011-12 34
Choose the Measures/1
• Step 4: Choose the Measures/Facts Measures are determined by the grain declaration Revision of the grain might be required
9

J. Gamper, Free University of Bolzano, DWDM 2011-12 35
Choose the Measures/2
• The Grocery Store Example Sales quantity Sales dollar amount Cost dollar amount Gross profit
◆ Equals to sales dollar – cost dollar◆ Explicit storage avoids user errors
9
Date DimensionDateKeyDate Attr TBD
POS Retail Sales Transaction Fact DateKey (FK)ProductKey (FK)StoreKey (FK)PromotionKey (FK)SalesQuantitySalesDollarAmountCostDollarAmountGrossProfitDollarAmount
Store DimensionStoreKey (PK)Store Attr TBD
Promotion Dimension PromotionKey (PK)Promotion Attr TBD
Product Dimension ProductKey (PK)Product Attr TBD
J. Gamper, Free University of Bolzano, DWDM 2011-12 36
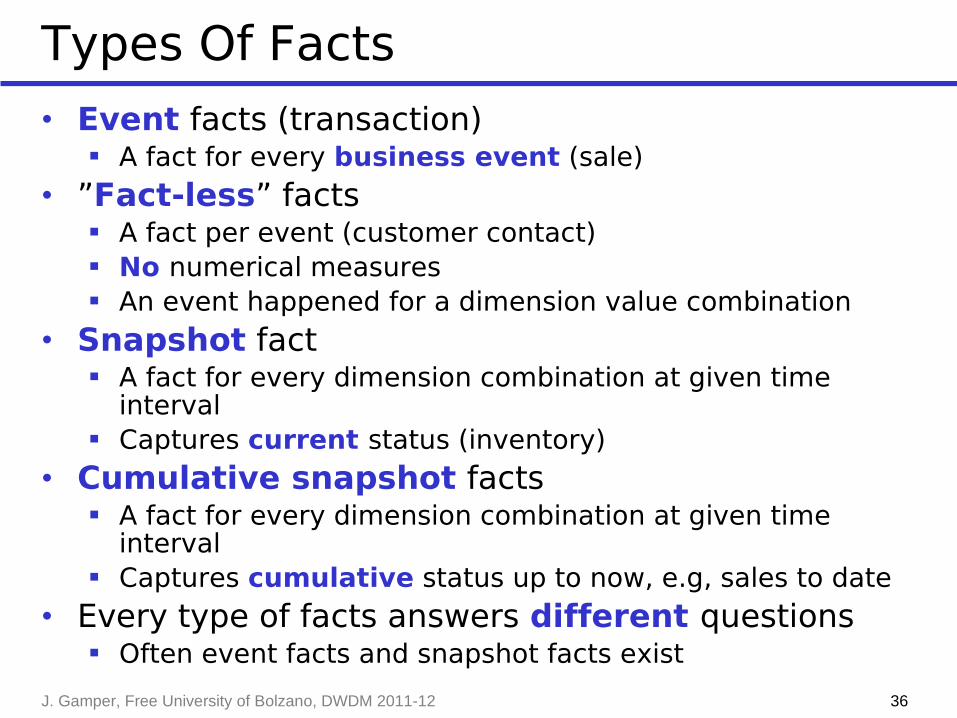
Types Of Facts
• Event facts (transaction) A fact for every business event (sale)
• ”Fact-less” facts A fact per event (customer contact) No numerical measures An event happened for a dimension value combination
• Snapshot fact A fact for every dimension combination at given time
interval Captures current status (inventory)
• Cumulative snapshot facts A fact for every dimension combination at given time
interval Captures cumulative status up to now, e.g, sales to date
• Every type of facts answers different questions Often event facts and snapshot facts exist
J. Gamper, Free University of Bolzano, DWDM 2011-12 37
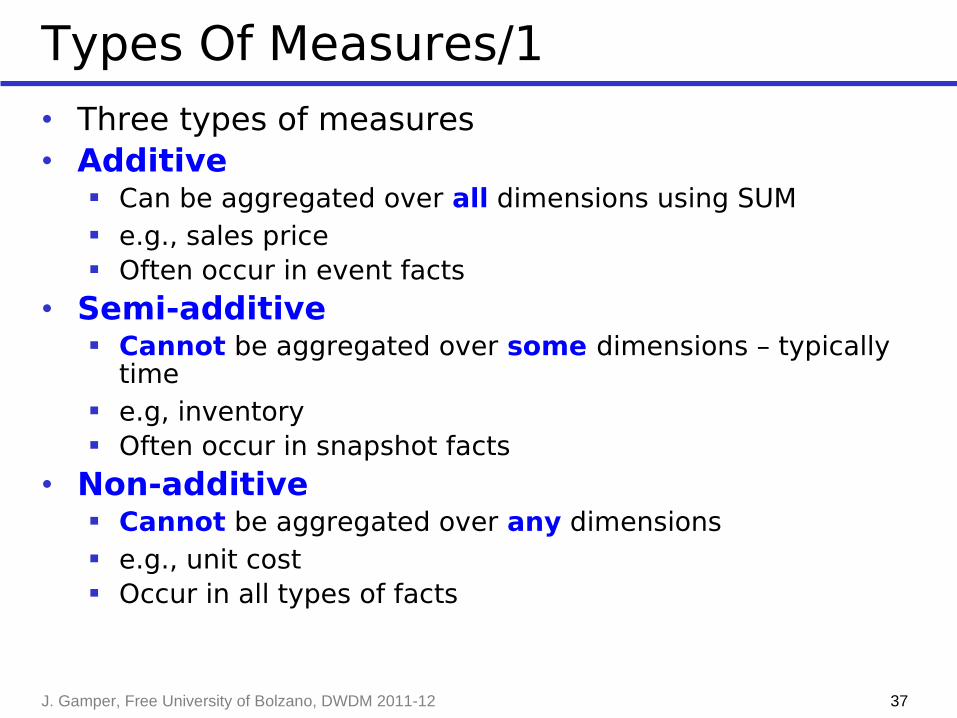
Types Of Measures/1
• Three types of measures• Additive
Can be aggregated over all dimensions using SUM e.g., sales price Often occur in event facts
• Semi-additive Cannot be aggregated over some dimensions – typically
time e.g, inventory Often occur in snapshot facts
• Non-additive Cannot be aggregated over any dimensions e.g., unit cost Occur in all types of facts
J. Gamper, Free University of Bolzano, DWDM 2011-12 38
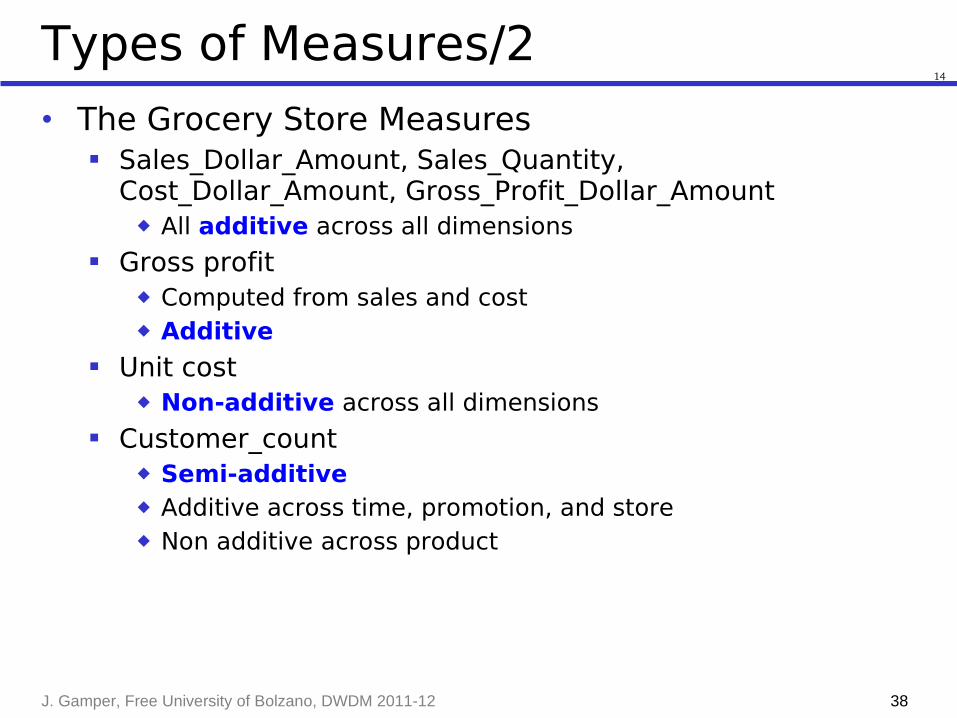
Types of Measures/2
• The Grocery Store Measures Sales_Dollar_Amount, Sales_Quantity,
Cost_Dollar_Amount, Gross_Profit_Dollar_Amount◆ All additive across all dimensions
Gross profit◆ Computed from sales and cost◆ Additive
Unit cost◆ Non-additive across all dimensions
Customer_count◆ Semi-additive◆ Additive across time, promotion, and store◆ Non additive across product
14

J. Gamper, Free University of Bolzano, DWDM 2011-12 39
Database Sizing
• Time dimension: 2 years = 730 days• Store dimension: 300 stores reporting each day• Product dimension: 30,000 products, only 3000 sell
per day• Promotion dimension: 5000 combinations, but a
product only appears in one combination per day• Number of fact records:
730*300*3000*1 = 657,000,000• Number of fields: 4 key + 4 measures = 8 fields• Total DB size:
657,000,000 * 8 fields * 4 bytes = 21 GB• Small database by today’s standards?

J. Gamper, Free University of Bolzano, DWDM 2011-12 40
More About Dimensions/1
• Date dimension Present in all DW Can be created in advance “Meaningful” values are important, e.g.,
for report generation◆ Holiday/Nonholiday vs. Yes/no
Time-of-day a separate dimension
• Date dimension vs. SQL date type Many date attributes are
not supported in SQL, e.g., fiscal month Business user is not versed in SQL Date dimension is relatively small 10 years = 3.650 rows
14
Date DimensionDateKeyDateFull Date DescriptionDay of WeekDay Number in EpochWeek Number in EpochDay Number in Calendar MonthDay Number in Calendar YearLast Day in Week IndicatorLast Day in Month IndicatorCalendar Week Ending DateCalendar quarterCalendar Year-QuarterCalendar Half YearCalendar YearFiscal WeekFiscal MonthFiscal QuarterFiscal Half YearFiscal YearHoliday IndicatorWeekday IndicatorSelling SeasonMajor Event…
J. Gamper, Free University of Bolzano, DWDM 2011-12 41
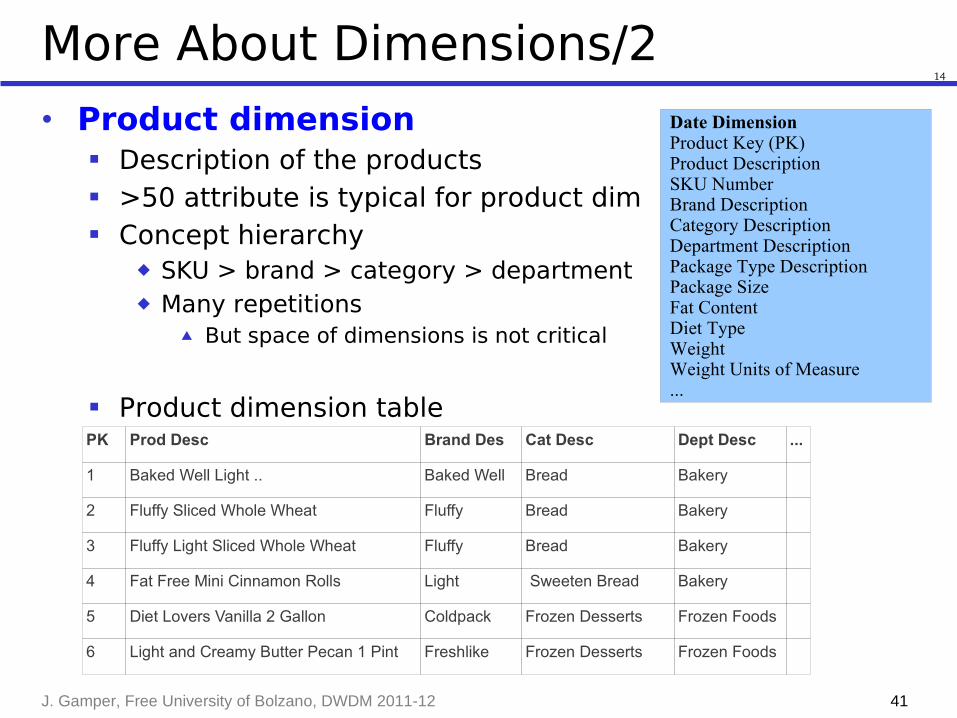
More About Dimensions/2
• Product dimension Description of the products >50 attribute is typical for product dim Concept hierarchy
◆ SKU > brand > category > department◆ Many repetitions
▲ But space of dimensions is not critical
Product dimension table
14
Date DimensionProduct Key (PK)Product DescriptionSKU NumberBrand DescriptionCategory DescriptionDepartment DescriptionPackage Type DescriptionPackage SizeFat ContentDiet TypeWeightWeight Units of Measure...
PK Prod Desc Brand Des Cat Desc Dept Desc ...
1 Baked Well Light .. Baked Well Bread Bakery
2 Fluffy Sliced Whole Wheat Fluffy Bread Bakery
3 Fluffy Light Sliced Whole Wheat Fluffy Bread Bakery
4 Fat Free Mini Cinnamon Rolls Light Sweeten Bread Bakery
5 Diet Lovers Vanilla 2 Gallon Coldpack Frozen Desserts Frozen Foods
6 Light and Creamy Butter Pecan 1 Pint Freshlike Frozen Desserts Frozen Foods

J. Gamper, Free University of Bolzano, DWDM 2011-12 42
More About Dimensions/3
• Degenerate dimensions are “empty”, i.e., dimension keys without dimension table
• Examples are operational control numbers, e,g., order #, invoice #, POS transaction #, etc.
Contain important information Still useful to serve as part of primary key in fact table or
for grouping◆ e.g, grouping by POS transaction number to retrieve all
products purchased in a single transaction
14
Date Dimension
POS Retail Sales Transaction Fact DateKey (FK)ProductKey (FK)StoreKey (FK)PromotionKey (FK)POS Transaction Number (DD)SalesQuantitySalesDollarAmountCostDollarAmountGrossProfitDollarAmount
Store Dimension
Promotion Dimension
Product Dimension

J. Gamper, Free University of Bolzano, DWDM 2011-12 43
More About Dimensions/4
• Too many dimensions is bad A sign that dimensions are not independent, and hence
should be combined Significantly increases space requirements of fact table 15 dimensions should normally be enough
14
Week Dimension
POS Retail Sales Transaction Fact Date Key (FK)Week Key (FK)Month Key (FK)Quarter Key (FK)Year Key (FK)Product Key (FK)Brand Key (FK)Subcategory Key (FK)Category Key (FK)Store Key (FK)Store Country (FK)Store State Key (FK)PromotionKey (FK)SalesQuantitySalesDollarAmountCostDollarAmountGrossProfitDollarAmount
Store Dimension Promotion Dimension
Brand Dimension
Date Dimension
Month Dimension
Quarter Dimension
Date Dimension
Product Dimension
Category Dimension
Subcategory Dimension
J. Gamper, Free University of Bolzano, DWDM 2011-12 44
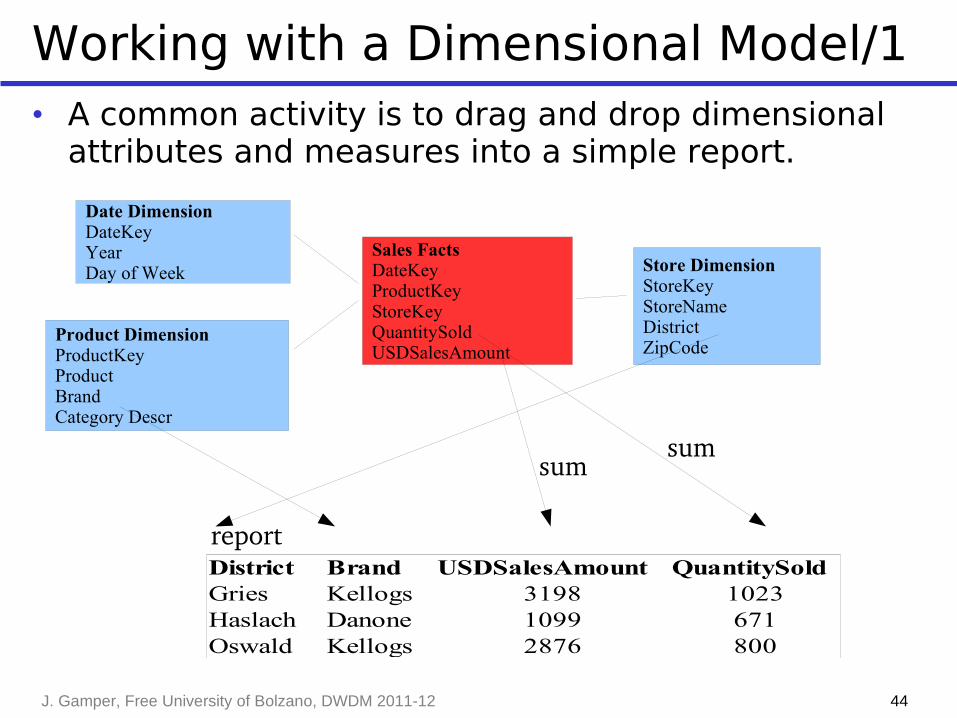
Working with a Dimensional Model/1• A common activity is to drag and drop dimensional
attributes and measures into a simple report.
Date DimensionDateKeyYearDay of Week
Sales Facts DateKeyProductKeyStoreKeyQuantitySoldUSDSalesAmount
Product DimensionProductKeyProductBrandCategory Descr
Store Dimension StoreKeyStoreNameDistrictZipCode
District Brand USDSalesAmount QuantitySoldGries Kellogs 3198 1023Haslach Danone 1099 671Oswald Kellogs 2876 800
report
sumsum
J. Gamper, Free University of Bolzano, DWDM 2011-12 45
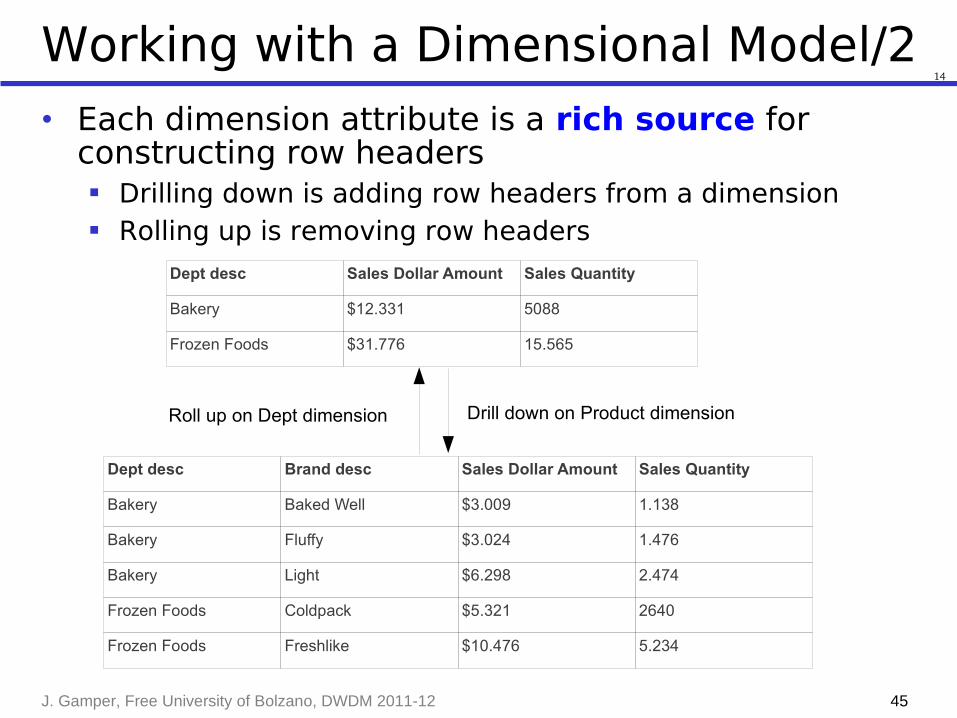
Working with a Dimensional Model/2• Each dimension attribute is a rich source for
constructing row headers Drilling down is adding row headers from a dimension Rolling up is removing row headers
14
Dept desc Sales Dollar Amount Sales Quantity
Bakery $12.331 5088
Frozen Foods $31.776 15.565
Dept desc Brand desc Sales Dollar Amount Sales Quantity
Bakery Baked Well $3.009 1.138
Bakery Fluffy $3.024 1.476
Bakery Light $6.298 2.474
Frozen Foods Coldpack $5.321 2640
Frozen Foods Freshlike $10.476 5.234
Roll up on Dept dimension Drill down on Product dimension

J. Gamper, Free University of Bolzano, DWDM 2011-12 46
Surrogate Keys
• Surrogate keys are integers that are assigned sequentially in a dimension table, e.g., 1, 2, 3, …
• Should be used instead of natural operational production codes.
• Many advantages over operational codes Make the DW independent from operational changes
◆ e.g., re-use of old operational keys after some time Avoid key overlap problem when consolidating data Dimension keys should not contain “intelligence”
◆ Should be stored explicitly as additional attribute Performance: Small integer vs. long alpha-numeric code
◆ Results in smaller fact tables◆ 1 Byte in a 1 billion fact table translates into 1 GB disk space
14
J. Gamper, Free University of Bolzano, DWDM 2011-12 47
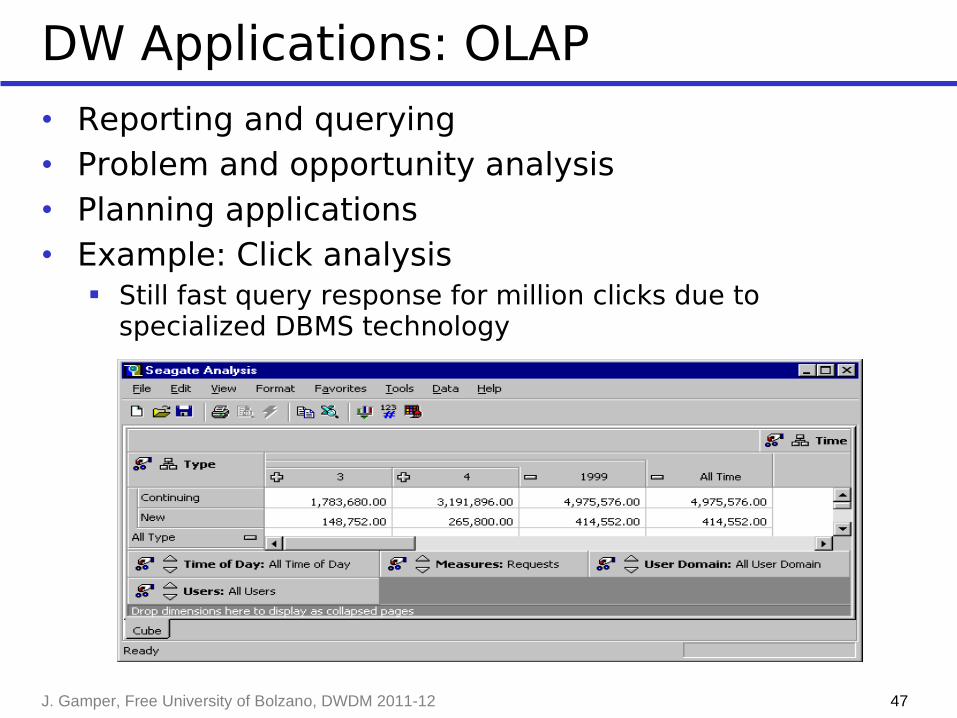
DW Applications: OLAP
• Reporting and querying• Problem and opportunity analysis• Planning applications• Example: Click analysis
Still fast query response for million clicks due to specialized DBMS technology

J. Gamper, Free University of Bolzano, DWDM 2011-12 48
(Relational) OLAP Queries
• Aggregating data, e.g., with SUM• Starting level: (Quarter, Product)• Roll Up: less detail, Quarter->Year• Drill Down: more detail, Quarter->Month• Slice/Dice: selection, Year=1999• Drill Across: “join” on common dimensions• Visualization and exceptions• Note: only two kinds of queries
Navigation queries examine one dimension ◆ SELECT DISTINCT l FROM d [WHERE p]
Aggregation queries summarize fact data ◆ SELECT d1.l1,d2.l2,SUM(f.m)
FROM d1,d2,fWHERE f.dk1=d1.dk1 AND f.dk2=d2.dk2 [AND p] GROUP BY d1.l1,d2.l2
J. Gamper, Free University of Bolzano, DWDM 2011-12 49
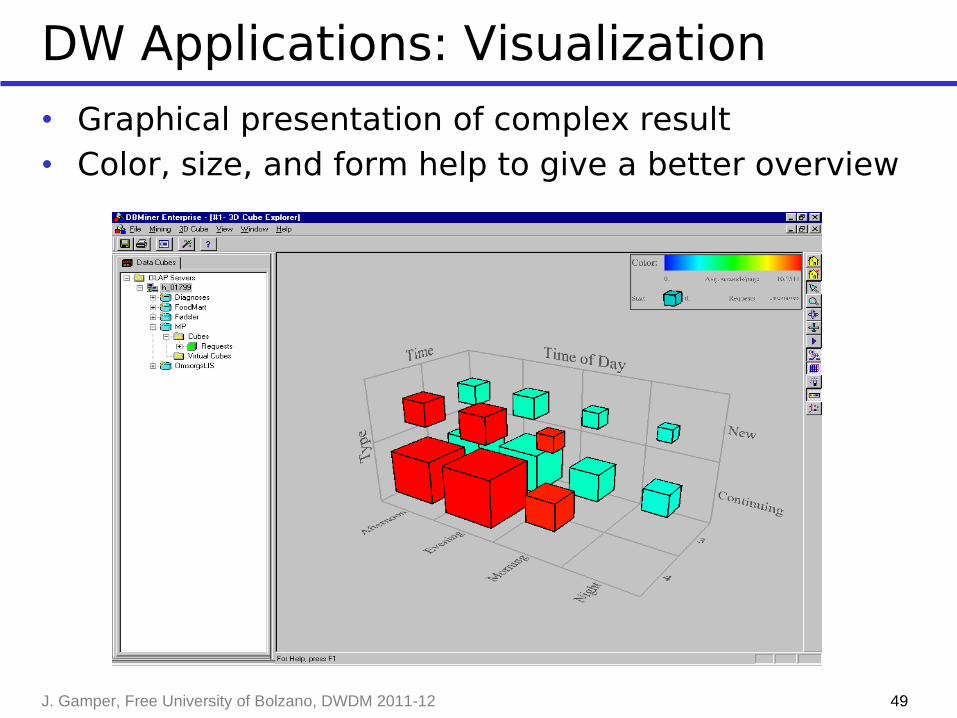
DW Applications: Visualization
• Graphical presentation of complex result• Color, size, and form help to give a better overview

J. Gamper, Free University of Bolzano, DWDM 2011-12 50
DW Applications: Data Mining/1
• Data mining is automatic knowledge discovery• Roots in AI and statistics• Classification
Partition data into pre-defined classes
• Prediction Predict/estimate unknown value based on similar cases
• Clustering Partition data into groups so the similarity within individual
groups are greatest and the similarity between groups are smallest
• Affinity grouping/associations Find associations/dependencies between data Rules: A -> B (c%,s%): if A occurs, B occurs with
confidence c and support s
• Important to choose the granularity for mining Too small granularity gives no good results (shirt brand,..)

J. Gamper, Free University of Bolzano, DWDM 2011-12 51
DW Applications: Data Mining/2
• Wal-Mart: USA’s largest supermarket chain Has DW with all ticket item sales for the last 2 years (big!) Use DW and mining heavily to gain business advantages Analysis of association within sales tickets
◆ Discovery: Beer and diapers on the same ticket◆ Men buy diapers, and must ”just have a beer”◆ Put the expensive beers next to the diapers ◆ Put beer at some distance from diapers with chips, videos in-
between! Wal-Mart's suppliers use the DW to optimize delivery
◆ The supplier puts the product on the shelf◆ The supplier only get paid when the product is sold
• Web log mining What is the association between time of day and
requests? What user groups use my site? How many requests does my site get in a month? (Yahoo)
J. Gamper, Free University of Bolzano, DWDM 2011-12 52
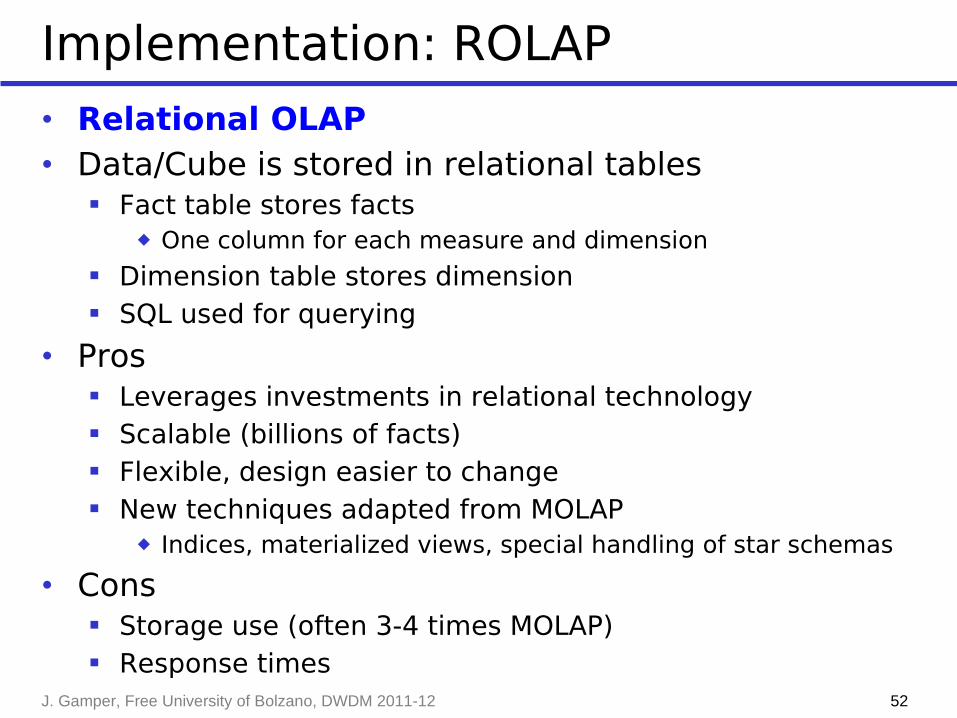
Implementation: ROLAP
• Relational OLAP• Data/Cube is stored in relational tables
Fact table stores facts◆ One column for each measure and dimension
Dimension table stores dimension SQL used for querying
• Pros Leverages investments in relational technology Scalable (billions of facts) Flexible, design easier to change New techniques adapted from MOLAP
◆ Indices, materialized views, special handling of star schemas
• Cons Storage use (often 3-4 times MOLAP) Response times
J. Gamper, Free University of Bolzano, DWDM 2011-12 53
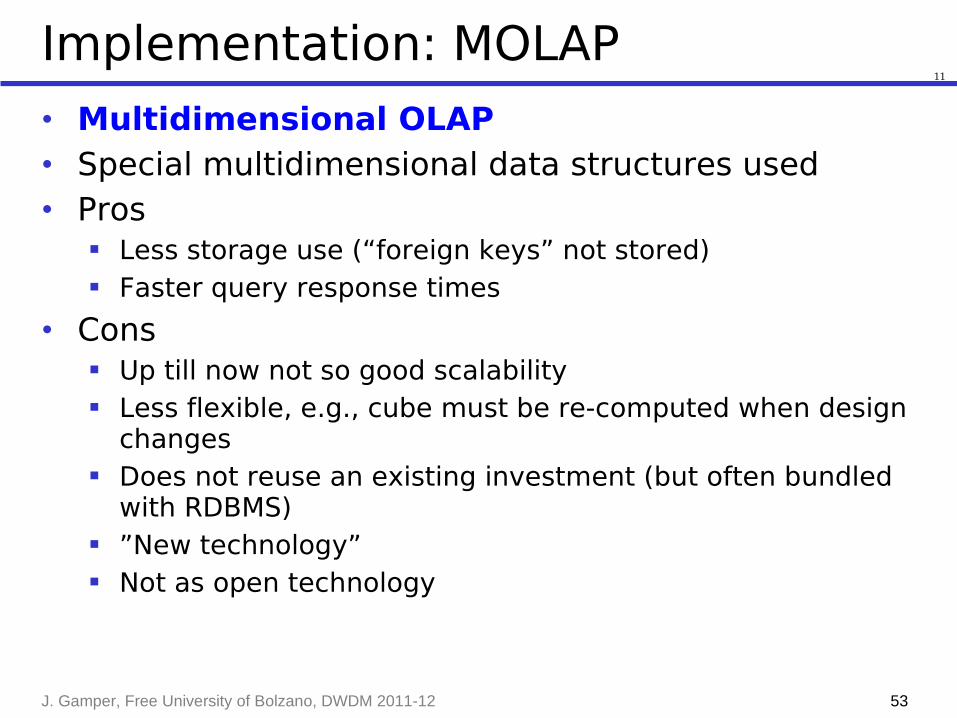
Implementation: MOLAP
• Multidimensional OLAP• Special multidimensional data structures used• Pros
Less storage use (“foreign keys” not stored) Faster query response times
• Cons Up till now not so good scalability Less flexible, e.g., cube must be re-computed when design
changes Does not reuse an existing investment (but often bundled
with RDBMS) ”New technology” Not as open technology
11

J. Gamper, Free University of Bolzano, DWDM 2011-12 54
Implementation: HOLAP
• Hybrid OLAP• Aggregates stored in multidimensional structures
(MOLAP)• Detail data stored in relational tables (ROLAP)• Pros
Scalable Fast
• Cons Complexity

J. Gamper, Free University of Bolzano, DWDM 2011-12 55
Relational Design
• One completely de-normalized table Bad: inflexibility, storage use, bad performance, slow
update
• Star schema One fact table De-normalized dimension tables One column per level/attribute
• Snowflake schema Dimensions are normalized One dimension table per level Each dimension table has integer key, level name, and
one column per attribute

56
Star Schema Example/1
product
category
typesupplier
week
month
store city country
salesManager
WeekDT
StoreIDWeekID
ProductIDQuantityReceipts
StoreDT
ProductDT
WeekIDWeekMonth
StoreIDStoreCity
CountrySalesManager
ProductIDProduct
TypeCategorySupplier
SALE
quantity
receipts
SaleFT
J. Gamper, Free University of Bolzano, DWDM 2011-12 57
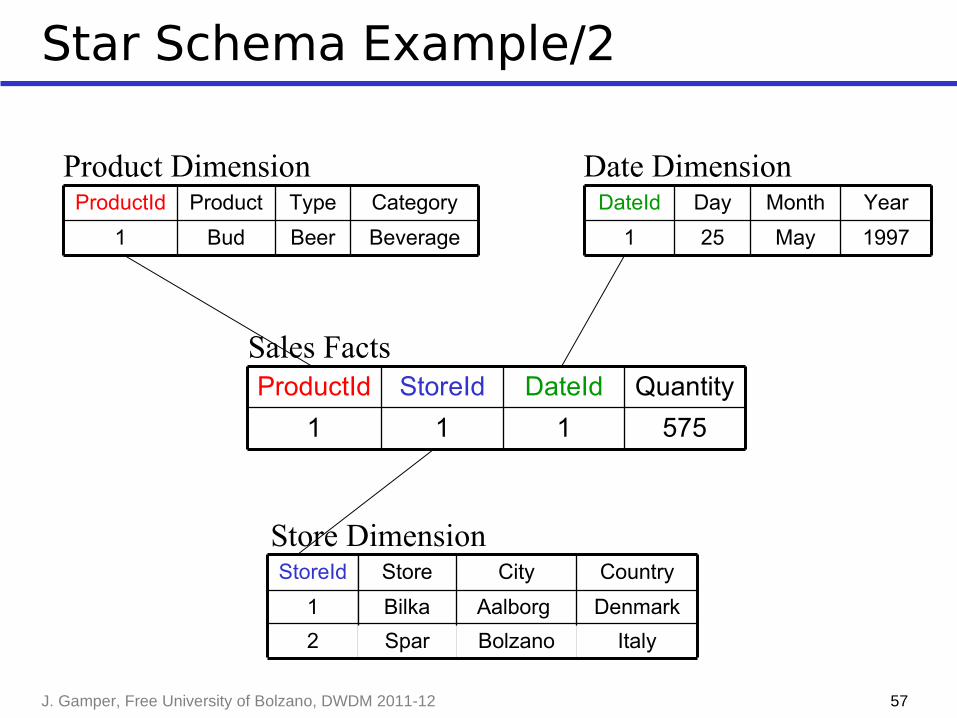
Star Schema Example/2
575111
QuantityDateIdStoreIdProductId
DenmarkAalborg Bilka1
CountryCityStoreStoreId
1997May251
YearMonthDayDateId
BeverageBeerBud1
CategoryTypeProductProductId
Product Dimension Date Dimension
Sales Facts
Store Dimension
ItalyBolzanoSpar2
58
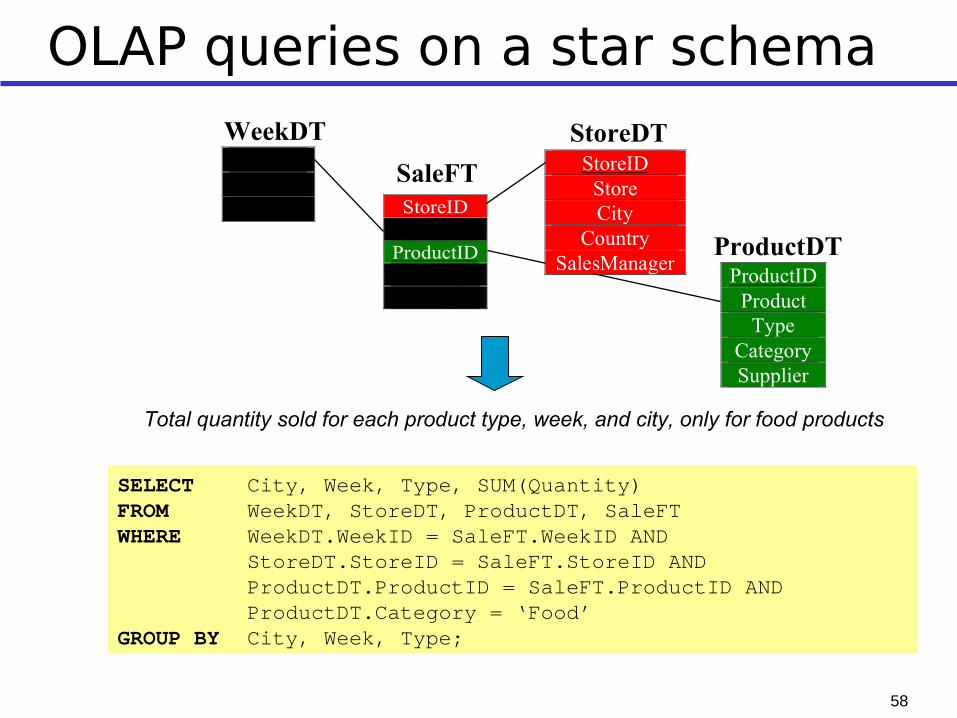
OLAP queries on a star schema
Total quantity sold for each product type, week, and city, only for food products
SELECT City, Week, Type, SUM(Quantity)FROM WeekDT, StoreDT, ProductDT, SaleFTWHERE WeekDT.WeekID = SaleFT.WeekID AND
StoreDT.StoreID = SaleFT.StoreID AND ProductDT.ProductID = SaleFT.ProductID AND ProductDT.Category = ‘Food’
GROUP BY City, Week, Type;
StoreIDWeekID
ProductIDQuantityReceipts
WeekIDWeekMonth
StoreIDStoreCity
CountrySalesManager
ProductIDProduct
TypeCategorySupplier
WeekDT StoreDT
ProductDT
SaleFT
59
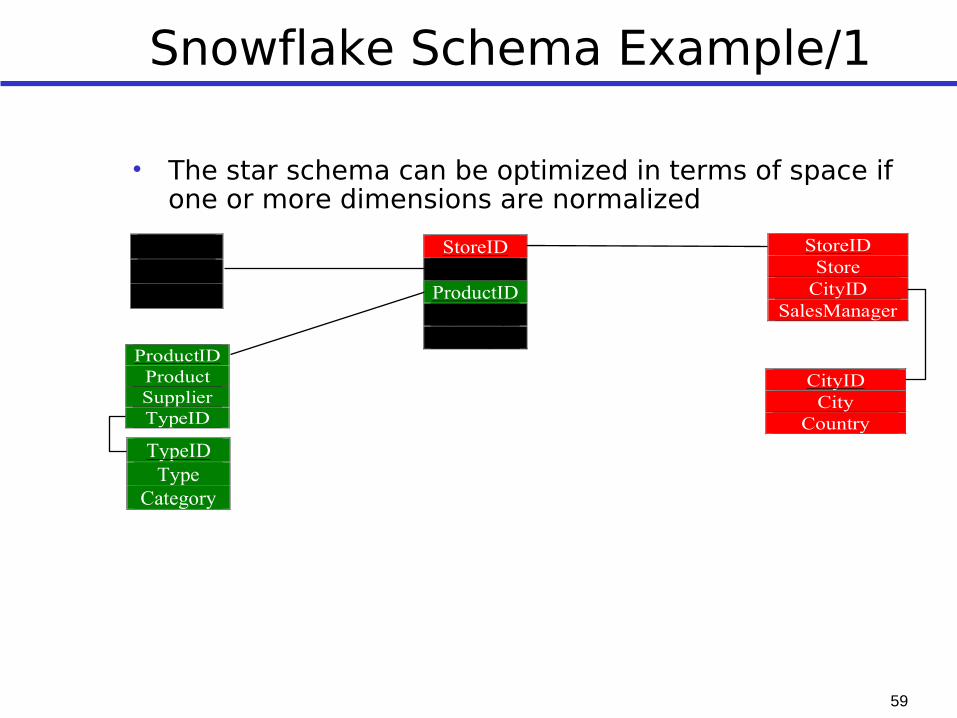
Snowflake Schema Example/1
• The star schema can be optimized in terms of space if one or more dimensions are normalized
WeekIDWeekMonth
StoreIDStore
CityIDSalesManager
ProductIDProductSupplierTypeID
TypeIDType
Category
CityIDCity
Country
StoreIDWeekID
ProductIDQuantityReceipts

J. Gamper, Free University of Bolzano, DWDM 2011-12 60
Snowflake Schema Example/2
5.75111
SaleDateIdStoreIdProductId
1251
MonthIdDayDateId
1Bud1
TypeIdProductProductId
1Beer1
CategoryIdTypeTypeId
1997May1
YearIdMonthMonthId
Product Dimension
Product Type
Sales Facts
Date Dimension
DenmarkAalborg Bilka1
CountryCityStoreStoreId
Store Dimension
ItalyBolzanoSpar2
MonthYear Description
61
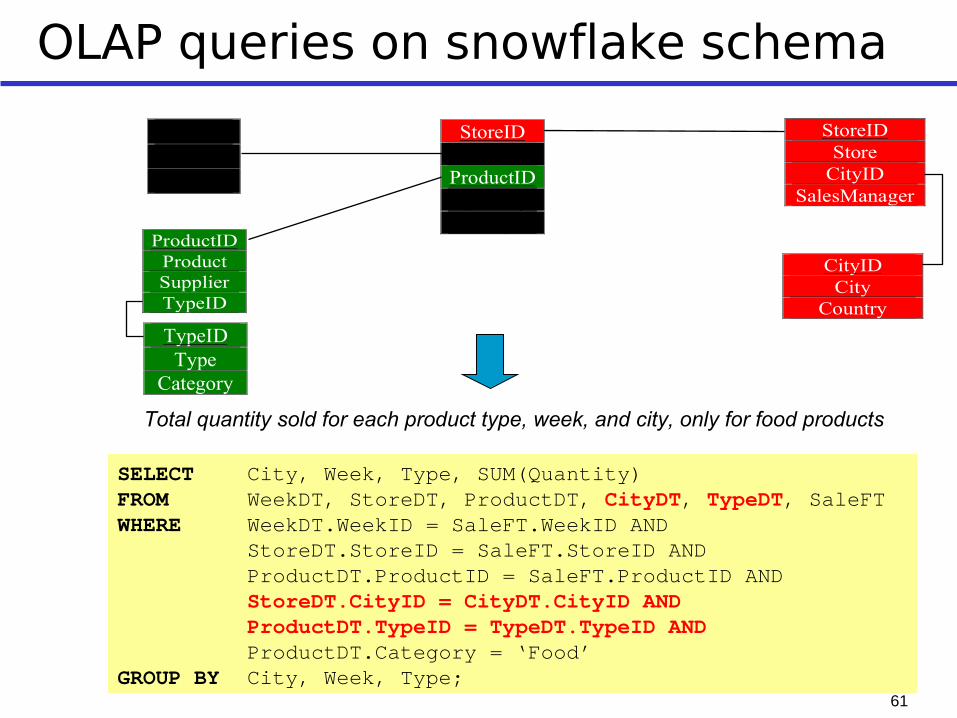
OLAP queries on snowflake schema
Total quantity sold for each product type, week, and city, only for food products
SELECT City, Week, Type, SUM(Quantity)FROM WeekDT, StoreDT, ProductDT, CityDT, TypeDT, SaleFTWHERE WeekDT.WeekID = SaleFT.WeekID AND
StoreDT.StoreID = SaleFT.StoreID AND ProductDT.ProductID = SaleFT.ProductID ANDStoreDT.CityID = CityDT.CityID ANDProductDT.TypeID = TypeDT.TypeID ANDProductDT.Category = ‘Food’
GROUP BY City, Week, Type;
WeekIDWeekMonth
StoreIDStore
CityIDSalesManager
ProductIDProductSupplierTypeID
TypeIDType
Category
CityIDCity
Country
StoreIDWeekID
ProductIDQuantityReceipts

J. Gamper, Free University of Bolzano, DWDM 2011-12 62
Star Schema
• + Simple and easy overview -> ease-of-use• + Relatively flexible• + Fact table is normalized• + Dimension tables often relatively small• + “Recognized” by many RDBMSes -> good
performance• - Hierarchies are ”hidden” in the columns• - Dimension tables are de-normalized
J. Gamper, Free University of Bolzano, DWDM 2011-12 63
Snow-flake Schemas
• + Hierarchies are made explicit/visible• + Very flexible• + Dimension tables use less space
However this is a minor saving Disk space of dimensions is typically less than 5 percent of
disk for DW
• - Harder to use due to many joins• - Worse performance
e.g., efficient bitmap indexes are not applicable
J. Gamper, Free University of Bolzano, DWDM 2011-12 64
Redundancy in DW
• Only very little redundancy in fact tables The same fact data (generally) only stored in one fact
table
• Redundancy is mostly in dimension tables Star dimension tables have redundant entries for the
higher levels
• Redundancy problems? Inconsistent data – the central load process helps with this Update time – the DW is optimized for querying, not
updates Space use: dimension tables typically take up less than
5% of DW
• So: controlled redundancy is good Up to a certain limit
J. Gamper, Free University of Bolzano, DWDM 2011-12 65
Limits And Strengths
• Many-to-one relationship from fact to dimension• Many-to-one relationships from lower to higher
levels in the hierarchies• Therefore, it is impossible to ”count wrong”• Hierarchies have a fixed height• Hierarchies don’t change?

J. Gamper, Free University of Bolzano, DWDM 2011-12 66
References• Ralph Kimball. The Data Warehouse Toolkit, Wiley, 1996• R. Kimball and Margy Ross. The Data Warehouse Toolkit,
Wiley, 2002• R. Kimball et al. The Data Warehouse Lifecycle Toolkit, Wiley, 1998• R. Kimball and R. Merz. The Data Webhouse Toolkit, Wiley, 2000.
• R. Kimball. Data Webhouse Column <intelligententerprise.com>
• Meta Group. 1999 DW Marketing Trends <metagroup.com>
• Palo Alto Management Group. 1999 BI and DW Program Competitive Analysis Report, <pamg.com>
• Erik Thomsen. OLAP Solutions, Wiley, 1997.• Erik Thomsen et al. Microsoft OLAP Solutions, Wiley, 1999.
• DBMiner Technology <dbminer.com>
• The OLAP Council <olapcouncil.org>
• The OLAP Report <olapreport.com>
• The Data Warehousing Information Center <dwinfocenter.org>
• DSS Lab <dsslab.com>
J. Gamper, Free University of Bolzano, DWDM 2011-12 67
Summary
• Conceptual model and logical model• Multidimensional model as de facto standard
logical model• Dimensions, Facts, Measures• Multidimensional cubes• Case study
Grocery store
• Relational design• Redundancy, strengths and weaknesses
16, 17, 18