User Data Warehouse Warehouse DBMS A DBMS B DBMS C Database Data warehouse example.

Project OverviewSpring 2017
L E A R N . D O . L I V E
Data Warehouse Expansion Project

Purpose
The purpose ….
Expand the reporting capabilities of the data warehouse by providing dynamic dashboards, self-service analytics, and new data marts.

How…?Design relevant dynamic dashboards and self-service analytics populated by functional data marts:1. To validate the current environment and ensure best practice, an initial
assessment will be performed by an expert consultant.2. Utilize an expansion team to define the scope of the project (e.g., the number of
dashboards with which to go-live).
3. Meet with key stakeholders to discuss institutional goals and how best how to measure them (e.g., RCM, enrollment, accreditation, and time-to-degree).
4. Discover, define, extract ,and load data so as to create a data schema (skeleton structure that defines data organization, relations, and constraints).
5. Apply best practice data visualization design to measurements in an online user-interface such as dashboards.
Objectives
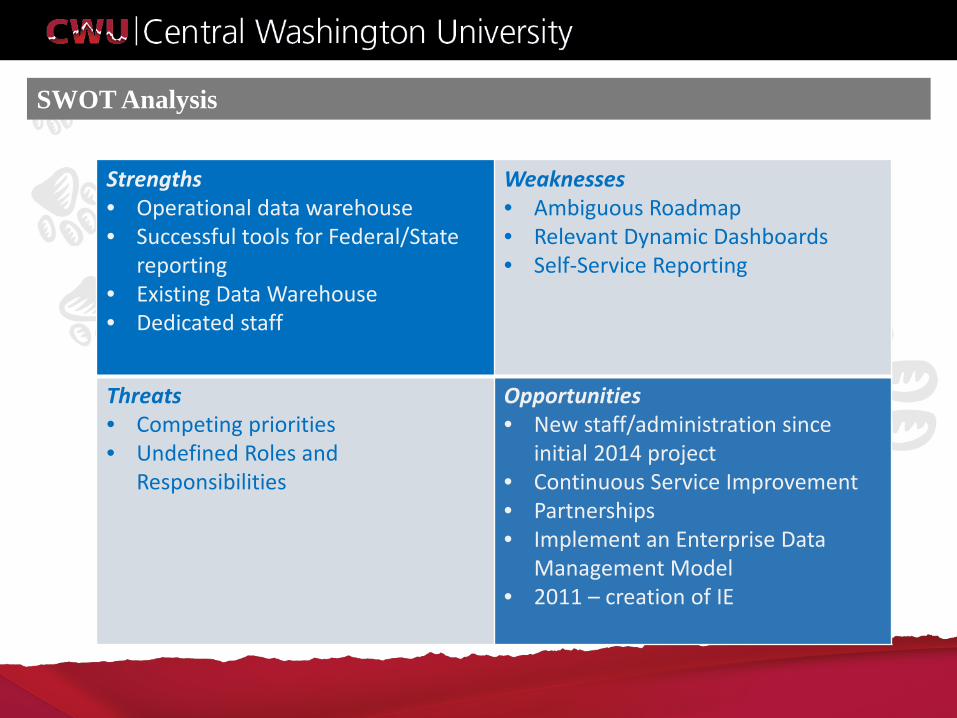
SWOT Analysis
Strengths• Operational data warehouse • Successful tools for Federal/State
reporting • Existing Data Warehouse• Dedicated staff
Weaknesses• Ambiguous Roadmap• Relevant Dynamic Dashboards• Self-Service Reporting
Threats• Competing priorities• Undefined Roles and
Responsibilities
Opportunities• New staff/administration since
initial 2014 project• Continuous Service Improvement• Partnerships• Implement an Enterprise Data
Management Model• 2011 – creation of IE

Task Force on Trend Reporting (2011)
http://www.cwu.edu/associate-provost/sites/cts.cwu.edu.associate-provost/files/NWCCU%20Year%20One%20Report%209-11-11.pdf
When and why was IE established?
NWCCU – September 2011 Self-Study Report
Recommendation 3. The Evaluation Committee recommends that Central Washington University enhance its overall capacity for institutional research to define and analyze data in a consistent and systematic manner for sharing with all its constituencies in order to support effective and timely decision making (Standard 6.C.7).

Task Force on Trend Reporting (2011)
Institutional Effectiveness: A new institutional effectiveness unit has been created to lead the university in the integration of planning, evaluation and budgeting; provide greater transparency in planning and research; ensure the development of benchmarks for all divisions; and assist in the development of business plans.
Response to NWCCU recommendations:

Task Force on Trend Reporting (2011)
http://www.cwu.edu/associate-provost/sites/cts.cwu.edu.associate-provost/files/NWCCU%20Year%20One%20Report%209-11-11.pdf

Task Force on Trend Reporting (2011)
Responsible for providing comprehensive inventory of key trends and performance indicators. These trends would serve as regular summary reporting in a dashboard format while being monitored frequently in greater detail. A web-based management information system that provides self-service reporting access both to the President’s Cabinet and to a wider audience.
16 member task force -- representing all divisions was directed to submit a written report containing recommendations to resolve reporting situation on campus.

Task Force on Trend Reporting (2011)

Task Force on Trend Reporting (2011)
Of the master list of 643 reporting options of key trends and performance indicators, 26 reporting options were decided upon for regular reporting to the President’s Cabinet.

Task Force on Trend Reporting (2011)
Preference given to trends that aligned with:
• The Integrated Postsecondary Education Data System (IPEDS)• The National Association of College and University Business Officers (NACUBO).(NACUBO definitions and standards for financial reporting measures are adopted inIPEDS.)• The Common Data Set Initiative.• The National Study of Instructional Costs and Productivity managed by the University ofDelaware. (This study provides discipline-specific benchmarks, not just on instructionalactivity, but also on sponsored research and public service.)• The Public Centralized Higher Education Enrollment System (PCHEES) managed by theState of Washington Office of Financial Management (OFM).• The “Complete to Compete” accountability measures developed by the NationalGovernor’s Association. (These measures were recommended by the State ofWashington Task Force on Higher Education; and Governor Gregoire’s budget bill directsOFM to evaluate the performance of CWU and the other Washington public highereducation institutions by these measures when making higher education appropriationrecommendations.)• The Accountability Framework Report on Higher Education provided to the WashingtonState Legislature by the Washington Higher Education Coordinating Board (HECB).

Task Force on Trend Reporting (2011)
Why was preference given?
Nationally recognized affiliations adhere and calculate numbers using
the same data definitions.
Work smarter, not harder.

Task Force on Trend Reporting (2011)
0
1
2
3
4
5
6
7
8
HR Finance Student
Regularly Reported Top Trends
Completed Outstanding

Task Force on Trend Reporting (2011)
Human Resource Reporting Trends (completed):• Number of full-time equivalent employees per quarter and year – span 5 years,
disaggregated by employee type (faculty, classified, exempt, etc)

Task Force on Trend Reporting (2011)
Human Resource Reporting Trends (outstanding):• Number of Full-Time equivalent students taught per full-time equivalent instructional
faculty member per quarter. 5 year span, disaggregated by college and department.• Number of Full-Time equivalent students taught per full-time equivalent instructional
faculty member per quarter. 5 year span, disaggregated by instructional delivery sight.• Number of majors/minors per full-time equivalent instructional faculty member – 5
year span, disaggregated by college, department• Number of degrees awarded per full-time equivalent instructional faculty member per
quarter – 5 year span, disaggregated by college, department• Number of searches, hires, retirements and separations – 5 year span, disaggregated by
employee type• Number of full-time equivalent faculty per quarter – 5 year span, disaggregated by
faculty activity• Average faculty salary per year – span 5 years, disaggregated by rank

Task Force on Trend Reporting (2011)
Financial Reporting Trends (outstanding):• Total Revenues – minus expenses per quarter – 5 year span, disaggregated by revenue
(149 vs 148)• Core Revenues per quarter – 5 year span, disaggregated by revenue source• Core Expenses per quarter and year – 5 year span, disaggregated by function• Average cost of attendance, average financial need, average aid awarded - 5 year span• Total Financial Aid awarded per quarter and year – 5 year span, disaggregated by aid
type• Revenue from instruction, minus instructional expense per full-time equivalent student
– 5 year span, disaggregated by college/dept• Revenue from instruction, minus instructional expense per full-time equivalent student
– 5 year span, disaggregated by instructional delivery site

Task Force on Trend Reporting (2011)
Student Data Reporting Trends (completed):• Number of applicants, admits, confirmed admits, and newly-enrolled
students per quarter – 5 year span• Total number of enrolled students and FTE per quarter – 5 year span• Number of enrolled students per quarter – 5 year span,
disaggregated by enrollment site• Number of enrolled students per quarter – 5 year span,
disaggregated by admissions type• Number of enrolled students per quarter – 5 year span,
disaggregated by geographic origin

Task Force on Trend Reporting (2011)
Student Data Reporting Trends (outstanding):• 1 & 2 year retention rates for full-time baccalaureate students – 5
year span, disaggregated by admissions type• Number and percentage of baccalaureate students enrolled in
remedial math and English courses – 5 year span, disaggregated by course subject.
• Average cumulative GPA for baccalaureate students per quarter/year.• 4, 5, & 6 year graduation rates for full-time, first-time baccalaureate
students per year – span 5 years

Task Force on Trend Reporting (2011)
Non-PeopleSoft Data:• Number and Percentage of Students Cited for Conduct Violations per
Quarter and Year over 5 Years, disaggregated by Type of Violation (e.g., Drugs, Alcohol, Noise).

Project Team Members
Project Team Members
Project Team Members

Development Life Cycle of BI
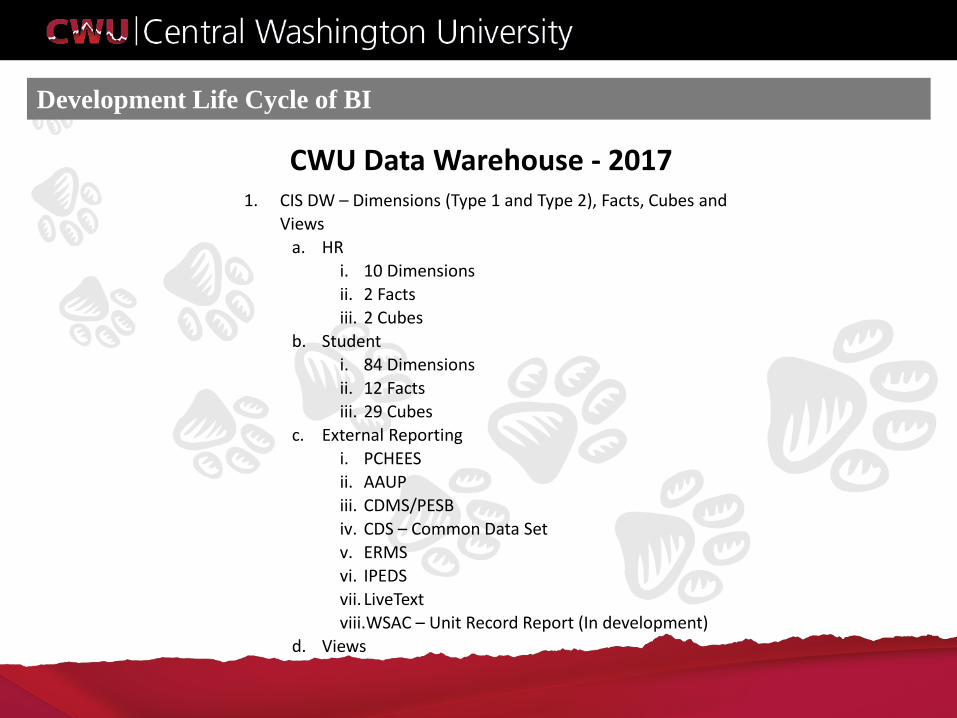
CWU Data Warehouse - 2017

Development Life Cycle of BI
CWU Data Warehouse - 2017
Development Life Cycle of BI
CWU Data Warehouse - 20171. CIS DW – Dimensions (Type 1 and Type 2), Facts, Cubes and
Viewsa. HR
i. 10 Dimensionsii. 2 Factsiii. 2 Cubes
b. Studenti. 84 Dimensionsii. 12 Factsiii. 29 Cubes
c. External Reportingi. PCHEESii. AAUPiii. CDMS/PESBiv. CDS – Common Data Setv. ERMSvi. IPEDSvii. LiveTextviii.WSAC – Unit Record Report (In development)
d. Views

Development Life Cycle of BI
CWU Data Warehouse - 2017

Development Life Cycle of BI
CWU Data Warehouse Evolvement ProjectAreas of Opportunity
Financials HCM
General Ledger Compensation
Accounts Payable Learning and Development
Accounts Receivable Recruiting
Grants Workforce Profile

Data Warehouse Evolvement
Where do we go from here?1. Commence DW Evolve Project
2. Baseline Assessment of existing3. Re-introduce 2011 trends
4. Other relevant reports (nVision, RCM)5. Continuous Improvement
5. Gather Requirements and Build

Project Schedule – One YearTask/Deliverable Initiating Planning Executing
Monitoring/Controlling
Monitoring/ Controlling
Closing
Apr ‘17May –
Sept ‘17Sept –
Nov ‘17Nov ‘17 –Feb ‘18
Mar ‘18 Apr ‘18
Preliminary Project Plan X
Professional Assessment of existing Data Warehouse
X
KPIs/Preliminary Dashboard Requirements
X
Data Architecture Design Requirements (ETL)
X
Preliminary Self-Service Analytics Requirements
X
Detailed Project Plan X
Initial Requirement Approvals X
Change Control & Migration Plan X
Development/Testing Commences
X
Dashboard /Report Design QA Testing by Stakeholder
X
Final Sign-off by Stakeholder X
Data Dictionary Updates (on-going)
X X X
End User Training Plan X X
Change Management X X X X X X
Go Live X

Critical Success Factors
Internal Critical Success Factors for Team:• Team Participation• Accountability• Communication• Closed loop feedback with stakeholders• Executive Sponsorship
Anything Else?

Critical Success Factors
Critical Success Factors for Project:• Achievable goals• Milestones being met• Change request process followed• Stakeholder Involvement• Data Dictionary• Adherence to development lifecycle• Education on PeopleSoft vs. Warehouse• Executive Sponsorship• Continual Service Improvement

Continual Service Improvement

Development Life Cycle of BI

Key Stakeholders and Governance
Key Stakeholders and Governance
Name Title
Andreas Bohman Chief Information Officer
Bernadette JungblutAssociate Provost for Accreditation and
Planning
Joel KluckingVice President of Business and
Financial Affairs
Joseph HanVice President of Operations – Executive
Sponsor
Staci Sleigh-Layman Executive Director of Human Resources

Timeline