DATA SNAPSHOT Global Study: ROI of Customer Experience
33
DATA SNAPSHOT Global Study: ROI of Customer Experience Bruce Temkin, CCXP, XMP Head of Qualtrics XM Institute Moira Dorsey, XMP XM Catalyst Talia Quaadgras Research Associate July 2021 www.xminstitute.com Copyright © 2021 Qualtrics®. All rights reserved.
Transcript of DATA SNAPSHOT Global Study: ROI of Customer Experience

DATA SNAPSHOT
Global Study: ROI of Customer ExperienceBruce Temkin, CCXP, XMPHead of Qualtrics XM Institute
Moira Dorsey, XMPXM Catalyst
Talia QuaadgrasResearch Associate
July 2021
www.xminstitute.comCopyright © 2021 Qualtrics®. All rights reserved.
www.xminstitute.comCopyright © 2021 Qualtrics®. All rights reserved.
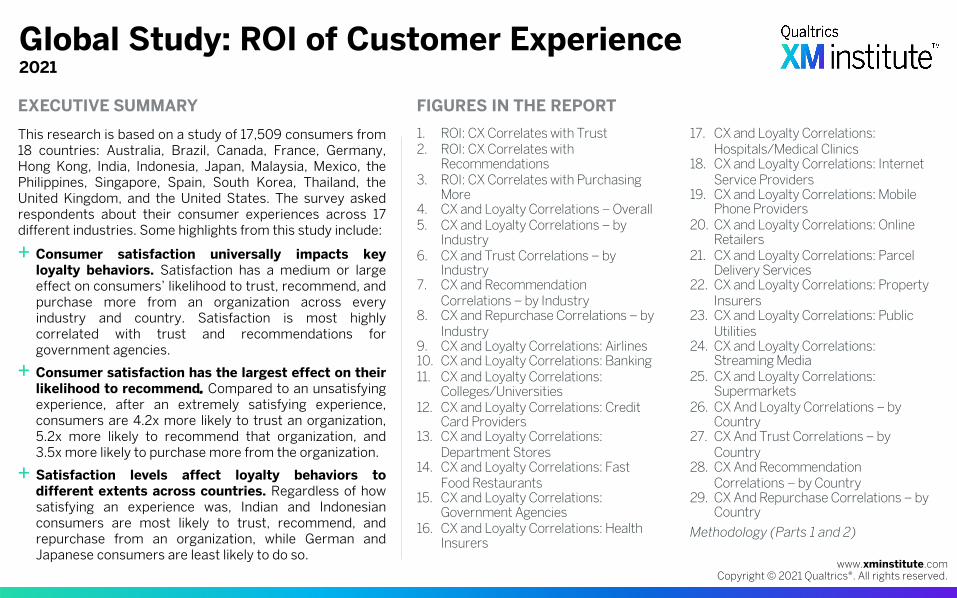
EXECUTIVE SUMMARY
This research is based on a study of 17,509 consumers from18 countries: Australia, Brazil, Canada, France, Germany,Hong Kong, India, Indonesia, Japan, Malaysia, Mexico, thePhilippines, Singapore, Spain, South Korea, Thailand, theUnited Kingdom, and the United States. The survey askedrespondents about their consumer experiences across 17different industries. Some highlights from this study include:
+ Consumer satisfaction universally impacts keyloyalty behaviors. Satisfaction has a medium or largeeffect on consumers’ likelihood to trust, recommend, andpurchase more from an organization across everyindustry and country. Satisfaction is most highlycorrelated with trust and recommendations forgovernment agencies.
+ Consumer satisfaction has the largest effect on theirlikelihood to recommend. Compared to an unsatisfyingexperience, after an extremely satisfying experience,consumers are 4.2x more likely to trust an organization,5.2x more likely to recommend that organization, and3.5x more likely to purchase more from the organization.
+ Satisfaction levels affect loyalty behaviors todifferent extents across countries. Regardless of howsatisfying an experience was, Indian and Indonesianconsumers are most likely to trust, recommend, andrepurchase from an organization, while German andJapanese consumers are least likely to do so.
Global Study: ROI of Customer Experience2021
FIGURES IN THE REPORT1. ROI: CX Correlates with Trust2. ROI: CX Correlates with
Recommendations3. ROI: CX Correlates with Purchasing
More4. CX and Loyalty Correlations – Overall5. CX and Loyalty Correlations – by
Industry6. CX and Trust Correlations – by
Industry7. CX and Recommendation
Correlations – by Industry8. CX and Repurchase Correlations – by
Industry9. CX and Loyalty Correlations: Airlines10. CX and Loyalty Correlations: Banking11. CX and Loyalty Correlations:
Colleges/Universities12. CX and Loyalty Correlations: Credit
Card Providers13. CX and Loyalty Correlations:
Department Stores14. CX and Loyalty Correlations: Fast
Food Restaurants15. CX and Loyalty Correlations:
Government Agencies16. CX and Loyalty Correlations: Health
Insurers
17. CX and Loyalty Correlations: Hospitals/Medical Clinics
18. CX and Loyalty Correlations: Internet Service Providers
19. CX and Loyalty Correlations: Mobile Phone Providers
20. CX and Loyalty Correlations: Online Retailers
21. CX and Loyalty Correlations: Parcel Delivery Services
22. CX and Loyalty Correlations: Property Insurers
23. CX and Loyalty Correlations: Public Utilities
24. CX and Loyalty Correlations: Streaming Media
25. CX and Loyalty Correlations: Supermarkets
26. CX And Loyalty Correlations – by Country
27. CX And Trust Correlations – by Country
28. CX And Recommendation Correlations – by Country
29. CX And Repurchase Correlations – by Country
Methodology (Parts 1 and 2)
www.xminstitute.comCopyright © 2021 Qualtrics®. All rights reserved.
KEY TAKEAWAYS
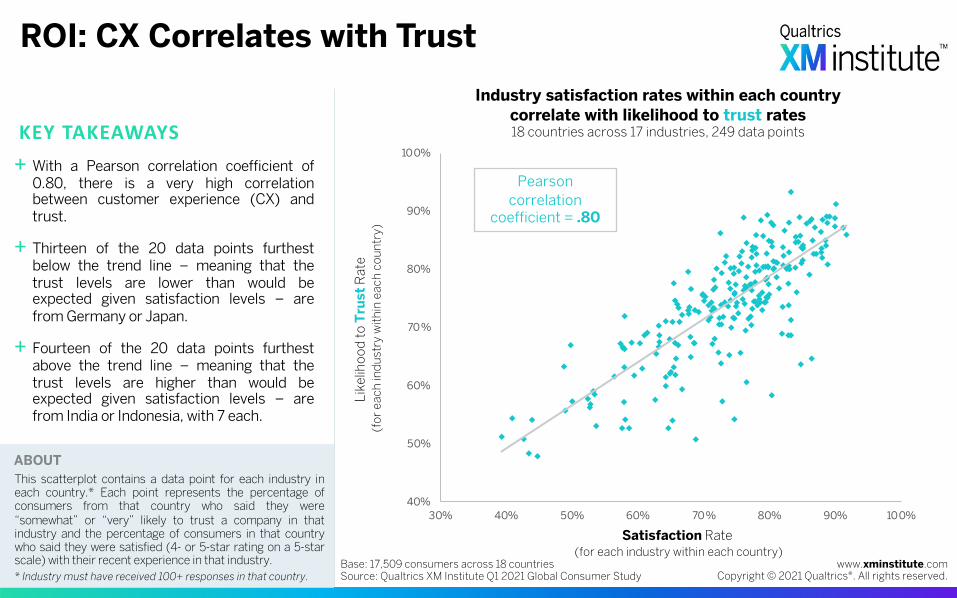
ROI: CX Correlates with TrustIndustry satisfaction rates within each country
correlate with likelihood to trust rates18 countries across 17 industries, 249 data points
+ With a Pearson correlation coefficient of0.80, there is a very high correlationbetween customer experience (CX) andtrust.
+ Thirteen of the 20 data points furthestbelow the trend line – meaning that thetrust levels are lower than would beexpected given satisfaction levels – arefrom Germany or Japan.
+ Fourteen of the 20 data points furthestabove the trend line – meaning that thetrust levels are higher than would beexpected given satisfaction levels – arefrom India or Indonesia, with 7 each.
Base: 17,509 consumers across 18 countriesSource: Qualtrics XM Institute Q1 2021 Global Consumer Study
40%
50%
60%
70%
80%
90%
100%
30% 40% 50% 60% 70% 80% 90% 100%
Pearson correlation
coefficient = .80
This scatterplot contains a data point for each industry ineach country.* Each point represents the percentage ofconsumers from that country who said they were“somewhat” or “very” likely to trust a company in thatindustry and the percentage of consumers in that countrywho said they were satisfied (4- or 5-star rating on a 5-starscale) with their recent experience in that industry.* Industry must have received 100+ responses in that country.
Like
lihoo
d to
Tru
stR
ate
(for
eac
h in
dust
ry w
ithin
eac
h co
untr
y)
Satisfaction Rate (for each industry within each country)
ABOUT
www.xminstitute.comCopyright © 2021 Qualtrics®. All rights reserved.
KEY TAKEAWAYS
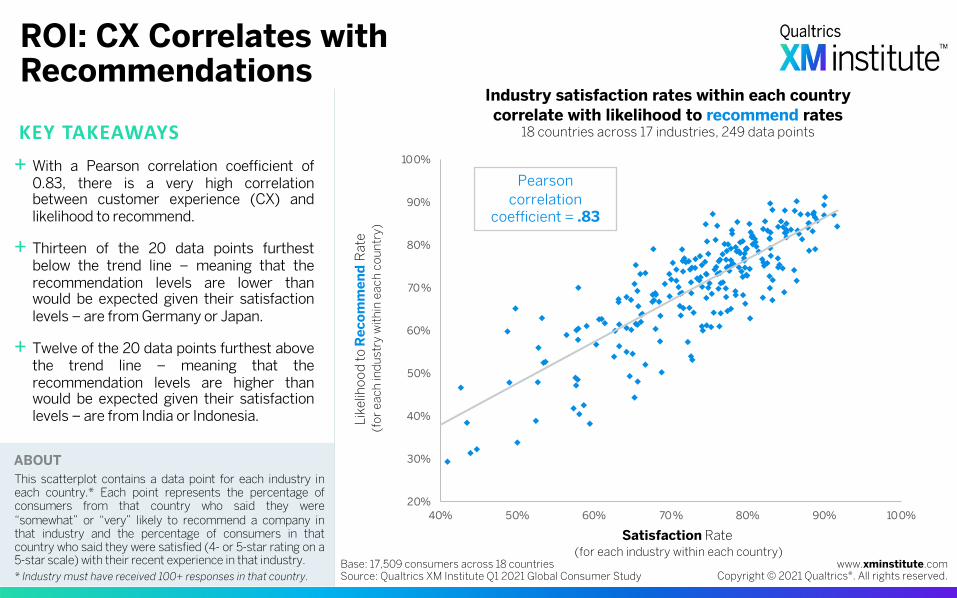
ROI: CX Correlates with Recommendations
Industry satisfaction rates within each country correlate with likelihood to recommend rates
18 countries across 17 industries, 249 data points
+ With a Pearson correlation coefficient of0.83, there is a very high correlationbetween customer experience (CX) andlikelihood to recommend.
+ Thirteen of the 20 data points furthestbelow the trend line – meaning that therecommendation levels are lower thanwould be expected given their satisfactionlevels – are from Germany or Japan.
+ Twelve of the 20 data points furthest abovethe trend line – meaning that therecommendation levels are higher thanwould be expected given their satisfactionlevels – are from India or Indonesia.
Base: 17,509 consumers across 18 countriesSource: Qualtrics XM Institute Q1 2021 Global Consumer Study
20%
30%
40%
50%
60%
70%
80%
90%
100%
40% 50% 60% 70% 80% 90% 100%
Pearson correlation
coefficient = .83
Like
lihoo
d to
Rec
omm
end
Rat
e (f
or e
ach
indu
stry
with
in e
ach
coun
try)
Satisfaction Rate (for each industry within each country)
ABOUTThis scatterplot contains a data point for each industry ineach country.* Each point represents the percentage ofconsumers from that country who said they were“somewhat” or “very” likely to recommend a company inthat industry and the percentage of consumers in thatcountry who said they were satisfied (4- or 5-star rating on a5-star scale) with their recent experience in that industry.* Industry must have received 100+ responses in that country.
www.xminstitute.comCopyright © 2021 Qualtrics®. All rights reserved.
KEY TAKEAWAYS
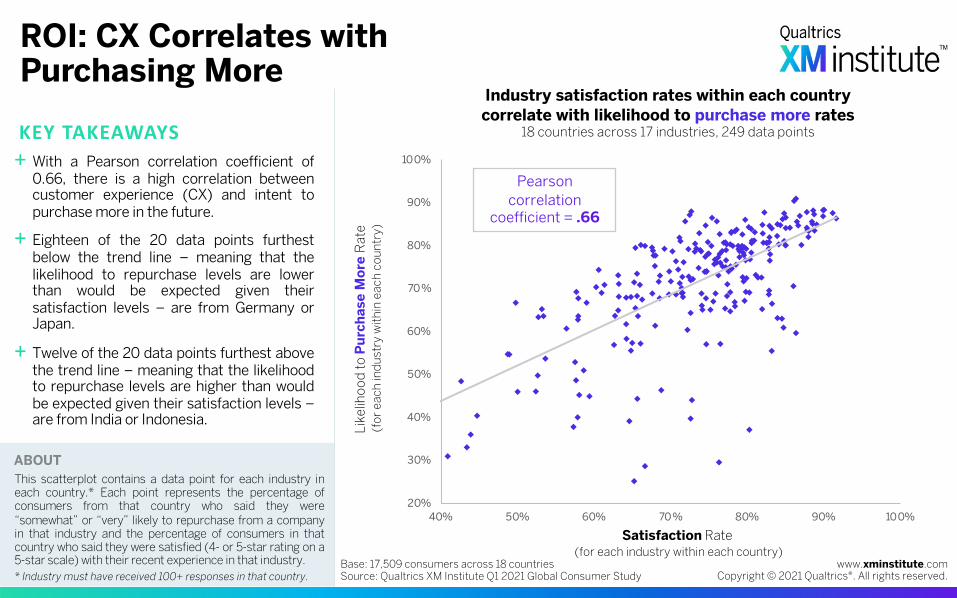
ROI: CX Correlates with Purchasing More
+ With a Pearson correlation coefficient of0.66, there is a high correlation betweencustomer experience (CX) and intent topurchase more in the future.
+ Eighteen of the 20 data points furthestbelow the trend line – meaning that thelikelihood to repurchase levels are lowerthan would be expected given theirsatisfaction levels – are from Germany orJapan.
+ Twelve of the 20 data points furthest abovethe trend line – meaning that the likelihoodto repurchase levels are higher than wouldbe expected given their satisfaction levels –are from India or Indonesia.
Base: 17,509 consumers across 18 countriesSource: Qualtrics XM Institute Q1 2021 Global Consumer Study
20%
30%
40%
50%
60%
70%
80%
90%
100%
40% 50% 60% 70% 80% 90% 100%
Pearson correlation
coefficient = .66
Industry satisfaction rates within each country correlate with likelihood to purchase more rates
18 countries across 17 industries, 249 data points
Like
lihoo
d to
Pur
chas
e M
ore
Rat
e (f
or e
ach
indu
stry
with
in e
ach
coun
try)
Satisfaction Rate (for each industry within each country)
ABOUTThis scatterplot contains a data point for each industry ineach country.* Each point represents the percentage ofconsumers from that country who said they were“somewhat” or “very” likely to repurchase from a companyin that industry and the percentage of consumers in thatcountry who said they were satisfied (4- or 5-star rating on a5-star scale) with their recent experience in that industry.* Industry must have received 100+ responses in that country.
www.xminstitute.comCopyright © 2021 Qualtrics®. All rights reserved.
24%50%
79% 85%
21%50%
81% 89%
17%44%
77% 88%
KEY TAKEAWAYS
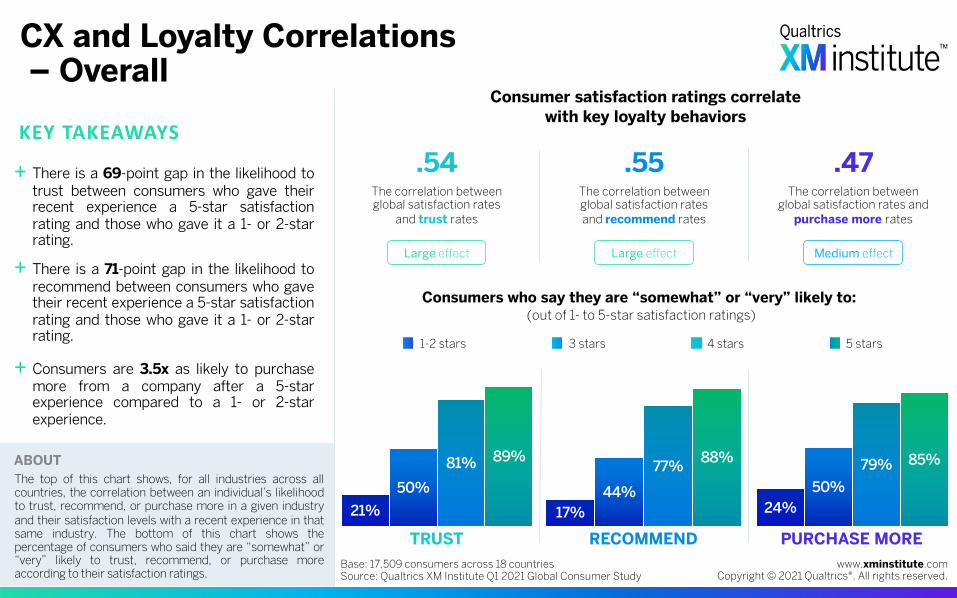
CX and Loyalty Correlations– Overall
Consumers who say they are “somewhat” or “very” likely to: (out of 1- to 5-star satisfaction ratings)
+ There is a 69-point gap in the likelihood totrust between consumers who gave theirrecent experience a 5-star satisfactionrating and those who gave it a 1- or 2-starrating.
+ There is a 71-point gap in the likelihood torecommend between consumers who gavetheir recent experience a 5-star satisfactionrating and those who gave it a 1- or 2-starrating.
+ Consumers are 3.5x as likely to purchasemore from a company after a 5-starexperience compared to a 1- or 2-starexperience.
Base: 17,509 consumers across 18 countriesSource: Qualtrics XM Institute Q1 2021 Global Consumer Study
TRUST RECOMMEND PURCHASE MORE
4 stars 5 stars3 stars1-2 stars
Large effect
.55The correlation between global satisfaction rates and recommend rates
Medium effect
.47The correlation between
global satisfaction rates and purchase more rates
Consumer satisfaction ratings correlate with key loyalty behaviors
ABOUTThe top of this chart shows, for all industries across allcountries, the correlation between an individual’s likelihoodto trust, recommend, or purchase more in a given industryand their satisfaction levels with a recent experience in thatsame industry. The bottom of this chart shows thepercentage of consumers who said they are “somewhat” or“very” likely to trust, recommend, or purchase moreaccording to their satisfaction ratings.
.54The correlation between global satisfaction rates
and trust rates
Large effect
www.xminstitute.comCopyright © 2021 Qualtrics®. All rights reserved.
KEY TAKEAWAYS
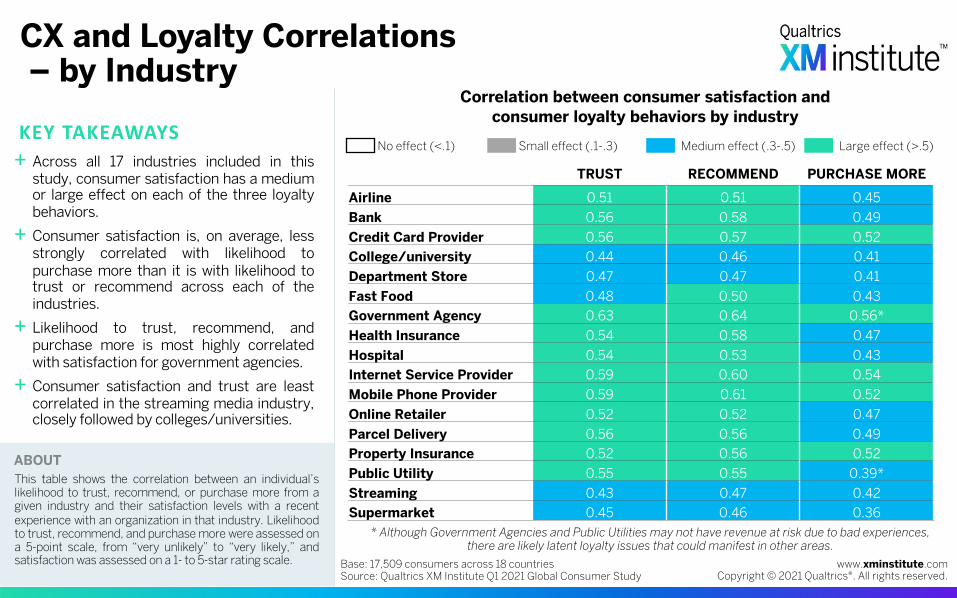
CX and Loyalty Correlations– by Industry
Correlation between consumer satisfaction and consumer loyalty behaviors by industry
+ Across all 17 industries included in thisstudy, consumer satisfaction has a mediumor large effect on each of the three loyaltybehaviors.
+ Consumer satisfaction is, on average, lessstrongly correlated with likelihood topurchase more than it is with likelihood totrust or recommend across each of theindustries.
+ Likelihood to trust, recommend, andpurchase more is most highly correlatedwith satisfaction for government agencies.
+ Consumer satisfaction and trust are leastcorrelated in the streaming media industry,closely followed by colleges/universities.
Base: 17,509 consumers across 18 countriesSource: Qualtrics XM Institute Q1 2021 Global Consumer Study
TRUST RECOMMEND PURCHASE MORE
Airline 0.51 0.51 0.45Bank 0.56 0.58 0.49Credit Card Provider 0.56 0.57 0.52College/university 0.44 0.46 0.41Department Store 0.47 0.47 0.41Fast Food 0.48 0.50 0.43Government Agency 0.63 0.64 0.56*Health Insurance 0.54 0.58 0.47Hospital 0.54 0.53 0.43Internet Service Provider 0.59 0.60 0.54Mobile Phone Provider 0.59 0.61 0.52Online Retailer 0.52 0.52 0.47Parcel Delivery 0.56 0.56 0.49Property Insurance 0.52 0.56 0.52Public Utility 0.55 0.55 0.39*Streaming 0.43 0.47 0.42Supermarket 0.45 0.46 0.36
Small effect (.1-.3) Medium effect (.3-.5)No effect (<.1) Large effect (>.5)
This table shows the correlation between an individual’slikelihood to trust, recommend, or purchase more from agiven industry and their satisfaction levels with a recentexperience with an organization in that industry. Likelihoodto trust, recommend, and purchase more were assessed ona 5-point scale, from “very unlikely” to “very likely,” andsatisfaction was assessed on a 1- to 5-star rating scale.
* Although Government Agencies and Public Utilities may not have revenue at risk due to bad experiences, there are likely latent loyalty issues that could manifest in other areas.
ABOUT
www.xminstitute.comCopyright © 2021 Qualtrics®. All rights reserved.
KEY TAKEAWAYS
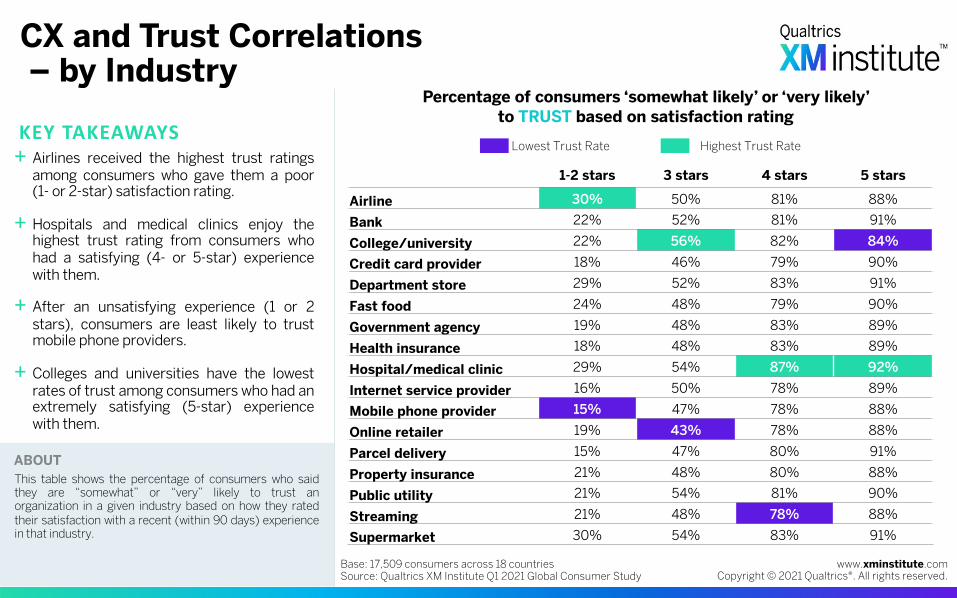
CX and Trust Correlations– by Industry
Percentage of consumers ‘somewhat likely’ or ‘very likely’ to TRUST based on satisfaction rating
+ Airlines received the highest trust ratingsamong consumers who gave them a poor(1- or 2-star) satisfaction rating.
+ Hospitals and medical clinics enjoy thehighest trust rating from consumers whohad a satisfying (4- or 5-star) experiencewith them.
+ After an unsatisfying experience (1 or 2stars), consumers are least likely to trustmobile phone providers.
+ Colleges and universities have the lowestrates of trust among consumers who had anextremely satisfying (5-star) experiencewith them.
Base: 17,509 consumers across 18 countriesSource: Qualtrics XM Institute Q1 2021 Global Consumer Study
1-2 stars 3 stars 4 stars 5 stars
Airline 30% 50% 81% 88%
Bank 22% 52% 81% 91%
College/university 22% 56% 82% 84%
Credit card provider 18% 46% 79% 90%
Department store 29% 52% 83% 91%
Fast food 24% 48% 79% 90%
Government agency 19% 48% 83% 89%
Health insurance 18% 48% 83% 89%
Hospital/medical clinic 29% 54% 87% 92%
Internet service provider 16% 50% 78% 89%
Mobile phone provider 15% 47% 78% 88%
Online retailer 19% 43% 78% 88%
Parcel delivery 15% 47% 80% 91%
Property insurance 21% 48% 80% 88%
Public utility 21% 54% 81% 90%
Streaming 21% 48% 78% 88%
Supermarket 30% 54% 83% 91%
Lowest Trust Rate Highest Trust Rate
ABOUTThis table shows the percentage of consumers who saidthey are “somewhat” or “very” likely to trust anorganization in a given industry based on how they ratedtheir satisfaction with a recent (within 90 days) experiencein that industry.
www.xminstitute.comCopyright © 2021 Qualtrics®. All rights reserved.
KEY TAKEAWAYS
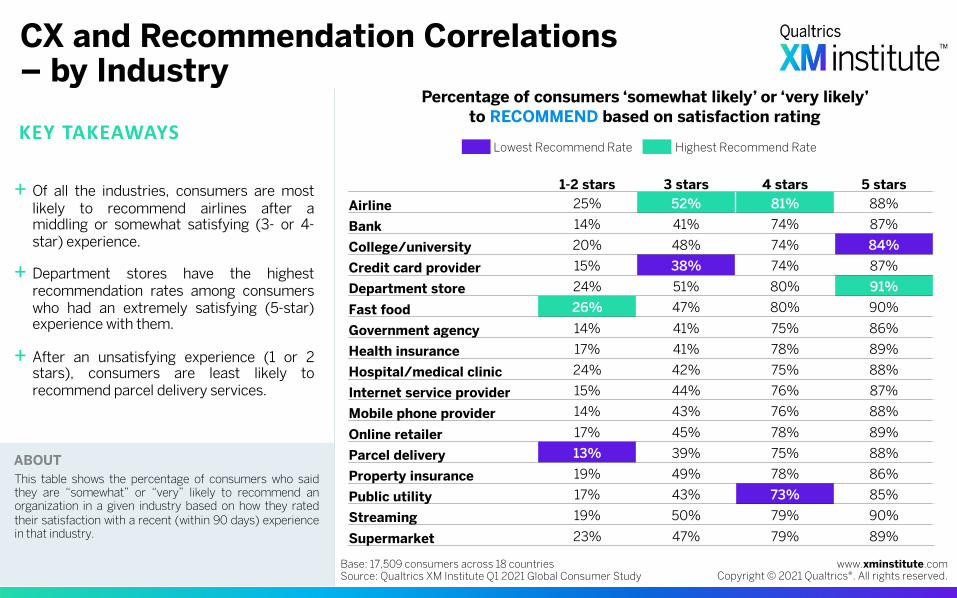
CX and Recommendation Correlations – by Industry
Percentage of consumers ‘somewhat likely’ or ‘very likely’ to RECOMMEND based on satisfaction rating
+ Of all the industries, consumers are mostlikely to recommend airlines after amiddling or somewhat satisfying (3- or 4-star) experience.
+ Department stores have the highestrecommendation rates among consumerswho had an extremely satisfying (5-star)experience with them.
+ After an unsatisfying experience (1 or 2stars), consumers are least likely torecommend parcel delivery services.
Base: 17,509 consumers across 18 countriesSource: Qualtrics XM Institute Q1 2021 Global Consumer Study
1-2 stars 3 stars 4 stars 5 starsAirline 25% 52% 81% 88%
Bank 14% 41% 74% 87%
College/university 20% 48% 74% 84%
Credit card provider 15% 38% 74% 87%
Department store 24% 51% 80% 91%
Fast food 26% 47% 80% 90%
Government agency 14% 41% 75% 86%
Health insurance 17% 41% 78% 89%
Hospital/medical clinic 24% 42% 75% 88%
Internet service provider 15% 44% 76% 87%
Mobile phone provider 14% 43% 76% 88%
Online retailer 17% 45% 78% 89%
Parcel delivery 13% 39% 75% 88%
Property insurance 19% 49% 78% 86%
Public utility 17% 43% 73% 85%
Streaming 19% 50% 79% 90%
Supermarket 23% 47% 79% 89%
Lowest Recommend Rate Highest Recommend Rate
ABOUTThis table shows the percentage of consumers who saidthey are “somewhat” or “very” likely to recommend anorganization in a given industry based on how they ratedtheir satisfaction with a recent (within 90 days) experiencein that industry.
www.xminstitute.comCopyright © 2021 Qualtrics®. All rights reserved.
KEY TAKEAWAYS
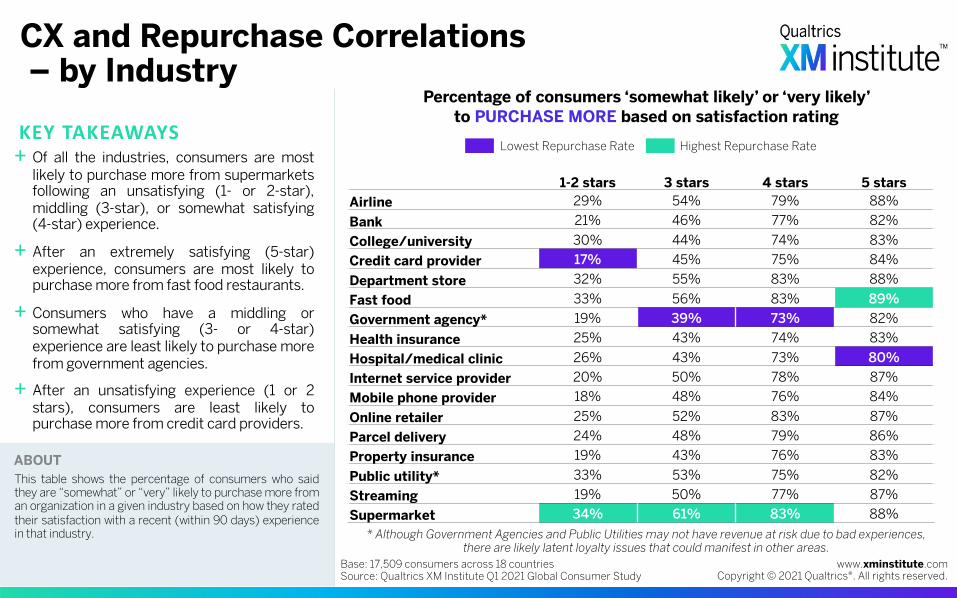
CX and Repurchase Correlations– by Industry
Percentage of consumers ‘somewhat likely’ or ‘very likely’ to PURCHASE MORE based on satisfaction rating
+ Of all the industries, consumers are mostlikely to purchase more from supermarketsfollowing an unsatisfying (1- or 2-star),middling (3-star), or somewhat satisfying(4-star) experience.
+ After an extremely satisfying (5-star)experience, consumers are most likely topurchase more from fast food restaurants.
+ Consumers who have a middling orsomewhat satisfying (3- or 4-star)experience are least likely to purchase morefrom government agencies.
+ After an unsatisfying experience (1 or 2stars), consumers are least likely topurchase more from credit card providers.
Base: 17,509 consumers across 18 countriesSource: Qualtrics XM Institute Q1 2021 Global Consumer Study
1-2 stars 3 stars 4 stars 5 starsAirline 29% 54% 79% 88%Bank 21% 46% 77% 82%College/university 30% 44% 74% 83%Credit card provider 17% 45% 75% 84%Department store 32% 55% 83% 88%Fast food 33% 56% 83% 89%Government agency* 19% 39% 73% 82%Health insurance 25% 43% 74% 83%Hospital/medical clinic 26% 43% 73% 80%Internet service provider 20% 50% 78% 87%Mobile phone provider 18% 48% 76% 84%Online retailer 25% 52% 83% 87%Parcel delivery 24% 48% 79% 86%Property insurance 19% 43% 76% 83%Public utility* 33% 53% 75% 82%Streaming 19% 50% 77% 87%Supermarket 34% 61% 83% 88%
Lowest Repurchase Rate Highest Repurchase Rate
* Although Government Agencies and Public Utilities may not have revenue at risk due to bad experiences, there are likely latent loyalty issues that could manifest in other areas.
ABOUTThis table shows the percentage of consumers who saidthey are “somewhat” or “very” likely to purchase more froman organization in a given industry based on how they ratedtheir satisfaction with a recent (within 90 days) experiencein that industry.
www.xminstitute.comCopyright © 2021 Qualtrics®. All rights reserved.
29%54%
79% 88%
30%50%
81% 88%
25%52%
81% 88%
KEY TAKEAWAYS
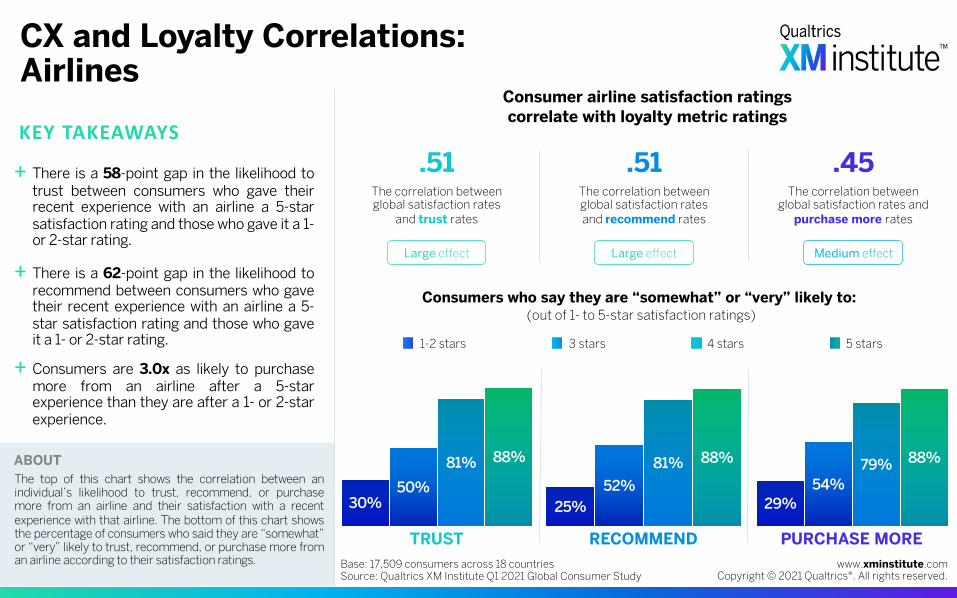
CX and Loyalty Correlations: Airlines
+ There is a 58-point gap in the likelihood totrust between consumers who gave theirrecent experience with an airline a 5-starsatisfaction rating and those who gave it a 1-or 2-star rating.
+ There is a 62-point gap in the likelihood torecommend between consumers who gavetheir recent experience with an airline a 5-star satisfaction rating and those who gaveit a 1- or 2-star rating.
+ Consumers are 3.0x as likely to purchasemore from an airline after a 5-starexperience than they are after a 1- or 2-starexperience.
Base: 17,509 consumers across 18 countriesSource: Qualtrics XM Institute Q1 2021 Global Consumer Study
TRUST RECOMMEND PURCHASE MORE
Consumer airline satisfaction ratings correlate with loyalty metric ratings
Consumers who say they are “somewhat” or “very” likely to: (out of 1- to 5-star satisfaction ratings)
4 stars 5 stars3 stars1-2 stars
Large effect
.51The correlation between global satisfaction rates and recommend rates
Medium effect
.45The correlation between
global satisfaction rates and purchase more rates
.51The correlation between global satisfaction rates
and trust rates
Large effect
ABOUTThe top of this chart shows the correlation between anindividual’s likelihood to trust, recommend, or purchasemore from an airline and their satisfaction with a recentexperience with that airline. The bottom of this chart showsthe percentage of consumers who said they are “somewhat”or “very” likely to trust, recommend, or purchase more froman airline according to their satisfaction ratings.
www.xminstitute.comCopyright © 2021 Qualtrics®. All rights reserved.
21%46%
77% 82%
22%52%
81% 91%
14%41%
74%87%
KEY TAKEAWAYS
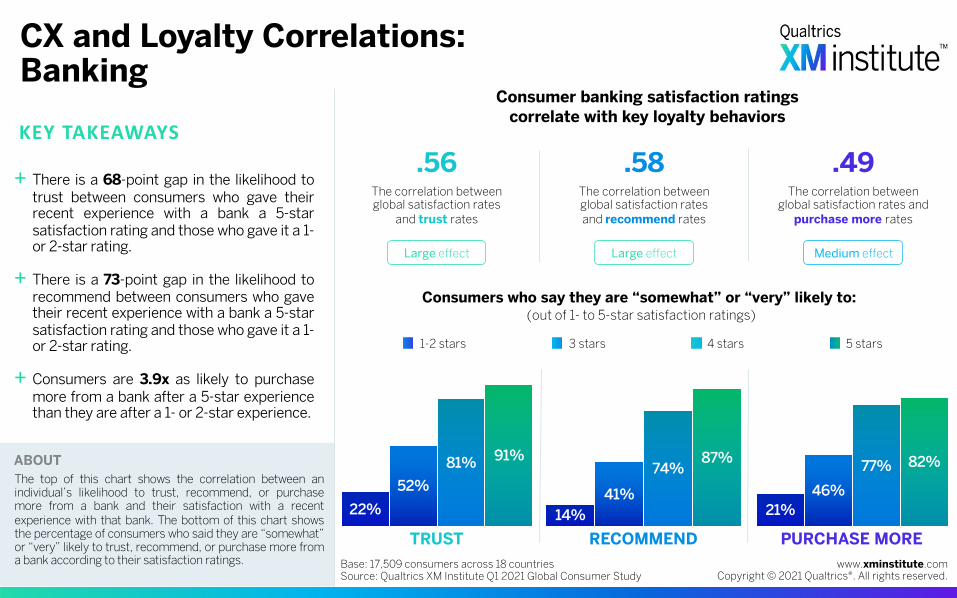
CX and Loyalty Correlations: Banking
+ There is a 68-point gap in the likelihood totrust between consumers who gave theirrecent experience with a bank a 5-starsatisfaction rating and those who gave it a 1-or 2-star rating.
+ There is a 73-point gap in the likelihood torecommend between consumers who gavetheir recent experience with a bank a 5-starsatisfaction rating and those who gave it a 1-or 2-star rating.
+ Consumers are 3.9x as likely to purchasemore from a bank after a 5-star experiencethan they are after a 1- or 2-star experience.
Base: 17,509 consumers across 18 countriesSource: Qualtrics XM Institute Q1 2021 Global Consumer Study
TRUST RECOMMEND PURCHASE MORE
Consumer banking satisfaction ratings correlate with key loyalty behaviors
Consumers who say they are “somewhat” or “very” likely to: (out of 1- to 5-star satisfaction ratings)
4 stars 5 stars3 stars1-2 stars
Large effect
.58The correlation between global satisfaction rates and recommend rates
Medium effect
.49The correlation between
global satisfaction rates and purchase more rates
.56The correlation between global satisfaction rates
and trust rates
Large effect
ABOUTThe top of this chart shows the correlation between anindividual’s likelihood to trust, recommend, or purchasemore from a bank and their satisfaction with a recentexperience with that bank. The bottom of this chart showsthe percentage of consumers who said they are “somewhat”or “very” likely to trust, recommend, or purchase more froma bank according to their satisfaction ratings.
www.xminstitute.comCopyright © 2021 Qualtrics®. All rights reserved.
30%44%
74% 83%
22%
56%82% 84%
20%48%
74% 84%
KEY TAKEAWAYS
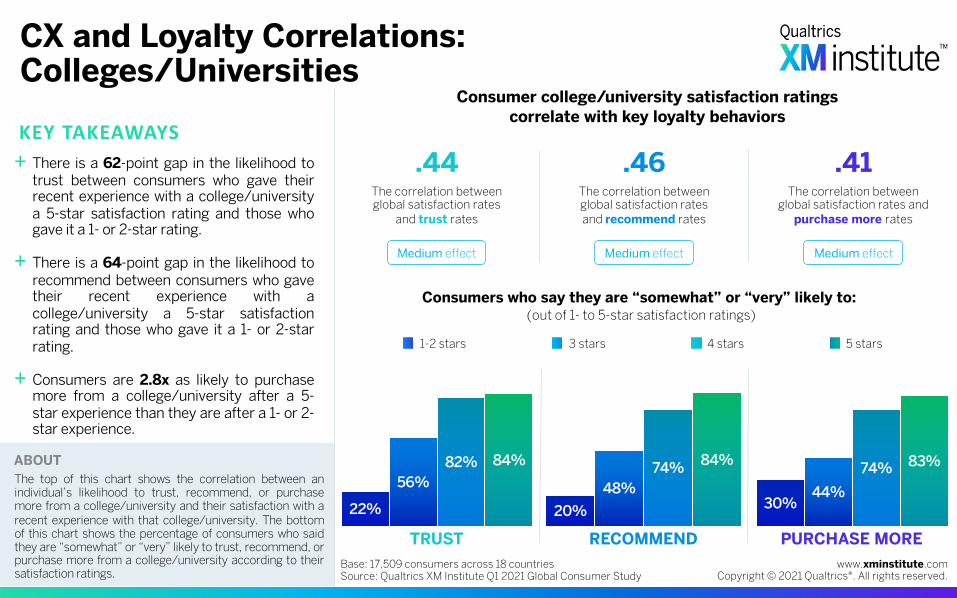
CX and Loyalty Correlations: Colleges/Universities
+ There is a 62-point gap in the likelihood totrust between consumers who gave theirrecent experience with a college/universitya 5-star satisfaction rating and those whogave it a 1- or 2-star rating.
+ There is a 64-point gap in the likelihood torecommend between consumers who gavetheir recent experience with acollege/university a 5-star satisfactionrating and those who gave it a 1- or 2-starrating.
+ Consumers are 2.8x as likely to purchasemore from a college/university after a 5-star experience than they are after a 1- or 2-star experience.
Base: 17,509 consumers across 18 countriesSource: Qualtrics XM Institute Q1 2021 Global Consumer Study
TRUST RECOMMEND PURCHASE MORE
Consumer college/university satisfaction ratings correlate with key loyalty behaviors
Consumers who say they are “somewhat” or “very” likely to: (out of 1- to 5-star satisfaction ratings)
4 stars 5 stars3 stars1-2 stars
Medium effect
.46The correlation between global satisfaction rates and recommend rates
Medium effect
.41The correlation between
global satisfaction rates and purchase more rates
.44The correlation between global satisfaction rates
and trust rates
Medium effect
ABOUTThe top of this chart shows the correlation between anindividual’s likelihood to trust, recommend, or purchasemore from a college/university and their satisfaction with arecent experience with that college/university. The bottomof this chart shows the percentage of consumers who saidthey are “somewhat” or “very” likely to trust, recommend, orpurchase more from a college/university according to theirsatisfaction ratings.
www.xminstitute.comCopyright © 2021 Qualtrics®. All rights reserved.
17%45%
75% 84%
18%46%
79% 90%
15%38%
74% 87%
KEY TAKEAWAYS
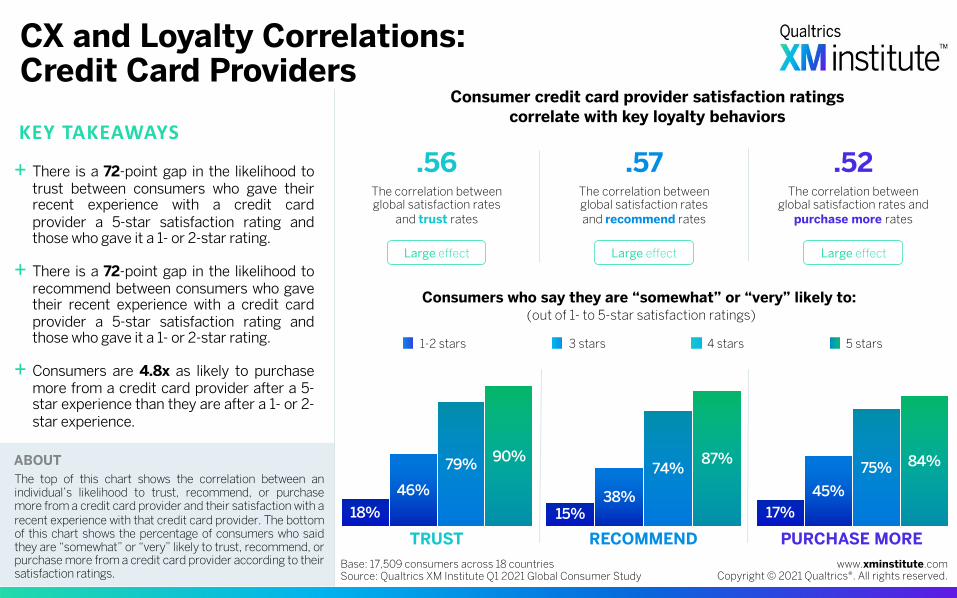
CX and Loyalty Correlations: Credit Card Providers
+ There is a 72-point gap in the likelihood totrust between consumers who gave theirrecent experience with a credit cardprovider a 5-star satisfaction rating andthose who gave it a 1- or 2-star rating.
+ There is a 72-point gap in the likelihood torecommend between consumers who gavetheir recent experience with a credit cardprovider a 5-star satisfaction rating andthose who gave it a 1- or 2-star rating.
+ Consumers are 4.8x as likely to purchasemore from a credit card provider after a 5-star experience than they are after a 1- or 2-star experience.
Base: 17,509 consumers across 18 countriesSource: Qualtrics XM Institute Q1 2021 Global Consumer Study
TRUST RECOMMEND PURCHASE MORE
Consumer credit card provider satisfaction ratings correlate with key loyalty behaviors
Consumers who say they are “somewhat” or “very” likely to: (out of 1- to 5-star satisfaction ratings)
4 stars 5 stars3 stars1-2 stars
Large effect
.57The correlation between global satisfaction rates and recommend rates
Large effect
.52The correlation between
global satisfaction rates and purchase more rates
.56The correlation between global satisfaction rates
and trust rates
Large effect
ABOUTThe top of this chart shows the correlation between anindividual’s likelihood to trust, recommend, or purchasemore from a credit card provider and their satisfaction with arecent experience with that credit card provider. The bottomof this chart shows the percentage of consumers who saidthey are “somewhat” or “very” likely to trust, recommend, orpurchase more from a credit card provider according to theirsatisfaction ratings.
www.xminstitute.comCopyright © 2021 Qualtrics®. All rights reserved.
32%55%
83% 88%
29%52%
83% 91%
24%51%
80% 91%
KEY TAKEAWAYS
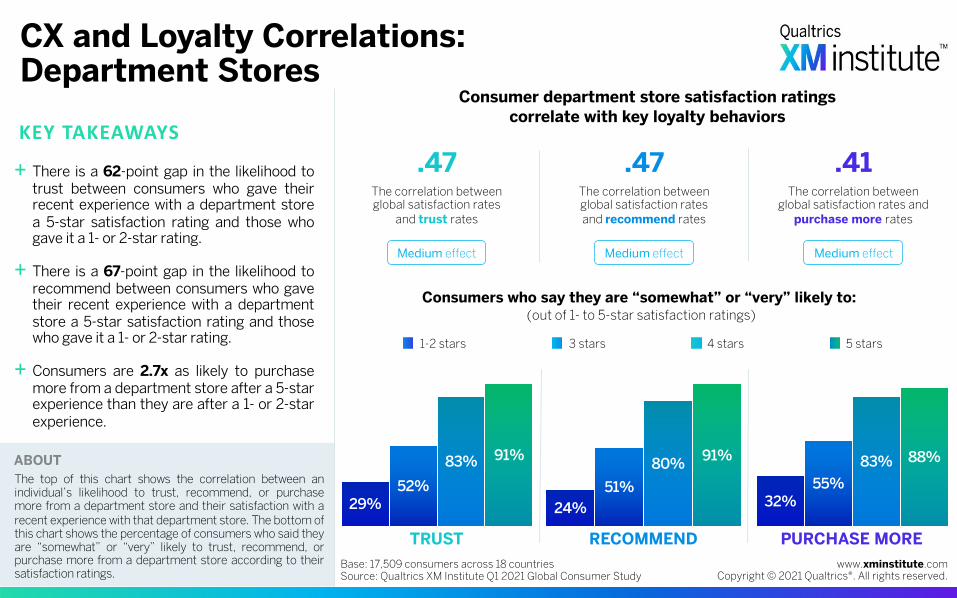
CX and Loyalty Correlations: Department Stores
+ There is a 62-point gap in the likelihood totrust between consumers who gave theirrecent experience with a department storea 5-star satisfaction rating and those whogave it a 1- or 2-star rating.
+ There is a 67-point gap in the likelihood torecommend between consumers who gavetheir recent experience with a departmentstore a 5-star satisfaction rating and thosewho gave it a 1- or 2-star rating.
+ Consumers are 2.7x as likely to purchasemore from a department store after a 5-starexperience than they are after a 1- or 2-starexperience.
Base: 17,509 consumers across 18 countriesSource: Qualtrics XM Institute Q1 2021 Global Consumer Study
TRUST RECOMMEND PURCHASE MORE
Consumer department store satisfaction ratings correlate with key loyalty behaviors
Consumers who say they are “somewhat” or “very” likely to: (out of 1- to 5-star satisfaction ratings)
4 stars 5 stars3 stars1-2 stars
Medium effect
.47The correlation between global satisfaction rates and recommend rates
Medium effect
.41The correlation between
global satisfaction rates and purchase more rates
.47The correlation between global satisfaction rates
and trust rates
Medium effect
ABOUTThe top of this chart shows the correlation between anindividual’s likelihood to trust, recommend, or purchasemore from a department store and their satisfaction with arecent experience with that department store. The bottom ofthis chart shows the percentage of consumers who said theyare “somewhat” or “very” likely to trust, recommend, orpurchase more from a department store according to theirsatisfaction ratings.
www.xminstitute.comCopyright © 2021 Qualtrics®. All rights reserved.
33%56%
83% 89%
24%48%
79% 90%
26%47%
80% 90%
KEY TAKEAWAYS
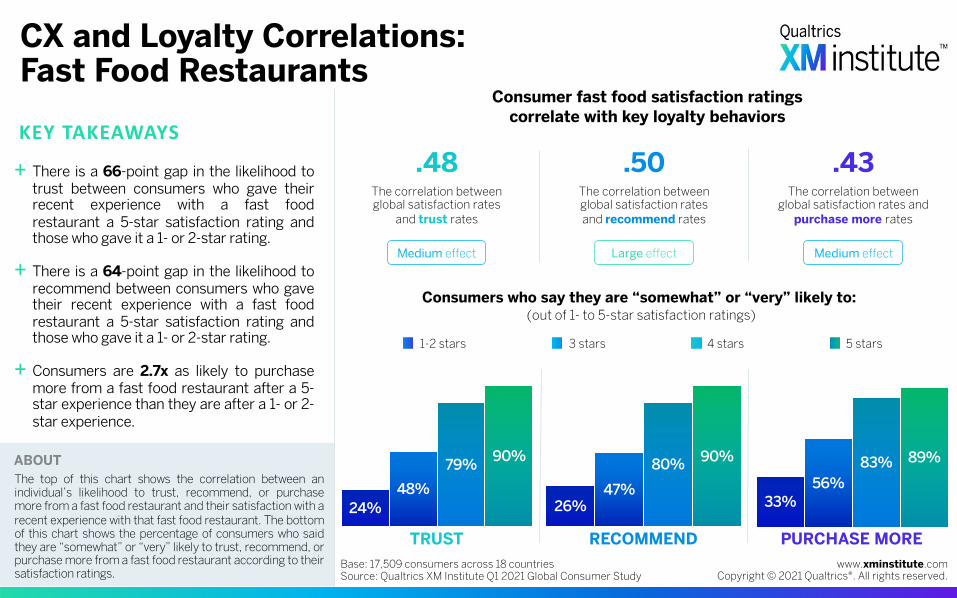
CX and Loyalty Correlations: Fast Food Restaurants
+ There is a 66-point gap in the likelihood totrust between consumers who gave theirrecent experience with a fast foodrestaurant a 5-star satisfaction rating andthose who gave it a 1- or 2-star rating.
+ There is a 64-point gap in the likelihood torecommend between consumers who gavetheir recent experience with a fast foodrestaurant a 5-star satisfaction rating andthose who gave it a 1- or 2-star rating.
+ Consumers are 2.7x as likely to purchasemore from a fast food restaurant after a 5-star experience than they are after a 1- or 2-star experience.
Base: 17,509 consumers across 18 countriesSource: Qualtrics XM Institute Q1 2021 Global Consumer Study
TRUST RECOMMEND PURCHASE MORE
Consumer fast food satisfaction ratings correlate with key loyalty behaviors
Consumers who say they are “somewhat” or “very” likely to: (out of 1- to 5-star satisfaction ratings)
4 stars 5 stars3 stars1-2 stars
Large effect
.50The correlation between global satisfaction rates and recommend rates
Medium effect
.43The correlation between
global satisfaction rates and purchase more rates
.48The correlation between global satisfaction rates
and trust rates
Medium effect
ABOUTThe top of this chart shows the correlation between anindividual’s likelihood to trust, recommend, or purchasemore from a fast food restaurant and their satisfaction with arecent experience with that fast food restaurant. The bottomof this chart shows the percentage of consumers who saidthey are “somewhat” or “very” likely to trust, recommend, orpurchase more from a fast food restaurant according to theirsatisfaction ratings.
www.xminstitute.comCopyright © 2021 Qualtrics®. All rights reserved.
19%39%
73% 82%
19%48%
83% 89%
14%41%
75% 86%
KEY TAKEAWAYS
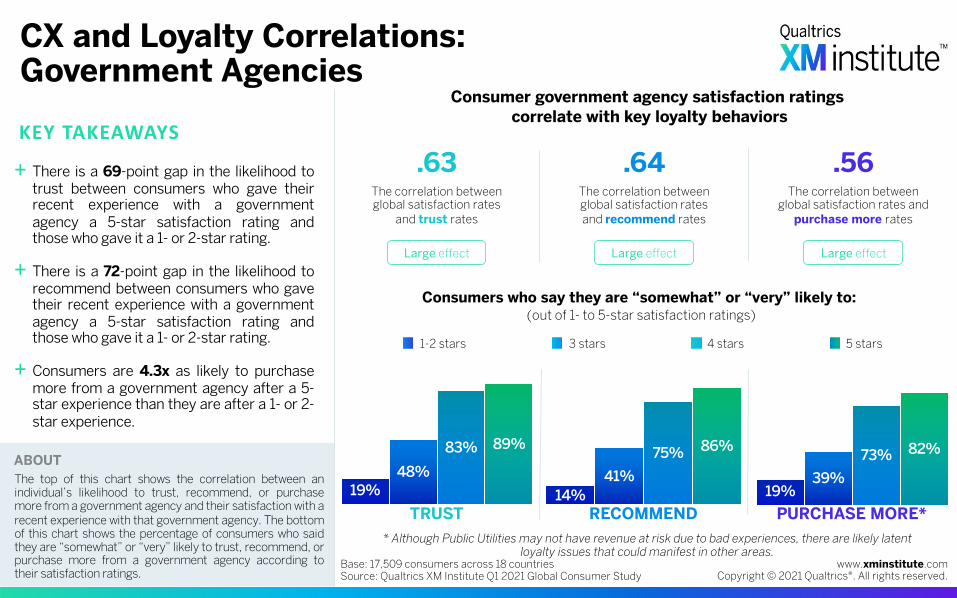
CX and Loyalty Correlations: Government Agencies
+ There is a 69-point gap in the likelihood totrust between consumers who gave theirrecent experience with a governmentagency a 5-star satisfaction rating andthose who gave it a 1- or 2-star rating.
+ There is a 72-point gap in the likelihood torecommend between consumers who gavetheir recent experience with a governmentagency a 5-star satisfaction rating andthose who gave it a 1- or 2-star rating.
+ Consumers are 4.3x as likely to purchasemore from a government agency after a 5-star experience than they are after a 1- or 2-star experience.
Base: 17,509 consumers across 18 countriesSource: Qualtrics XM Institute Q1 2021 Global Consumer Study
TRUST RECOMMEND PURCHASE MORE*
Consumer government agency satisfaction ratingscorrelate with key loyalty behaviors
* Although Public Utilities may not have revenue at risk due to bad experiences, there are likely latent loyalty issues that could manifest in other areas.
Consumers who say they are “somewhat” or “very” likely to: (out of 1- to 5-star satisfaction ratings)
4 stars 5 stars3 stars1-2 stars
Large effect
.64The correlation between global satisfaction rates and recommend rates
Large effect
.56The correlation between
global satisfaction rates and purchase more rates
.63The correlation between global satisfaction rates
and trust rates
Large effect
ABOUTThe top of this chart shows the correlation between anindividual’s likelihood to trust, recommend, or purchasemore from a government agency and their satisfaction with arecent experience with that government agency. The bottomof this chart shows the percentage of consumers who saidthey are “somewhat” or “very” likely to trust, recommend, orpurchase more from a government agency according totheir satisfaction ratings.
www.xminstitute.comCopyright © 2021 Qualtrics®. All rights reserved.
25%43%
74% 83%
18%48%
83% 89%
17%41%
78% 89%
KEY TAKEAWAYS
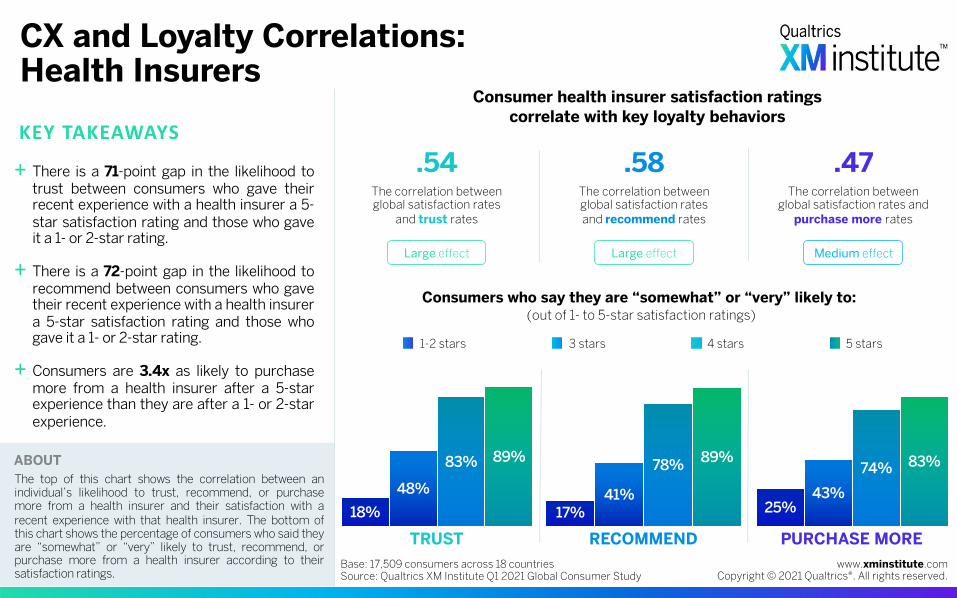
CX and Loyalty Correlations: Health Insurers
+ There is a 71-point gap in the likelihood totrust between consumers who gave theirrecent experience with a health insurer a 5-star satisfaction rating and those who gaveit a 1- or 2-star rating.
+ There is a 72-point gap in the likelihood torecommend between consumers who gavetheir recent experience with a health insurera 5-star satisfaction rating and those whogave it a 1- or 2-star rating.
+ Consumers are 3.4x as likely to purchasemore from a health insurer after a 5-starexperience than they are after a 1- or 2-starexperience.
Base: 17,509 consumers across 18 countriesSource: Qualtrics XM Institute Q1 2021 Global Consumer Study
TRUST RECOMMEND PURCHASE MORE
Consumer health insurer satisfaction ratings correlate with key loyalty behaviors
Consumers who say they are “somewhat” or “very” likely to: (out of 1- to 5-star satisfaction ratings)
4 stars 5 stars3 stars1-2 stars
Large effect
.58The correlation between global satisfaction rates and recommend rates
Medium effect
.47The correlation between
global satisfaction rates and purchase more rates
.54The correlation between global satisfaction rates
and trust rates
Large effect
ABOUTThe top of this chart shows the correlation between anindividual’s likelihood to trust, recommend, or purchasemore from a health insurer and their satisfaction with arecent experience with that health insurer. The bottom ofthis chart shows the percentage of consumers who said theyare “somewhat” or “very” likely to trust, recommend, orpurchase more from a health insurer according to theirsatisfaction ratings.
www.xminstitute.comCopyright © 2021 Qualtrics®. All rights reserved.
26%43%
73% 80%
29%54%
87% 92%
24%42%
75%88%
KEY TAKEAWAYS
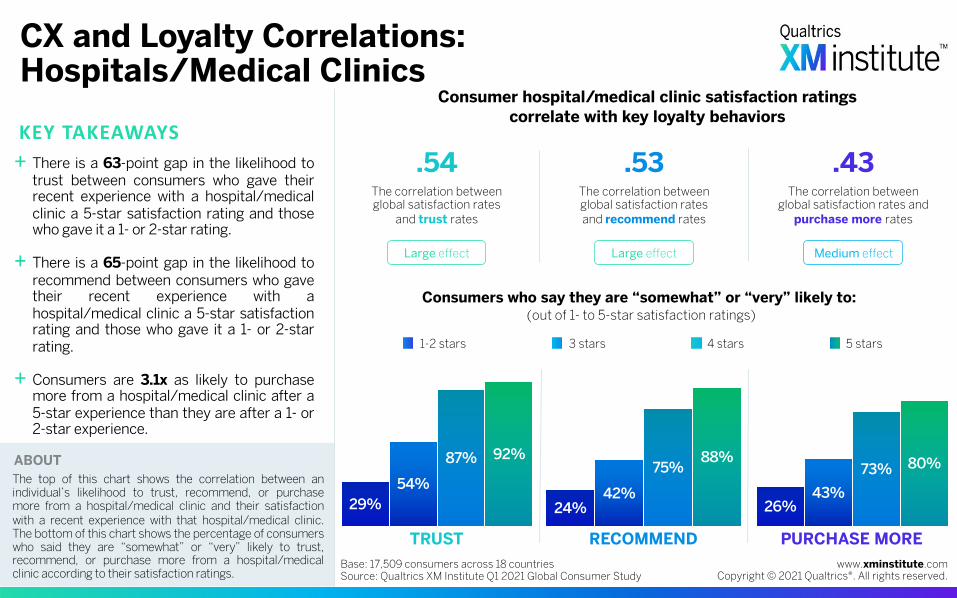
CX and Loyalty Correlations: Hospitals/Medical Clinics
+ There is a 63-point gap in the likelihood totrust between consumers who gave theirrecent experience with a hospital/medicalclinic a 5-star satisfaction rating and thosewho gave it a 1- or 2-star rating.
+ There is a 65-point gap in the likelihood torecommend between consumers who gavetheir recent experience with ahospital/medical clinic a 5-star satisfactionrating and those who gave it a 1- or 2-starrating.
+ Consumers are 3.1x as likely to purchasemore from a hospital/medical clinic after a5-star experience than they are after a 1- or2-star experience.
Base: 17,509 consumers across 18 countriesSource: Qualtrics XM Institute Q1 2021 Global Consumer Study
TRUST RECOMMEND PURCHASE MORE
Consumer hospital/medical clinic satisfaction ratings correlate with key loyalty behaviors
Consumers who say they are “somewhat” or “very” likely to: (out of 1- to 5-star satisfaction ratings)
4 stars 5 stars3 stars1-2 stars
Large effect
.53The correlation between global satisfaction rates and recommend rates
Medium effect
.43The correlation between
global satisfaction rates and purchase more rates
.54The correlation between global satisfaction rates
and trust rates
Large effect
ABOUTThe top of this chart shows the correlation between anindividual’s likelihood to trust, recommend, or purchasemore from a hospital/medical clinic and their satisfactionwith a recent experience with that hospital/medical clinic.The bottom of this chart shows the percentage of consumerswho said they are “somewhat” or “very” likely to trust,recommend, or purchase more from a hospital/medicalclinic according to their satisfaction ratings.

www.xminstitute.comCopyright © 2021 Qualtrics®. All rights reserved.
20%50%
78% 87%
16%
50%78% 89%
15%44%
76% 87%
KEY TAKEAWAYS
CX and Loyalty Correlations: Internet Service Providers
+ There is a 73-point gap in the likelihood totrust between consumers who gave theirrecent experience with an internet serviceprovider a 5-star satisfaction rating andthose who gave it a 1- or 2-star rating.
+ There is a 73-point gap in the likelihood torecommend between consumers who gavetheir recent experience with an internetservice provider a 5-star satisfaction ratingand those who gave it a 1- or 2-star rating.
+ Consumers are 4.3x as likely to purchasemore from an internet service provider aftera 5-star experience than they are after a 1-or 2-star experience.
Base: 17,509 consumers across 18 countriesSource: Qualtrics XM Institute Q1 2021 Global Consumer Study
TRUST RECOMMEND PURCHASE MORE
Consumer internet service provider satisfaction ratings correlate with key loyalty behaviors
Consumers who say they are “somewhat” or “very” likely to: (out of 1- to 5-star satisfaction ratings)
4 stars 5 stars3 stars1-2 stars
Large effect
.60The correlation between global satisfaction rates and recommend rates
Strong effect
.54The correlation between
global satisfaction rates and purchase more rates
.59The correlation between global satisfaction rates
and trust rates
Large effect
ABOUTThe top of this chart shows the correlation between anindividual’s likelihood to trust, recommend, or purchasemore from an internet service provider and their satisfactionwith a recent experience with that internet service provider.The bottom of this chart shows the percentage ofconsumers who said they are “somewhat” or “very” likely totrust, recommend, or purchase more from an internetservice provider according to their satisfaction ratings.
www.xminstitute.comCopyright © 2021 Qualtrics®. All rights reserved.
18%48%
76% 84%
15%47%
78% 88%
14%43%
76% 88%
KEY TAKEAWAYS
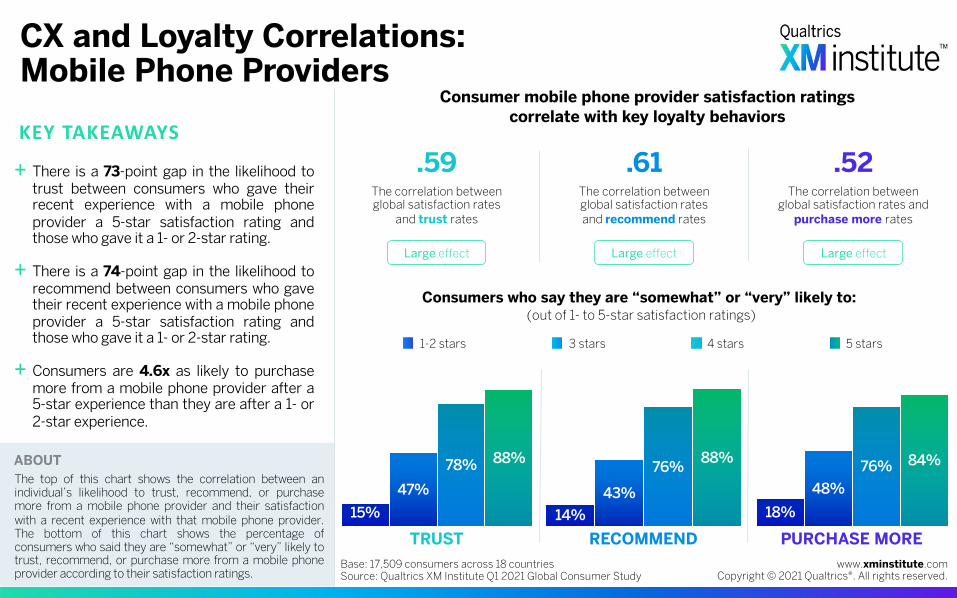
CX and Loyalty Correlations: Mobile Phone Providers
+ There is a 73-point gap in the likelihood totrust between consumers who gave theirrecent experience with a mobile phoneprovider a 5-star satisfaction rating andthose who gave it a 1- or 2-star rating.
+ There is a 74-point gap in the likelihood torecommend between consumers who gavetheir recent experience with a mobile phoneprovider a 5-star satisfaction rating andthose who gave it a 1- or 2-star rating.
+ Consumers are 4.6x as likely to purchasemore from a mobile phone provider after a5-star experience than they are after a 1- or2-star experience.
Base: 17,509 consumers across 18 countriesSource: Qualtrics XM Institute Q1 2021 Global Consumer Study
TRUST RECOMMEND PURCHASE MORE
Consumer mobile phone provider satisfaction ratings correlate with key loyalty behaviors
Consumers who say they are “somewhat” or “very” likely to: (out of 1- to 5-star satisfaction ratings)
4 stars 5 stars3 stars1-2 stars
Large effect
.61The correlation between global satisfaction rates and recommend rates
Large effect
.52The correlation between
global satisfaction rates and purchase more rates
.59The correlation between global satisfaction rates
and trust rates
Large effect
ABOUTThe top of this chart shows the correlation between anindividual’s likelihood to trust, recommend, or purchasemore from a mobile phone provider and their satisfactionwith a recent experience with that mobile phone provider.The bottom of this chart shows the percentage ofconsumers who said they are “somewhat” or “very” likely totrust, recommend, or purchase more from a mobile phoneprovider according to their satisfaction ratings.

www.xminstitute.comCopyright © 2021 Qualtrics®. All rights reserved.
25%52%
83% 87%
19%43%
78% 88%
17%45%
78% 89%
KEY TAKEAWAYS
CX and Loyalty Correlations: Online Retailers
+ There is a 69-point gap in the likelihood totrust between consumers who gave theirrecent experience with an online retailer a5-star satisfaction rating and those whogave it a 1- or 2-star rating.
+ There is a 72-point gap in the likelihood torecommend between consumers who gavetheir recent experience with an onlineretailer a 5-star satisfaction rating andthose who gave it a 1- or 2-star rating.
+ Consumers are 3.5x as likely to purchasemore from an online retailer after a 5-starexperience than they are after a 1- or 2-starexperience.
Base: 17,509 consumers across 18 countriesSource: Qualtrics XM Institute Q1 2021 Global Consumer Study
TRUST RECOMMEND PURCHASE MORE
Consumer online retailer satisfaction ratings correlate with key loyalty behaviors
Consumers who say they are “somewhat” or “very” likely to: (out of 1- to 5-star satisfaction ratings)
4 stars 5 stars3 stars1-2 stars
Large effect
.52The correlation between global satisfaction rates and recommend rates
Medium effect
.47The correlation between
global satisfaction rates and purchase more rates
.52The correlation between global satisfaction rates
and trust rates
Large effect
ABOUTThe top of this chart shows the correlation between anindividual’s likelihood to trust, recommend, or purchasemore from an online retailer and their satisfaction with arecent experience with that online retailer. The bottom ofthis chart shows the percentage of consumers who said theyare “somewhat” or “very” likely to trust, recommend, orpurchase more from an online retailer according to theirsatisfaction ratings.
www.xminstitute.comCopyright © 2021 Qualtrics®. All rights reserved.
24%48%
79% 86%
15%47%
80% 91%
13%39%
75%88%
KEY TAKEAWAYS
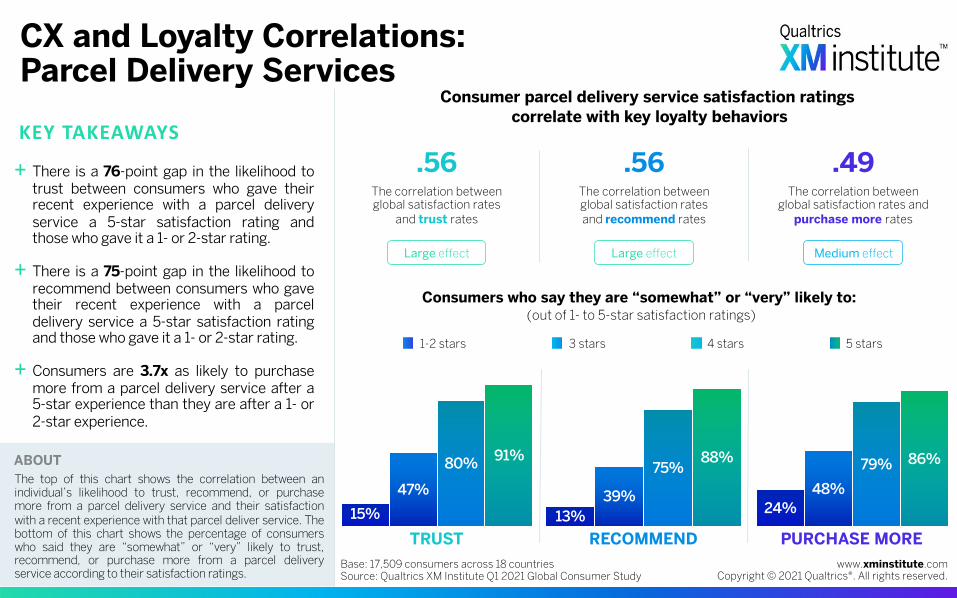
CX and Loyalty Correlations: Parcel Delivery Services
+ There is a 76-point gap in the likelihood totrust between consumers who gave theirrecent experience with a parcel deliveryservice a 5-star satisfaction rating andthose who gave it a 1- or 2-star rating.
+ There is a 75-point gap in the likelihood torecommend between consumers who gavetheir recent experience with a parceldelivery service a 5-star satisfaction ratingand those who gave it a 1- or 2-star rating.
+ Consumers are 3.7x as likely to purchasemore from a parcel delivery service after a5-star experience than they are after a 1- or2-star experience.
Base: 17,509 consumers across 18 countriesSource: Qualtrics XM Institute Q1 2021 Global Consumer Study
TRUST RECOMMEND PURCHASE MORE
Consumer parcel delivery service satisfaction ratingscorrelate with key loyalty behaviors
Consumers who say they are “somewhat” or “very” likely to: (out of 1- to 5-star satisfaction ratings)
4 stars 5 stars3 stars1-2 stars
Large effect
.56The correlation between global satisfaction rates and recommend rates
Medium effect
.49The correlation between
global satisfaction rates and purchase more rates
.56The correlation between global satisfaction rates
and trust rates
Large effect
ABOUTThe top of this chart shows the correlation between anindividual’s likelihood to trust, recommend, or purchasemore from a parcel delivery service and their satisfactionwith a recent experience with that parcel deliver service. Thebottom of this chart shows the percentage of consumerswho said they are “somewhat” or “very” likely to trust,recommend, or purchase more from a parcel deliveryservice according to their satisfaction ratings.

www.xminstitute.comCopyright © 2021 Qualtrics®. All rights reserved.
19%43%
76% 83%
21%48%
80% 88%
19%49%
78% 86%
KEY TAKEAWAYS
CX and Loyalty Correlations: Property Insurers
+ There is a 67-point gap in the likelihood totrust between consumers who gave theirrecent experience with a property insurer a5-star satisfaction rating and those whogave it a 1- or 2-star rating.
+ There is a 67-point gap in the likelihood torecommend between consumers who gavetheir recent experience with a propertyinsurer a 5-star satisfaction rating andthose who gave it a 1- or 2-star rating.
+ Consumers are 4.5x as likely to purchasemore from a property insurer after a 5-starexperience than they are after a 1- or 2-starexperience.
Base: 17,509 consumers across 18 countriesSource: Qualtrics XM Institute Q1 2021 Global Consumer Study
TRUST RECOMMEND PURCHASE MORE
Consumer property insurer satisfaction ratings correlate with key loyalty behaviors
Consumers who say they are “somewhat” or “very” likely to: (out of 1- to 5-star satisfaction ratings)
4 stars 5 stars3 stars1-2 stars
Large effect
.56The correlation between global satisfaction rates and recommend rates
Large effect
.52The correlation between
global satisfaction rates and purchase more rates
.52The correlation between global satisfaction rates
and trust rates
Large effect
ABOUTThe top of this chart shows the correlation between anindividual’s likelihood to trust, recommend, or purchasemore from a property insurer and their satisfaction with arecent experience with that property insurer. The bottom ofthis chart shows the percentage of consumers who said theyare “somewhat” or “very” likely to trust, recommend, orpurchase more from a property insurer according to theirsatisfaction ratings.
www.xminstitute.comCopyright © 2021 Qualtrics®. All rights reserved.
33%53%
75% 82%
21%54%
81% 90%
17%43%
73% 85%
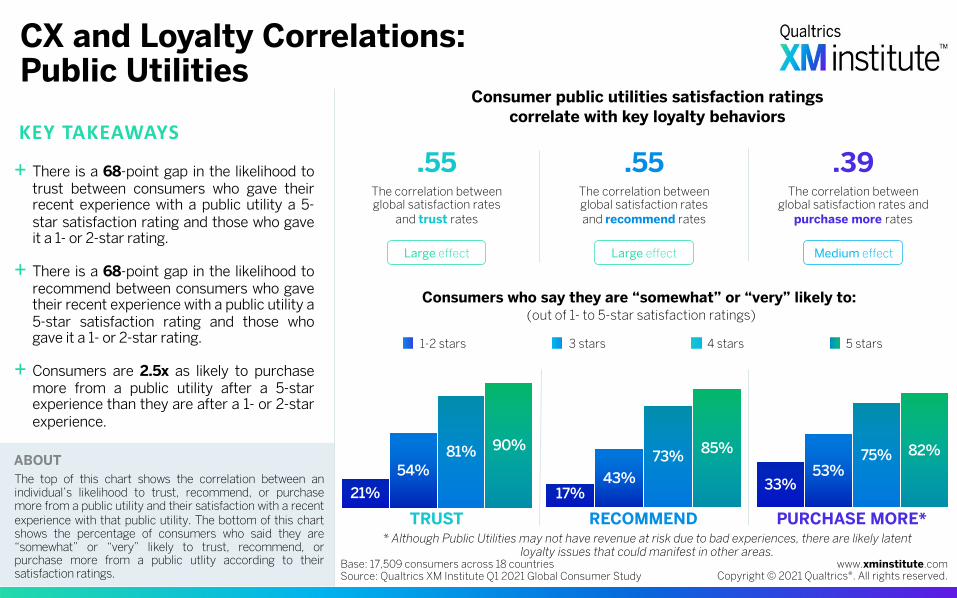
KEY TAKEAWAYS
CX and Loyalty Correlations: Public Utilities
+ There is a 68-point gap in the likelihood totrust between consumers who gave theirrecent experience with a public utility a 5-star satisfaction rating and those who gaveit a 1- or 2-star rating.
+ There is a 68-point gap in the likelihood torecommend between consumers who gavetheir recent experience with a public utility a5-star satisfaction rating and those whogave it a 1- or 2-star rating.
+ Consumers are 2.5x as likely to purchasemore from a public utility after a 5-starexperience than they are after a 1- or 2-starexperience.
Base: 17,509 consumers across 18 countriesSource: Qualtrics XM Institute Q1 2021 Global Consumer Study
TRUST RECOMMEND PURCHASE MORE*
Consumer public utilities satisfaction ratings correlate with key loyalty behaviors
* Although Public Utilities may not have revenue at risk due to bad experiences, there are likely latent loyalty issues that could manifest in other areas.
Consumers who say they are “somewhat” or “very” likely to: (out of 1- to 5-star satisfaction ratings)
4 stars 5 stars3 stars1-2 stars
Large effect
.55The correlation between global satisfaction rates and recommend rates
Medium effect
.39The correlation between
global satisfaction rates and purchase more rates
.55The correlation between global satisfaction rates
and trust rates
Large effect
ABOUTThe top of this chart shows the correlation between anindividual’s likelihood to trust, recommend, or purchasemore from a public utility and their satisfaction with a recentexperience with that public utility. The bottom of this chartshows the percentage of consumers who said they are“somewhat” or “very” likely to trust, recommend, orpurchase more from a public utlity according to theirsatisfaction ratings.
www.xminstitute.comCopyright © 2021 Qualtrics®. All rights reserved.
19%50%
77% 87%
21%48%
78% 88%
19%50%
79% 90%
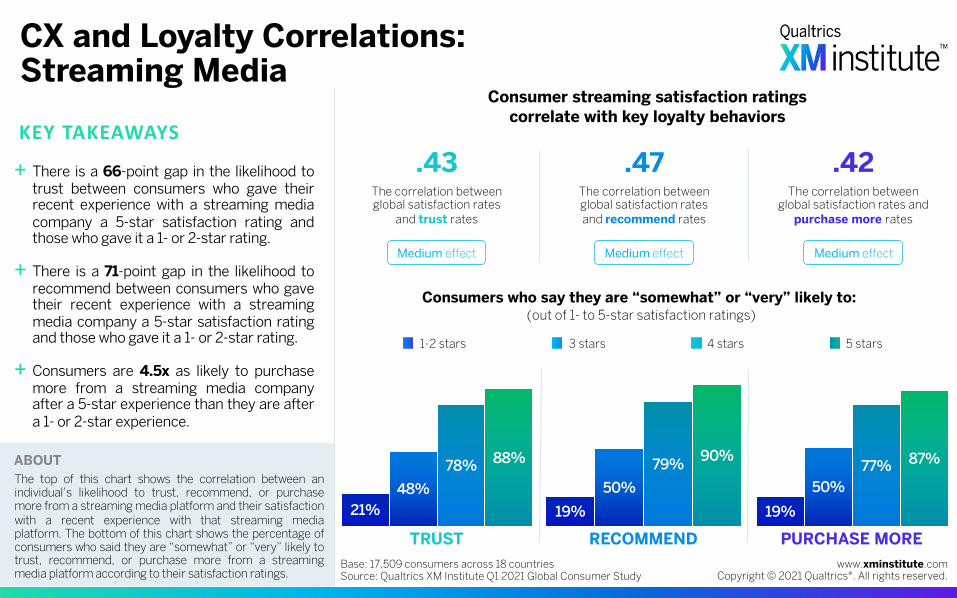
KEY TAKEAWAYS
CX and Loyalty Correlations: Streaming Media
+ There is a 66-point gap in the likelihood totrust between consumers who gave theirrecent experience with a streaming mediacompany a 5-star satisfaction rating andthose who gave it a 1- or 2-star rating.
+ There is a 71-point gap in the likelihood torecommend between consumers who gavetheir recent experience with a streamingmedia company a 5-star satisfaction ratingand those who gave it a 1- or 2-star rating.
+ Consumers are 4.5x as likely to purchasemore from a streaming media companyafter a 5-star experience than they are aftera 1- or 2-star experience.
Base: 17,509 consumers across 18 countriesSource: Qualtrics XM Institute Q1 2021 Global Consumer Study
TRUST RECOMMEND PURCHASE MORE
Consumer streaming satisfaction ratings correlate with key loyalty behaviors
Consumers who say they are “somewhat” or “very” likely to: (out of 1- to 5-star satisfaction ratings)
4 stars 5 stars3 stars1-2 stars
Medium effect
.47The correlation between global satisfaction rates and recommend rates
Medium effect
.42The correlation between
global satisfaction rates and purchase more rates
.43The correlation between global satisfaction rates
and trust rates
Medium effect
ABOUTThe top of this chart shows the correlation between anindividual’s likelihood to trust, recommend, or purchasemore from a streaming media platform and their satisfactionwith a recent experience with that streaming mediaplatform. The bottom of this chart shows the percentage ofconsumers who said they are “somewhat” or “very” likely totrust, recommend, or purchase more from a streamingmedia platform according to their satisfaction ratings.
www.xminstitute.comCopyright © 2021 Qualtrics®. All rights reserved.
34%61%
83% 88%
30%54%
83% 91%
23%47%
79% 89%
KEY TAKEAWAYS
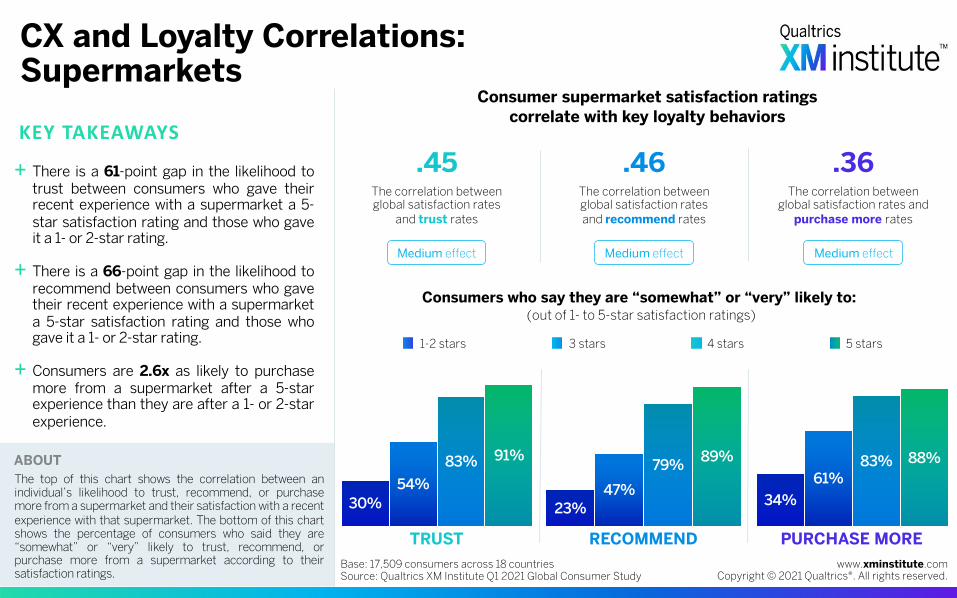
CX and Loyalty Correlations: Supermarkets
+ There is a 61-point gap in the likelihood totrust between consumers who gave theirrecent experience with a supermarket a 5-star satisfaction rating and those who gaveit a 1- or 2-star rating.
+ There is a 66-point gap in the likelihood torecommend between consumers who gavetheir recent experience with a supermarketa 5-star satisfaction rating and those whogave it a 1- or 2-star rating.
+ Consumers are 2.6x as likely to purchasemore from a supermarket after a 5-starexperience than they are after a 1- or 2-starexperience.
Base: 17,509 consumers across 18 countriesSource: Qualtrics XM Institute Q1 2021 Global Consumer Study
TRUST RECOMMEND PURCHASE MORE
Consumer supermarket satisfaction ratings correlate with key loyalty behaviors
Consumers who say they are “somewhat” or “very” likely to: (out of 1- to 5-star satisfaction ratings)
4 stars 5 stars3 stars1-2 stars
Medium effect
.46The correlation between global satisfaction rates and recommend rates
Medium effect
.36The correlation between
global satisfaction rates and purchase more rates
.45The correlation between global satisfaction rates
and trust rates
Medium effect
ABOUTThe top of this chart shows the correlation between anindividual’s likelihood to trust, recommend, or purchasemore from a supermarket and their satisfaction with a recentexperience with that supermarket. The bottom of this chartshows the percentage of consumers who said they are“somewhat” or “very” likely to trust, recommend, orpurchase more from a supermarket according to theirsatisfaction ratings.

www.xminstitute.comCopyright © 2021 Qualtrics®. All rights reserved.
KEY TAKEAWAYS
CX and Loyalty Correlations– by Country
Correlation between consumer satisfaction and consumer loyalty behaviors by country
+ In each of the 18 countries included in thisstudy, consumer satisfaction has either amedium or large effect on the three loyaltybehaviors.
+ India has the lowest correlation betweenhow satisfied consumers are and how likelythey are to trust, recommend, or purchasemore from a company.
+ Consumer satisfaction is most stronglycorrelated with likelihood to both trust andrecommend in Spain.
+ Across all countries, consumer satisfactionis, on average, less strongly correlated withlikelihood to purchase more than it is withlikelihood to trust or recommend.
Base: 17,509 consumers across 18 countriesSource: Qualtrics XM Institute Q1 2021 Global Consumer Study
TRUST RECOMMEND PURCHASE MOREAustralia 0.58 0.58 0.48Brazil 0.55 0.59 0.47Canada 0.56 0.56 0.45France 0.59 0.59 0.54Germany 0.54 0.57 0.41Hong Kong 0.52 0.53 0.42India 0.36 0.36 0.37Indonesia 0.49 0.51 0.46Japan 0.54 0.49 0.46Malaysia 0.46 0.48 0.46Mexico 0.51 0.54 0.41Philippines 0.53 0.55 0.49Singapore 0.54 0.55 0.54South Korea 0.49 0.53 0.47Spain 0.64 0.63 0.54Thailand 0.47 0.51 0.42UK 0.56 0.56 0.47U.S. 0.49 0.49 0.41
Small effect (.1-.3) Medium effect (.3-.5)No effect (<.1) Large effect (>.5)
ABOUTThis table shows, for each country, the correlation betweenconsumers’ likelihood to trust, recommend, or purchasemore from a given industry (assessed on a 5-point scalefrom “very unlikely” to “very likely”) and their satisfactionlevels with their recent experience in that industry(assessed on a 1- to 5-star rating scale). Data for eachcountry includes consumers’ ratings for all 17 industries.
www.xminstitute.comCopyright © 2021 Qualtrics®. All rights reserved.
KEY TAKEAWAYS
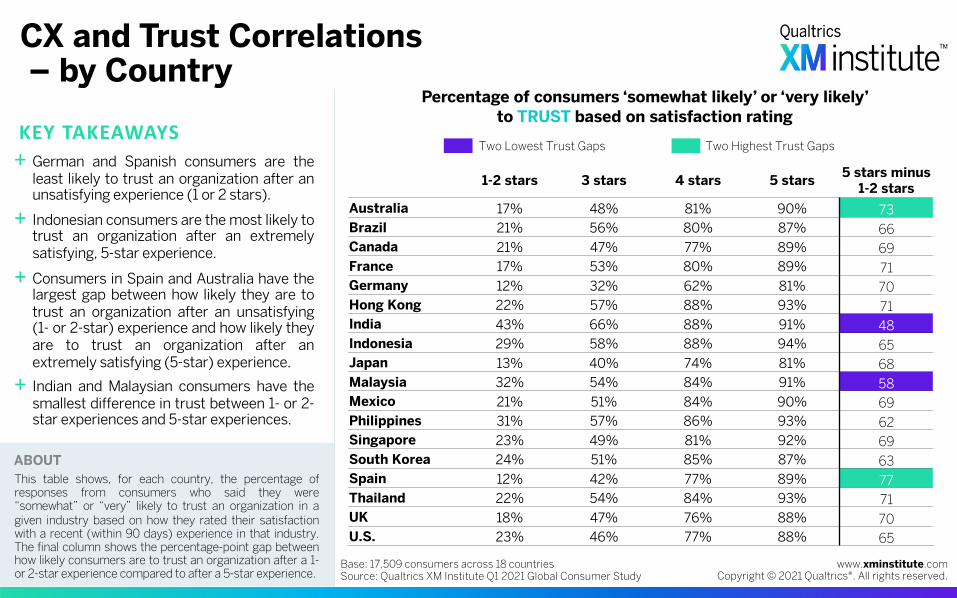
CX and Trust Correlations– by Country
Percentage of consumers ‘somewhat likely’ or ‘very likely’ to TRUST based on satisfaction rating
+ German and Spanish consumers are theleast likely to trust an organization after anunsatisfying experience (1 or 2 stars).
+ Indonesian consumers are the most likely totrust an organization after an extremelysatisfying, 5-star experience.
+ Consumers in Spain and Australia have thelargest gap between how likely they are totrust an organization after an unsatisfying(1- or 2-star) experience and how likely theyare to trust an organization after anextremely satisfying (5-star) experience.
+ Indian and Malaysian consumers have thesmallest difference in trust between 1- or 2-star experiences and 5-star experiences.
Base: 17,509 consumers across 18 countriesSource: Qualtrics XM Institute Q1 2021 Global Consumer Study
1-2 stars 3 stars 4 stars 5 stars 5 stars minus 1-2 stars
Australia 17% 48% 81% 90% 73Brazil 21% 56% 80% 87% 66Canada 21% 47% 77% 89% 69France 17% 53% 80% 89% 71Germany 12% 32% 62% 81% 70Hong Kong 22% 57% 88% 93% 71India 43% 66% 88% 91% 48Indonesia 29% 58% 88% 94% 65Japan 13% 40% 74% 81% 68Malaysia 32% 54% 84% 91% 58Mexico 21% 51% 84% 90% 69Philippines 31% 57% 86% 93% 62Singapore 23% 49% 81% 92% 69South Korea 24% 51% 85% 87% 63Spain 12% 42% 77% 89% 77Thailand 22% 54% 84% 93% 71UK 18% 47% 76% 88% 70U.S. 23% 46% 77% 88% 65
Two Lowest Trust Gaps Two Highest Trust Gaps
ABOUTThis table shows, for each country, the percentage ofresponses from consumers who said they were“somewhat” or “very” likely to trust an organization in agiven industry based on how they rated their satisfactionwith a recent (within 90 days) experience in that industry.The final column shows the percentage-point gap betweenhow likely consumers are to trust an organization after a 1-or 2-star experience compared to after a 5-star experience.

www.xminstitute.comCopyright © 2021 Qualtrics®. All rights reserved.
KEY TAKEAWAYS
CX and Recommendation Correlations – by Country
Percentage of consumers ‘somewhat likely’ or ‘very likely’ to RECOMMEND based on satisfaction rating
+ Japanese consumers are the least likely torecommend an organization, no matter howsatisfying their experience was.
+ Indonesian consumers are most likely torecommend an organization after having aneither somewhat or extremely satisfyingexperience (4 or 5 stars).
+ Consumers in Spain and Hong Kong havethe largest gap between how likely they areto recommend an organization after 1- or 2-star experience versus after a 5-starexperience.
+ Indian and Japanese consumers have thesmallest gap in likelihood to recommendafter a 1- or 2-star experience or a 5-starexperience.
Base: 17,509 consumers across 18 countriesSource: Qualtrics XM Institute Q1 2021 Global Consumer Study
1-2 stars 3 stars 4 stars 5 stars 5 stars minus 1-2 stars
Australia 13% 39% 74% 86% 74Brazil 20% 53% 79% 89% 69Canada 14% 41% 72% 83% 70France 16% 45% 75% 87% 72Germany 10% 26% 59% 81% 72Hong Kong 17% 48% 84% 93% 76India 34% 65% 86% 90% 56Indonesia 28% 53% 88% 94% 65Japan 9% 21% 51% 69% 59Malaysia 25% 54% 83% 89% 64Mexico 18% 50% 81% 89% 71Philippines 28% 57% 86% 94% 66Singapore 19% 45% 78% 92% 73South Korea 17% 40% 75% 85% 68Spain 10% 39% 71% 87% 76Thailand 19% 53% 84% 94% 75UK 12% 39% 71% 86% 74U.S. 23% 45% 74% 86% 63
Two Lowest Recommendation Gaps Two Highest Recommendation Gaps
ABOUTThis table shows, for each country, the percentage ofresponses from consumers who said they were “somewhat”or “very” likely to recommend an organization in a givenindustry based on how they rated their satisfaction with arecent (within 90 days) experience in that industry. The finalcolumn shows the percentage-point gap between how likelyconsumers are to recommend an organization after a 1- or 2-star experience compared to after a 5-star experience.
www.xminstitute.comCopyright © 2021 Qualtrics®. All rights reserved.
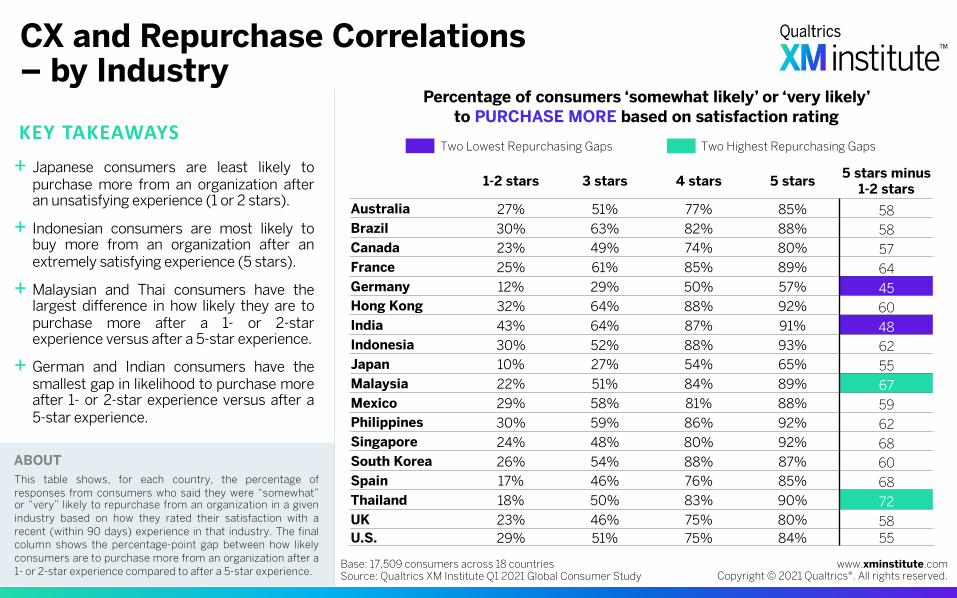
KEY TAKEAWAYS
CX and Repurchase Correlations – by Industry
Percentage of consumers ‘somewhat likely’ or ‘very likely’ to PURCHASE MORE based on satisfaction rating
+ Japanese consumers are least likely topurchase more from an organization afteran unsatisfying experience (1 or 2 stars).
+ Indonesian consumers are most likely tobuy more from an organization after anextremely satisfying experience (5 stars).
+ Malaysian and Thai consumers have thelargest difference in how likely they are topurchase more after a 1- or 2-starexperience versus after a 5-star experience.
+ German and Indian consumers have thesmallest gap in likelihood to purchase moreafter 1- or 2-star experience versus after a5-star experience.
Base: 17,509 consumers across 18 countriesSource: Qualtrics XM Institute Q1 2021 Global Consumer Study
1-2 stars 3 stars 4 stars 5 stars 5 stars minus 1-2 stars
Australia 27% 51% 77% 85% 58Brazil 30% 63% 82% 88% 58Canada 23% 49% 74% 80% 57France 25% 61% 85% 89% 64Germany 12% 29% 50% 57% 45Hong Kong 32% 64% 88% 92% 60India 43% 64% 87% 91% 48Indonesia 30% 52% 88% 93% 62Japan 10% 27% 54% 65% 55Malaysia 22% 51% 84% 89% 67Mexico 29% 58% 81% 88% 59Philippines 30% 59% 86% 92% 62Singapore 24% 48% 80% 92% 68South Korea 26% 54% 88% 87% 60Spain 17% 46% 76% 85% 68Thailand 18% 50% 83% 90% 72UK 23% 46% 75% 80% 58U.S. 29% 51% 75% 84% 55
Two Lowest Repurchasing Gaps Two Highest Repurchasing Gaps
ABOUTThis table shows, for each country, the percentage ofresponses from consumers who said they were “somewhat”or “very” likely to repurchase from an organization in a givenindustry based on how they rated their satisfaction with arecent (within 90 days) experience in that industry. The finalcolumn shows the percentage-point gap between how likelyconsumers are to purchase more from an organization after a1- or 2-star experience compared to after a 5-star experience.

www.xminstitute.comCopyright © 2021 Qualtrics®. All rights reserved.
Methodology (Part 1)DATA SOURCEThe data for this report comes from a global consumer study that Qualtrics XM Institute conducted in the first quarter of 2021. Using an onlinesurvey, XM Institute collected data from 17,509 consumers across 18 countries: Australia, Brazil, Canada, France, Germany, Hong Kong, India,Indonesia, Japan, Malaysia, Mexico, the Philippines, Singapore, South Korea, Spain, Thailand, UK, and U.S.XM Institute surveyed 1,000 consumers from each of the countries, except for Hong Kong (556 respondents) and South Korea (952 respondents).To ensure that the data was reflective of the population within those countries, we set quotas for responses to match the gender, age, and incomedemographics of each country.
www.xminstitute.comCopyright © 2021 Qualtrics®. All rights reserved.
DATA CALCULATIONSIn Figures 1, 2, and 3, we calculated data points by taking, for each industry in each country, the average percentage of consumers who gave a 4- or 5-star satisfaction rating to an organization in that industry (satisfaction rate) and the average percentage of consumers who said they were“somewhat” or “very” likely to trust, recommend, or purchase more from that organization (likelihood to trust, recommend, and purchase morerate). We only included industries where 100+ respondents said they had an experience in that industry in the previous 90 days. We calculatedPearson correlation coefficients by correlating the satisfaction rate averages with trust, recommend, and purchase more rate averages.In Figure 4, we calculated the correlation numbers at the top of the page by taking each individual consumer’s likelihood to trust, recommend, orpurchase more from an organization in a given industry and correlating that rate to their satisfaction levels with a recent experience in that sameindustry. To perform this correlation, we translated their likelihood to trust, recommend, and purchase more response – which fell on a scale from“very unlikely” to “very likely – into a numeric score from 1 to 5. So, a response of “very unlikely” became a “1,” ”somewhat likely” became a “4,” andso on. We call this the translated likelihood scale.We calculated the charts at the bottom of the page by first, for each of the three loyalty behaviors, totaling the number of responses (consumerscould evaluate more than one industry) across all industries and countries where consumers said they were either “somewhat” or “very” likely totrust, recommend, or purchase more from an organization. For each of those three loyalty behaviors, we then divided those totals by the number ofrespondents who rated their satisfaction with recent experiences in that same industry as 1 or 2 stars, 3 stars, 4 stars, or 5 stars. We identified keytakeaways using the same methodology as Figures 9 through 25 (see next page).
www.xminstitute.comCopyright © 2021 Qualtrics®. All rights reserved.
AUTHORSBruce Temkin, CCXP, XMP, Head of Qualtrics XM InstituteMoira Dorsey, XMP, XM CatalystTalia Quaadgras, Research Associate
PUBLICATION DATEJuly 2021
Methodology (Part 2)DATA CALCULATIONS (cont.)In Figure 5, we calculated the correlation numbers in each column by taking each global consumer’s likelihood to trust, recommend, or purchasemore from an organization that particular industry and correlating that rate to their satisfaction levels with a recent experience in that same industry.We used the translated likelihood rate for each of these three loyalty behaviors to perform this calculation. A large effect means there is a strongcorrelation between the two metrics, a medium effect means there is a moderate correlation, a small effect means there is a weak correlation, andand no effect means there is a very trivial or not a correlation.In Figures 6, 7, and 8, we calculated the percentages by first, for each of the three loyalty behaviors, totaling the number of global responses(consumers could evaluate more than one industry) where consumers said they were either “somewhat” or “very” likely to trust, recommend, orpurchase more from an organization in each industry. For each of those three loyalty behaviors, we then divided those totals by the number ofrespondents who rated their satisfaction with recent experiences in that same industry as 1 or 2 stars, 3 stars, 4 stars, or 5 stars. This gave us thepercentages of global consumers who said they would likely trust, recommend, or purchase more in each industry based on their satisfaction levels.In Figures 9 through 25, the correlation numbers at the top of the page comes from the data on Figure 5. The charts at the bottom of the page comefrom the data on trust, recommendations, and repurchasing from Figures 6, 7, and 8 respectively. To calculate the key takeaways for trust andrecommend, we subtracted the percentage of consumers who gave a 1- or 2-star satisfaction score from the percentage who gave a 5-star score. Tocalculate the key takeaway for purchasing more, we divided the percentage of consumers who gave a 5-star satisfaction rating by the percentagewho gave a 1- or 2-star rating.In Figure 26, we calculated the correlation numbers for each country by taking each local consumer’s likelihood to trust, recommend, or purchasemore from an organization in a given industry and correlating that rate to their satisfaction levels with a recent experience in that same industry. Weused the translated likelihood rate for each of these three loyalty behaviors to perform this calculation. Effect sizes are the same as Figure 5.In Figures 27, 28, and 29, we calculated the percentages by first, for each of the three loyalty behaviors, totaling the number of consumers from eachcountry who said they were either “somewhat” or “very” likely to trust, recommend, or purchase more from an organization in a given industry. Foreach of those three loyalty behaviors, we then divided those totals by the number of respondents who rated their satisfaction with recent experiencesin that same industry as 1 or 2 stars, 3 stars, 4 stars, or 5 stars. This gave us the percentages of consumers from each country who said they wouldlikely trust, recommend, or purchase more based on their satisfaction levels.
www.xminstitute.comCopyright © 2021 Qualtrics®. All rights reserved.