Data Set Inventory for Field Pilot Sites - · PDF fileData Set Inventory for Field Pilot Sites...
22
CONSCIENCE is co-funded by the European Community Sixth Framework Programme for European Research and Technological Development (2002-2006) Start date March 2007, duration 3 Years Document Dissemination Level PU Public PU PP Restricted to other programme participants (including the Commission Services) RE Restricted to a group specified by the consortium (including the Commission Services) CO Confidential, only for members of the consortium (including the Commission Services) Data Set Inventory for Field Pilot Sites Deliverable number D 16 Revision status final Co-ordinator: Deltares, the Netherlands Project Contract No: 044122 Project website: www.conscience-eu.net Concepts and Science for Coastal Erosion Management Specific Targeted Research Project Thematic priority : Forecasting and developing innovative policies for sustainability in the medium and long term Date May 2010 Task Leader James Sutherland
Transcript of Data Set Inventory for Field Pilot Sites - · PDF fileData Set Inventory for Field Pilot Sites...
CONSCIENCE is co-funded by the European CommunitySixth Framework Programme for European Research and Technological Development (2002-2006)
Start date March 2007, duration 3 YearsDocument Dissemination LevelPU Public PUPP Restricted to other programme participants (including the Commission Services)
RE Restricted to a group specified by the consortium (including the Commission Services)
CO Confidential, only for members of the consortium (including the Commission Services)
Data Set Inventory for Field Pilot Sites
Deliverable number D 16Revision status final
Co-ordinator: Deltares, the NetherlandsProject Contract No: 044122Project website: www.conscience-eu.net
Concepts and Science forCoastal Erosion Management
Specific Targeted Research Project
Thematic priority: Forecasting and developing innovative policies forsustainability in the medium and long term
Date May 2010
Task Leader James Sutherland
EU FP6 CONSCIENCE
ii
Data set inventory for field pilot sites
Deliverable: D 16
Project: Concepts and Science for Coastal ErosionManagement
EC Contract: 044122

EU FP6 CONSCIENCE
iii
Document InformationTitle: Data set inventory for field pilot sitesLead Author: James SutherlandClient: Commission of the European Communities Research Directorate-
GeneralContract No.: 044122Reference: CONSCIENCE Deliverable D16. This report also constitutes HR
Wallingford Technical Note CBS0330/04
Document HistoryDate Version Author Reviewed by Notes13/07/09 R0-r1 J Sutherland Participants Initial outline with
Danube and Pevenseydetails
26/08/09 R0-r2 J Sutherland Participants Added informationfrom IBW-PAN andHRW.
10/09/09 R0-r3 J Sutherland Participants Insch details added21/09/09 R0-r4 J Sutherland Participants Holland details added28/10/09 Release 1 J Sutherland Participants Costa Brava details
added21/05/10 Release 2 J Sutherland M. Marchand Executive summary
added
Prepared
Approved
Authorised
AcknowledgementThe work described in this report was supported by the Commission of the EuropeanCommunities under Contract number 044122, Concepts and Science for Coastal Erosion,CONSCIENCE
© HR Wallingford Limited
This report is a contribution to research generally and it would be imprudent for third parties to rely on it inspecific applications without first checking its suitability. Various sections of this report rely on data supplied by ordrawn from third party sources. HR Wallingford accepts no liability for loss or damage suffered by the client orthird parties as a result of errors or inaccuracies in such third party data. HR Wallingford will only acceptresponsibility for the use of its material in specific projects where it has been engaged to advise upon a specificcommission and given the opportunity to express a view on the reliability of the material for the particularapplications.

EU FP6 CONSCIENCE
iv
Executive SummaryThis report summarises the data sets collected at six contrasting beaches as part of theEC-funded project Concepts and Science for Coastal Erosion Management(CONSCIENCE, contract number 044122). The six field pilot sites were:
1. Dutch Coast (between Den Helder and Cadzand) (NL)2. Hel Peninsula, Gulf of Gdansk (Poland)3. Black Sea coastal zone of the Danube Delta (Romania)4. Costa Brava Bays, Mediterranean coast (Spain)5. Pevensey Bay, English Channel coast (UK)6. Inch Beach, Kerry Atlantic coast (Ireland)
The data sets were collected with the aim of identifying appropriate Coastal StateIndicators for coastal erosion management. Cross-shore beach profile, and wave datawere collected at all sites (although in one case the waves were simulated using anumerical model and in another case the wave measurements were offshore andneeded to be transformed inshore using a numerical model). Bathymetric data wascollected a lot less frequently then inter-tidal beach profiles at all sites. All sites hadsome information on sediment size and most sites had good records of water level, butthis was not so important in the Baltic and Black Sea sites. Routine windmeasurements were made at about half the sites. The four sites where beach orshoreface nourishment took place all kept records of this. LIDAR data was collectedat two sites while the historic development of the coastline was studied using historicmap data at three sites. The emphasis in data collection is on the short-term responseof the beaches to storms, illustrated by the universal records of waves and cross-shoreintertidal beach profiles.

EU FP6 CONSCIENCE
v
Contents
1 Introduction............................................................................................................ 11.1 Pilot Sites ................................................................................................... 1
2 Data Set Inventory – Holland coast......................................................................... 32.1 Bathymetry................................................................................................. 32.2 Hydrodynamics .......................................................................................... 32.3 Nourishments ............................................................................................. 3
3 Data Set Inventory – Hel Peninsula ........................................................................ 43.1 Sediment .................................................................................................... 43.2 Bathymetry data 2004-2008........................................................................ 43.3 Shoreline evolution 2002-2008................................................................... 43.4 Artificial nourishment ................................................................................ 43.5 Winds......................................................................................................... 43.6 Waves ........................................................................................................ 4
4 Data Set Inventory – Danube Delta......................................................................... 54.1 Beach profiles ............................................................................................ 54.2 Sediment samples....................................................................................... 54.3 Bathymetry................................................................................................. 54.4 Shoreline .................................................................................................... 54.5 Maps .......................................................................................................... 64.6 Wind measurements ................................................................................... 64.7 Waves ........................................................................................................ 6
5 Data Set Inventory – Costa Brava Bays .................................................................. 75.1 Wave Data.................................................................................................. 75.2 Water levels ............................................................................................... 75.3 Topographic data........................................................................................ 85.4 Bathymetries .............................................................................................. 85.5 Shoreline data............................................................................................. 85.6 Sediment data............................................................................................. 85.7 Beach nourishment data.............................................................................. 8
6 Data Set Inventory – Pevensey Bay ........................................................................ 96.1 Introduction................................................................................................ 96.2 Wave Data.................................................................................................. 96.3 Water levels ............................................................................................... 96.4 Topographic data.......................................................................................10
6.4.1 2003 survey by Channel Coastal Observatory......................... 106.4.2 Environment Agency profiling ............................................... 106.4.3 Monthly surveys by PCDL ..................................................... 11
6.5 Hydrographic data................................................................................116.6 Ordnance Survey Maps ........................................................................116.7 Additional data available......................................................................126.8 Acknowledgements ..............................................................................12
7 Data Set Inventory – Inch Strand, Kerry ................................................................137.1 Introduction .........................................................................................137.2 Wave Data ...........................................................................................137.3 Water levels .........................................................................................147.4 Topographic data .................................................................................147.5 Hydrographic data................................................................................157.6 Ordnance Survey Maps ........................................................................15
8 References.............................................................................................................16

EU FP6 CONSCIENCE
vi
TablesTable 1 Contact details of the pilot site leaders...................................................... 2
FiguresFigure 1 Pilot sites ................................................................................................. 2Figure 2 Study area. The arrow indicates the location of the wave buoy (adjacent
to s’Abanell beach). HIPOCAS nodes are also shown. ............................. 7Figure 3 Map showing a) the location of Dingle Bay and M3 Wave Buoy and b)
the location of Inch and Rosbeigh within Dingle Bay ............................. 14

EU FP6 CONSCIENCE
1
1 IntroductionConcepts and Science for Coastal Erosion Management (commonly known asCONSCIENCE) is an EC-funded research project being carried out by eightorganisations, coordinated by Deltares (NL). The overall objective of CONSCIENCE isto define and validate through pilot applications a methodology to support theimplementation of the concepts of coastal resilience, favourable sediment status,strategic sediment reservoirs and coastal sediment cells for the European coasts(European Commission, 2004)1. The project is developing a series of guidelines andtools in support of this approach to ensure that it can be effectively assimilated into asustainable management strategy for erosion. More information on the project, theparticipants and the deliverables can be found on the project websitehttp://www.conscience-eu.net/.
An important part of the decision-making procedure adopted in CONSCIENCE(Marchand, 2008) is the comparison between measured values of a Coastal StateIndicator (van Koningsveld et al, 2005) and a previously developed threshold value(van Koningsveld and Mulder 2004). Coastal State Indicators are “a reduced set ofparameters that can simply, adequately and quantitatively describe the dynamic-stateand evolutionary trends of a coastal system” (van Koningsveld et al, 2005).CONSCIENCE has six pilot sites (Section 1.1) each of which has used one or morecoastal state indicators. The quantification of the relevant physical parameters hasrequired data to be acquired or collected.
This report is an inventory of data used by the project partners at their field sites. Forfurther information on the data, please contact the pilot site leaders (Section 1.1).Further information about the use of coastal state indicators in CONSCIENCE and thedata needed to produce them can be found in:
Coastal processes and coastal state indicators. CONSCIENCE Deliverable D9,2008.Assessment of data needs for coastal state indicators. CONSCIENCEDeliverable D10, 2009.
The results from this report have informed the development of CONSCIENCEdeliverable D15 Guidelines on Monitoring. These deliverables are available from theproject website.
1.1 Pilot SitesThe six pilot sites used in CONSCIENCE are:
1. Dutch Coast (between Den Helder and Cadzand) (NL)2. Hel Peninsula, Gulf of Gdansk (Poland)3. Black Sea coastal zone of the Danube Delta (Romania)4. Costa Brava Bays, Mediterranean coast (Spain)5. Pevensey Bay, English Channel coast (UK)6. Inch Beach, Kerry Atlantic coast (Ireland)
The locations of the pilot sites used in CONSCIENCE are shown in Figure 1, whiledescriptions of the sites and the problems to be addressed there can be found on the
1 These concepts were originally derived by the EUROSION project: www.eurosion.org

EU FP6 CONSCIENCE
2
web-site (http://www.conscience-eu.net/). Contact details for the pilot site leaders aregiven in Table 1.
Figure 1 Pilot sites
Table 1 Contact details of the pilot site leaders
Pilot Site Leader Email addressDutch Coast Jan Mulder [email protected] Peninsula Wojciech Sulisz [email protected] Sea coastalzone
Adrian Stanica [email protected]
Costa Brava Bays Jose Jiménez [email protected] Bay, UK James Sutherland [email protected] Beach Jeremy Gault [email protected]
EU FP6 CONSCIENCE
3
2 Data Set Inventory – Holland coast
2.1 Bathymetry
Since 1963 annual profile measurement have been carried out along the entire DutchNorth Sea coast (echo sounding). These so called JARKUS transects are contained inthe JARKUS dataset and cover the topography and bathymetry of the near shore zone.The JARKUS dataset is also gridded to a 20 x 20 m fixed map format (in Dutch the socalled Kaartbladen). Additional to these yearly measurements, several nourishmentsare monitored more frequently (echo soundings of the surrounding area).
Less frequently (from 1926 to 2006 with varying intervals, for most areas a frequencyof 5 years applies) the deeper part of the Dutch Coastal system is included in the echosounding. Also included are the area of the Wadden Sea and the (former) estuaries inthe Zeeuwsche Delta (Southern part of the Netherlands). This data (in Dutch the socalled Vaklodingen) are also gridded to a 20 x 20 m fixed map format.
Beach line data were gathered on an annual basis from 1943 to 1963 (afterwards theJARKUS measurements started from which beach lines can be derived). The beachline data contains MLW, MHW and dune foot measurement at roughly 1 kmalongshore resolution.
At five positions along the Dutch coast video monitoring technique (Argus) isavailable. The first Argus station has been operational since 1999. In contrast with theannual measurement, this video monitoring technique supplies continuousinformation on the bathymetry. This leads to more insight in the dominant processes(processes that determine the morphological development).
2.2 HydrodynamicsOver more than 25 years, data concerning off shore and nearshore boundaryconditions (consisting of tide, setup, wind and waves) is gathered. The NationalMeasurement Network Water (in Dutch Landelijk Meetnet Water) providescontinuously information on water levels and significant wave heights from a largenumber of stations along the coast. Also four offshore locations in the North Sea areincluded in the monitoring network: K13-alpha 1, Stroommeetpaal IJmond,Stroommeetpaal Maasmond and Lichteiland Goeree 1.
Hydraulic boundary conditions for testing the various sea defenses are issued by theMinistry of Transport, Public Works and Water management every 5 years.
2.3 NourishmentsA record of all nourishments carried out in the Dutch coastal zone is availablecontaining information on location, type (beach nourishment, shoreface nourishment,dune enforcement), volume etc. In addition a record of dredging activities is available.
Most of the above mentioned data can be retrieved freely via internet.

EU FP6 CONSCIENCE
4
3 Data Set Inventory – Hel PeninsulaAvailable measurements for the Polish Pilot Site at the Hel Peninsula.
3.1 SedimentSieve tests were conducted for sediment samples collected near Wladyslawow andChalupy for the year 1985.
3.2 Bathymetry data 2004-2008There are 73 profiles of sea bed available. The profiles were measured from thevicinity of the shoreline to the water depth of about 15 m on average. The profiles arein 500 m spacing and cover 36 km of the shoreline and were measured perpendicularto the shore. The length of the profiles varies from 800 m to 1500 m.
Other available data were collected in 1995 for the short parts of the shoreline atKuznica and Jastarnia. Cross-shore profiles were measured also in 1985 near Kuznica,Wladyslawowo (1996), Chalupy (1996), Kuznica (1997).
3.3 Shoreline evolution 2002-2008The data are available for years 2002, 2003, 2004, 2005 and 2008. The position of theshoreline was measured at least every 500 m and covers 36 km of the Hel Peninsulashore.
3.4 Artificial nourishmentThe data is provided for every year of the period 1998-2007. The volumes areprovided for two regions 0-10 km distance from Wladyslawowo harbour and 10-23km from the harbour.
3.5 WindsThe measurements of wind velocities are available for the following sites and periods:
- Leba (30 km from Wladyslawowo, 1961-1977),- Hel village (1952-1990),- Kuznica (1.07-30.10.1985),- Hel Peninsula 0-12.3km wind velocities (23.04-20.09, 1996).
3.6 WavesThe measurements were conducted in the vicinity of the Hel village 800 m offshore.The directional waverider buoy was deployed at a water depth of 20 m. The datacover the period between 3.11.2008 and 5.05.2009. Available data are records of free-surface elevation measured at a frequency of 1.28 Hz for 20 minutes.
Also the Baltic longterm forecast is available for the period 1958–2001. The WAM4model was used. Parameters available are: significant wave height, mean wavedirection, mean wave period, wave component period in spectrum peak, swell height,mean swell direction, mean wind wave direction.

EU FP6 CONSCIENCE
5
4 Data Set Inventory – Danube Delta
For the Danube Delta pilot site the following measurements have been made:
4.1 Beach profilesMorphological beach profiles (from the inland limit of the dune zone – to the waterdepth of 1.5m along the entire shoreline):
- 1984 – 2000 – annual field measurements (generally August) with classicaltopographic methods (theodolites, topographic gauge). Measurements made inthe 4 main sectors of the coastal cell (Sulina, Canalul cu Sonda, CaslaVadanei, Sf. Gheorghe).
- 1994 – 1999 – seasonal field measurements on a pilot site with transverseprofiles measured every 25 metres (beach of Sf. Gheorghe – southern part ofthe cell). Measurements performed every February, June, August, November.
- 2001 – 2003, 2006, 2007 – annual field measurements (August, except for2002 and 2003 - June) with classical topographic methods (theodolites,topographic gauge). Measurements made only in the Sulina and Sf. Gheorghebeach sectors (the benchmarks from other sectors were lost due to erosion andstorms).
4.2 Sediment samplesSuperficial sediment sampling along the before-mentioned beach profiles. Sedimentsamples were collected for one profile for each beach sector. Seven characteristicpoints were sampled for each profile: inland limit of the dune zone, limit dunezone/backshore, berm crest, upper swash, runnel, first submerged bar (generally at 0,8m), 1,5 m water depth.
Sediment samples were analysed for: grain size (always) and for mineralogy (heavyminerals and Calcium Carbonate contents – between 1984 and 2000, then for 2001 –2003, 2007).
Complete sets of samples (seven samples per profile) exist for the 4 beach sectionbetween 1984 and 2000. Other data – Sulina and Sf. Gheorghe for 2001 – 2003, 2007.
4.3 BathymetryBathymetry measurements:- June 2002 – the entire area (border with the Ukraine – Sahalin Island) – single beamInterphase echosounder with Sercell GPS- June 2003 - Sulina mouth and surrounding area – single beam echosounder withSercell GPS- July – August 2007 – the entire area (Sulina – Sahalin Island) – dual beamechosounder with incorporated GPS - Ceeducer.
4.4 ShorelineShoreline positions measured with GPS:June 2002 – the entire shoreline between Sulina and Sf. Gheorghe – Sercell GPSJune 2003 – the shoreline up to 15 kilometres south of Sulina mouth – Sercell GPSJune 2007 – the entire shoreline between Sulina and Sf. Gheorghe – Ceeducer.

EU FP6 CONSCIENCE
6
4.5 MapsMaps (for the entire coast):- 1857 – Map made by the UK Admiralty – Admiral Spratt (during the Crimean War)– the copy of the map can be used only for orientation.- 1898 – Romanian Navy Directorate Map- 1979 – Romanian Navy Directorate Map- 1997 – Romanian Navy Directorate Map- 2009 – Romanian Navy Directorate Map
4.6 Wind measurementsData used for modelling originate from the meteo stations included in the officialnational meteorological network (National Administration for Meteorology).
Wind data are measured four times each day (every 6 hours) – and consist of directionand velocity.
From Sulina meteorological station, data are available for 1991 – 2000, 2002.From Sfantu Gheorghe meteorological station, data are available for 2003 – 2008.From the Gloria Oil Rig meteo station data are available only for 2002.
4.7 WavesNo measurements of the wave climate have been used, nor that have been made (atleast that we are aware of). The wave climate in front of the Danube Delta, based onthe wind regime and bathymetry, was computed using SWAN model.
EU FP6 CONSCIENCE
7
5 Data Set Inventory – Costa Brava Bays
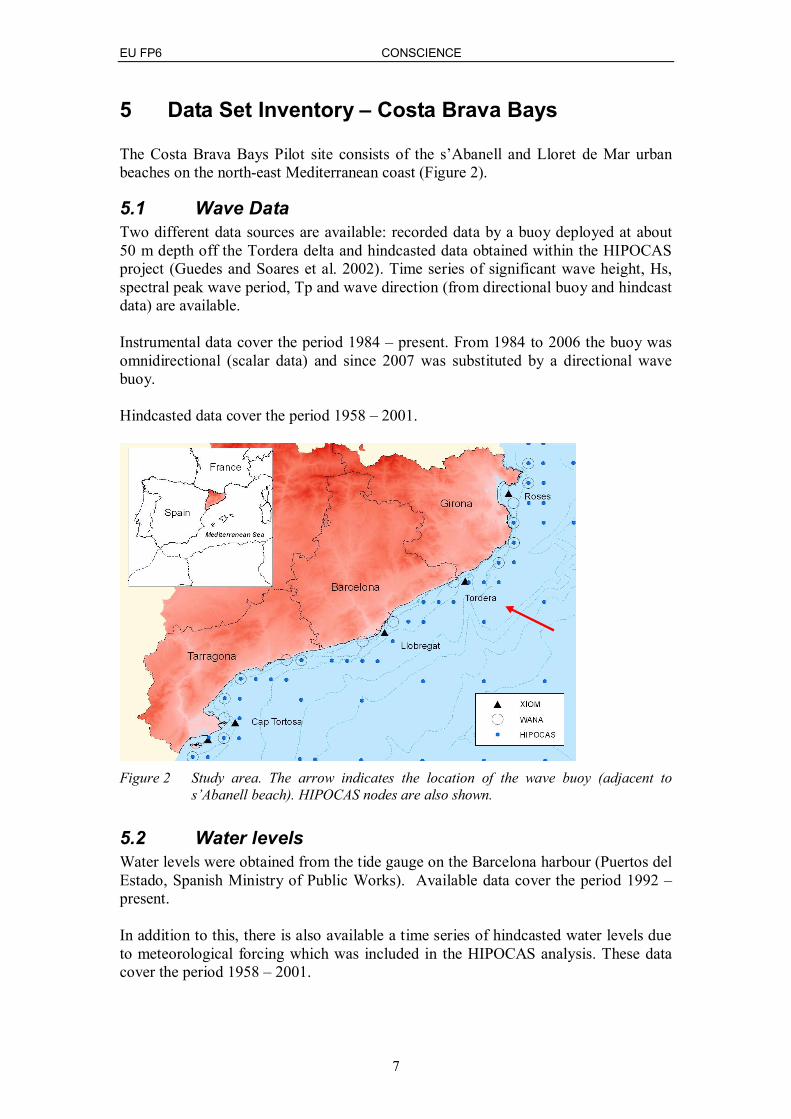
The Costa Brava Bays Pilot site consists of the s’Abanell and Lloret de Mar urbanbeaches on the north-east Mediterranean coast (Figure 2).
5.1 Wave DataTwo different data sources are available: recorded data by a buoy deployed at about50 m depth off the Tordera delta and hindcasted data obtained within the HIPOCASproject (Guedes and Soares et al. 2002). Time series of significant wave height, Hs,spectral peak wave period, Tp and wave direction (from directional buoy and hindcastdata) are available.
Instrumental data cover the period 1984 – present. From 1984 to 2006 the buoy wasomnidirectional (scalar data) and since 2007 was substituted by a directional wavebuoy.
Hindcasted data cover the period 1958 – 2001.
Figure 2 Study area. The arrow indicates the location of the wave buoy (adjacent tos’Abanell beach). HIPOCAS nodes are also shown.
5.2 Water levelsWater levels were obtained from the tide gauge on the Barcelona harbour (Puertos delEstado, Spanish Ministry of Public Works). Available data cover the period 1992 –present.
In addition to this, there is also available a time series of hindcasted water levels dueto meteorological forcing which was included in the HIPOCAS analysis. These datacover the period 1958 – 2001.

EU FP6 CONSCIENCE
8
5.3 Topographic dataDifferent topographic surveys have been done in both beaches since 2004 (11 surveysin s’Abanell beach and 8 in Lloret) by DGPS levelling. Only the subaerial beach wassurveyed.
5.4 BathymetriesTwo bathymetries are available for the southern site (s’Abanell beach). These twocampaigns were performed in 1995 and 1997 by the Ministry of Environment.
5.5 Shoreline dataDifferent shorelines extracted from aerial photographs are available for both beaches.The period covered extends from 1957 until present.
5.6 Sediment dataTextural parameters of the sediment in both beaches have been obtained fromsediment samples taken at the beachface of each site.
5.7 Beach nourishment dataData on artificial beach nourishment performed at the study area have been obtainedfrom the Ministry of Environment (nourished volume, date, sediment type).

EU FP6 CONSCIENCE
9
6 Data Set Inventory – Pevensey Bay
6.1 IntroductionThe Pevensey Bay field site is situated on the English Channel coast of East Sussexbetween Eastbourne and Bexhill-on-Sea.. The area is covered by the Channel CoastalObservatory (http://www.channelcoast.org/) which is the data management centre forthe Southeast Regional Coastal Monitoring Programme. Much of the data used atPevensey was collected by the Channel Coastal Observatory or a link to it wasprovided from there. Meta-data on the data used and available is given below.
6.2 Wave DataThe Channel Coastal Observatory has deployed a Datawell Directional WaveRiderMk III wave buoy in Pevensey Bay since March 2003. Its location is at50°46.96602´N, 0° 24.97493´E, although this has changed by small distances as thebuoy has been redeployed several times after servicing or loosing its moorings. Itslocation is shown in Figure 3. Time series of wave data were downloaded from theChannel Coastal Observatory between 2003 and 2008 inclusive. The time seriesrecorded the following observables every 30 minutes, unless interrupted:
Date – day, month, year.Time (GMT)Latitude (WGS84)Longitude (WGS84)FlagHs (m) – significant wave height defined as Hm0 = 4 m0, where m0 is the zeroth
order spectral moment of surface elevation.Hmax (m) – height of highest wave in record.Tp (s) – spectral peak wave period.Tm (s) mean wave period = (m0/m2) with m2 the second order spectral moment
of surface elevation.Dirp (degrees) – direction of peak of wave spectrum.Spread (deg) – spread at peak of wave spectrum.SST (deg C) – sea surface temperature.
Manufacturer’s specified accuracy is 3% on wave height, 1.5° on wave direction,0.2°C. Data were quality controlled for out-of-range values and spikes. Further meta-data is available on the Channel Coastal Observatory web site.
6.3 Water levelsWater levels were obtained from the tide gauge on the east side of the port entrance atNewhaven. The data were supplied by the British Oceanographic Data Centre as partof the function of the National Tidal & Sea Level Facility(http://www.pol.ac.uk/ntslf/) hosted by the Proudman Oceanographic Laboratory andfunded by the Environment Agency and the Natural Environment Research Council.
Data was obtained from 2003 to 2008 to correspond to the period that wave data wasavailable. The tide gauge is located at 50° 46' 54.4" N, 00° 03' 25.3" E and recordeddata every 15 minutes. The equipment consists of an Ott pneumatic gauge and a

EU FP6 CONSCIENCE
10
pneumatic bubbler system, which collected between 97% and 100% of the possibledata records in each year.
All data refer to Admiralty Chart Datum (ACD). The relationship between ACD andOrdnance Datum Newlyn (ODN) ig given by ACD = ODN – 3.52m. All times aregiven to Greenwich Mean Time (GMT). The data was obtained in annual files inascii format and consist of a header and time series of data. The header contains aport number (assigned by Proudman Oceanographic Laboratory) the site name,approximate latitude and longitude of the gauge, the start and end date of the data inthe file, the name of the supplier of the data, the datum that the data refer to and aparameter code used by BODC to identify how the measurements were obtained.
The first two lines of the body of the file show how information is listed. Eachsubsequent line of the time series consists of:
Cycle number (integer value);Date in format year / month / date;Time in format hour : minute : seconds;Sea level value (mACD);Flag channel identifying problems with the sea level values;Residual = observed sea level minus predicted sea level (m);Flag channel identifying problems with the residual values.
6.4 Topographic data
6.4.1 2003 survey by Channel Coastal ObservatoryFifty-eight cross-shore profiles of the shingle barrier, stretching from SovereignHarbour almost to Cooden were also obtained from Channel Coastal Observatory.The 2003 baseline survey was conducted using a Leica SR530. The contract requiredaccuracy in position of ±15mm and in elevation of ±30mm. An average of 24 pointswas measured at each profile. The vertical datum was ODN.
All 58 profiles were reported in a single file, which contained a single header linefollowed by the data. Each line of data contained:
Eastings (m, OSGB36)Northings (m, OSGB36)Elevation (m, relative to ODN)Chainage (distance in m)FC = Feature Code (S = sand, G = gravel, SH = shell, etc (seehttp://www.channelcoast.org/data_management/online_data_catalogue/images/feature_codes.pdf for more details)Profile Reg_ID = profile registration number (allocated by CCO and differentfor each of the 58 profiles).
6.4.2 Environment Agency profilingThe Environment Agency monitors the beach management services provided byPevensey Coastal Defence Limited by measuring a series of 52 cross-shore profiles atapproximately 180m centres every four months using GPS stake-out surveys.

EU FP6 CONSCIENCE
11
6.4.3 Monthly surveys by PCDLPevensey Coastal Defence (PCDL) undertakes a full beach survey every month,coinciding with the lowest spring tide of that period. This is always around 06:00 forthe Sussex coast. Each survey is conducted using a GPS receiver mounted on a quadbike. The bike is driven along beach contours at the position of changes in beachslope. Typically a length of beach will be surveyed from the top of beach crest at+6.0m to MLWS at -3.0m. Generally only the active beach is surveyed every month,static sections only being re-surveyed after significant wave events have occurred.The entire 9km long beach can be surveyed from the crest of the shingle ridge to thelow water mark by a single person within a single tide in summer, but may take twotides in winter. Observations are obtained every one second, meaning that a typicallong-shore resolution is 5m in most places, stretching to 10m on the flat, sandy lowerforeshore. Spatial resolution cross-shore depends on beach geometry at the time, buttends to lie within 5m to 20m..
6.5 Hydrographic dataInshore surveys of the local bathymetry have been conducted for the Channel CoastalObservatory using a Phillips DGPS system and a HydroTrac Echosounder, on aHardy Fisher 34 boat. This provides an accuracy in the coordinates of ±1m. TheOSGB coordinate system was used with elevations given to Ordnance DatumNewlyn. Depths are probably accurate to about 0.15m (depending on the waveconditions at the time of the survey).
6.6 Ordnance Survey MapsDigital versions of 1:2500 scale Ordnance Survey (OS) maps from 1973 to 2004 wereobtained so that the evolution of the contours of Mean High Water (of ordinary tides)and Mean Low Water (of ordinary tides) could be studied. OS maps come in differentperiods, referred to as epochs. The number of map tiles from each epoch and therange of dates of these maps is shown in the following Table. Each map wasindividually dated. The accuracy of the representation of tidelines on OS maps hasbeen studied within the project but is not discussed here.
Date rangeEpoch Number of maptiles from to
1 6 1873 18762 6 1899 18993 6 1909 19104 5 1925 1930A5 12 1955 1965B6 3 1975 1976SIM 1 9 1964 1989SIM 2 3 1983 1989SIM 3 1 1988 1988SUSI A5 2 1973 1973Mastermap 2004 2004

EU FP6 CONSCIENCE
12
6.7 Additional data availableThe following data is available from CCO but was not used:
Filtered and unfiltered LIDAR dataAerial photographs
The following data was available from Pevensey Coastal Defence LimitedParticle size distributions from beach sediment samples and from nourishmentmaterial.Records of beach nourishment and recycling activities, specifying volumes,locations and dates of activity.
6.8 AcknowledgementsThe Southeast Regional Coastal Monitoring Programme is funded by Defra, inpartnership with the Maritime Local Authorities and the Environment AgencySoutheast Region, to whom we are grateful. The National Tidal & Sea Level Facilityis hosted by the Proudman Oceanographic Laboratory and funded by the EnvironmentAgency and the Natural Environment Research Council. Pevensey Coastal DefenceLimited manages the beach under a contract from the Environment Agency.
EU FP6 CONSCIENCE
13
7 Data Set Inventory – Inch Strand, Kerry
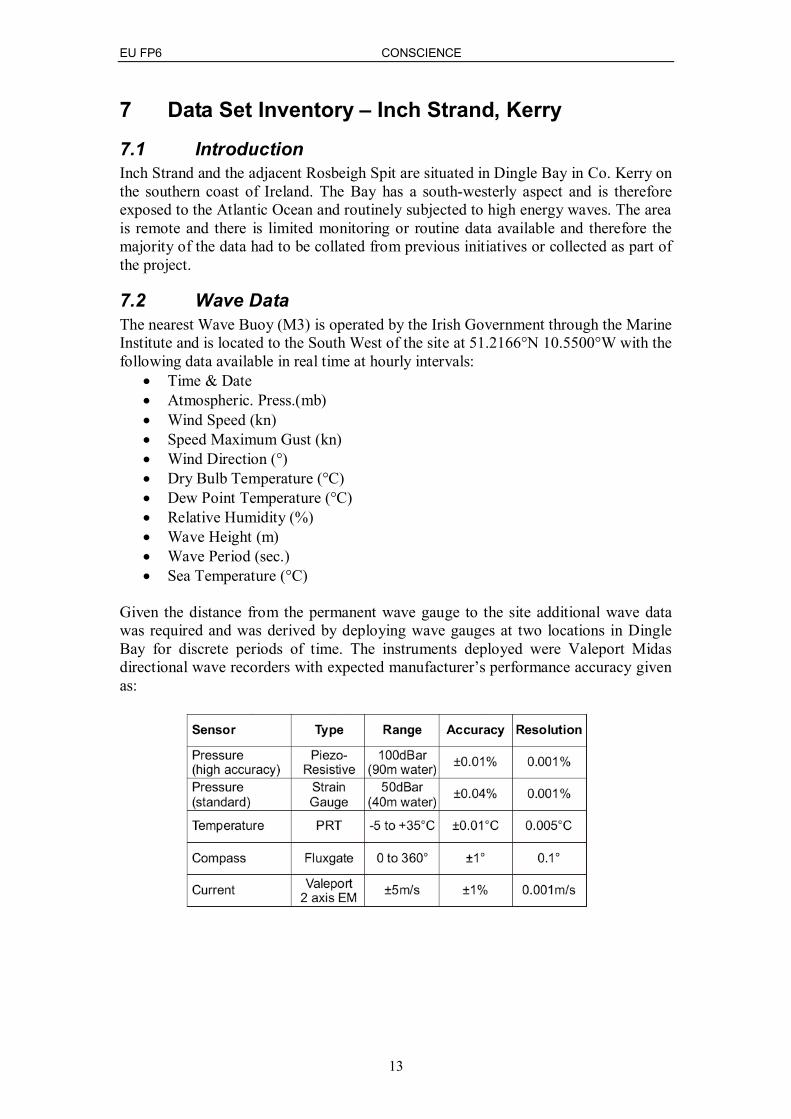
7.1 IntroductionInch Strand and the adjacent Rosbeigh Spit are situated in Dingle Bay in Co. Kerry onthe southern coast of Ireland. The Bay has a south-westerly aspect and is thereforeexposed to the Atlantic Ocean and routinely subjected to high energy waves. The areais remote and there is limited monitoring or routine data available and therefore themajority of the data had to be collated from previous initiatives or collected as part ofthe project.
7.2 Wave DataThe nearest Wave Buoy (M3) is operated by the Irish Government through the MarineInstitute and is located to the South West of the site at 51.2166°N 10.5500°W with thefollowing data available in real time at hourly intervals:
Time & DateAtmospheric. Press.(mb)Wind Speed (kn)Speed Maximum Gust (kn)Wind Direction (°)Dry Bulb Temperature (°C)Dew Point Temperature (°C)Relative Humidity (%)Wave Height (m)Wave Period (sec.)Sea Temperature (°C)
Given the distance from the permanent wave gauge to the site additional wave datawas required and was derived by deploying wave gauges at two locations in DingleBay for discrete periods of time. The instruments deployed were Valeport Midasdirectional wave recorders with expected manufacturer’s performance accuracy givenas:

EU FP6 CONSCIENCE
14
Figure 3 Map showing a) the location of Dingle Bay and M3 Wave Buoy and b) thelocation of Inch and Rosbeigh within Dingle Bay
7.3 Water levelsThere are no accurate tide gauges in this area and any long term tidal data was derivedfrom tide tables produced by the UK hydrographic office. Short term data wasrecorded during the wave gauge deployments and converted to Ordnance Datum(Malin).
7.4 Topographic dataTwenty-eight cross shore profiles were established from the northern end of InchStrand to the distal point. These were surveyed over a six-month period using aTrimble Series 4400 differential Global Positioning System (dGPS) base and roverunit in conjunction with a six-wheel vehicle. The dGPS was operated in fine modegiving an expected accuracy of 1cm (+2ppm baseline length) in the horizontal and
2cm (+2ppm baseline length) in the vertical.
a)
b)

EU FP6 CONSCIENCE
15
7.5 Hydrographic dataThere is very limited hydrographic data available for Dingle Bay and thereforebathymetry was limited to reproduction of historical data from the UK HydrographicOffice.
7.6 Ordnance Survey MapsA significant amount of research had been conducted into the position of Inch fromhistorical mapping sources. Historical OS series maps from the nineteenth century andearly twentieth century conducted by the UK Ordnance Survey were combined withmore recent Ordnance Survey (Ireland) mapping and aerial photography using theGIS software, ArcMap 9.2.

EU FP6 CONSCIENCE
16
8 ReferencesEuropean Commission, 2004. Living with coastal erosion in Europe – sediment andspace for sustainability. Luxembourg: Office for Official Publications of theEuropean Communities. 40pp, ISBN 92-894-7496-3.
Marchand, M., 2008. The CONSCIENCE project: bridging the knowledge gap forsustainable coastline management. Proceeding of LITTORAL ’08, Venice, Italy.
van Koningsveld, M. and Mulder, J.P.M., 2004. Sustainable coastal policydevelopments in the Netherlands. A systematic approach revealed. Journal ofCoastal Research, 20(2) 375-385.
van Koningsveld, M., Davidson, M.A. and Huntley, D.A., 2005. Matching sciencewith coastal management needs: the search for appropriate Coastal State Indicators.Journal of Coastal Research, 21(3) 399 – 411.