Data Quality - The Global Fund to Fight AIDS, Tuberculosis ...€¦ · LFA TRAINING 2019/2020...
36
Data Quality PROGRAMMATIC M&E LFA TRAINING LFA TRAINING 2019/2020 GENEVA, SWITZERLAND
Transcript of Data Quality - The Global Fund to Fight AIDS, Tuberculosis ...€¦ · LFA TRAINING 2019/2020...

Data Quality
PROGRAMMATIC M&E LFA TRAINING
LFA TRAINING 2019/2020
GENEVA, SWITZERLAND

Data Quality
2
Data Quality and Importance to the Global Fund
Approach to data quality assessment
Planning and Implementation
Expected outputs
Use of Targeted DQR results
Case study – Review & Discussion
1
2
3
4
5
6
Presentation outline:

What is good quality data ?
• Data fit for purpose - sound data for planning and setting priorities
• Complete – indicator data elements
• Reporting completeness
• Timely reporting
• Accurate
• Reliable
3
Data Quality and Importance to the Global Fund1

➢ Data Quality is a key risk for the Global Fund
➢ Quality data is required for sound decision making program planning, investment decisions,
monitoring, program performance, quality improvement
➢ Health facility data is the primary source for assessing health sector performance. The quality of
routine data reported by health facilities should be assessed regularly and required investments
should be made to ensure data is reliable and useable
➢ Countries with poor and very poor data quality will receive regular data quality reviews to closely
monitor improvements over time
➢ Data quality reviews will be less frequent in countries with good data quality
4
Data Quality and Importance to the Global Fund1

Why we need good quality data ( country level and GF)
Planning / Investments
• NSP
• Concept note
• Prioritization
• Targeting
• Finding missing cases, KPs, etc.
• Allocation
• Strategic investment decisions
Program Improvement
• Monitoring of implementation
• Decision making
• Modification
• Annual funding decision
• Reprograming
Monitoring and Evaluation
• Quality
• Effectiveness
• Efficiency, etc.
• Results reporting
• KPI, etc.
1

6
4. Evaluations
1. Investments in
country data
systems and
analytical
capacities
2. Program
monitoring 3. Systematic
data analysis &
synthesis
Co
un
try p
roces
ses
Glo
bal
Fu
nd
en
try p
oin
ts
5. Data use through ongoing dialogue, action and improvement
Coordination with partners
Improve data availability & quality
Support partners in development of
normative tools and guidance, and
dissemination harmonized tools and
process to countries.
Invest in HMIS / DHIS through regional
and global software development and TA
network
Analytics and data use
Build in-country analytical
capacity, Strengthen data
analysis and program
reviews:
Technical assistance pool:
Comprehensively
evaluate for learning
and accountability
GF-led evaluations in
focused countries:
Thematic reviews:
Data Use for Action and Improvement (DUFAI) Framework 1

Purpose:
To track program performance and to assist in effective Management, and timelydecision-making through systematic collection of data alongside program implementation
• Performance
• M&E System Strengthening Activities
• Program Quality
• Data Quality
7
Component 2: Program monitoring1
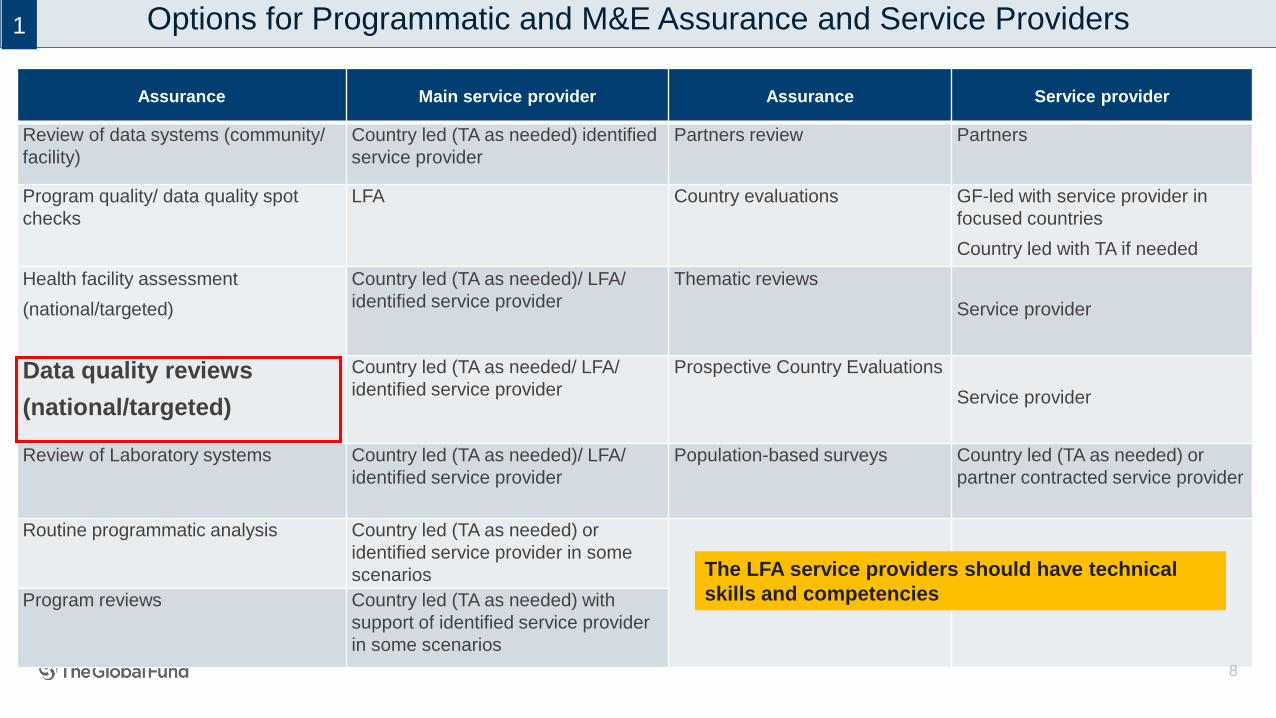
Assurance Main service provider Assurance Service provider
Review of data systems (community/
facility)
Country led (TA as needed) identified
service provider
Partners review Partners
Program quality/ data quality spot
checks
LFA Country evaluations GF-led with service provider in
focused countries
Country led with TA if needed
Health facility assessment
(national/targeted)
Country led (TA as needed)/ LFA/
identified service provider
Thematic reviews
Service provider
Data quality reviews
(national/targeted)
Country led (TA as needed/ LFA/
identified service provider
Prospective Country Evaluations
Service provider
Review of Laboratory systems Country led (TA as needed)/ LFA/
identified service provider
Population-based surveys Country led (TA as needed) or
partner contracted service provider
Routine programmatic analysis Country led (TA as needed) or
identified service provider in some
scenarios
Program reviews Country led (TA as needed) with
support of identified service provider
in some scenarios
8
The LFA service providers should have technical
skills and competencies
Options for Programmatic and M&E Assurance and Service Providers1

Programmatic and M&E Assurance options
Associated LFA Service (2018 LFA Services list)
1.Review of data systems (community/facility) M&E system assessment
2. Program and/or data quality spot checks− Program and/or data quality spot checks;
− Joint programmatic, financial and supply chain spot checks
3. Health facility assessments Targeted HFA
4. Data quality reviews Targeted DQR
5. Review of laboratory systemReview of medical lab systems/services, including lab-related supply
chain
6. Program reviews n/a
7. Partner reviews n/a
8. Routine programmatic analysis n/a
9. Population -based surveys n/a
10. Country evaluations n/a
11. Thematic reviews n/a
12. Prospective Country Evaluations n/a
13. Community monitoring n/a
PU/DR or PU: Verification of Programmatic Performance; Review of
grant documents (PF, M&E plan) 9
Role of LFA in Programmatic and M&E Assurance1

8
4
6
30
5
7
1
9 72
5
4
DQR ToolsWHO DQR
Framework and
Metrics
Modules 1, 2 & 3
32

❖ Multi-pronged and harmonized approach for data quality assurance: DQR framework is
a collaborative effort of WHO, GF, GAVI, JSI & MEASURE Evaluation
❖ Data quality analysis of a set of core tracer indicators across multiple program areas & a
system assessment
❖ Permits the Global Fund to know that the routine data have undergone a known minimum
level of scrutiny which lends credibility and confidence in the data
11
Harmonized Data Quality Assessment Tool: WHO Data Quality Review (DQR)2

• Harmonized and holistic assessment of the quality of data collected from health facilities
• Quantifies problems of data completeness, timeliness and accuracy according to program areas;
• Identifies weaknesses in the data management system
• Monitors performance of data quality over time
• Results in a data quality improvement plan to address weaknesses in data
12
Scope Recommended frequency
National DQR: nationally representative sample ➢ National DQR: within 2 years if the ‘data quality’ rating is poor/ very poor and
every 3-4 years, if the ‘data quality’ rating is moderate/good
Targeted DQR: 20-40 sites, with a geographic area
generally, not statistically representative
➢ Targeted DQR: based on programmatic risks and context
➢ To assess facility-reported data, including routine monitoring of data from priority health
programs;
➢ Provides risk assurance for service delivered at health facilitiesPurpose
Approach to data quality: WHO Data Quality Review (DQR) Framework2

DQR tool has 3 components implemented together in a national DQR; targeted DQR implement all or some
with a smaller and more targeted sample size (~20-40), and in a geographic area in a country
Data Quality Review Toolkit: 3 Components
DQ
R
Data Verification - verification of indicator values sent from health facility to the next level of reporting(i.e.,
district), and an evaluation of completeness and timeliness of reporting and required data.
- Conducted at Facility & District level
System assessment - evaluation of the extent to which critical elements of the reporting system and data-use adhere
to a minimum set of acceptable standards.
- Conducted at Facility & District level
Desk review - examines data reported to national level; quality of aggregate reported data for programme indicators
is examined using 4 standardized data quality metrics:
1) completeness of reporting, 2) internal consistency, 3) external consistency of data, 4) external
comparisons
Examines a core set of tracer indicators selected across
program areas in relation to these dimension
➢ Questionnaires for Data Verification, System Assessment
➢ LFA Excel tool for data entry and analysis
2

1. Completeness of facility reporting per selected program indicator
2. Timeliness of facility reporting per selected program indicator
3. Data Accuracy
i. Verification Factor per indicator
ii. % Exact Match, % Over & % Under reporting per indicator
Data Quality Review Metrics Tracked at The Global Fund2

Applies to health-facility reporting to the next level.
➢ Example: Health Facility to districts, and district reporting to the regional or provincial levels
o Completeness of indicator data: minimum set of variables
▪ Measures whether the health facilities have included information on each of the
selected indicators in their monthly reporting form.
o Completeness of facility reporting:
▪ Assessed by measuring whether all health facilities that are supposed to report
actually do so
o Timeliness of facility reporting:
▪ Assessed by measuring whether all health facilities that submitted reports did so
before a pre-defined deadline
.
Reporting Performance- Completeness & Timeliness2

o Focus
Consistency of reported data and original records
o Process:
➢Data Verification
➢Requires collection of primary data from health facilities
➢Assess the reporting accuracy for selected indicators through the review of source
documents in health facilities, and in the national database/HMIS
➢Yields a verification factor: the degree of disparity between the reported number and
recounted number
o Calculation
➢Recounted number of service outputs recorded in source documents at health facilities,
divided by the number of service outputs reported through the reporting system for selected
indicators
Reporting Performance: Accuracy2

➢ A focused review and assessment of data quality with a smaller
and more targeted sample
➢ Country teams can select any or all three components of the DQR
to implement, based on objectives of the assessment
1. Data Verification
2. M&E Systems Assessment
3. Desk Review
➢ Targeted DQR may focus on 1 or more diseases (HIV, TB, malaria)
➢ Conducted by LFA
➢ ~ 20-40 sites
WHO DQR
Targeted
Data Quality
Review
Modules 1, 2
& 3
2

• When a national DQR did not cover a program area of concern (e.g. community
services)
• To assess the quality of reported data for specific program areas supported by
GF grants
• When there is an identified data quality risk & country context
• To assess the strengths and limitations of data prior to using it for planning and
program management
• As requested by Country Team
When is a Targeted DQR Implemented ?2

19
Country CategoryAssessment Approach
High Impact
countries
Targeted DQR can be conducted anytime, based on risk and context
Core countries Targeted DQR can be conducted anytime, based on risk and context
Focus countries Ad hoc based on risks
DQR Options and Implementation
The data quality assessment approach differentiates assessment methods/activities across the three country
categories:
2

Planning Targeted DQR
Targeted DQR : Guidance, Generic scope of work, tools, planning and reporting templates available
PHME Coordinates with the LFA to define specific objectives, budget and LoEs for implementing DQR.
Planning for programmatic assurance activities starts each year in August during the annual Assurance planning process
MECA is available to support Country Team PHME Specialist during the planning, implementation and to review report1
2
3
4
3

• Customized Terms of Reference to document and agree with GF Country Team on the objectives, scope and
details of the assessment
• Planning Template – to document and finalize with the GF Country Team all planning details for the assessment
✓ LFA plans to implement the tasks and deliverables; Country team approval prior to the start of activities
✓ Coordination of planned activities with the country stakeholders: the Ministry of Health, Principal Recipients and with
the specific focal points in country
Sampling Approach – Purposive /Convenience
✓ Sites selected for Data Verification and Systems Assessment should be agreed with the Country team [20-40sites]
✓ Ensure sites selected provide health services for the selected indicator and has source documents
✓ LoEs & Budget approval by the Country team prior to start of activities
• Facility & District Data Verification, M&E Systems Assessments
✓ DQR Guidance
✓ User Guide to the WHO Data Quality Review Toolkit
✓ Questionnaires for data verification and System Assessment
✓ Excel Sheet for Data entry and Analysis
✓ Reporting Template 21
Planning a Targeted DQR3

22
What is needed
1. Statement of Work/Terms of Reference incl. Budget
2. WHO DQR Guidance –Framework & Metrics
3. GF Planning Template
4. DQR Tools: Questionnaires,
5. Data Entry Excel Sheets for data capture and analysis
6. Reporting template-The primary report to be submitted for the Targeted DQR assessment,
containing key results and recommendations from all three components
Planning a Targeted DQR
Agree with the CT on scope and details of the assessment, and complete the planning template
3

23
➢ Antenatal care 1st visit
(ANC1)
➢ DTP3/Penta3
➢ Currently on ART
➢ Notified cases of all form
of TB
➢ Confirmed malaria cases
➢ Number (%) of pregnant women who attended at least once during their
pregnancy
➢ Number (%) of children < 1 year receiving three doses of DTP/Penta vaccine
➢ Number and % of people living with HIV who are currently receiving ART
➢ Number (%) of all forms of TB cases (i.e. bacteriologically confirmed plus
clinically diagnosed) reported to the national health authority in the past year
(new and relapse)
➢ Number (%) of all suspected malaria cases that were confirmed by
microscopy or RDT
WHO Recommended Program Indicators to Assess for Data Quality 3

24
HIV
• People living with HIV who have been diagnosed
• Number (%) of people living with HIV who have been diagnosed
• HIV care coverage: Number (%) of people living with HIV who are receiving HIV care
(including ART)
• PMTCT ART coverage: Number (%) of HIV-positive pregnant women who received ART during
pregnancy
• ART retention: Number (%) of people living with HIV and on ART who are retained on ART 12
months after initiation (and 24, 36, 48, and 60 months)
• Viral suppression: Number (%) of people on ART who have suppressed viral load
Additional DQR Indicators for Data Quality 3

TB
• Notified cases of all forms of TB
• TB treatment success rate
• Second-line TB treatment success rate
TB-HIV
Proportion of registered new and relapse TB patients with documented HIV status
• Number of new and relapse TB patients who had an HIV test result recorded in the TB register,
expressed as a percentage of the number registered during the reporting period
• Proportion of HIV-positive new and relapse TB patients on ART during TB treatment
• Number of HIV-positive new and relapse TB patients who received ART during TB treatment
expressed as a percentage of those registered during the reporting period
Additional DQR Indicators for Data Quality 3

26
MALARIA
• Malaria diagnostic testing rate: Number (%) of all suspected malaria cases that received a
parasitological test [= Number tested / (number tested + number presumed)]
• Confirmed malaria cases receiving treatment: Number (%) of confirmed malaria cases treated that
received first-line antimalarial treatment according to national policy at public sector facilities
• Malaria cases (suspected and confirmed) receiving treatment: Number (%) of malaria cases
(presumed and confirmed) that received first-line antimalarial treatment
• IPTp3 : Number (%) of pregnant women attending antenatal clinics who received three or more
doses of intermittent preventive treatment for malaria
Additional DQR Indicators for Data Quality 3

Steps to Implement Data Verification and System Assessment
7. Report writing including prioritized recommendations
6. Data management, analysis, interpretation
5. Quality control
4. Field work / Data collection
3. Adaptation of survey tools
2. Sampling approach: objective is not a representative sample but rather a focused review
1. Planning including coordination with PR, MoH & in country stakeholders
3

Outputs of Targeted DQR - Data Verification
✓ Data flow per indicator
✓ Completeness of Indicator Data
✓ Reporting Completeness
✓ Reporting Timeliness
✓ Accuracy: Verification Factor per indicator, over and under reporting
System Assessment Tracer indicators = minimum set of acceptable standards
1. % Availability of guidelines at facility level
2. % Availability of trained staff
3. % Availability of tally sheets, registers and reports in forms in last 6 months
4. Receipt of supervision written feedback including on data quality
5. Analysis and use of data
Data Verification(DV) & System Assessment(SA) Outputs4

• Template: A structure to report the results of the assessment including analytical outputs and prioritized
recommendations
New! Include the Data Flow per indicator
➢ Facility Level Data Quality Metrics
(1) Verification Factor(VF)
New! Include Rating per Program indicator
(2) Facility /District Level Reporting Performance
✓Completeness of Indicator data
✓Completeness of Facility Reporting
✓Timeliness of Facility Reporting
29
Accuracy
keyVery poor
>20%
Poor
+/-11% to 20%
Moderate
+ /- 6% to 10%
Good
+/-5%
Indicator Verification Factor
Ratio of recounted number of events from source documents divided by the reported number of events from the HMIS
Enter Result
1. Exact match
% of facilities for which source data exactly matchreported data
Enter Result
2. Over-reporting
% of facilities that over-report by more than 10% (VF < 0.90)
Enter Result
3.Under-reporting
% of facilities that under-report by more than 10% (VF > 1.10)
Enter Result
Targeted DQR Reporting 4

S/n Disease component
Name of Facility
Indicator Verification factor (ratio of recounted/reported)
Reported value for 3 months
Recounted value for 3 months
Verification Factor
Rating per Indicator
Very
poor/Poor/Moderate/Good
30
[1]
For TB indicators only measured by Quarter to delete the Month 1 and Month 2 columns and change the Month 3 name to the quarter name.
Facility Level Data quality Metrics: Summary facility level Data Verification results by indicator4

No District
Name of Service
Delivery Point(SDP)
Month 1: Month 2: Month 3:
Verification Factor
Weighted Error
Reason for variance
Verification Factor
Weighted Error
Reason for variance
Verification Factor
Weighted Error
Reason for variance
#of SDPs assessed
Total
31
Detailed Facility Level Data Verification Results4

32
S/n Disease component/Program area
Indicator
Facility level Data Quality Metrics
1) Timeliness of facility reporting:
% of submitted facility monthly reports received on time
2) Completeness of facility reporting:
% of expected facility monthly reports that were actually received
3) Completeness of Indicator data:
% reports that were complete (out of all received)
Summary Facility Level Reporting Performance by Indicator 4

• Verification of reported results for grant management
• Assurance purposes
• Implement actionable, recommendations for data quality improvements
• To monitor status of data systems and for improvements
• To monitor the quality of data at facility, district and national level
• To track Data Quality indicators and ratings for all countries(HI/Core)
• For the M&E System Profile-DASHBOARD (used for country portfolio reviews, etc.)
How the Global Fund uses Data Quality Results5

19 National DQR
CountryCurrent Risk
HMIS Data Quality
Final DQR Score
DQR Timeliness of facility reporting
DQR Completeness of facility
reporting
DQR Accuracy(VF) Source /Status
A 2.77 93% 92% 83.75% [78.0%, Malaria: 89.5%]
100% Malaria and TB indicators:1.00 Targeted DQR 2018
B 2.33 82% not reported not reported not reported HIV ART VF = 1 Targeted DQR 2017
C 2.26 49% 51% 20% 82% Accuracy : 0.998 National DQR 2017
D 1.67 78% not reported not reported not reported VF: 1 Targeted DQR 2016
E 1 97% Rating 4: very good from report
100% 100% VF for 2 HIV indicators:0.99 and 1.01 Score= 1.0
Targeted DQR 2017
F 3.33 32% 99% 98% 100% VF range 0.99-2.98 National DQA-ART 2018
G 3.00 83% 97% 94% 100% Malaria cases tested: 0.94 Suspect cases 0.98 Suspect cases tested: 0.91 Malaria cases confirmed& ACT Prescription: 1.04 Malaria cases 1.05
Targeted DRQ 2019
H 2 76% not reported not reported not reported TB: 0.99 Malaria 0.83HIV: 0.97 Score =0.93
National DQR 2018
I 2.65 86% not reported not reported not reported PLHIV on ART VF = 0.876 National DQA ART 2018
J 3.67 60% not reported not reported not reported Malaria : suspect cases tested -recount / reported -verification Site 1) 411/248[1.65]; site 2)261/262
[0.99; site 3) 1240/413[3.0]
Targeted DQR 2016
K 3.00 84% 97% not reported for HIV/TB/Malaria Indicators
HIV/TB/Malaria: 91.1% ;99.5%; 99.2%
Data accuracy: TB cases VF = 1.01; Malaria VF = 1.08; Current on ART =0.95 Average: 1.01
National DQR 2018
Tracking Data Quality Results5

Has a National DQR been implemented within
the last 3 years?
Yes
For the 3 diseases, are there results for:
1) completeness of facility reporting
2) timeliness of facility reporting
3) accuracy and its distribution?
Yes
1) Preferred DQ source
No
Are there results for only completeness or timeliness of facility
reporting?
Yes
Check availability of HMIS Source
Are there no results for completeness and timeliness of facility reporting?
Yes
Check availability of HMIS Source
Are there results for only completeness and Timeliness of facility reporting?
Yes
2) Use this DQ Source
No
Is there HMIS data for completeness and timeliness of
facility reporting for the 3 diseases within the last 6 -12 months?
Yes
3) Use this DQ Source
Has there been a targeted DQR implemented in the
last 2 years?
Yes
4) Use this DQ Source
No
Consult Country
Team
No
Data Quality Source: Decision tree5

36
Targeted DQR Case Study
i) Completed Targeted DQR Planning template
• Review the information on the template
• Discuss the tools and process for implementing this targeted DQR
• What are critical outputs envisaged?
ii) Presentation to the larger group
Group Work, Review & Discussion6