
Data Quality: the Field Guide - University of North ... · 1 DATA QUALITY IN ORGANIZATIONAL...
57
Shuang-lin Lee. Data Quality in Organizational Context-- A Case Study. A Master’s paper for the M.S. in I.S. degree. May, 2003. 57 pages. Advisor: Stephanie W. Haas This study examines how contextual factors affect data quality by investigating the acquisition operation of a graduate library in a large public university in the southeast. An area-study unit in the library was chosen as the site for this case study. Interviews were conducted with staff and students involved in the acquisition process, including the unit head, the acquisition manager, the acquisition database system administrator and two students responsible for data entry and pre-order search. Except for the system administrator, four of the participants also filled out a brief questionnaire concerning their views to the database system. The results of the study revealed factors both in the system and process that influence data quality in the database. Based on study findings, recommendations were provided to improve the quality of data and to reduce future errors. Headings: Data Quality Library Acquisitions Innovative Interfaces, Inc. Database Management Systems Data Processing
Transcript of Data Quality: the Field Guide - University of North ... · 1 DATA QUALITY IN ORGANIZATIONAL...

Shuang-lin Lee. Data Quality in Organizational Context-- A Case Study. A Master’s paper for the M.S. in I.S. degree. May, 2003. 57 pages. Advisor: Stephanie W. Haas
This study examines how contextual factors affect data quality by investigating the
acquisition operation of a graduate library in a large public university in the southeast.
An area-study unit in the library was chosen as the site for this case study.
Interviews were conducted with staff and students involved in the acquisition process,
including the unit head, the acquisition manager, the acquisition database system
administrator and two students responsible for data entry and pre-order search.
Except for the system administrator, four of the participants also filled out a brief
questionnaire concerning their views to the database system. The results of the study
revealed factors both in the system and process that influence data quality in the
database. Based on study findings, recommendations were provided to improve the
quality of data and to reduce future errors.
Headings:
Data Quality
Library Acquisitions
Innovative Interfaces, Inc.
Database Management Systems
Data Processing

1
DATA QUALITY IN ORGANIZATIONAL CONTEXT:
A CASE STUDY
by Shuang-lin Lee
A Master's paper submitted to the faculty of the School of Information and Library Science of the University of North Carolina at Chapel Hill
in partial fulfillment of the requirements for the degree of Master of Science in
Information Science.
Chapel Hill, North Carolina
May, 2003
Approved by:
Advisor
2
Table of Contents
Introduction…………………………………………………………………………..3
Literature Review…………………………………………………………………….6
Acquisitions in the East Asian Resources Unit ……………..…………………….23
Methodology………………………………………………………………………...30
Results and Discussion……………………………………………………………...34
Conclusion…………………………………………………………………………...50
References..………………………………………………………………………….51
Appendices…………………………………………………………………………..53 Appendix A: Interview Questions Appendix B: Data Quality Assessment Survey List of Tables & Figures
Figure 1. Data Quality Evaluation Criteria……………………….19 Table 1. Title and TITLE KEY Composition….……..…………..28 Table 2. Sample Bibliographic Record………………..………….36 Table 3. Sample Order Record……………..……………………..36 Table 4. Data Integrity………………..………………….………...44 Table 5. Data Accessibility……..…………………...………....…...45 Table 6. Data Interpretability..…..………………………………..46 Table 7. Relevance…..……………………………………………...46 Table 8. Others….…………………………………………….…....47
3
Introduction
In this information age, the combination of large databases, the Internet and
complex communication networks significantly changes the way organizations
operate. Corporations invest heavily in information technology to improve efficiency,
to assist decision-making and planning, and to enhance service quality. However,
advanced technology alone does not promise the success of a business. High quality
information is also necessary to enhance the competitiveness of a business. As
Redman stated, “If information technologies are the engines of the Information Age,
then data and information are the fuels”(Redman, 2001, xiii). The wealth of
information is a double-edged sword. High quality information benefits firms,
whereas poor quality information hurts them (Huang, Lee and Wang, 1999, 4). But
how do we define the quality of information? A widely adopted concept is
information fitness for use. It emphasizes the importance of taking a consumer
viewpoint of quality because ultimately it is the consumer who will judge whether a
product is fit for use or not (Huang et al., 1999, 42). Garvin stresses the importance by
stating, “One thing is certain: high quality means pleasing the consumer, not just
protecting them from annoyances” (Garvin, 1987, 104). On the other hand, the impact
of poor data quality (DQ) can hardly be overlooked. According to Redman, the
4
estimated cost of poor DQ is at least two percent of revenue, which does not include
the invisible loss of corporations’ reputation and customers’ satisfaction (Redman,
2001, 17). Impacts can also include operational inconvenience, poor decision making,
and in extreme cases, business closings.
For non-profit organizations, like universities and libraries, the importance of
DQ cannot be overstated as well. High quality information not only helps them make
sound decisions, but also adds value to the services they provide. In a library, for
instance, a reliable online catalogue system helps users find the resources they need. It
also helps the library staff monitor the usage of resources more accurately. On the
other hand, an error-filled catalogue system not only disappoints users, but also adds
burdens to the staff, such as extra work to clean up dirty data.
Information quality issues are increasingly evident, especially in
information-intensive organizations like libraries. Conventionally, people pay more
attention to database hardware and software and apply various control techniques,
such as database integrity constraints, to improve data quality. However, Huang et al.
argued that databases actually exist in a larger context of information systems, which
covers “the organizational processes, procedures, and roles employed in collecting,
processing, distributing and using data”(Huang et al., 1999, 44). The purpose of this
study is to examine how contextual factors affect data quality by investigating the

5
acquisition operation of the East Asian Resources unit in a graduate library in a large
public university in the southeast. This small-scale case study seeks to identify the
problems this unit is facing by analyzing the strengths and weaknesses of the system
itself and the accompanying operational procedures, and to seek opportunities for
improvement.
This paper is divided into six sections. The second section reviews the
literature, and defines DQ and its dimensions. The third section provides background
information about the acquisition process and the acquisition database system. The
fourth section describes the study methods, followed by a discussion of the results.
The paper closes with conclusions, and suggestions for future work.

6
Literature Review
In this section, I first review the development of DQ management, and then
discuss the definitions of data, information, quality and DQ. The most important
dimensions of DQ are defined by comparing three models proposed by Bovee,
Srivastava and Mak, Redman and Huang et al. The impacts of poor DQ are discussed
in the last part of this section.
Evolution of Data Quality Management:
“Garbage in, garbage out” has existed as a saying for years, and the problems of
data quality have long been recognized in various disciplines. For instance, the justice
system has addressed the problems caused by poor-quality records in administrative
processes for years. A 1979 court ruling regarding the bail proceeding reflected the
pervasive problem of low-quality criminal records.
Plaintiffs are clearly and systematically being deprived of due process in violation of the Fourteenth Amendment to the U.S. Constitution, and the right of effective assistance of counsel as guaranteed by the Sixth Amendment, whenever rap sheets containing erroneous, ambiguous, or incomplete data with respect to prior arrests and dispositions are submitted to courts at arraignment sessions for use in connecting with bail determination. The Eighth Amendment right to reasonable bail is also thus denied…neither plaintiff nor their counsel is capable, as a practical matter, of correcting errors, resolving ambiguities, or supplying missing information to cure defects contained in rap sheets…the result is frequently the impositions of bails in amount exceeding those which would be set if complete and accurate information were available to the courts

7
(Tatum v. Rogers, 1979) (Laudon, 1986).
Such concerns for the accuracy and completeness of criminal-record information are reflected in federal regulations calling for complete records that “must contain information of any dispositions occurring within a state 90 days after the disposition has occurred” [to prevent disseminations of “arrest only” data] (Title 28, United States Code of Federal Regulations (U.S.C.)). These regulations also call for minimal errors in records, and procedures to ensure this result by a “process of data collection, entry, storage, and systematic audit that will minimize the possibility of recording and storing inaccurate information”(Title 28, U.S.C.) (Laudon, 1986).
DQ problems also drew attention in the military. A good example is the
“Logistics Information Requirements and Quality” project sponsored by the U.S.
Army in 1996, which examined data quality problems in Army logistics in hope of
better supporting decision-making (Galway and Hanks, 1996).
In the early 1990s, more systematic research regarding data quality was initiated
in the academic world. In 1991, Mark Hansen published his master’s thesis, "Zero
Defect Data: Tackling the Corporate Data Quality Problem" (Hansen, 1991). In the
same year, Dr. Richard Wang established the Total Data Quality Management (TDQM)
program at MIT. Tom Redman was writing his first book Data Quality: Management
and Technology and published it in 1992 (Redman, 1992). Larry English picked up
Edward Deming’s 14 Points of Quality and came up with a formalized methodology
called TQdM (Total Quality Data Management) (English 2001).
The explosive increase in computer networking had given people access to a
much wider array of databases, leading to an increased awareness that much of the
8
available data was of questionable if not poor quality. This was highlighted by DQ
studies as I mentioned earlier. In the corporate world, driven by strong competitive
pressures, data began to be seen as a key asset to be managed. A statement made by R.
Jeffery Canter, the executive vice president of operations for Innovative Systems,
stressed how critical quality data is for businesses.
Data quality is really the only truly unique asset that a company has. A company can have products, but those products can be and are regularly copied. A company can distinguish itself by its service, but its service is highly reliant upon good data. Data is very strategic, because it's used for both internal and external decision-making. You need that high degree of reliability from and high degree of confidence in your data because it impacts your operation capabilities on a day-to-day basis. (Hubley, 2001)
Definitions of Data Quality
Data versus Information
In literature there are multiple views regarding the definition of data, such as raw
materials for information, or a set of facts. Since data in this study involves a
computerized database, and such data are of greatest importance in quality control, the
definition used by the database community is appropriate for this study. Elmasri and
Navathe, the authors of Fundamentals of Database Systems defined data as “facts that
can be recorded and that have implicit meaning”(2000, 4). A database is further
described as “a logically coherent collection of data with some inherent meaning”
(Elmasri and Navathe, 2000, 4). In defining a database, a data model is used to
describe the structure of the database. The structure of database refers to “the data
9
types, relationships and constraints that should hold on the data” (Elmasri and
Navathe, 2000, 24). Redman adopted this view and defined data as consisting of two
interrelated components, “data models” and “data values.” Data models define what
the data are all about, and different models reflect different aspects of the real world.
A data model involves entities, attributes and relationships. An entity represents a
real-world object or abstraction such as employee, customers or products. Attributes
and relationships describe pertinent features of the entities (Redman, 2001). For
instance, when one describes the entity “book”, its attributes may include title, author,
publisher and number of pages. “Data values” are assigned to attributes in the data
model for specified entities (Redman, 2001, 71).
As for information, it is so intertwined with data that even some researchers,
such as Wang et al., viewed them as synonyms and use data and information
interchangeably (Wang, Ziad and Lee, 2001). From an information professional’s
perspective, the distinction between data and information can be as follows: “data or
data elements, are specific entries in a database or an information system (usually
electronic, but also paper-based); information is the combining of different pieces of
data to produce new quantities that provide insight into the processes producing data”
(Galway and Hanks, 1996, 2). Based on the distinction above, information is viewed
as a derivative of data in this paper.
10
Quality
Traditionally the term “quality” is used in relation to products and people; in
more recent definitions, like the one from ISO 8402, it becomes clear that it can also
be related to services and processes.
The ISO 8402 definition for quality is:
The totality of features and characteristics of a product, process or service that bear on its ability to satisfy stated or implicit needs (ISO 8402).
Just as with products and services, data are produced by a process, and the
quality of data is determined in that process. Hence, control of the quality of data can
be exercised by monitoring the production process. Another important aspect to assess
quality of data is whether or not it satisfies stated or implicit needs.
Data Quality
In DQ literature, a widely accepted way of defining DQ is “fitness for use”.
Based on this concept, researchers have developed different models to assess data
quality. In this study, I focus on the model proposed by Bovee et al. and compare it to
two models proposed by Redman and Huang et al. Bovee et al. took the view of an
information user and proposed four simple main attributes: accessibility,
interpretability, relevance and integrity with underlying criteria (Bovee, Srivastava
and Mak, 2003). Redman’s approach, on the other hand, was more system-oriented in
analyzing DQ from the three aspects of data modeling, data values and data
11
representation (Redman, 1996). Huang et al. combined system and user perspectives
and developed four DQ categories including intrinsic DQ, contextual DQ,
representational DQ and accessibility DQ. Intrinsic DQ denotes that information has
quality in its own right. Contextual DQ highlights the requirement that DQ must
considered within the context of the task at hand. Representational DQ and
accessibility DQ emphasize the importance of the role of systems (Huang et al., 1999,
43).
Dimensions of Data Quality
Accessibility
In the view of Bovee et al., the prerequisite attribute for DQ is accessibility. They
considered that if data are “inaccessible, all other qualities of it are irrelevant” (Bovee
et al., 2003, 56). They also pointed out that retrieving data “may require a certain
amount of time or have an associated measure of cost to the user” (Bovee et al., 2003,
56). One good example is that a university library needs to pay license fees to
publishers to acquire access to electronic versions of various academic journals.
Redman did not include accessibility in his model, but Huang et al. identified five
concerns regarding data accessibility, including technical problems, security,
interpretability and understandability, concise and consistent representation and the
amount of data. The first two concerns have direct impact on accessibility. For
12
instance, a failed server makes data entirely inaccessible, and a password-protected
system makes data less accessible. The last three concerns are problems encountered
after users gain access to data and I will discuss these problems below.
Interpretability
When data is retrieved, we must understand it and “derive meaning from it”
Bovee et al. consider that data must be intelligible, capable of being understood by the
user, and meaningful, conveying to the user some sense, significance, or meaning.
They also indicated that data that are intelligible or meaningful to one user may not be
intelligible or meaningful to another (Bovee et al., 2003, 56). For instance, the library
I studied uses special codes to represent locations in the cataloguing system. Those
codes are understandable and meaningful for an experienced cataloguer, but not for a
novice. As Huang et al. said in their study, “the expertise required to interpret codes
becomes a barrier to accessibility” (Huang et al., 1999, 51). Redman considered
interpretability as a dimension of data representation and stressed that a format, a
mapping from data to a set of symbols, should help “the user interpret values
correctly.” One format is superior to another as long as “it is less likely to be
misinterpreted” (Redman, 1996, 262).
Relevance
Given that data is understandable, it needs to be relevant to the domain and
13
purpose of interest in a given context. Criteria regarding the domain and purpose of
interest are specific to the user and determine the desired information pieces (Bovee et
al., 2003, 57). They stressed that relevant data are required to be of an age appropriate
to its use. They used the term datedness to describe this criterion, but the term
seems to confuse their intention to stress the timeliness of data. They indicated that
datedness varies directly with its age and volatility. Age measures how long ago data
was recorded. The more recently the data was recorded, the less likely it is to be dated
and the more likely it is to be relevant (Bovee et al., 2003, 58). For instance, the latest
count of inventory will be more relevant than the previous one. Volatility of data is a
measure of information instability—the frequency of change of the value for an entity
attribute of interest (Bovee et al., 2003, 58). Stock prices that change moment to
moment are high volatility, while a book record is pretty stable, seldom to change or
become outdated. Their assumption, however, is not always valid. This criteria
doesn’t apply to some “permanent properties, such as DATE OF BIRTH and BLOOD
TYPE and historical records” as Redman indicated (Redman, 1996, 258). Redman
had more a comprehensive discussion about currency of data. He viewed data
currency to be pertinent to data values, and made distinction between permanent and
dynamic data. He pointed out that for dynamic data that change with time, “a lag
between the time of a data value changes and its update in a database is inherent”
14
(Redman, 1996, 258). As a result, time-related changes can have an influence on data
accuracy. He defined that “a datum value is up-to-date if it is correct in spite of a
possible discrepancy caused by time-related changes to the correct value” (Redman,
1996, 258). Consider as an example the TITLE of a book stored in the library
acquisition database. If the book happens to be still unpublished, and the record in the
system is solely based on the vendor’s catalogue, it is highly possible that the data
about the book title will be outdated after the book is published with a different title.
In Redman’s discussion, relevance, on the other hand, is a criterion to assess the
quality of a data model, or a conceptual view. He considered that relevance of data
depends upon whether or not a conceptual view provides data needed by a specific
application (Redman, 1996, 247). For instance, when defining a database, we will
only include entities and attributes that meet users’ needs. However, users’ needs
evolve over time and the relevance problem may arise when data in the existing
conceptual view fails to reflect changing needs.
In their analysis, Huang et al. identified two problems that contribute to poor
data relevancy. One is data production failure that results in incomplete data and the
other is changing data consumers’ needs, which echoed what Redman discussed.
Integrity
Given access to interpretable, relevant data, Bovee et al. argued that it is required
15
to have integrity. In Bovee’s model, integrity consists of four subattributes: “accuracy,
completeness, consistency and existence”(Bovee et al., 2003, 58). They compared
their own model to the set of “intrinsic” DQ attributes proposed by Huang et al. In
that model, “accuracy”, “objectivity”, “reputation” and “believability” were included
to assess DQ. When Huang et al. discussed this set of DQ attributes, they actually
focused on the problems arising from data sources and data production rather than
data itself. For instance, they said mismatches among data and data source result in
questionable believability and poor reputation. They also said when judgment is
involved in the data production process, objectivity is questionable (Huang et al.,
1999, 48). Bovee et al. argued “credibility or reputation of an data source is evidence
attesting to data integrity, not an attribute, and may be evaluated without ever
examining the data itself”(Bovee et al., 2003, 59). In my opinion, believability and
reputation are what users perceive about data, and are not “intrinsic” to data. In this
study, therefore, I consider believability and reputation as “extrinsic” criteria by
which to evaluate DQ.
Bovee et al. also argued that system security—prevention of unauthorized data
access during storage and transmission—served as evidence integrity has been
maintained (Bovee et al., 2003). System security is less discussed in the DQ literature,
but it is an important concern especially when involving sensitive data, such as
16
financial or medical data. Since this study focuses on the acquisition operation in a
library, which involves financial data, system security will be included as an
evaluation criterion.
In Redman’s model, he identified four dimensions of data values pretty similar to
Bovee’s model: accuracy, completeness, currency and value consistency. I discussed
currency earlier, and the other three are discussed below.
By accuracy, Bovee et al. meant “being true or error free with respect to some
known, designated, or measured value” (Bovee et al., 2003, 59), while Redmen
defined it as “the nearness of the value v to some value v’ in the attribute domain,
which is considered as the correct one for the entity e and the attribute a” (Redman,
1996, 255). For example, consider an entity BOOK with ISBN as the attribute of
interest. We can compare the recording of a book’s ISBN number with the actual book
and determine the accuracy of the value.
Completeness refers to “having all required parts of an entity’s information
present” (Bovee et al., 2003, 60). This view echoes Redman’s discussion about
completeness of data values. Redman referred to completeness as “the degree to
which values are present in a data collection” (Redman, 1996, 256). He continued by
discussing assigning null value to an attribute. If an attribute is mandatory, a nonnull
value is expected (Redman, 1996). Once a null value appears in a required attribute,

17
the data is considered incomplete. For optional attributes, null values are acceptable,
but not necessarily indicative of the completeness of data. Consider an optional
attribute, CELL PHONE NUMBER of a CUSTOMER. It is possible that the customer
has a cell phone number that is not known, and the data is considered incomplete. If
the customer does not have a cell phone, the attribute is not applicable. In this case,
the data is considered complete. Huang et al. discussed incomplete data resulting from
operational problems, like data entry errors, and design failure, such as not including
desired attributes in a database.
Consistency of data requires that multiple recordings of the values for an entity’s
attribute(s) be the same or closely similar across time and space. These values must be
the same in all cases (for discrete values) or closely grouped in dispersion (for
continuous values) (Bovee et al., 2003). For instance, a patient’s gender as the discrete
value should be the same across the records of different departments of a hospital. For
data values that change over time, such as the amount of goods in an inventory system,
the change at a given time should correspond to the sales records. Inconsistency
occurs while there is serious discrepancy between the two values. Redman discussed
consistency in more detail, and one point he raised is that “attributes need not have the
same definition for their data values to conflict” (Redman, 1996, 259). An example he
gave is inconsistency between STATE and ZIP CODE in a person’s address. This kind
18
of problem can be avoided by enforcing constraints in the database management
system (DBMS). Redman mentioned that automated checking of constraints is an
useful tool to keep data consistent, but he also stressed that “it is not proper to assume
that data values are correct” (Redman, 1996, 266). For instance, a valid code for the
location of a department is not necessarily correct. Huang et al. also pointed out
problems with integrating data across distributed systems. For an inventory record, it
is possible that the price is recorded with decimal points in one department and
without in another. The conflict in data values arises because of different practice
among departments.
The fourth subattribute of integrity proposed by Bovee et al. is “existence,”
which they described as an important intrinsic attribute of information as used in
auditing. Data that meets tests of existence has no false or redundant entities, fields, or
attribute values (Bovee et al., 2003, 60). Examples of violating the existence example
include: “one or more records for patients that do not exist, duplicate records for
certain patients, fictitious values in certain fields” (Bovee et al., 2003, 60). Although
this subattribute is not explicitly included in the other two models, it partially
corresponds to the model developed by Huang et al. from the system perspective. In
this model, they mentioned the problems of data that cannot map back to the real
world and data wrongly mapped to the real world (Huang et al., 1999). According to
19
Huang et al. both problems usually results from “erroneous data entry or failure to
record changes in the real world” (Huang et al., 1999, 39).
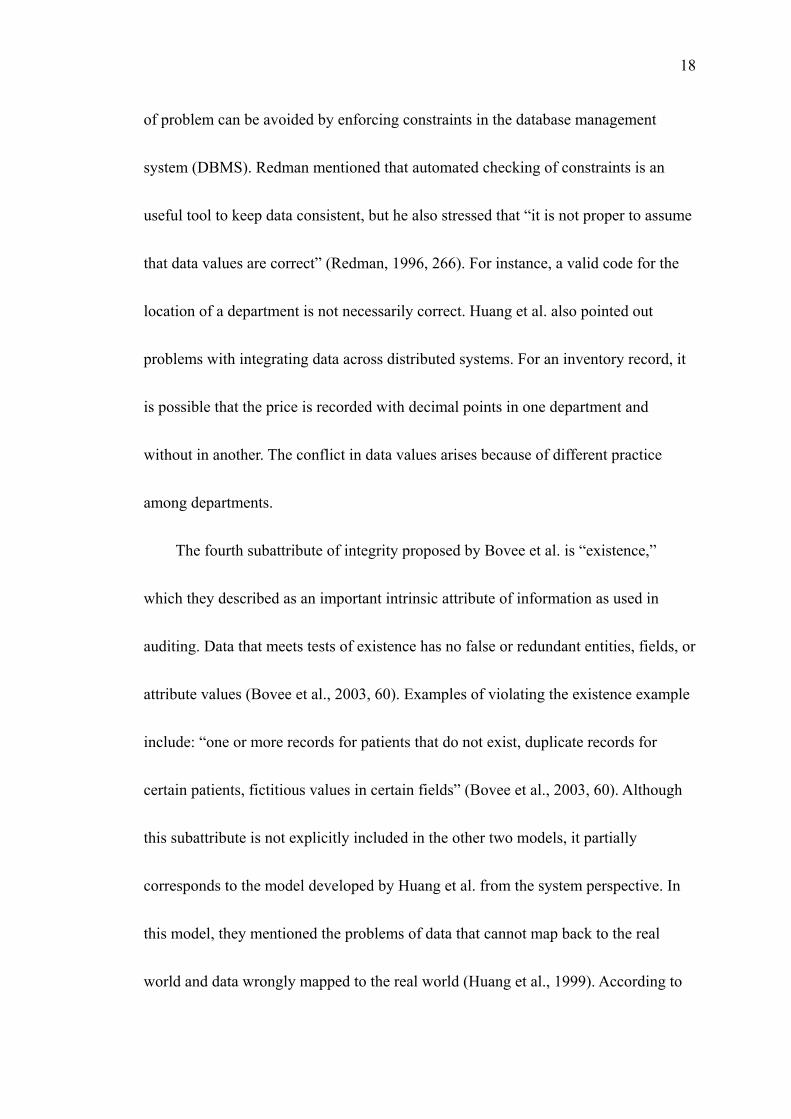
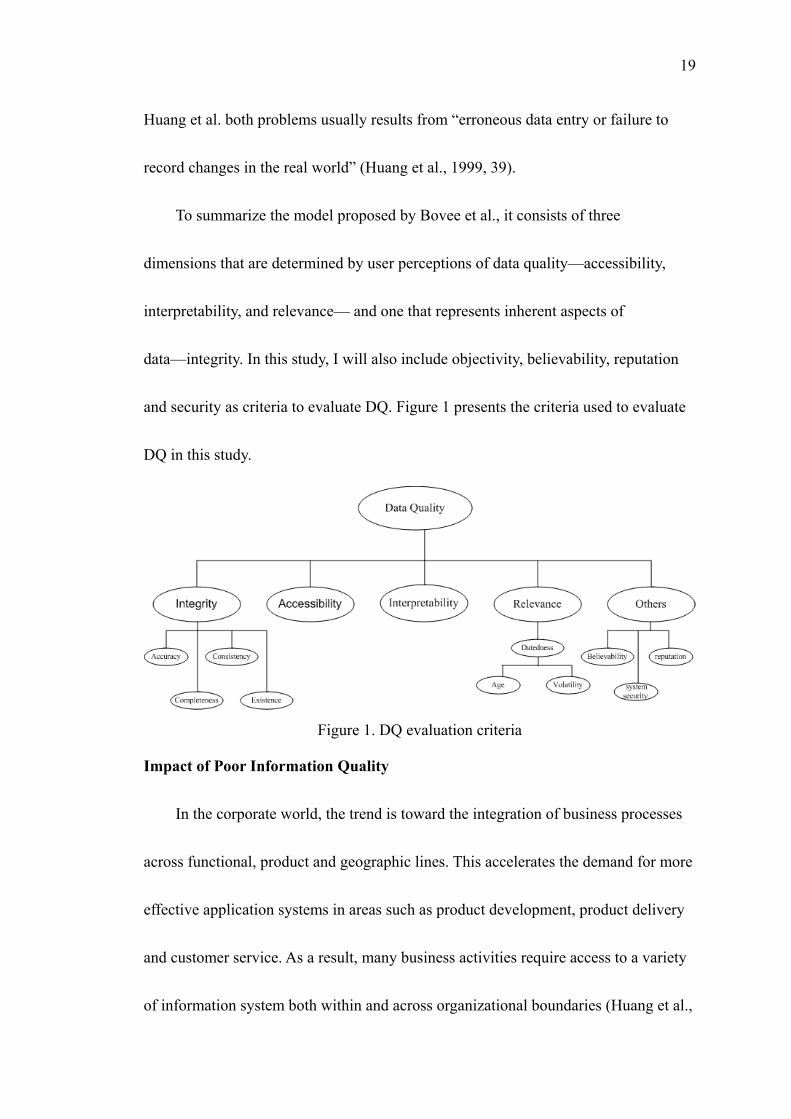
To summarize the model proposed by Bovee et al., it consists of three
dimensions that are determined by user perceptions of data quality—accessibility,
interpretability, and relevance— and one that represents inherent aspects of
data—integrity. In this study, I will also include objectivity, believability, reputation
and security as criteria to evaluate DQ. Figure 1 presents the criteria used to evaluate
DQ in this study.
Figure 1. DQ evaluation criteria
Impact of Poor Information Quality
In the corporate world, the trend is toward the integration of business processes
across functional, product and geographic lines. This accelerates the demand for more
effective application systems in areas such as product development, product delivery
and customer service. As a result, many business activities require access to a variety
of information system both within and across organizational boundaries (Huang et al.,
20
1999). However, these information systems may contain poor quality data that can
have significant impacts on business, or even on the greater community.
Business impacts:
• Lower Customer Satisfaction: Poor quality data may break customers’ trust in
a business. One good example is billing. All customers expect to be billed
properly and have relatively low tolerance to billing errors. Although billing
information is ancillary to the product or service provided, error will definitely
disappoint customers. The impact of poor DQ on customer relationships also
applies to non-profit organizations like a library. For instance, library users
will not be happy to be wrongfully charged for overdue books because of
problems with the circulation system. It is obvious that high levels of data
quality are important to successful customer relationships.
• Higher and Unnecessary Costs: One direct impact of poor quality data is the
loss of revenue due to operational costs to accommodate errors (Redman,
1996). I once watched two passengers being assigned to the same seat on a
trans-Pacific airplane. The flight attendant nervously apologized to the two
passengers and tried to find another seat on an almost full airplane. The
captain of the flight finally decided to provide one of the passengers a
first-class seat. If this kind of ticketing error often happens, it surely hurts the

21
revenue of an airline. In a library setting, incorrect cataloguing or acquisition
records may result in purchasing duplicate books.
• Lower Job Satisfaction and Organizational Mistrust: Poor data quality lowers
job satisfaction and adds work load to employees, and just as customers
mistrust companies that cannot get simple data correct, so too do internal
organizations learn to mistrust one another (Redman, 1996). For instance,
customer service people will be under heavy pressure if they constantly
receive customers’ complaints about billing errors. In contrast, quality data not
only improves customer service, customer satisfaction, and customer
relationships, it also enhances performance and increases internal productivity.
Therefore it is important to extend the scope of data quality from external
customer relationships to internal ones. High quality data can help boost
morale, and leads to progress in customer relationships and an increase in
profit margins.
• Impact on Decision Making: Quality information is the critical base for
decision-making processes and has significant impact on the bottom line. For
instance, some companies have a risk management system that monitors
various market risks. If data in the system are poor in quality, management
may unknowingly be exposed to major disasters resulting in great net loss. In a

22
library, the acquisition department may need to constantly monitor their
budget to adjust their acquisition plan accordingly. Incorrect information about
the budget status may seriously impact their decision making process.
Social impacts
Sensitive information gathered on individuals and organizations such as medical,
financial, and legal records influences people’s life in many ways. For instance, an
incorrect credit report can be more harmful to an individual than merely denial of
credit. Huang et al. cited an example that a man lost his job because he was wrongful
connected to a criminal record. Another example is a contact representative for the
Internal Revenue Service who had access to the IRS database of 200 million tax
records of businesses and individuals. He took unauthorized looks at returns of a
political opponent and a family adversary (Huang et al., 1999). These examples
suggest that organizations that create and use sensitive data need to ensure the
security of data as well as their accuracy.

23
Acquisitions in the East Asian Resources Unit
Procedures of monograph acquisition
This section provides an overview of the monograph acquisition procedures in
the library unit I studied, and the database system they use to process orders. The
library began collecting Chinese-language materials in the 1960s, and its collection
has grown to over 150,000 items and become the largest of its kind in Southeastern
United States. The collection also provides materials to support Japanese and Korean
studies. Currently, the annual budget for this division alone is about $100,000, and the
acquisitions include more than 3,100 volumes of books, hundreds of serials, and items
in microform, and films per year. Monograph acquisition is a major part of its
acquisitions, and the procedures include preliminary selection, pre-order search, enter
new order, order record review, place order, claim order and check in ordered books.
Management of such a huge collection of disparate materials is very challenging for
the rather small team in this division. The permanent staff includes a bibliographer, a
cataloguer and an acquisition manager. Many routine jobs are carried out by part-time
student assistants. The acquisition manager is in charge of processing acquisitions
after the bibliographer makes preliminary selections of what to purchase. The first

24
thing the unit needs to know is whether those selected books are already in the
collection or already ordered, to avoid duplicates. The other priority is to keep their
budget balanced—hence the unit monitors its budget on a daily basis and strives to
meet the target every year. Duplicate detection, however, is intertwined with many
contextual factors, which makes the problem harder to tackle, and I will discuss those
factors later. Below are procedures involved in the acquisition process.
Selection
This unit works with several established vendors, and receives paper based
catalogues periodically. A catalogue may contain information about dozens or scores
of newly published books. The bibliographer selects books from those catalogues
based on the collection development policy. Since it is a graduate library, the major
principle of collection development is to support research in the university.
Pre-order Search
Once the bibliographer made preliminary selections, the unit needs to avoid
purchasing duplicate books by searching against the cataloguing database, named
DRA, and the acquisition database, named INNOPAC. This task, known as pre-order
search, is usually carried out by student assistants who are familiar with the search
function of both systems. Since most book records catalogued prior to 1986 are still
kept as catalogue index cards, a student occasionally needs to check the index cards

25
for titles that were first published prior to 1986. In this way, the unit can avoid
purchasing old titles that are republished.
Key New Orders
Those titles without matches in both databases and paper index cards will be
input into the INNOPAC system. All the data about a particular title are manually
entered based on the information given by the vendor’s catalogue.
Order Record Review:
The acquisition manager reviews all the entered records to make sure data are
correct. Based on his experience, he is especially careful about some types of titles,
such as works by late well-known authors, classics or titles familiar to him. For those
suspicious titles, he double-checks both database systems as well as the paper index
cards.
Place Orders
For every order record, the system prints out two copies of the order slips, one to
send off to the vendor, and the other to be kept in the unit for records. Once an order
is placed, it takes two to four months for shipment.
Claim Orders
There are many cases where the ordered books are out of stock, or even not
published yet, which delays the whole acquisition process. For open (unfilled) orders,
26
a four-month claim cycle is set up in the system to generate claims automatically.
Claims are sent to vendors to remind them to ship ordered books as soon as they can.
The unit will usually claim twice and wait for up to nine to ten months before
canceling an order. Once an order is canceled, the money earmarked for that particular
order will be released, and the unit can use the money for other orders.
Check-in
When new shipments arrive, the acquisition manager will start the check-in
process by searching the INNOPAC system to verify the orders, retrieve the order
numbers and find the corresponding order slips. The manager will carefully compare
the bibliographic record with the actual book and make any necessary modifications
to the bibliographic record in the system. Once all the information is verified, the
manager will put the received date on the record and the order slip and finish the
check-in procedure.
Exchange & Gift Books
This library exchanges books and serials with its partner libraries and also
receives gift books from various organizations and individuals from time to time. All
the information about these books must also be entered into the acquisition database,
but the process is slightly different. Since the books are already in hand, more specific
information about them can be entered into the system, including titles, authors,

27
pagination, dimension, publishers, and publishing and received dates. The acquisition
manager also reviews all those records, prints out order slips and places each slip in
the corresponding book.
The INNOPAC System
The library started to use the INNOPAC system to process acquisitions in 1991,
and it was a major leap from the old paper-based operation to an automated one. The
system in use only includes the acquisitions and serials check-in modules, and
acquisitions mainly involve monographs, gifts and exchanges. INNOPAC provides for
several kinds of records, of which the library uses only three: Bibliographic records,
Order records, and Serials Check-in records. A Bibliographic record can exist on the
system by itself, but neither an Order record nor a Check-in record can. The latter two
must be attached to a Bibliographic record. In other words, no Order or Check-in
Record can be created without first creating or finding a Bibliographic record to
which it can be attached. Each record is made up of fixed-length fields and
variable-length fields. Values for fixed-length fields can be customized according to
the user’s needs. The system interface is menu-driven, but new users need some
training before using the system.
As for duplicate detection, INNOPAC handles it in two different ways. If a user
is searching the TITLE field in the Searching function, the system searches the Title

28
Index and will display any near matches it finds if no exact match is found. According
to the user’s manual, in processing a search, INNOPAC ignores differences of
capitalization and all apostrophes. If he or she is in the “KEYing new records”
function, INNOPAC will find only exact duplicates, not any near matches. Therefore
the INNOPAC user’s guide suggests that thorough duplicate checking should be done
prior to ordering in the Searching function (MacDonald, 1991). When a TITLE field
is created, the system creates a TITLE KEY consisting of the first letter of each of the
first 7 indexed words excluding initial words “a,” “an” and “the”. For instance, if
somebody made a data entry error by typing ”The Rise and Wall of the Roman
Empire” rather than “The Rise and Fall of the Roman Empire”, the title key would be
different, and the duplicate would never be found. It also treats colon “:”, semicolon
“;” and space-slash “ /” as stop characters. Any part of a title after the stop characters
is considered to be a subtitle and is not included in the key. If there are fewer than 7
indexed words in the TITLE, it takes as many letters from the last word as it needs to
add up to 7. Table 1 shows examples of TITLE KEY composition given by the
INNOPAC user’s manual.
Table 1. Title and TITLE KEY composition Title Title Key
Rise and fall of the Roman Empire rafotre Gone with the wind gwtwind War within: from Victorian to modern wwithin

29
In the unit, students are trained to use the INNOPAC system based on their roles.
Most know one or two of the following INNOPAC functions: Search, Key New
Records and Update Records. Training is rather informal. The acquisition manager or
a more experienced student will walk through the process with a new student once or
twice. The student then learns by observation.

30
Methodology
In the earlier section, I mentioned that duplicate detection is a major task in the
monograph acquisition process and it is also an important factor by which to assess
the effectiveness of acquisition operation. Given the very limited budget, the unit
strives to avoid the purchase of duplicate books, and it is not an easy task. There are
many possible circumstantial factors that affect how well duplicate detection can be
done, and I would like to focus on the DQ issues the unit is facing in the acquisition
process. I conducted interviews with the unit head, the acquisition manager and two
students who were involved in the monograph acquisition. They also filled out a brief
questionnaire to express their opinions about the database system used for the
acquisition operation. I also interviewed the system administrator to better understand
how the system operation affects DQ.
Procedures
Understanding the database system in use
In order to better understand various features and functions of the system, I
collected the user’s guide and the INNOPAC annual reports for recent years. Features
regarding DQ control were the focus of my examination, such as validation of fixed

31
field codes, duplicate detection and search processing.
Interviews with major stakeholders
Major stakeholders were divided into three groups: the data producers who collect
or enter data, the data custodians who design, develop, or maintain the data and
system infrastructure and the consumers who use data in their work. Students and
staff who are responsible for data entry can be categorized as data producers. The
system administrator is the data custodian. Data customers include the unit head, staff
and students who search the database for various purposes such as duplication
detection and record update. All the interviews took place in the workplace, and were
tape recorded with the permission of the participants. The unit head, acquisition
manager and students also answered a brief questionnaire on data quality and related
issues following their interviews.
Artifact Collection
Copies of various artifacts, such as vendors’ catalog and sample order slips, were
collected as supporting evidence for the study.
Participants
The focus of this study was monograph acquisition, so only staff and students
who were involved in the process were included. Since I once worked for the unit, I
had the chance to talk to each staff and student in person about my study, and they all
32
agreed to participate. Although the system administrator is not directly involved in the
process, he plays a crucial role in the system maintenance and operation. I contacted
him via email and arranged an interview for this study.
Interview Framework & Questionnaire Design
Different question sets were designed for each group of interviewees. The
interview questions are shown in Appendix A. For data producers and customers, the
questions were aimed at discovering their role in the process, their frequently
performed tasks, their experiences and interactions with the system and problems they
encountered. Additional questions also came up in the course of the interview.
The questions for the data custodian, or the system administrator, were more
technically oriented. The interview aimed at finding out how the system was
customized to meet the needs of this library, what settings were important to control
DQ and what limitations the system had regarding DQ.
The questionnaire was used as a supporting tool to find out the participants’
perceptions about the system. Based on the DQ evaluation model proposed by Bovee
et al., accessibility, interpretability, relevance and integrity of data were assessed.
Twelve questions covered every aspect of DQ issues in the model, and participants
were asked to rate each question on a six-point scale ranging from 0 (not at all) to 5
(completely). The questionnaire is shown in Appendix B.
33
Data Analysis Method
The collected data were analyzed qualitatively and quantitatively. Findings from
interviews were analyzed from both the information system perspective and the
information customer perspective by using the DQ evaluation model discussed in the
literature review section. For each question in the questionnaire, the distribution of
responses is presented to capture data customers’ view to the DQ of the system in
question. By combining the results of qualitative and quantitative analysis, I was able
to discover strengths and weaknesses of the system, identify problems in the process,
and make recommendations for improving DQ in the acquisition process.

34
Results and Discussion
In this section, I first give more detailed descriptions about the participants
regarding their roles in the process and their experiences with the system. I continue
to discuss the features of the system relative to DQ from both the information system
perspective and the information consumer perspective. Problems in the information
production process are identified based on users’ interviews. Finally,
recommendations for future improvement are proposed.
Participant Profile
I interviewed the unit head, the acquisition manager in the unit, two students and
the system administrator. Their roles in the process and experiences with the system
vary. The two students only used the most basic search, data entry and update
functions and had four to six month experience and very limited knowledge about the
system. The unit head and the manager have each worked with INNOPAC for more
than five years, and are very familiar with various functions of the system. The system
administrator, on the other hand, has managed the system since it was implemented in
1991, and has abundant knowledge about how the system works, its development and
its strengths and weaknesses. Based on their roles and experiences, users may have

35
different points of view from the system administrator regarding the system. For
instance, the current setting of the INNOPAC system does not support displaying
Chinese, Korean and Japanese (CJK) characters, which makes acquisition records
harder to interpret from user’s viewpoint. The system administrator, however, pointed
out that this decision is based on the volume of orders. The number of annual orders
from this unit is only 0.5% of the total library orders, and the library administration
considered that the benefit of buying the license for supporting the CJK characters
was not worth the cost. This is an example of the importance of understanding both
the data consumer’s perspective and the data custodian’s perspective in analyzing DQ
issues.
Features related to DQ in the INNOPAC system
The system administrator pointed out two major features that help better control
DQ of the records in the system. I also checked the system control mechanisms in the
user manual to get a more comprehensive view of how DQ relates to system operation.
My findings are discussed below.
Key-in Templates
According to the system administrator, one way that the system controls DQ is to
use key-in templates. By key-in templates, he referred to reserved fixed fields that can
be filled by only one code drawn from a list of pre-established codes. The system
36
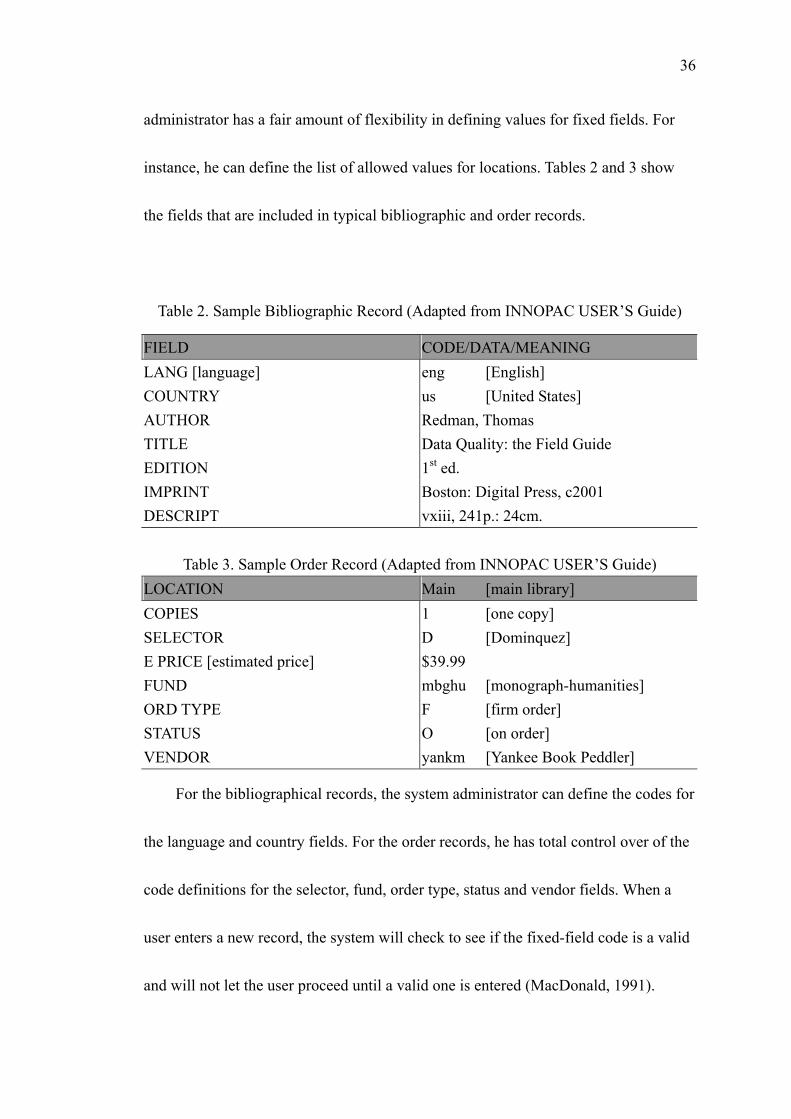
administrator has a fair amount of flexibility in defining values for fixed fields. For
instance, he can define the list of allowed values for locations. Tables 2 and 3 show
the fields that are included in typical bibliographic and order records.
Table 2. Sample Bibliographic Record (Adapted from INNOPAC USER’S Guide)
FIELD CODE/DATA/MEANING LANG [language] eng [English] COUNTRY us [United States] AUTHOR Redman, Thomas TITLE Data Quality: the Field Guide EDITION 1st ed. IMPRINT Boston: Digital Press, c2001 DESCRIPT vxiii, 241p.: 24cm.
Table 3. Sample Order Record (Adapted from INNOPAC USER’S Guide)
LOCATION Main [main library] COPIES 1 [one copy] SELECTOR D [Dominquez] E PRICE [estimated price] $39.99 FUND mbghu [monograph-humanities] ORD TYPE F [firm order] STATUS O [on order] VENDOR yankm [Yankee Book Peddler]
For the bibliographical records, the system administrator can define the codes for
the language and country fields. For the order records, he has total control over of the
code definitions for the selector, fund, order type, status and vendor fields. When a
user enters a new record, the system will check to see if the fixed-field code is a valid
and will not let the user proceed until a valid one is entered (MacDonald, 1991).
37
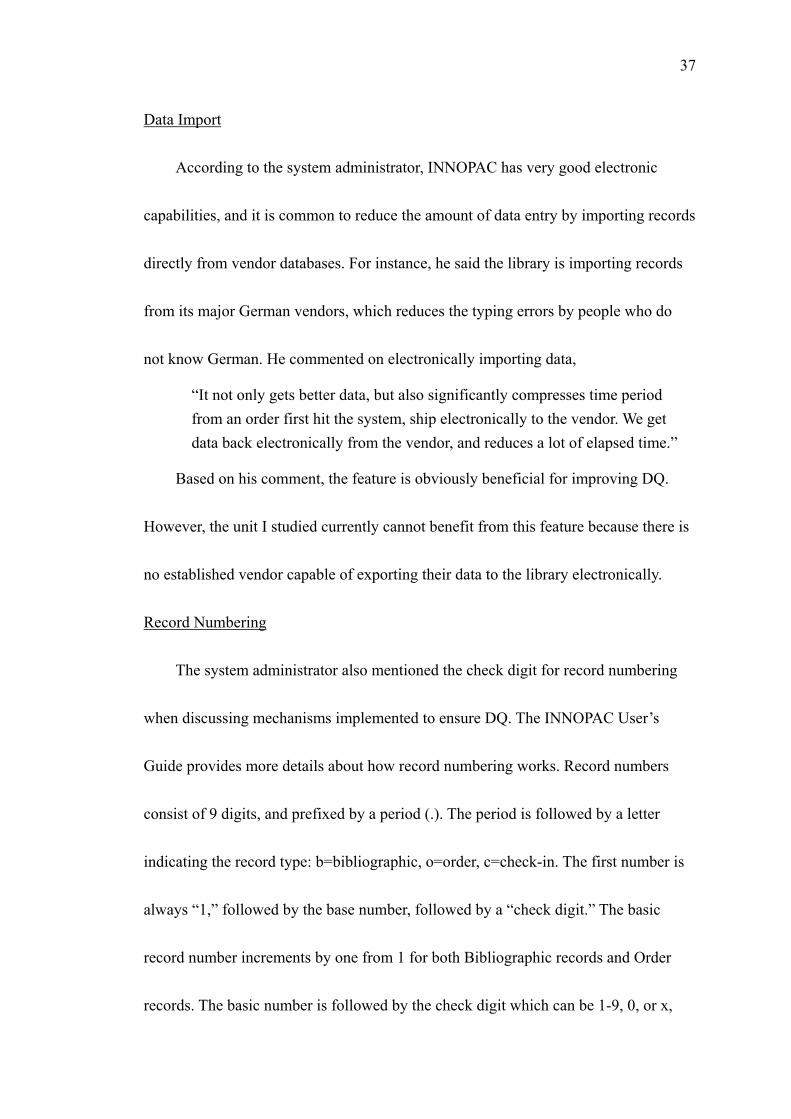
Data Import
According to the system administrator, INNOPAC has very good electronic
capabilities, and it is common to reduce the amount of data entry by importing records
directly from vendor databases. For instance, he said the library is importing records
from its major German vendors, which reduces the typing errors by people who do
not know German. He commented on electronically importing data,
“It not only gets better data, but also significantly compresses time period from an order first hit the system, ship electronically to the vendor. We get data back electronically from the vendor, and reduces a lot of elapsed time.”
Based on his comment, the feature is obviously beneficial for improving DQ.
However, the unit I studied currently cannot benefit from this feature because there is
no established vendor capable of exporting their data to the library electronically.
Record Numbering
The system administrator also mentioned the check digit for record numbering
when discussing mechanisms implemented to ensure DQ. The INNOPAC User’s
Guide provides more details about how record numbering works. Record numbers
consist of 9 digits, and prefixed by a period (.). The period is followed by a letter
indicating the record type: b=bibliographic, o=order, c=check-in. The first number is
always “1,” followed by the base number, followed by a “check digit.” The basic
record number increments by one from 1 for both Bibliographic records and Order
records. The basic number is followed by the check digit which can be 1-9, 0, or x,
38
and increments by the number 12. By incrementing by 12 from one new record to the
next, the program separates sequentially created records from each other. In this way,
the likelihood of mistakenly entering the wrong record number when searching by
record number can be reduced (MacDonald, 1991).
Reflection of business rules
How well a system reflects business rules in the real world is an important
underlying aspect of information quality. If a system fails to apply business rules in its
schema or processes, completeness of information will be affected. One example of
implementation of business rules in the INNOPAC system is claiming. The system
administrator sets up claim cycles based on users’ requirements. In the unit I studied,
he entered the rule for a four-month cycle. Once an order is placed, the system then
applies the rule to the record and checks later if that record is eligible to be claimed.
An eligible record will be presented to the acquisition manager to decide whether to
claim or not.
Limitations of the System
There are some aspects in the system that may hinder the interpretation and
manipulation of information, and I discuss the limitations of the system below.
39
Complexity of manipulation
The user interface of the system is menu-driven and text-based, and to find the
way through INNOPAC, a user has to read the screen to find out what he/she is
allowed to do next. The process could be pretty tedious especially when a user has to
go through a long list of options and several layers of menus.
Another thing that frustrates users is the difficulty of making corrections in fields.
For instance, if a user accidentally hits the “Enter” key before finishing data entry for
a field, he/she cannot go back directly to the field to make modifications. The user
cannot modify fields until he/she finishes entering all the fields of a new record. Each
field in INNOPAC is numbered, and to edit a field, a user has to access it by keying
its number at the prompt; a new prompt then appears. To replace codes in fixed fields,
the user just keys the new code after the prompt. To correct a variable field, the user
can either retype the whole field or copy the correct part from that field, paste it after
the prompt, and type the rest of the field. Problems may arise when people make
minor mistakes in one or two fields. Accuracy of data may suffer because of the
difficulty of editing.
Display of Ideographic Characters
One major problem of the system is that it does not support the display of
ideographic characters of Chinese, Japanese and Korean, which adds difficulties
40
interpretation of data, especially for the TITLE field. The system only contains
Romanized characters, and the unit currently mainly relies on comparing INNOPAC
records to the DRA and OCLC records to clarify some confusing titles.
System Security
According to the system administrator, INNOPAC does not check the strength
and length of passwords. In other words, the system does not enforce strong
passwords, which may result in security problems especially concerning financial
information. Right now the library accommodates the problem by manually expiring
passwords as well as reviewing authorization levels every six months. People have to
maintain two sets of passwords: one to get access to the system and the other that
controls what part of the system they are authorized to use. Users who are less aware
of security problems may unintentionally distribute their authorization password,
which adds possibilities of unauthorized access to the system and exposes data to
various threats.
Authority control
Since the library does not use INNOPAC for cataloguing, there is no authority
control in the system, which may result in less control over the accuracy of data. For
instance, for the author field, there is no mechanism in the system to check if the
spelling of an author’s name is correct. If a user searches the database to retrieve all

41
the titles by the same author, some titles could be missed if the author’s name was
misspelled in those records.
Deficiencies in the Data Production Process
A database does not exist in a vacuum, and data quality in the system will be
affected by many circumstantial factors. In other words, some aspects of DQ are
beyond the system’s control; the context in which an information system exists also
needs to be taken into consideration. Below are major problems the users in the unit
encounter when they process information for monograph acquisition.
Dirty Bibliographic Data
Bibliographic data in INNOPAC are considered less authoritative than the
cataloguing system for several reasons. The bibliographic data in the INNOPAC
system are not in the standard USMARC21 format, and cannot be exported and
reused by the cataloguing system. The data are used only for acquisition purposes
with no other added values, which results in less effort being made to maintain the
data quality. The currency of the data is also in question. What a publisher puts in a
catalogue as a title three months before a book is published is not necessarily what the
title is on the day the book is published. Duplication problems occur when the library
identifies and orders monographs too early. Sometimes the library orders a book with
the title in the catalogue, and orders the same book again under the published title and

42
does not realize the problem until a cataloguer actually processes the book and adds it
into the cataloguing database. The information in a bibliographic record can be only
as good as the information that the vendor’s catalogue provides. In many cases, the
information is incomplete, especially for books before publication, which adds
confusion to duplicate detection.
In addition, people often have a hard time to making the distinction between the
main title and subtitle, and that will affect the composition of the Title Key while
searching. Since human judgment is involved, the data is less objective and adds
complexity to the problem.
Data Entry Error
There is no mechanism to eliminate typing errors in the system. Especially in the
unit I studied, data entry people have to Romanize Chinese characters, which adds to
the possibility for errors. For instance, errors may occur because of confusion with
pronunciations for certain characters. Romanization of proper nouns in Chinese by
using the Pinyin system has special rules to follow, and confusion with the rules can
also introduce errors. Although the unit no longer uses Wade-Giles to enter new
records, people still use it to do pre-order search. It is possible that they mix up the
two systems when doing search by using both Wade-Giles and Pinyin systems. For
instance, in Wade-Giles, the pronunciation for “j” is equivalent to “r”, so “jih” is

43
actually pronounced as “ri.” In Pinyin, “ri” is pronounced as it is spelled. A student
can easily slip up by typing “r” instead of “j” when searching with Wade-Giles. Since
the Title Key is made up using first letter, matching records can be missed.
Pinyin Conversion
The Library of Congress, and the American Library Association (ALA-LC),
replaced the Wade-Giles system with the Pinyin system for Chinese Romanization in
October 2001, and the library followed suit to convert all the records regarding
Chinese publications into Pinyin in both DRA and INNOPAC systems. The unit
converted the records in DRA automatically, and converted INNOPAC records
manually. No matter what manner of conversion, it all created lots of incorrect data in
the system. A major difficulty of conversion was that the original records in
Wade-Giles often missed the diacritics that distinguish aspirated consonants from
unaspirated ones. For instance, if the original record spells “Tai-wan” instead of
“T’ai-wan”, “Tai” would be converted incorrectly as “Dai” by machine. The same
difficulty also arises when converting records manually. In addition, the same sound
in different tones indicate several different words in Chinese, and it adds confusion
when converting records. In the INNOPAC case, since there is no Chinese display,
people had to convert each record based on guessing what the original record
represented. The principles of joining syllables of forenames and geographic terms

44
further introduces ambiguity to data processing and adds complexity to the problem.
Survey Results Analysis
The tables in this section list the questionnaire items grouped by the DQ criteria.
Four questionnaires were collected for this study, and I present the distribution of the
responses to better capture individual participants’ view of the system. The possible
range of the responses is from 0 (not at all) to 5 (completely). Note that the items
listed in the following tables are worded exactly as they appeared in the questionnaire
(see Appendix B).
Table 4. Data Integrity
Item 0 1 2 3 4 5 Data in the system are accurate. 0 0 0 2 2 0 All necessary data are included. 0 0 1 0 2 1 Data in the system are complete. 0 0 0 2 1 1
In the definition, accuracy refers to “being true or error free with respect to some
known, designated, or measured value”(Bovee et al., 2003, 59). In the view of the
participants, data accuracy in the system is in the acceptable range. Based on what I
found in the interviews, inaccurate data can be the result of data entry error,
inaccurate data sources, and mistakes due to Pinyin conversion. The second question
asked the participants if the database schema includes all necessary entities and
attributes that make data complete. Three out of four participants thought that the

45
schema meets their needs. Within that schema, however, data in each record is not
necessarily complete. From participants’ responses, I found an interesting contrast
between data customers and data producers regarding their viewpoints towards data
completeness. As data customers, the unit head and the acquisition manager
considered the data could be more complete than it is currently to better meet their
needs while students who are responsible for data entry and pre-order search seemed
to be satisfied with the current level of data completeness.
Table 5. Data Accessibility
Item 0 1 2 3 4 5 Information can be easily retrieved. 0 0 0 1 3 0 This system is easy to manipulate to meet your needs. 0 0 1 2 1 0
To make data more accessible, the “Search” function plays a key role, and with a
strong search function, data can be retrieved more easily. INNOPAC provides several
options to do search, including “Title”, “Author”, “ISBN”, “Order Number” and
“Bibliographic Number.” Taking “Title” search for instance, even though a user
cannot find a matching record, he/she can still examine the displayed near matches for
further confirmation. Three out of four participants agreed that the INNOPAC
“Search” function works well. Although ease of manipulation was not explicitly
mentioned in literature, it is an important aspect of system design to allow data more
accessible for users. Participants’ view about ease of manipulation of INNOPAC is
around neutral.
46
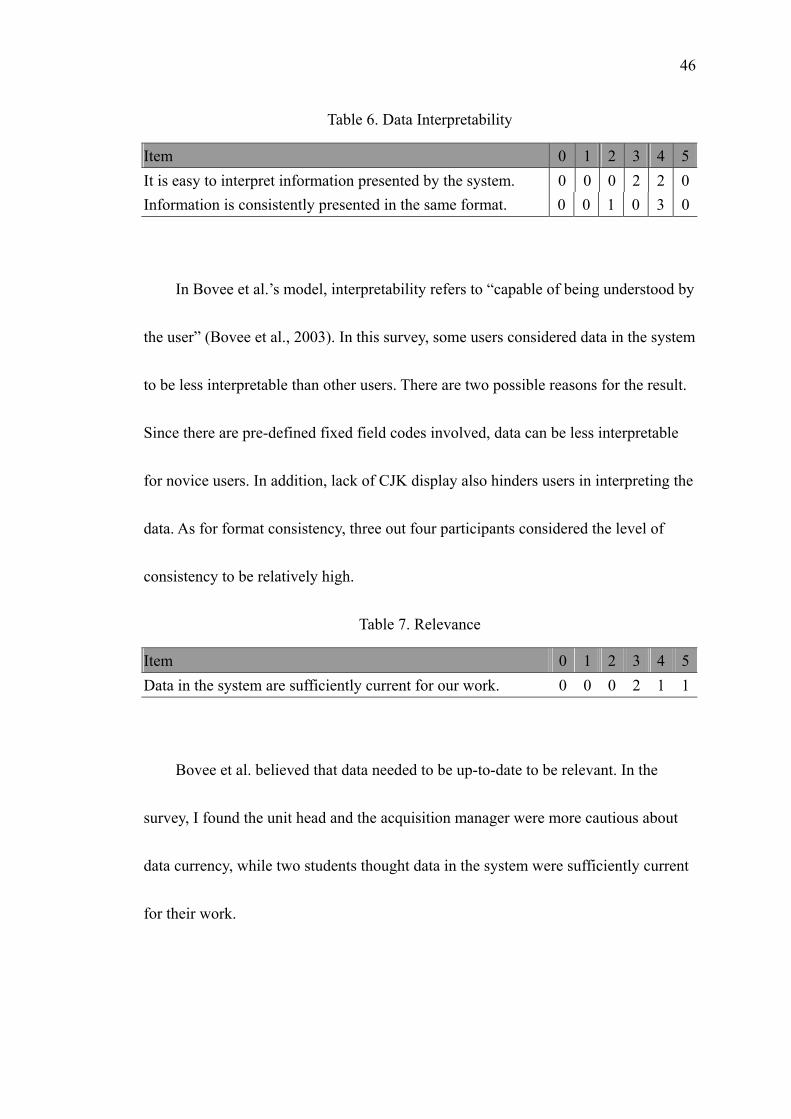
Table 6. Data Interpretability
Item 0 1 2 3 4 5 It is easy to interpret information presented by the system. 0 0 0 2 2 0 Information is consistently presented in the same format. 0 0 1 0 3 0
In Bovee et al.’s model, interpretability refers to “capable of being understood by
the user” (Bovee et al., 2003). In this survey, some users considered data in the system
to be less interpretable than other users. There are two possible reasons for the result.
Since there are pre-defined fixed field codes involved, data can be less interpretable
for novice users. In addition, lack of CJK display also hinders users in interpreting the
data. As for format consistency, three out four participants considered the level of
consistency to be relatively high.
Table 7. Relevance
Item 0 1 2 3 4 5Data in the system are sufficiently current for our work. 0 0 0 2 1 1
Bovee et al. believed that data needed to be up-to-date to be relevant. In the
survey, I found the unit head and the acquisition manager were more cautious about
data currency, while two students thought data in the system were sufficiently current
for their work.
47
Table 8. Others
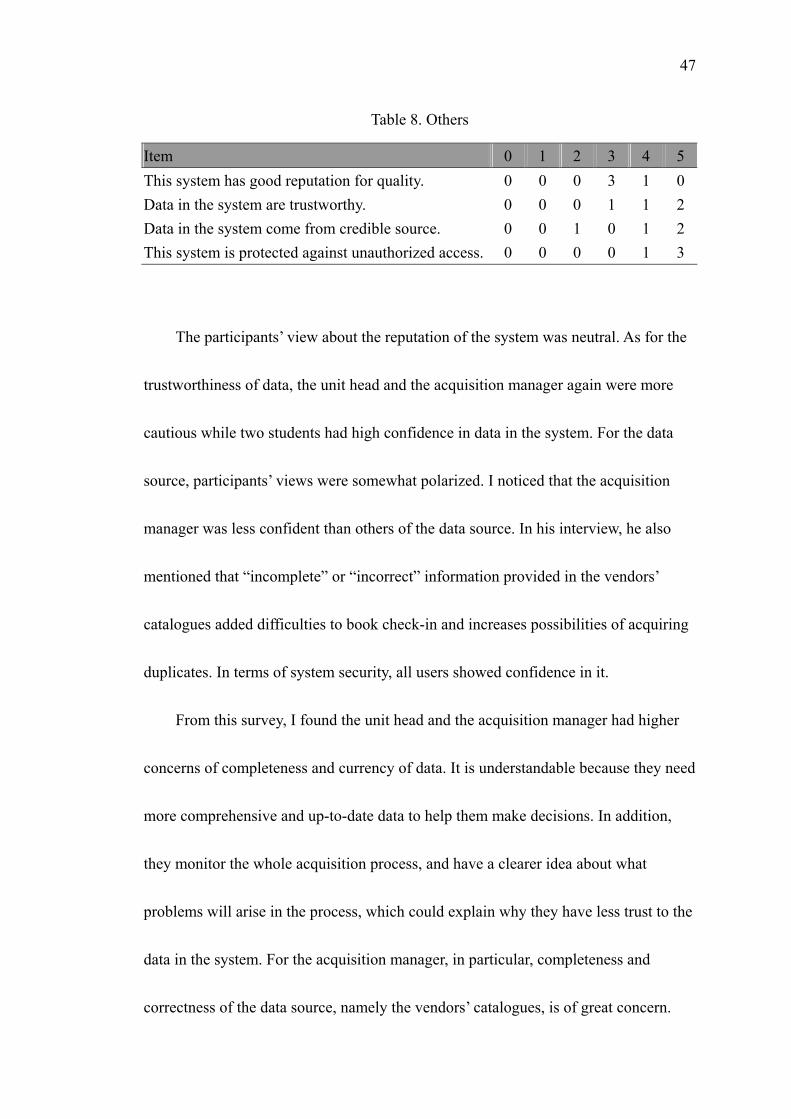
Item 0 1 2 3 4 5 This system has good reputation for quality. 0 0 0 3 1 0 Data in the system are trustworthy. 0 0 0 1 1 2 Data in the system come from credible source. 0 0 1 0 1 2 This system is protected against unauthorized access. 0 0 0 0 1 3
The participants’ view about the reputation of the system was neutral. As for the
trustworthiness of data, the unit head and the acquisition manager again were more
cautious while two students had high confidence in data in the system. For the data
source, participants’ views were somewhat polarized. I noticed that the acquisition
manager was less confident than others of the data source. In his interview, he also
mentioned that “incomplete” or “incorrect” information provided in the vendors’
catalogues added difficulties to book check-in and increases possibilities of acquiring
duplicates. In terms of system security, all users showed confidence in it.
From this survey, I found the unit head and the acquisition manager had higher
concerns of completeness and currency of data. It is understandable because they need
more comprehensive and up-to-date data to help them make decisions. In addition,
they monitor the whole acquisition process, and have a clearer idea about what
problems will arise in the process, which could explain why they have less trust to the
data in the system. For the acquisition manager, in particular, completeness and
correctness of the data source, namely the vendors’ catalogues, is of great concern.

48
What Data to Improve?
After discussing problems concerning monograph acquisition in the unit, the
challenges ahead are what can be done to improve the situation. There is no silver
bullet to solve information quality problems, but there are strategies that can be
applied to enhance information quality. First of all, we have to consider which data to
improve. It is impractical to improve all data at once. There are a number of
considerations in determining those data to pursue first. One consideration is
importance to the enterprise’s overall business strategy. Second is association with
known business problems. A third consideration is the current error rates and
requirements. The cost of poor data quality is another consideration (Redman, 1996).
In the case of this unit, one of the major goals of processing acquisition is to reduce
duplicates. Although they have little control over vendors’ catalogues, they have to
ensure bibliographic information in their own database. The group should develop
consensus on what fields are the most important ones to ensure high quality. One
obvious target, for instance, is the title field in a bibliographic record, because it is a
major entry point for search. Once the targets are identified, they can develop an
operational plan for improvement. There are several ideas worth pursuing.
Referencing Credible Source
Since vendors’ catalogues are less credible and more likely to change, it is

49
worthwhile checking a second source, like OCLC database, to enhance information
credibility when entering new records.
Establish a well-defined data production process
It is worthwhile developing a set of manuals that give detailed descriptions about
the purpose of each task, procedures involved and concerns regarding those
procedures. It is also a useful tool for the unit to stress their expectation of high
quality data. Taking pre-order search for instance, its major purpose is to detect
duplicates. The manual can include some basic cataloguing principles to help students
to distinguish subtitles from main titles. The students also should know how the
system detects duplicates so they can optimize their search accordingly. Those
manuals should be kept up-to-date.
Exception Handling
When handling some special cases, it is important to document what decisions
have been made and what procedures have been made in the system. For example,
vendors often just offer a part of a set of books, like only two volumes of a four-book
set. It is important to document which two volumes are purchased for future
reference.
50
Conclusion
In this case study, a wide range of DQ issues was covered, including accuracy,
currency, completeness, interpretability, accessibility and security. The investigation
into the INNOPAC system and the process of monograph acquisition in the library
unit revealed many circumstantial factors that impact DQ. In turn DQ affects the
effectiveness of the acquisition operation. As the system administrator said in the
interview:
“Every system in its design tends to have a model for how data should flow through it…. when you automate, you can look at why I am performing these steps. Rather than taking the individual steps and trying to see how the system can replicate the steps, looking at what the goal of those steps are, see how the automation system gives you to that goal and then look at how your work flow can sort of taking advantage of that rather than just reproducing paper steps on a screen.”
By learning the strengths and weaknesses of a system, identifying problems in
the workflow by studying the interactions between the system and the larger
organizational context, we have better chance to develop practical process control
plans that make the data production process less error prone, and meet the “fitness for
use” goal by producing high quality data.

51
References
Bovee, M., Rajendra, P.S., & Mak, B. (2003). A Conceptual Framework and Belief-Function Approach to Assessing Overall Information Quality. International Journal of Intelligent Systems, 18, 51-74.
Elmasri, R. & Navathe, S.B. (2000). Fundamentals of database systems (3rd edition).
Reading, MA: Addison-Wesley. English, L.P. (2001). 10 Years of Information Quality Advances: What Next? DM
Review. Retrieved April 7, 2003, from http://www.dmreview.com/master.cfm?NavID=198&EdID=3009
MacDonald, P. (1991). INNOPAC User’s Guide. Galway, L.A. & Hanks, C.H. (1996). Data quality problems in army logistics:
classification, examples, and solutions. Santa Monica, CA: RAND. Garvin, D.A. (1987). Competing on the Eight Dimensions of Quality. Harvard
Business Review, 65(6), 101-109. Hansen, M. (1991). Zero defect data: tackling the corporate data quality problem.
Thesis from MIT Sloan School of Management. Huang, K.T., Lee, Y. W. & Wang R.Y. (1999). Quality Information and Knowledge.
Upper Saddle River, NJ: Prentice Hall PTR. Hubley, J. (2001). Data Quality: The Foundation for Business Intelligence. Search
CRM. Retrieved April 30, 2003, from http://searchcrm.techtarget.com/qna/0,289202,sid11_gci754429,00.html
International Standards Organization (ISO) 8402. (1994). Quality Management and
Quality Assurance.
52
Laudon, K.C. (1986). Data Quality and Due Process in Large Interorganizational Record Systems. Communications of the ACM, 29(1), 4-11.
Redman, T.C. (1992). Data quality: management and technology. New York: Bantam
Double Day Dell. . Redman, T.C. (1996). Data quality for the information age. Boston, MA: Artech
House. Redman, T.C. (2001). Data quality: the field guide. Boston, MA: Digital Press. Strong, D.M., Lee Y.W. & Wang, R.Y. (1997). Data Quality in Context.
Communications of the ACM, 40(5), 103-110. Tatum v. Rogers, 75 Civ 2782 (CBM), U.S. District Court. Southern District of New
York, 1979. Wang, R.Y, Ziad, M. and Lee Y.W. (2001). Data quality. Norwell, MA: Kluwer
Academic Publishers.
53
Appendix A: Interview Questions
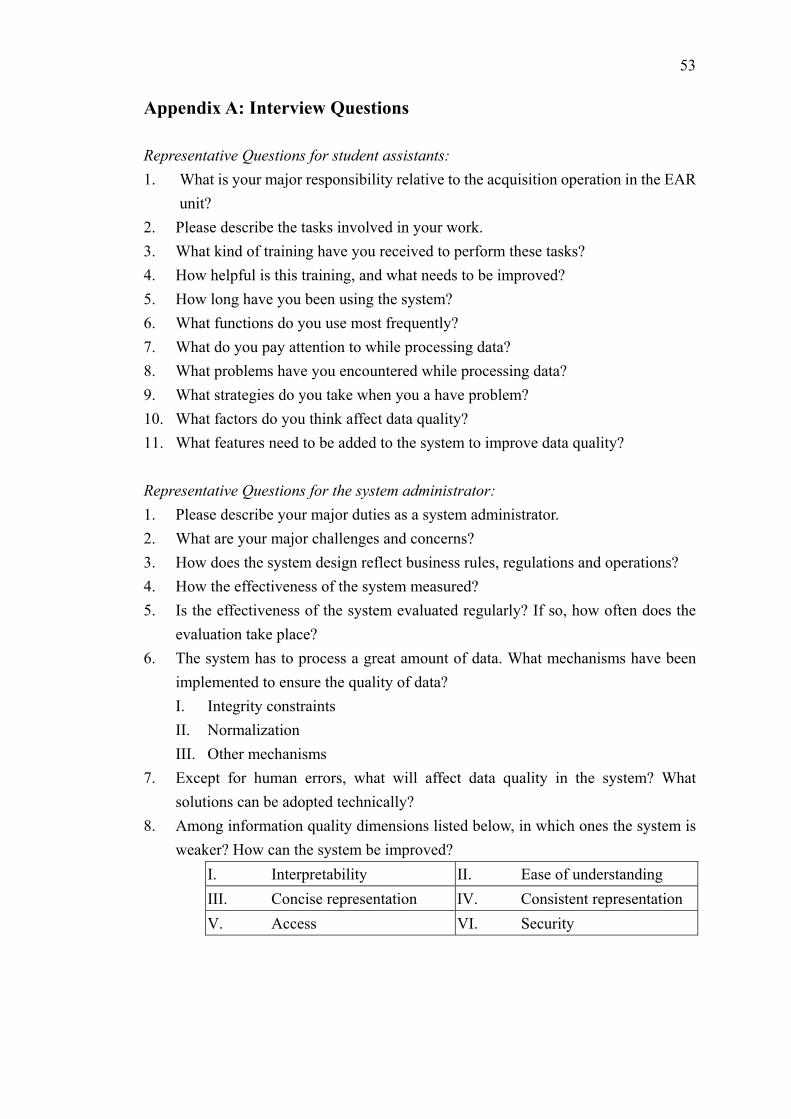
Representative Questions for student assistants: 1. What is your major responsibility relative to the acquisition operation in the EAR
unit? 2. Please describe the tasks involved in your work. 3. What kind of training have you received to perform these tasks? 4. How helpful is this training, and what needs to be improved? 5. How long have you been using the system? 6. What functions do you use most frequently? 7. What do you pay attention to while processing data? 8. What problems have you encountered while processing data? 9. What strategies do you take when you a have problem? 10. What factors do you think affect data quality? 11. What features need to be added to the system to improve data quality? Representative Questions for the system administrator: 1. Please describe your major duties as a system administrator. 2. What are your major challenges and concerns? 3. How does the system design reflect business rules, regulations and operations? 4. How the effectiveness of the system measured? 5. Is the effectiveness of the system evaluated regularly? If so, how often does the
evaluation take place? 6. The system has to process a great amount of data. What mechanisms have been
implemented to ensure the quality of data? I. Integrity constraints II. Normalization III. Other mechanisms
7. Except for human errors, what will affect data quality in the system? What solutions can be adopted technically?
8. Among information quality dimensions listed below, in which ones the system is weaker? How can the system be improved?
I. Interpretability II. Ease of understanding III. Concise representation IV. Consistent representation V. Access VI. Security

54
Representative Questions for the acquisition manager: 1. What processes are involved in the monograph acquisition? 2. Who are involved? 3. What are your major responsibility regarding the acquisition? 4. What trainings are provided to students? 5. What will you pay attention to while reviewing records? 6. What problems do you find? 7. What factors will affect data quality in the process? 8. How does the INNOPAC system track status of acquisition? 9. How does INNOPAC check duplicate? 10. Is there any manual or guideline available? 11. How do you check in books? 12. What problems did you encounter while check-in books? 13. What are the strengths and weaknesses of the INNOPAC system? 14. Why OCLC needs to be included in the pre-order search? 15. What actions have been take to improve data quality? 16. How was INNOPAC converted to PINYIN? Representative Questions for the unit head: 1. How many monographs on average does this unit purchase annually? 2. How many people are involved in the acquisition operation? 3. Please describe what information and procedures are involved in the process of
acquisition. 4. Does the unit periodically review the acquisition operation? 5. How effectively does the acquisition operation run? 6. What are the major problems when turning data source into records in the
database system? 7. What other factors affect the quality of data in the system? 8. What does the unit currently do to ensure the high quality of information in the
database system? 9. How can the database system help to improve data quality? 10. What efforts have been made to improve data quality and how effective?
55
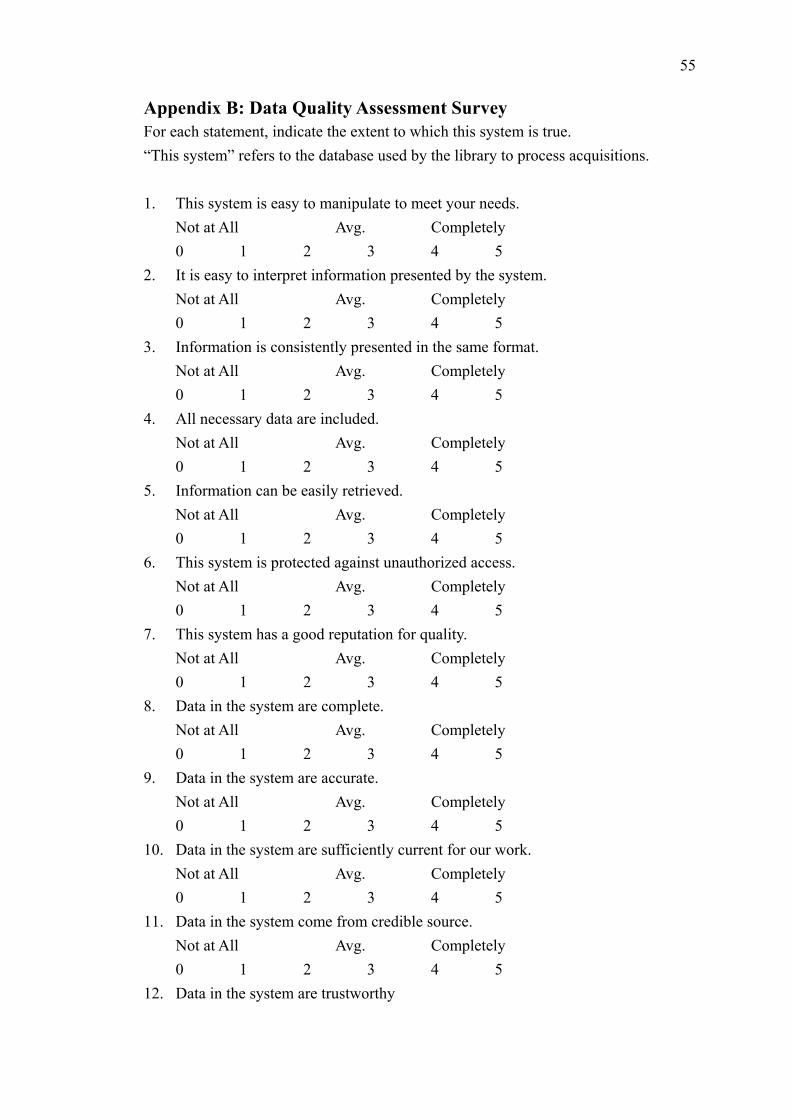
Appendix B: Data Quality Assessment Survey For each statement, indicate the extent to which this system is true. “This system” refers to the database used by the library to process acquisitions. 1. This system is easy to manipulate to meet your needs.
Not at All Avg. Completely 0 1 2 3 4 5
2. It is easy to interpret information presented by the system. Not at All Avg. Completely 0 1 2 3 4 5
3. Information is consistently presented in the same format. Not at All Avg. Completely 0 1 2 3 4 5
4. All necessary data are included. Not at All Avg. Completely 0 1 2 3 4 5
5. Information can be easily retrieved. Not at All Avg. Completely 0 1 2 3 4 5
6. This system is protected against unauthorized access. Not at All Avg. Completely 0 1 2 3 4 5
7. This system has a good reputation for quality. Not at All Avg. Completely 0 1 2 3 4 5
8. Data in the system are complete. Not at All Avg. Completely 0 1 2 3 4 5
9. Data in the system are accurate. Not at All Avg. Completely 0 1 2 3 4 5
10. Data in the system are sufficiently current for our work. Not at All Avg. Completely 0 1 2 3 4 5
11. Data in the system come from credible source. Not at All Avg. Completely 0 1 2 3 4 5
12. Data in the system are trustworthy

56
Not at All Avg. Completely 0 1 2 3 4 5
13. Other comments and suggestions to improve data quality of the system and efficiency of the acquisition operation: