
DATA QUALITY ASSURANCE - World Health Organization
60
Module 2 Desk review of data quality VERSION UPDATE – DECEMBER 2020 DATA QUALITY ASSURANCE DATA QUALITY ASSURANCE
Transcript of DATA QUALITY ASSURANCE - World Health Organization

Module 2Desk review of data qualityv e r s i o n u p d at e – d e c e m b e r 2 0 2 0
Please supply barcode
DATA QUALITY ASSURANCEDATA QUALITY ASSURANCEDATA QUALITY ASSURANCEDATA QUALITY ASSURANCE


Module 2Desk review of data qualityv e r s i o n u p d at e – d e c e m b e r 2 0 2 0
Module 2Discrete desk review of data qualityi m p l e m e n tat i o n g u i d e
DATA QUALITY ASSURANCEDATA QUALITY ASSURANCE
Data quality review: a toolkit for facility data quality assessment. Module 2. Desk review of data quality
© World Health Organization 2020
Some rights reserved. This work is available under the Creative Commons Attribution-NonCommercial-ShareAlike 3.0 IGO licence (CC BY-NC-SA 3.0 IGO; https://creativecommons. org/licenses/by-nc-sa/3.0/igo).
Under the terms of this licence, you may copy, redistribute and adapt the work for non-commercial purposes, provided the work is appropriately cited, as indicated below. In any use of this work, there should be no suggestion that WHO endorses any specific organization, products or services. The use of the WHO logo is not permitted. If you adapt the work, then you must license your work under the same or equivalent Creative Commons licence. If you create a translation of this work, you should add the following disclaimer along with the suggested citation: “This translation was not created by the World Health Organization (WHO). WHO is not responsible for the content or accuracy of this translation. The original English edition shall be the binding and authentic edition”.
Any mediation relating to disputes arising under the licence shall be conducted in accordance with the mediation rules of the World Intellectual Property Organization.
Suggested citation. Data quality review: a toolkit for facility data quality assessment. Module 2. Desk review of data quality. Geneva: World Health Organization; 2017. Licence: CC BY-NC-SA 3.0 IGO.
Cataloguing-in-Publication (CIP) data. CIP data are available at http://apps.who.int/iris.
Sales, rights and licensing. To purchase WHO publications, see http://apps.who.int/bookorders. To submit requests for commercial use and queries on rights and licensing, see http://www.who.int/about/licensing.
Third-party materials. If you wish to reuse material from this work that is attributed to a third party, such as tables, figures or images, it is your responsibility to determine whether permission is needed for that reuse and to obtain permission from the copyright holder. The risk of claims resulting from infringement of any third-party-owned component in the work rests solely with the user.
General disclaimers. The designations employed and the presentation of the material in this publication do not imply the expression of any opinion whatsoever on the part of WHO concerning the legal status of any country, territory, city or area or of its authorities, or concerning the delimitation of its frontiers or boundaries. Dotted and dashed lines on maps represent approximate border lines for which there may not yet be full agreement.
The mention of specific companies or of certain manufacturers’ products does not imply that they are endorsed or recommended by WHO in preference to others of a similar nature that are not mentioned. Errors and omissions excepted, the names of proprietary products are distinguished by initial capital letters.
All reasonable precautions have been taken by WHO to verify the information contained in this publication. However, the published material is being distributed without warranty of any kind, either expressed or implied. The responsibility for the interpretation and use of the material lies with the reader. In no event shall WHO be liable for damages arising from its use.
Design and layout by L’IV Com Sàrl, Villars-sous-Yens, Switzerland. Printed by the WHO Document Production Services, Geneva, Switzerland.

Cont
ents
ContentsAcknowledgements . . . . . . . . . . . . . . . . . . . . . . . . . . . . . . . . . . . . . . . . . . . . . . . . . . . . . . . . . . . . . . . . . . iv
Content of the toolkit . . . . . . . . . . . . . . . . . . . . . . . . . . . . . . . . . . . . . . . . . . . . . . . . . . . . . . . . . . . . . . . . 1
Acknowledgements . . . . . . . . . . . . . . . . . . . . . . . . . . . . . . . . . . . . . . . . . . . . . . . . . . . . . . . . . . . . . . . . . . 2
Chapter 1. Overview . . . . . . . . . . . . . . . . . . . . . . . . . . . . . . . . . . . . . . . . . . . . . . . . . . . . . . . . . . . . . . . . . 3
Objectives . . . . . . . . . . . . . . . . . . . . . . . . . . . . . . . . . . . . . . . . . . . . . . . . . . . . . . . . . . . . . . . . . . . . . . . 3
Scope of the DQR toolkit . . . . . . . . . . . . . . . . . . . . . . . . . . . . . . . . . . . . . . . . . . . . . . . . . . . . . . . . . . 3
Chapter 2. DQR methodology and resources . . . . . . . . . . . . . . . . . . . . . . . . . . . . . . . . . . . . . . . . . . . 5
Overall framework and implementation . . . . . . . . . . . . . . . . . . . . . . . . . . . . . . . . . . . . . . . . . . . . 5
Desk review . . . . . . . . . . . . . . . . . . . . . . . . . . . . . . . . . . . . . . . . . . . . . . . . . . . . . . . . . . . . . . . . . . . . . . 6
Core indicators . . . . . . . . . . . . . . . . . . . . . . . . . . . . . . . . . . . . . . . . . . . . . . . . . . . . . . . . . . . . . . . . . . 11
Chapter 3. Analysis and interpretation of desk review data . . . . . . . . . . . . . . . . . . . . . . . . . . . . 12
Dimension 1: Completeness of reporting . . . . . . . . . . . . . . . . . . . . . . . . . . . . . . . . . . . . . . . . . . 13
Dimension 2: Internal consistency of reporting data . . . . . . . . . . . . . . . . . . . . . . . . . . . . . . . . 14
Dimension 3: External comparison/cross-checks (with other data sources) . . . . . . . . . . . 17
Dimension 4: Consistency of population data . . . . . . . . . . . . . . . . . . . . . . . . . . . . . . . . . . . . . . 19
Annex 1: Recommended indicators . . . . . . . . . . . . . . . . . . . . . . . . . . . . . . . . . . . . . . . . . . . . . . . . . . 21
Annex 2: Definitions and requirements for the calculation of metrics for the desk review of data quality . . . . . . . . . . . . . . . . . . . . . . . . . . . . . . . . . . . . . . . . . . . . . . . . . . . . . . . . . . . . . . . 23
Dimension 1. Completeness and timeliness of data . . . . . . . . . . . . . . . . . . . . . . . . . . . . . . . . . 23
Dimension 2. Internal consistency of reported data . . . . . . . . . . . . . . . . . . . . . . . . . . . . . . . . 31
Dimension 3. External comparison and cross-checks (with other data sources) . . . . . . . 39
Dimension 4. Consistency of population data . . . . . . . . . . . . . . . . . . . . . . . . . . . . . . . . . . . . . 42
Annex 3: Preparation for discrete desk review of data quality . . . . . . . . . . . . . . . . . . . . . . . . . . 48
TData requirements . . . . . . . . . . . . . . . . . . . . . . . . . . . . . . . . . . . . . . . . . . . . . . . . . . . . . . . . . . . . . 48
Data collection . . . . . . . . . . . . . . . . . . . . . . . . . . . . . . . . . . . . . . . . . . . . . . . . . . . . . . . . . . . . . . . . . . 48
Data formatting and compilation . . . . . . . . . . . . . . . . . . . . . . . . . . . . . . . . . . . . . . . . . . . . . . . . . 48
iii

Data
Qua
lity R
evie
w. M
odul
e 2: D
iscre
te d
esk r
evie
w o
f dat
a qua
lity –
Impl
emen
tatio
n gu
ide
Acknowledgements
This toolkit is the result of collaboration between the World Health Organization, the Global Fund, Gavi and the United States Agency for International Development (USAID)/MEASURE Evaluation. The toolkit proposes a unified approach to data quality.
The toolkit integrates and builds upon previous and current tools and methods designed to assess data quality at facility level, taking account of best practices and lessons learned from many countries.
Kavitha Viswanathan oversaw the technical development of the toolkit, with overall guidance provided by Kathryn O’Neill and with technical input from Ties Boerma, David Boone, Hong Anh Chu, Robert Pond, Olav Poppe, Claire Preaud, Ashley Sheffel, Amani Siyam, Knut Staring, Marina Takane and Wendy Venter
All modules in the toolkit are based on technical contributions from WHO departments and external partners. The WHO departments included the Expanded Programme on Immunization, Global HIV Programme, Global Malaria Programme, Global Tuberculosis Programme, and Reproductive, Maternal, Newborn, Child, Adolescent Health (RMNCAH) and other agencies including the Global Fund, Gavi, John Snow/Measure Evaluation, the University of Oslo and collaborating Health Information Systems Programme (HISP).
Particular thanks are due to the country partners that tested and implemented different components of the approach and provided valuable feedback, namely: Benin, Burkina Faso, Cote d’Ivoire, Cambodia, Democratic Republic of the Congo, Kenya, Mauritania, Sierra Leone, Togo, Uganda, Zambia, and Zanzibar in United Republic of Tanzania.
This toolkit has been produced with the support of grants from the Bloomberg Philanthropies Data for Health Initiative; Gavi; the Global Fund to Fight AIDS, Tuberculosis and Malaria; and the Norwegian Agency for Development Cooperation (Norad).
iv

Cont
ents
of t
he to
olki
t
Content of the toolkit
The DQR toolkit includes guidelines, tools and other resources for countries to implement and institutionalize a system for assuring data quality of their health-facility data. The following schema shows the different resources available. These resources are also available for download.1
Overall framework and
implementationModule 1Framework and metrics
DATA QUALITY ASSURANCEDATA QUALITY ASSURANCE
Desk review of data quality
Site assessment of data quality
1 To download, see: https://www.who.int/healthinfo/tools_data_analysis/en/ (accessed 26 October 2020).
Data collection tool for discrete site assessment in (MS-Word
and CSPro) with a user manual for CSPro application
Training materials for
data verification and system
assessments
MS Excel analysis tool for
facility/district data verification and
system assessment (with user guides)
Supervisory checklists in MS Excel (with user guide)
Training materials for
desk review of data quality
WHO Deskreview tool in MS Excel (with user
guide)
DQ app (with user guide)
Module 2Discrete desk review of data qualityi m p l e m e n tat i o n g u i d e
Please supply barcodes
DATA QUALITY ASSURANCEDATA QUALITY ASSURANCEDATA QUALITY ASSURANCEDATA QUALITY ASSURANCE
Module 2Discrete desk review of data quality
DATA QUALITY REVIEWDATA QUALITY REVIEW
Site assessment of data quality: data verification and system assessment
Module 3
i m p l e m e n tat i o n g u i d e
DATA QUALITY ASSURANCEDATA QUALITY ASSURANCE
Site assessment of data quality: data verification and system assessment
Module 3
VERSION UPDATE - DECEMBER 2020
DATA QUALITY REVIEWDATA QUALITY REVIEW
1

Data
Qua
lity A
ssur
ance
. Mod
ule 2
: Des
k rev
iew
of d
ata q
ualit
y
Abbreviations
ANC Antenatal careANC1 First antenatal care visitART Antiretroviral therapyCSPro Census and survey processing systemDHIS 2 Web-based, open source software used by countries chiefly as their
health information system for data management and monitoring of health programmes
DHS Demographic health surveyDQR Data quality reviewDQS Data quality self-assessmentDTP Diphtheria-tetanus-pertussisDTP3 Diphtheria-tetanus-pertussis three-dose vaccineGavi Gavi, the Vaccine AllianceHIV Human immunodeficiency virusHMIS Health management information systemIPT Intermittent preventive therapyIPT1 First dose of intermittent preventive therapyMCV Measles-containing vaccineMDR-TB Multidrug resistant tuberculosisMICS Multiple indicator cluster surveyNGO Nongovernmental organizationOPD Outpatient departmentPCV Pneumococcal conjugate vaccinePenta Pentavalent vaccinePLHIV People living with HIVPMTCT Prevention of mother-to-child transmission RDQA Routine data quality assessment toolRDT Rapid diagnostic testRR Rifampicin-resistantSD Standard deviationTB TuberculosisThe Global Fund The Global Fund to Fight AIDS, Tuberculosis and Malaria USAID United States Agency for International Development WHO World Health Organization
2

Chap
ter 1
. Ove
rvie
w
Chapter 1. Overview
High-quality data is essential to monitor progress towards the Sustainable Development Goals (SDGs), WHO Triple Billion targets and national or subnational health priorities. It is also vital to strengthen country capacity to prevent, prepare for and respond to health emergencies such as COVID-19. Timely, reliable, actionable data is essential for delivering interventions to improve the health of populations.
The recently published global report on country capacity on health data and systems using the SCORE technical package has highlighted that improving data quality is essential for policy and planning. Data availability does not automatically translate into availability of the quality data needed for policy, planning and patient health care. Data quality is a critical issue for health facilities with about 40% of countries not showing clear evidence that data quality assurance processes have been followed for their published health facility data1.
High quality data is essential to monitor progress towards the Sustainable Development Goals (SDGs), WHO Triple Billion targets and national or subnational health priorities. It is also vital to strengthen country capacity to prevent, prepare for and respond to health emergencies such as COVID-19. Timely, reliable, actionable data is essential for delivering interventions to improve the health of populations.
Sound decisions are based on sound data; therefore, it is essential to ensure that the data are of good quality. Health-facility data constitute a primary data source for assessing the performance of the health sector. Poor-quality data affect different levels of the health systems in different ways. For health-care providers at the facility level, patient care can be affected if the information on the patient is incomplete or inconsistent. For programme managers, poor-quality data can lead to incorrect decisions that can be detrimental to the overall running of the programme and, ultimately, to the health of the population. At the planning level, poor-quality data can undermine evidence of progress towards health-sector objectives and may hinder annual planning processes by giving misleading results. Furthermore, when determining investments in the health sector, poor-quality data can lead to poor targeting of resources.
1 https://www.who.int/data/data-collection-tools/score
3

Data
Qua
lity A
ssur
ance
. Mod
ule 2
: Des
k rev
iew
of d
ata q
ualit
y
ObjectivesThe DQR is designed to assess the quality of data generated by information system(s) based in health facilities. The objectives of the DQR are:
î to institutionalize a system for assessing the quality of data, including routine monitoring of data, discrete data quality reviews (conducted annually) and periodic in-depth assessments of priority health programmes;
î to identify weaknesses in the data management system and interventions for system strengthening; and
î to monitor the performance of data quality over time and the capacity to produce good-quality data.
Scope of the DQR toolkitThe scope of the DQR toolkit is to provide the framework and structure to support routine, annual or periodic assurance, assessment and improvement of facility-reported data. The periodicity of reviews depends on the focus of the review – i.e. whether to make routine course correction to data, whether to look at common cross-cutting data quality issues that must be addressed when preparing annual health analytical reports, or whether to look in greater depth at a specific health or disease programme in advance of a programme review. More specifically, this multipronged approach includes the following:
î Routine and regular reviews of data quality – or data quality assurance. These should be regular (e.g. monthly) reviews of data quality built into a system of checks of the HMIS or other programme reporting systems as part of a feedback cycle that identifies errors in near real-time so they can be corrected as they occur. This routine examination of data can be more holistic and either cross-cutting or programme-specific, and can be conducted by different users of data (e.g. HMIS managers, programme managers, etc.).
î Discrete cross-sectional assessments. These are needed to look at the quality of health facility data being used both to measure the performance of the health sector and also for policy and planning purposes. While it is recommended that these assessments have an element of independence during implementation, it is very important that they are closely coordinated and managed by the Ministry of Health. Oversight from the Ministry of Health is critical for the ultimate use of these results to improve data quality. These assessments should be carried out before a planning cycle, such as in advance of an annual health-sector review (periodicity is country-specific).
î Periodic in-depth programme-specific reviews of data quality. These should focus on a single disease or programme area and should be timed to meet the planning needs of the specific programmes (e.g. prior to programme reviews).
4

Chap
ter 2
. DQR
met
hodo
logy
and
reso
urce
s
Chapter 2. DQR methodology and resources
The DQR methodology comprises two separate processes (Figure 1), namely: î Desk review – a review of the quality of existing aggregated reported data using
standardized data quality metrics. This can be done as part of routine and regular data quality checks or as a discrete/cross-sectional assessment. This section is covered in the present document, Module 2: Desk review of data quality.
î Site assessment – an assessment of data quality that requires visits to health facilities and district offices and includes verification of source data and an assessment of system capabilities to produce quality data. The site assessment can be part of a routine data quality assurance cycle that includes supervision or it may be conducted as a discrete/cross-sectional assessment.
The DQR toolkit includes guidelines and tools that lay the basis for a common understanding of data quality so that a regular mechanism for data quality assurance and review can be institutionalized. The toolkit enables countries to use appropriate guidance and tools to conduct a data quality review. This module – Module 2 – is focused on the desk review of data quality. The resources included below are relevant to the use of this module.
Overall framework and implementationThese two documents shown below give overviews of the DQR framework and toolkit, as well as details of their implementation, as follows:
î The overall DQR Framework is described in Module 1 which lays out the overarching framework of the DQR and introduces the methodology, the metrics and the contents of the toolkit.
î Discrete Desk Review of Data Quality - Implementation Guide is specific to the discrete site assessment of data quality and system capabilities and addresses requirements for conducting a health facility assessment on a sample of health facilities.
Module 1Framework and metrics
DATA QUALITY ASSURANCEDATA QUALITY ASSURANCEModule 2Discrete desk review of data quality
DATA QUALITY REVIEWDATA QUALITY REVIEW
5
Data
Qua
lity A
ssur
ance
. Mod
ule 2
: Des
k rev
iew
of d
ata q
ualit
y
Desk reviewThe desk review examines the quality of data collected across four dimensions, namely: 1) completeness; 2) internal consistency; 3) external comparison with other data sources; and 4) external consistency of population data (e.g. denominators). Within each dimension there are one or more metrics that measure different functions/components of data quality. These are described in a following section. While this guidance on data quality is intended for use by ministries of health with their HMIS data, the data quality dimensions and metrics can be applied to other information systems. No new data collection is required to conduct a desk review of data quality.
Conducting a desk review of data quality has two different purposes: î to be conducted as a discrete assessment of the quality of routine health facility data in
order to measure the adequacy of the data being used for planning and health-sector monitoring;
î to review health facility data continuously (e.g. monthly) to detect errors in aggregation and reporting for real-time correction.
Data quality desk review - a discrete assessmentPerformance of the desk review conducted as a discrete assessment is recommended before annual health-sector reviews to give an overview of the quality of the data across different programme areas in the routine health information system. This discrete desk review of data quality compares the performance of the country health information system with recommended benchmarks1 for quality and flags for further review any subnational administrative units which fail to attain the benchmark. At the same time, the desk review may identify some large – and possibly erroneous – outlier values which warrant investigation and, if necessary, correction (“data cleaning”) before analysis of the data can proceed.
Some recommended criteria for the desk review include: î A core set of tracer indicators (usually 4−5) selected across programme areas (i.e. cross-
cutting)2 are examined in relation to the four dimensions mentioned above. This cross-cutting desk review of the recommended programme indicators across quality dimensions quantifies problems of data completeness and consistency by individual programme areas. It also provides valuable information on the overall adequacy of health-facility data to support planning and annual monitoring.
2 User-defined benchmarks can be established at the discretion of assessment planners.2 While a discrete assessment can also be done for a specific programme, in this document and the rest of the DQR toolkit the discrete assessment refers to a
cross-cutting examination of data quality. The metrics of DQR are applicable to a programme-specific data quality assessment.
6

Chap
ter 2
. DQR
met
hodo
logy
and
reso
urce
s
î Maintain an “element of independence” in the conduct, analysis and interpretation of this desk review. This involves having an unbiased analyst present during the data quality desk review process. (This is different from a routine, continuous review of data quality where the collectors and users of the data are managing and reviewing the data).
î Ensure leadership from the Ministry of Health in the oversight of this process and the use of results to improve data quality.
î Implement before a review event, such as a health-sector review. î Conduct the desk review in conjunction with the discrete site assessment (although the
desk review may alternatively be conducted separately).
Additional information on the implementation of the discrete data quality review is available in Annex 3. However, more detailed implementation information is included in the Implementation guide.
Resources to support discrete desk review of data qualityThe following resources are available to support implementation of discrete data quality desk reviews.3
î Module 2: Desk review of data quality is the main guidance document for conducting a desk review of data quality. The contents of this guidance document apply to both the discrete desk review of data quality and the continuous review of data quality.
î The Desk review implementation guide takes the user through the process of conducting a desk review, with a focus on the discrete desk review of data quality.
î A tool in Microsoft Excel will automate analyses of data quality metrics using the DHIS2 application for WHO data quality strengthening (for countries that do not have DHIS 2). This Excel tool, which is accompanied by a user’s guide, is recommended for the discrete desk review of data quality (that should be conducted before a health-sector review) but not for routine checks of data quality.4 While the Excel tool has been developed to conduct a cross-cutting desk review of data quality across multiple programme indicators, it can also be used to conduct a discrete programme-specific desk review of data quality.
î The DQR metrics are incorporated in the DHIS 2 software as part of the WHO Data Quality App. This app can be used for a cross-cutting discrete assessment or a programme-specific discrete assessment and can generate a report. The WHO Data Quality App can also be used for continuous monitoring of data quality (see the next section). It is accompanied by a user’s guide for initial set-up and implementation.5
3 To download, see: https://www.who.int/healthinfo/tools_data_analysis/dqr_desk_review/en/ (accessed 28 October 2020).4 This is primarily because the Excel tool is designed to examine data quality at a point in time and because it requires considerable effort to format the data
for importing to the tool and considerable effort to import the data (i.e. cutting and pasting of data) in order to calculate the data quality metrics. Use of the tool for routine checks would require this process to be carried out each time, thus making it very cumbersome.
5 As indicated in the previous section and also in the Framework document, the discrete DQR is cross-cutting and compares data quality of indicators across different programmes. In DHIS 2, this cross-cutting analysis will be possible only for the indicators that are collected within DHIS 2. For example, if HIV indicators are not reported into DHIS 2, the discrete DQR with the recommended core indicators will not be possible in DHIS 2 and will have to be conducted in the Excel tool. However, a discrete DQR with a different set of cross-cutting indicators can nevertheless be conducted in DHIS 2 using the WHO DQ app.
7
Data
Qua
lity A
ssur
ance
. Mod
ule 2
: Des
k rev
iew
of d
ata q
ualit
y
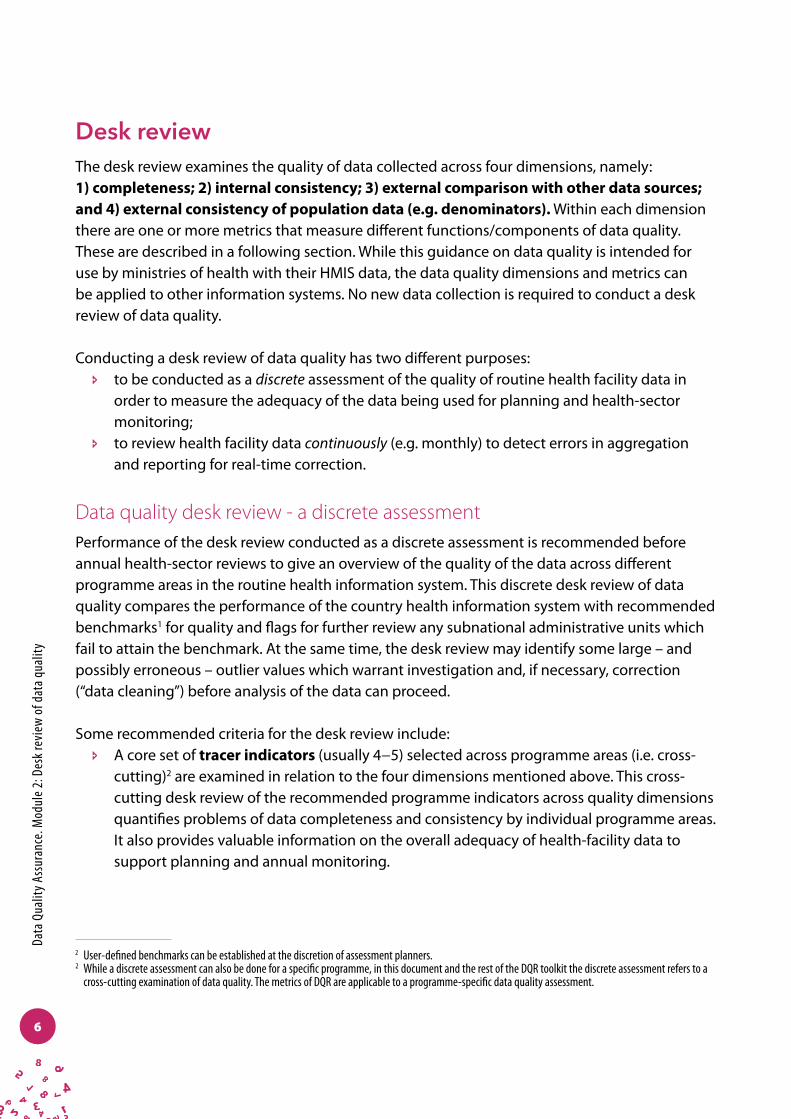
î Training materials have been developed to help support in-person training on conducting a desk review of data quality. These materials contain presentations, a facilitator’s guide, a participants’ manual and exercises that can be adapted for any data quality desk review training.
Continuous desk review of data qualityChecking data quality should not be limited to discrete, annual assessments. Continuous monitoring and correcting of data to assure quality should be part of the routine cycle of collection, reporting, feedback and use of data. Some key characteristics of the continuous desk review of data quality are:
î It is not necessary to limit data quality analysis to the tracer indicators (although they should be considered for inclusion as they are key programme indicators). Users can examine different indicators against the data quality metrics (including programme-specific continuous reviews).
î A minimum monthly review of data quality is recommended at the level of the health facility and health district as well as higher levels. Ultimately, however, a country’s standard operating procedures for data quality assurance should be followed.
î Some of the dimensions and metrics that are used for the discrete desk review assessment -- such as completeness and timeliness of data, internal consistency of data, or comparison with other related programme data − can also be used for continuous monitoring. However, other dimensions, such as external comparisons with other data sources and external consistency of population data, should be conducted annually.
î The continuous desk review is conducted by the collectors and users of data and does not require any element of independence.
Training materials for
desk review of data quality
WHO Deskreview tool in MS Excel (with user
guide)
DQ app (with user guide)
Module 2Discrete desk review of data quality
DATA QUALITY REVIEWDATA QUALITY REVIEW
8
Chap
ter 2
. DQR
met
hodo
logy
and
reso
urce
s
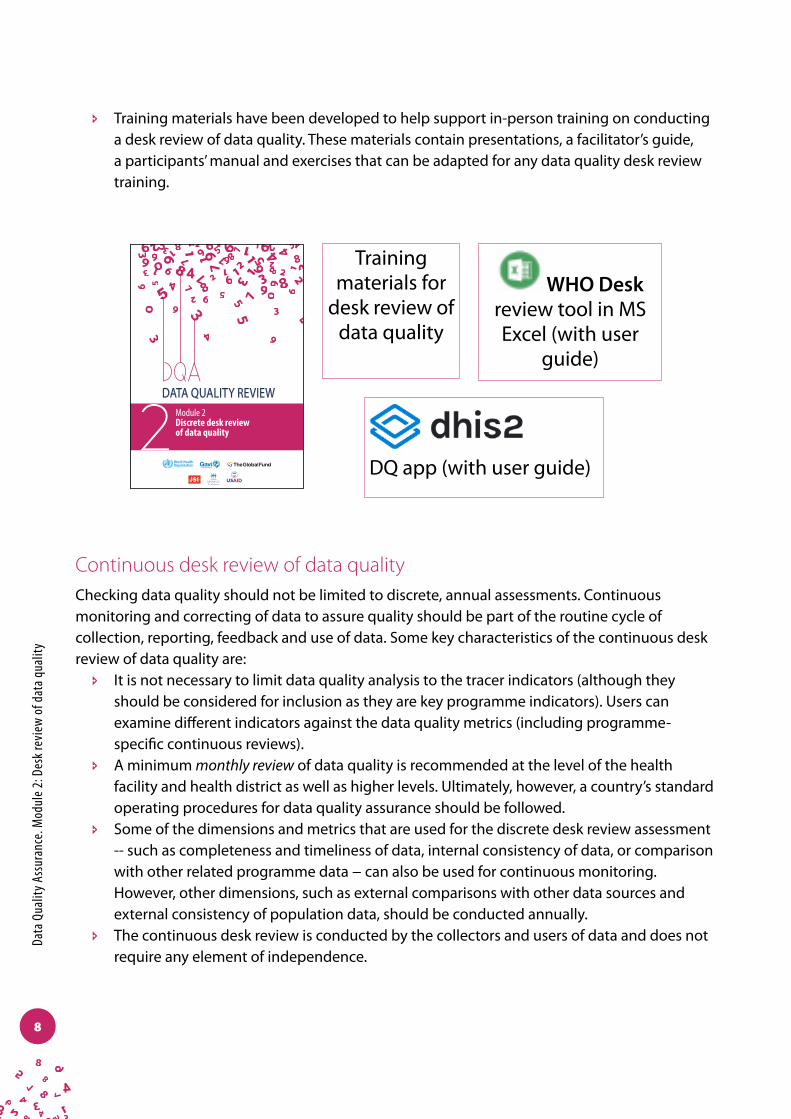
Resources to support continuous desk review of data qualityThe following resources are available to support implementation of continuous data quality desk reviews.6
î Module 2: Desk review of data quality is the main guidance document for conducting a desk review of data quality. The contents of this guidance document apply to both the discrete desk review of data quality and the continuous review of data quality .
î The DQR metrics are incorporated in the DHIS 2 software as part of the WHO Data Quality App. This app has multiple functionalities, including a special dashboard for routine, continuous monitoring of the quality of selected tracer indicators (either a cross-cutting set or programme-specific sets), an analysis function to review the internal consistency of any DHIS 2 data, and an Annual Report function which automatically generates an data quality report card based on the DQR framework. The WHO Data Quality App is accompanied by a user’s guide for initial set-up and implementation.
î Training materials have been developed to help support in-person training on conducting a desk review of data quality. These materials contain presentations, a facilitator’s guide, a participants’ manual and exercises that can be adapted for any data quality desk review training. These training materials can be used for both DHIS 2 and the Excel data quality tools. Additional training materials have been developed specifically for the DHIS 2-based WHO Data Quality App by the University of Oslo.7
6 For download, see: https://www.who.int/healthinfo/tools_data_analysis/dqr_desk_review/en/ (accessed 28 October 2020).7 These materials include How to configure the WHO Data Quality Tool, How to use the WHO Data Quality Tool and How to configure alerts for outliers. A series
of videos will soon be released. The “How to” guides are designed to be used in conjunction with a special website that has model databases for realistic practice with the DHIS 2-based data desk review.
Training materials for
desk review of data quality
DQ app (with user guide)
Module 2Discrete desk review of data qualityi m p l e m e n tat i o n g u i d e
Please supply barcodes
DATA QUALITY ASSURANCEDATA QUALITY ASSURANCEDATA QUALITY ASSURANCEDATA QUALITY ASSURANCE
9

Data
Qua
lity A
ssur
ance
. Mod
ule 2
: Des
k rev
iew
of d
ata q
ualit
y
Figu
re 1.
The D
QR m
etho
dolo
gy
10

Chap
ter 2
. DQR
met
hodo
logy
and
reso
urce
s
Core indicatorsThe proposed core indicators were selected on the basis of their importance for programme monitoring and evaluation. They include core indicators on antenatal care (ANC), immunization, human immunodeficiency virus (HIV), tuberculosis (TB) and malaria. Table 2.1 lists the recommended core or tracer indicators recommended for regular DQR.
While it is recommended that countries should select indicators from the core list, they may select other indicators or expand the set of indicators on the basis of their needs and the resources available. A full set of core and additional indicators is available in Annex 1.
Table 2.1. Recommended core indicators for the DQR
Recommended DQR indicators
Programme area Abbreviated name Indicator name
Maternal health Antenatal care 1st visit (ANC1) coverage Number and % of pregnant women who received antenatal care at least once during their pregnancy
Immunization DTP3/Penta3 coverage Number and % of children < 1 year receiving three doses of DTP/Penta vaccine
HIV Newly on ART Number of people living with HIV who initiate ART
TB TB notification rate Number of new and relapse cases of TB that are notified per 100 000 population
Malaria Confirmed malaria cases9 Number of malaria cases positive by microscopy, RDT or molecular diagnostic test
Note: ANC = antenatal care; ART = antiretroviral therapy; DTP3 = diphtheria-tetanus-pertussis three-dose vaccine; Penta = pentavalent vaccine; RDT = rapid diagnostic test; TB = tuberculosis.
11

Data
Qua
lity A
ssur
ance
. Mod
ule 2
: Des
k rev
iew
of d
ata q
ualit
y
Chapter 3. Analysis and interpretation of desk review data
The analysis of the desk review component of the DQR has been facilitated through the use of DHIS 2 software or an Excel-based tool that can produce the standard metrics. These automated analyses allow the user to spend more time on the interpretation of results for data quality improvement. The Excel-based tool is more appropriate for the discrete DQR while the WHO DQ app in the DHIS 2 software can be used for both continuous and discrete DQR. The dimensions and data quality metrics presented below are applicable to both the discrete and the continuous DQR, although not all metrics are relevant for a continuous DQR. However, a continuous monitoring of data quality should examine issues related to completeness and internal consistency of routine facility data and, if possible, should perform some external comparisons/cross-checks (depending on the interoperability or integration of the routine health information system).
The graphs and figures included in the sections below are drawn exclusively from the Excel-based tool for a discrete DQR. Results are presented in tables and graphs with ample space to add interpretation of the results. Staff with an understanding of the dynamics of service delivery in the year of analysis (i.e. programme managers) should participate in the interpretation of DQR results. This functionality is also available in the Annual Report function within WHO DQ app in DHIS 2 (further information on this is included in the DHIS 2 documentation of the app that is part of this toolkit).1 However, most of these outputs and interpretations can be extended to the continuous DQR conducted through the WHO DQ app in DHIS 2.2 The slight variations in interpretations of the DQ metrics for a continuous DQR will be explained in a separate WHO DQ app manual that is part of this toolkit.
Some example illustrations of output for the DQR analysis are presented for each dimension of data quality. All these examples are taken from WHO’s Excel-based DQR tool, with the interpretation box showing examples of comments to be inserted by the user.
1 In DHIS 2, this cross-cutting analysis will be possible only for the indicators that are collected within DHIS 2. For example, if HIV indicators are not reported into DHIS 2, then a discrete DQR with the recommended core indicators will not be possible in DHIS 2 and will have to be conducted in the Excel tool. However, a discreet DQR with a different set of cross-cutting indicators can still be conducted in DHIS 2 using the WHO DQ app.
2 When the outputs and graphics are translated to continuous monitoring of data quality, the time will not be static. For example, comparisons made in January with a value from a previous January will not be the same as comparisons made in March with a value from March in a previous year.
12
Chap
ter 3
. Ana
lysis
and
inte
rpre
tatio
n of
des
k rev
iew
dat
a
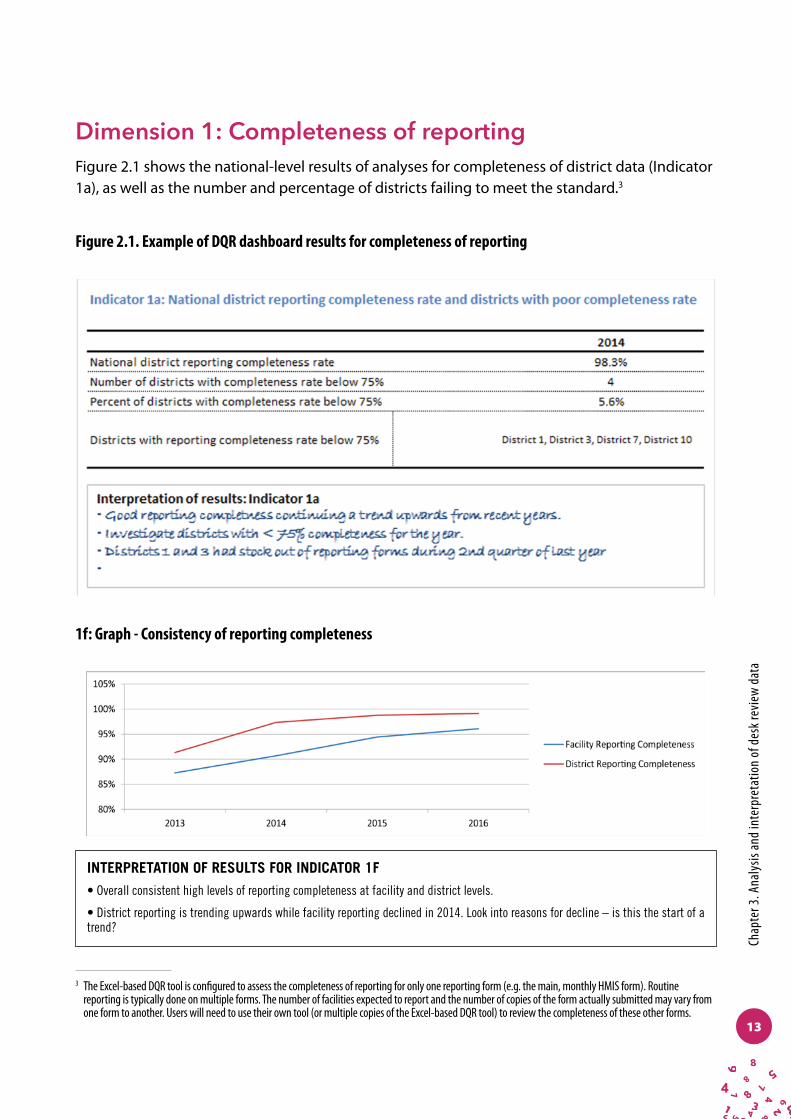
Dimension 1: Completeness of reportingFigure 2.1 shows the national-level results of analyses for completeness of district data (Indicator 1a), as well as the number and percentage of districts failing to meet the standard.3
3 The Excel-based DQR tool is configured to assess the completeness of reporting for only one reporting form (e.g. the main, monthly HMIS form). Routine reporting is typically done on multiple forms. The number of facilities expected to report and the number of copies of the form actually submitted may vary from one form to another. Users will need to use their own tool (or multiple copies of the Excel-based DQR tool) to review the completeness of these other forms.
Figure 2.1. Example of DQR dashboard results for completeness of reporting
1f: Graph - Consistency of reporting completeness
INTERPRETATION OF RESULTS FOR INDICATOR 1F
• Overall consistent high levels of reporting completeness at facility and district levels.
• District reporting is trending upwards while facility reporting declined in 2014. Look into reasons for decline – is this the start of a trend?
13
Data
Qua
lity A
ssur
ance
. Mod
ule 2
: Des
k rev
iew
of d
ata q
ualit
y
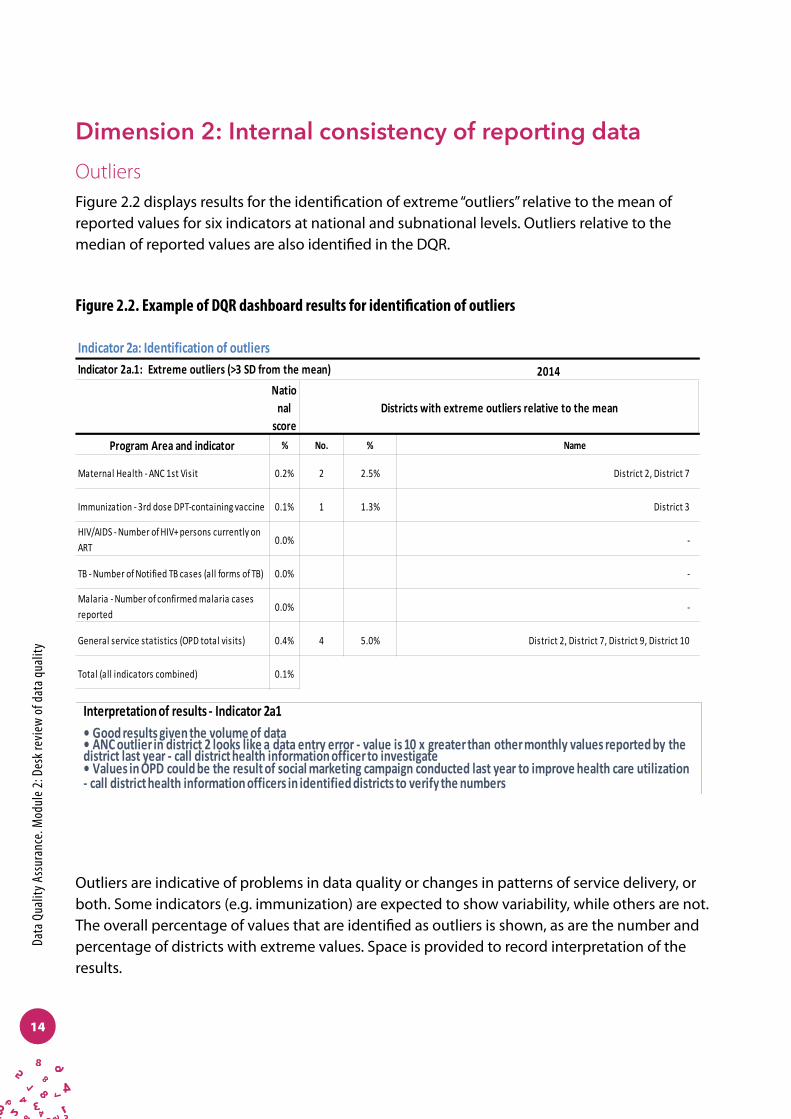
Dimension 2: Internal consistency of reporting dataOutliersFigure 2.2 displays results for the identification of extreme “outliers” relative to the mean of reported values for six indicators at national and subnational levels. Outliers relative to the median of reported values are also identified in the DQR.
Outliers are indicative of problems in data quality or changes in patterns of service delivery, or both. Some indicators (e.g. immunization) are expected to show variability, while others are not. The overall percentage of values that are identified as outliers is shown, as are the number and percentage of districts with extreme values. Space is provided to record interpretation of the results.
National
score % No. % Name
0.2% 2 2.5%
0.1% 1 1.3%
0.0%
0.0%
0.0%
0.4% 4 5.0%
0.1%
Malaria - Number of confirmed malaria cases reported
-
General service statistics (OPD total visits) District 2, District 7, District 9, District 10
Total (all indicators combined)
Immunization - 3rd dose DPT-containing vaccine District 3
HIV/AIDS - Number of HIV+ persons currently on ART
-
TB - Number of Notified TB cases (all forms of TB) -
Indicator 2a.1: Extreme outliers (>3 SD from the mean) 2014
Districts with extreme outliers relative to the mean
Program Area and indicator
Maternal Health - ANC 1st Visit District 2, District 7
Indicator 2a: Identification of outliers
Interpretation of results - Indicator 2a1• Good results given the volume of data• ANC outlier in district 2 looks like a data entry error - value is 10 x greater than other monthly values reported by the district last year - call district health information officer to investigate• Values in OPD could be the result of social marketing campaign conducted last year to improve health care utilization - call district health information officers in identified districts to verify the numbers
Figure 2.2. Example of DQR dashboard results for identification of outliers
14

Chap
ter 3
. Ana
lysis
and
inte
rpre
tatio
n of
des
k rev
iew
dat
a
Consistency over timeConsistency over time is evaluated in order to examine the value of the current year against values reported in previous years. Depending on the expected trend of the indicator (constant, or increasing/deceasing) the value of the current year is compared to the average of the values of the three previous years (constant trend) or the value forecast4 from the values from the preceding years (non-constant). The resulting ratio is calculated for each subnational administrative area and is compared to the national ratio. Subnational administrative areas that exceed a user-defined threshold for quality are identified for further investigation.
In Figure 2.3, the graph (which is an example) shows service output for visits to the outpatient department (OPD) in the current year for each subnational administrative district compared to the mean for OPD in the three preceding years for the same administrative area. Dotted lines represent the recommended or user-defined quality threshold, while the solid line indicates the national-level relationship between outpatient visits in the current year and the average for the three preceding years. Values for subnational administrative districts that exceed the threshold of quality would appear above or below the dotted lines. These areas are investigated to identify potential problems of data quality. The graph and accompanying table show that “District 3” is the only district for which OPD visits during 2014 exceeded the number of expected visits (i.e. the average of the annual number of visits during 2011−2013) by more than 33%.
4 The forecasted value calculates what the current year should be on the basis of the slope of the line of the three previous years (the trend) and compares the calculated value to the real value.
Figure 2.2. Example of DQR dashboard results for identification of outliers
2b2: Consistency of 'General Service Statistics - OPD Total Visits' over timeYear
Percent of dis tricts with divergent scores 8%
Names of dis tricts with divergent scores :
District 3
Qual i ty threshold 33%
National score (%) 109%
Number of dis tricts with divergent scores 1
2014
Expected trend Constant
Compare dis tricts to: national resul t
0
100000
200000
300000
400000
500000
600000
0 100,000 200,000 300,000 400,000 500,000Gen
eral
_Ser
vice
_Sta
tistic
s -O
PD T
otal
Vi
sits
eve
nts
for
year
of a
naly
sis
Mean of General_Service_Statistics - OPD Total Visits events for preceding years (3 years max)
0
500,000
1,000,000
1,500,000
2,000,000
2,500,000
3,000,000
2011 2012 2013 2014
Trend over time: General_Service_Statistics - OPD Total Visits
Interpretation of results - Indicator 2c2: •Overall the national ratio was 1.09 which means that the OPD visits for the current year is 9% greater than the mean of OPD visits for the past three years.•There are 6 districts which have seem to have the mean OPD visits of the past three years that are higher than the OPD visits for the current year. Need to determine why OPD visits are lower in the current year.• Except for 1 district, all districts had a ratio similar to the national ratio (within 33% of the national ratio). • The district that was outside of the quality threshold had a ratio where the mean OPD visits of the past three years was more than 33% lower than the OPD visit of the current year. Need to determine if this is a data quality issue or a program issue. For data quality, need to check if all the OPD data for this district has been entered. Are the visits for the past years correct? See if previous data quality checks have been done. If this is not a data quality issue need to understand potential programmatic issues that could be causing this discrepancy.
15

Data
Qua
lity A
ssur
ance
. Mod
ule 2
: Des
k rev
iew
of d
ata q
ualit
y
Figure 2.3a shows a comparison of the current year’s value for OPD to the value forecasted on the basis of the preceding three years of values (The graph at bottom-left indicates the actual trend in the indicator.) Subnational units are compared to the expected value: it is expected that, if the trend in reporting continues, the current year’s value will be the same as, or similar to, the forecasted value for each subnational unit. Three districts had more than 120% of the expected number of OPD visits (the three dots above the upper dashed line) while two districts had fewer than 80% of the expected number of OPD visits (the two dots below the lower dashed line).
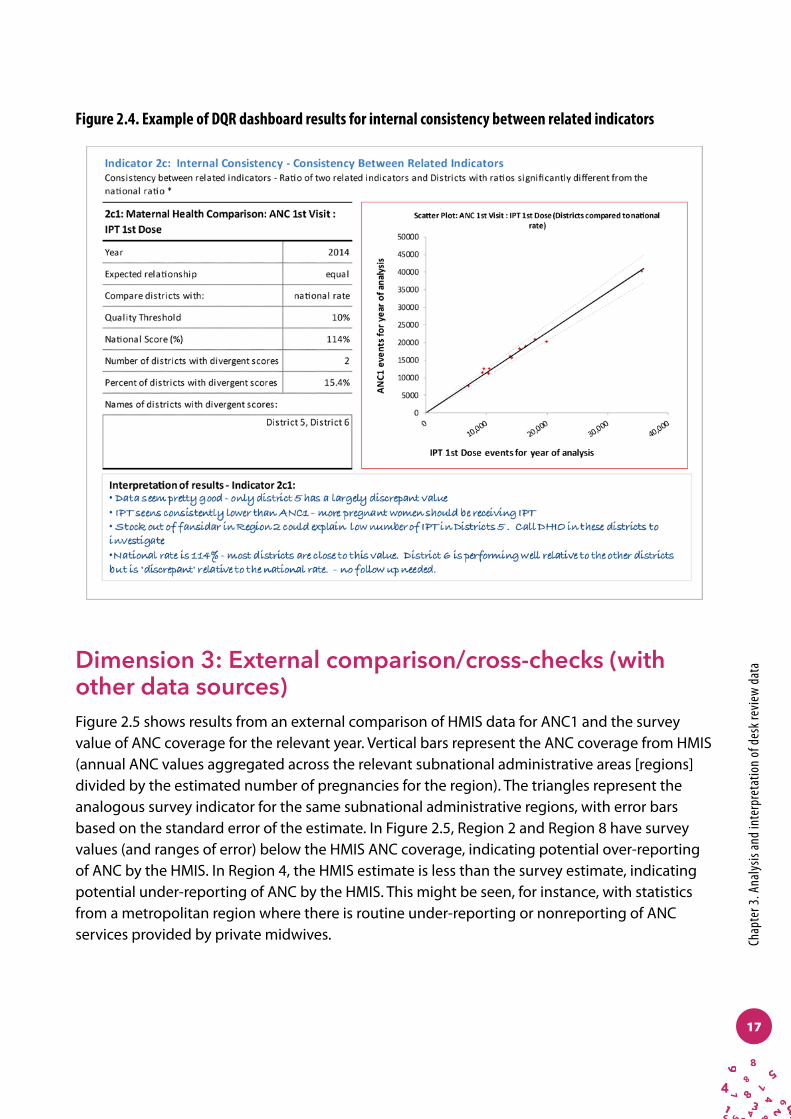
Consistency between indicatorsWithin Dimension 2, the consistency between related indicators is evaluated. In the example in Figure 2.4, the first antenatal care visit (ANC1) is compared to the first dose of intermittent preventive therapy (IPT1).5 In malaria-endemic countries, IPT should be given to all pregnant women as a part of ANC. In theory, the number of women given the first dose of IPT should be roughly equal to the number of women attending ANC for the first time. The ratio of ANC1 to IPT1 is calculated for each subnational administrative district and also for the nation as a whole. In the example in Figure 2.4, the value at national level is 114%, which means that more women began ANC than received IPT1. The subnational units with ratios over 10% greater (or 10% less) than 1 (i.e. ANC1 and IPT1 are equal) are flagged for investigation.
5 If the country is not malaria-endemic or if IPT data are not available, other indicators can be substituted. For instance, DTP1 and ANC1 usually follow the same pattern in countries. That is, if ANC1 is high, DTP1 is also high.
Figure 2.3a. Example of DQR dashboard results for consistency over time – increasing trend for the indicator
16
Chap
ter 3
. Ana
lysis
and
inte
rpre
tatio
n of
des
k rev
iew
dat
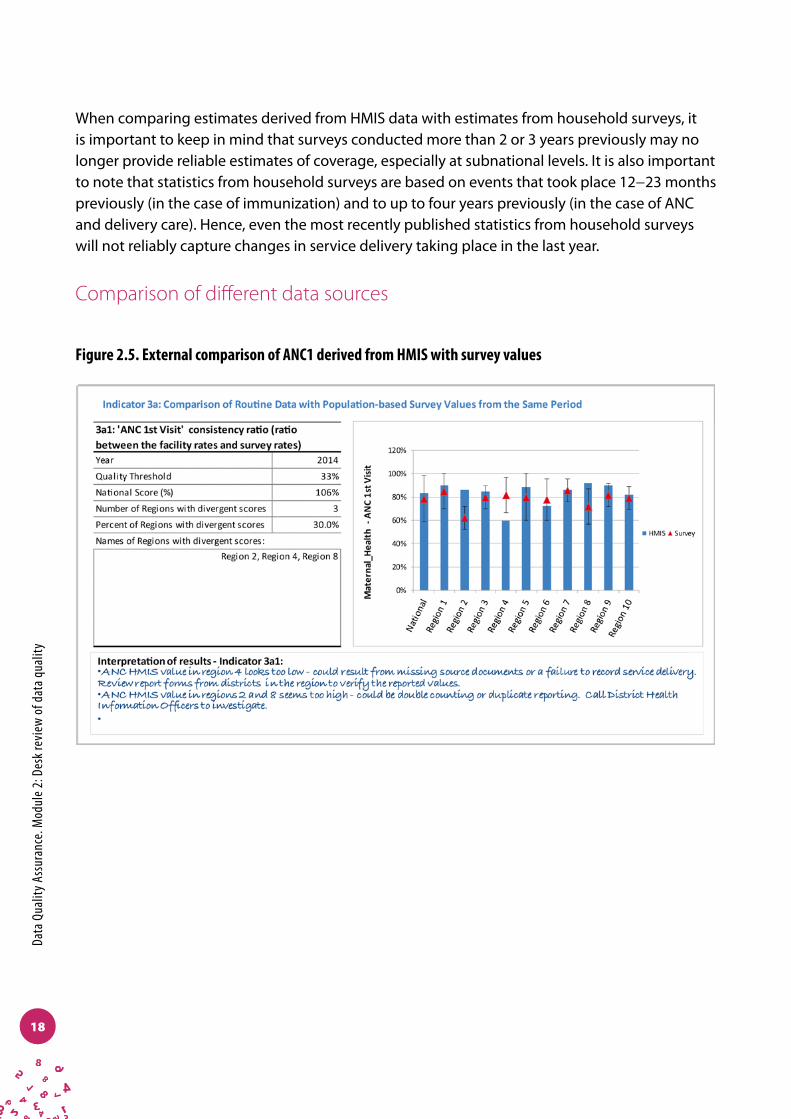
aDimension 3: External comparison/cross-checks (with other data sources)Figure 2.5 shows results from an external comparison of HMIS data for ANC1 and the survey value of ANC coverage for the relevant year. Vertical bars represent the ANC coverage from HMIS (annual ANC values aggregated across the relevant subnational administrative areas [regions] divided by the estimated number of pregnancies for the region). The triangles represent the analogous survey indicator for the same subnational administrative regions, with error bars based on the standard error of the estimate. In Figure 2.5, Region 2 and Region 8 have survey values (and ranges of error) below the HMIS ANC coverage, indicating potential over-reporting of ANC by the HMIS. In Region 4, the HMIS estimate is less than the survey estimate, indicating potential under-reporting of ANC by the HMIS. This might be seen, for instance, with statistics from a metropolitan region where there is routine under-reporting or nonreporting of ANC services provided by private midwives.
Figure 2.4. Example of DQR dashboard results for internal consistency between related indicators
17
Data
Qua
lity A
ssur
ance
. Mod
ule 2
: Des
k rev
iew
of d
ata q
ualit
y
When comparing estimates derived from HMIS data with estimates from household surveys, it is important to keep in mind that surveys conducted more than 2 or 3 years previously may no longer provide reliable estimates of coverage, especially at subnational levels. It is also important to note that statistics from household surveys are based on events that took place 12−23 months previously (in the case of immunization) and to up to four years previously (in the case of ANC and delivery care). Hence, even the most recently published statistics from household surveys will not reliably capture changes in service delivery taking place in the last year.
Comparison of different data sources
Figure 2.5. External comparison of ANC1 derived from HMIS with survey values
18

Chap
ter 3
. Ana
lysis
and
inte
rpre
tatio
n of
des
k rev
iew
dat
a
Dimension 4: Consistency of population dataFigure 2.6a shows an example of the dashboard for results of comparisons of population data. Indicator 4a shows the comparison of National Statistics Office values for live births with the United Nations population estimate for live births. The value of 0.98 indicates that the National Statistics Office value is lower than the United Nations estimate, but only slightly.
Indicator 4b (see Figure 2.6b) shows the dashboard for a comparison between a health programme estimate of live births and the official government value (i.e. of the National Statistics Office). Subnational administrative districts are also evaluated (depending on the availability of the data) and discrepant subnational units are identified. In the example in Figure 2.6b, District 1, District 7 and District 12 have programme values for live births greater than the official government values for the same districts. District 5 has a programme value for live births below the official government value for that district.
Figure 2.6a Example of DQR dashboard results for the quality of population data
19

Data
Qua
lity A
ssur
ance
. Mod
ule 2
: Des
k rev
iew
of d
ata q
ualit
y
Figure 2.6b. Example of DQR dashboard results for comparison of estimates of live births between two sources of data
20

Anne
x 1. R
ecom
men
ded
indi
cato
rs
Recommended core of “tracer” indicators for DQR
Programme area Indicator name Full indicator
Maternal health Antenatal care 1st visit (ANC1) coverage Number and % of pregnant women who received antenatal care at least once during pregnancy
Immunization DTP3/Penta3 coverage Number (%) of children < 1 year receiving three doses of DTP/Penta vaccine
HIV Currently on ART Number of people living with HIV who initiate ART
TB TB notification rate Number of new and relapse cases of TB that are notified per 100 000 population
Malaria Total confirmed malaria cases1 Number of malaria cases positive by microscopy, RDT or molecular diagnostic test
Core indicators
Note: ANC = antenatal care; ART = antiretroviral therapy; DTP3 = diphtheria-tetanus-pertussis three-dose vaccine; Penta = pentavalent vaccine; RDT = rapid diagnostic test; TB = tuberculosis.
Additional indicators
1 If the number of confirmed malaria cases is not available, use total malaria cases.2 If this vaccine is not used in the country, substitute with another vaccine used in the national programme.
Annex 1: Recommended indicators
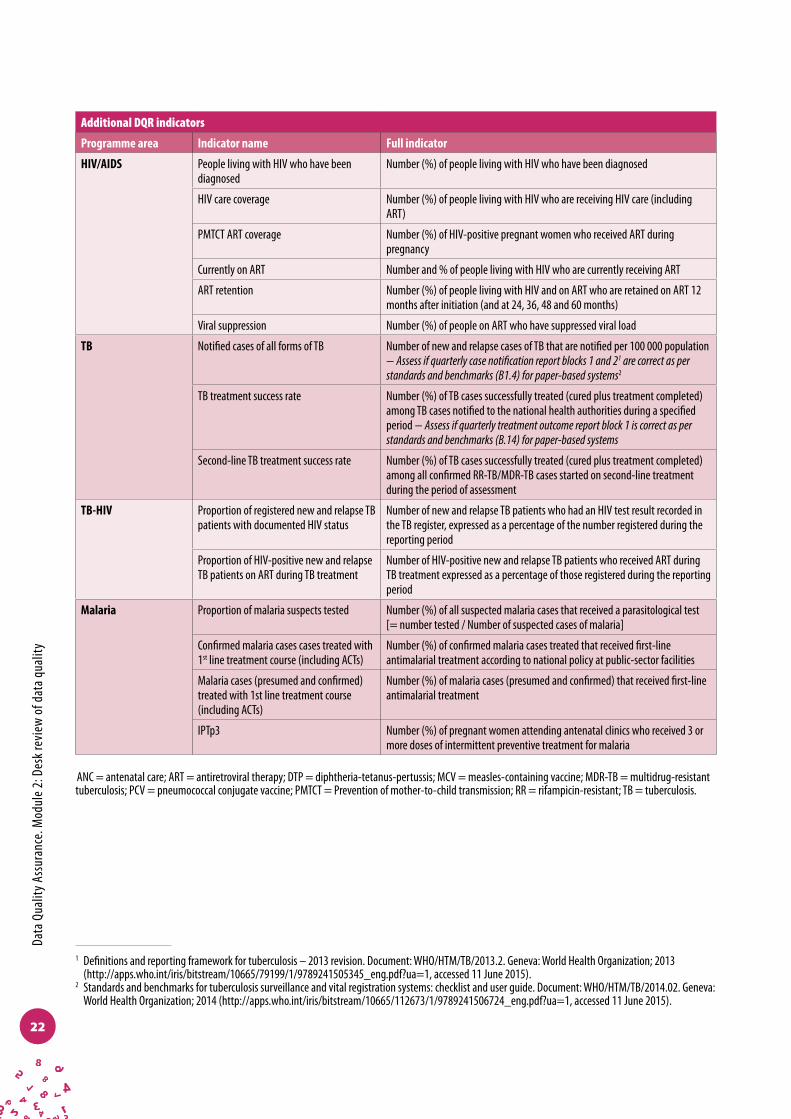
Additional DQR indicators
Programme area Indicator name Full indicator
General Service utilization Number of outpatient department visits per person per year
Maternal health Antenatal care 4th visit (ANC4) Number (%) of women aged 15−49 years with a live birth in a given time period who received antenatal care four times or more
Institutional delivery coverage Number and % of deliveries which took place in a health facility
Postpartum care coverage Number (%) of mothers and babies who received postpartum care within two days of childbirth (regardless of place of delivery)
Tetanus toxoid 1st dose coverage Number (%) of pregnant women who received the 1st dose of tetanus-toxoid vaccine
Immunization DTP1-3/Penta1-3 coverage Number (%) of children < 1 year receiving 1 dose, 2 doses, 3 doses of DTP/Penta vaccines
MCV1 coverage Number (%) of infants who have received at least 1 dose of measles-containing vaccine (MCV) by age 1 year
PCV 1-32 coverage Number (%) of children < 1 year receiving 1 dose, 2 doses, 3 doses of pneumococcal vaccines
21
Data
Qua
lity A
ssur
ance
. Mod
ule 2
: Des
k rev
iew
of d
ata q
ualit
y
Additional DQR indicators
Programme area Indicator name Full indicator
HIV/AIDS People living with HIV who have been diagnosed
Number (%) of people living with HIV who have been diagnosed
HIV care coverage Number (%) of people living with HIV who are receiving HIV care (including ART)
PMTCT ART coverage Number (%) of HIV-positive pregnant women who received ART during pregnancy
Currently on ART Number and % of people living with HIV who are currently receiving ART
ART retention Number (%) of people living with HIV and on ART who are retained on ART 12 months after initiation (and at 24, 36, 48 and 60 months)
Viral suppression Number (%) of people on ART who have suppressed viral load
TB Notified cases of all forms of TB Number of new and relapse cases of TB that are notified per 100 000 population − Assess if quarterly case notification report blocks 1 and 21 are correct as per standards and benchmarks (B1.4) for paper-based systems2
TB treatment success rate Number (%) of TB cases successfully treated (cured plus treatment completed) among TB cases notified to the national health authorities during a specified period − Assess if quarterly treatment outcome report block 1 is correct as per standards and benchmarks (B.14) for paper-based systems
Second-line TB treatment success rate Number (%) of TB cases successfully treated (cured plus treatment completed) among all confirmed RR-TB/MDR-TB cases started on second-line treatment during the period of assessment
TB-HIV Proportion of registered new and relapse TB patients with documented HIV status
Number of new and relapse TB patients who had an HIV test result recorded in the TB register, expressed as a percentage of the number registered during the reporting period
Proportion of HIV-positive new and relapse TB patients on ART during TB treatment
Number of HIV-positive new and relapse TB patients who received ART during TB treatment expressed as a percentage of those registered during the reporting period
Malaria Proportion of malaria suspects tested Number (%) of all suspected malaria cases that received a parasitological test [= number tested / Number of suspected cases of malaria]
Confirmed malaria cases cases treated with 1st line treatment course (including ACTs)
Number (%) of confirmed malaria cases treated that received first-line antimalarial treatment according to national policy at public-sector facilities
Malaria cases (presumed and confirmed) treated with 1st line treatment course (including ACTs)
Number (%) of malaria cases (presumed and confirmed) that received first-line antimalarial treatment
IPTp3 Number (%) of pregnant women attending antenatal clinics who received 3 or more doses of intermittent preventive treatment for malaria
ANC = antenatal care; ART = antiretroviral therapy; DTP = diphtheria-tetanus-pertussis; MCV = measles-containing vaccine; MDR-TB = multidrug-resistant tuberculosis; PCV = pneumococcal conjugate vaccine; PMTCT = Prevention of mother-to-child transmission; RR = rifampicin-resistant; TB = tuberculosis.
1 Definitions and reporting framework for tuberculosis – 2013 revision. Document: WHO/HTM/TB/2013.2. Geneva: World Health Organization; 2013 (http://apps.who.int/iris/bitstream/10665/79199/1/9789241505345_eng.pdf?ua=1, accessed 11 June 2015).
2 Standards and benchmarks for tuberculosis surveillance and vital registration systems: checklist and user guide. Document: WHO/HTM/TB/2014.02. Geneva: World Health Organization; 2014 (http://apps.who.int/iris/bitstream/10665/112673/1/9789241506724_eng.pdf?ua=1, accessed 11 June 2015).
22
Anne
x 2. D
efin
ition
s and
requ
irem
ents
for t
he ca
lcula
tion
of m
etric
s for
the d
esk r
evie
w o
f dat
a qua
lity
Annex 2: Definitions and requirements for the calculation of metrics for the desk review of data quality
The data quality metrics examples presented below are for the discrete DQR recommended to be conducted before an annual health-sector review event/report. When the DQR metrics are applied to a continuous review of data quality – especially dimensions 1 and 2 – the definition of the metrics remains the same, with some adjustments made to the time period of analyses. Examples of data quality metrics for continuous monitoring of data quality, the related outputs and interpretations are presented and discussed further in the documentation for the WHO DQ app in DHIS 2.
Dimension 1. Completeness and timeliness of dataThis dimension measures the extent to which data that are reported through the system used for planning, monitoring and evaluation are available and adequate for these purposes. Are the data complete enough to determine whether the health programme is effective and is achieving the desired results? Are the data sufficiently recent that achievements (or gaps) indicated by the data accurately reflect the current level of achievement of health indicators? The DQR methodology measures completeness of data by examining whether all entities that are supposed to report are in fact reporting. The indicators in this dimension include completeness of reporting at the health-facility level (usually the level of the first administrative unit), completeness of reporting at levels higher than the health facility (e.g. the district), and the completeness of data elements in submitted reports (i.e. identification of missing data) on programme indicators across the selected programme areas.
Data quality metric: completeness and timeliness of administrative unit reporting
DefinitionCompleteness of administrative unit reporting (e.g. district, regional or provincial reporting) is defined as the number of monthly reports received from administrative units divided by the total number of reports expected for a specified time period (usually one year). A completeness rate of 100% indicates that all units reported (Box A2.1).
23
Data
Qua
lity A
ssur
ance
. Mod
ule 2
: Des
k rev
iew
of d
ata q
ualit
y
It is recommended that the timeliness of reporting should also be evaluated. Timeliness is defined as the number of reports from subnational administrative units submitted to the national level by the reporting deadline divided by the number of reports actually received. Both completeness and timeliness of reporting are likely to vary by reporting form. WHO’s Excel-based DQR tool examines reporting completeness and timeliness only for a single form (e.g. the main, monthly HMIS form).
Data requirements
NationalNumber of reports received at the national level from the immediately preceding subnational level (e.g. district, region or province) for the selected period.
Number of reports expected for the period.
SubnationalNumber of reports received from health facilities by month and by district for the selected period.
Number of reports expected by month and by district.
Calculation
NationalThe number of administrative unit monthly reports received divided by the total number of reports expected for a specified time period. A completeness rate of 100% indicates that all units reported.
SubnationalAt the subnational level, a completeness rate is computed for each administrative unit over the specified period. Administrative units that have a completeness rate of 75% or less are considered to have poor reporting (three or more missing reports for the year).
24

Anne
x 2. D
efin
ition
s and
requ
irem
ents
for t
he ca
lcula
tion
of m
etric
s for
the d
esk r
evie
w o
f dat
a qua
lity
BOX A2.1. EXAMPLE: COMPLETENESS OF ADMINISTRATIVE UNIT REPORTING
At national level, if the country has 10 districts, the expected number of reports would be 120 reports (10 reports per month x 12 months). The actual number of reports received was 97 (shown in Table A2.1a). Therefore, the completeness rate would be 97/120 = 81%.
At the subnational level, the example assumes there are 10 districts that are expected to report monthly. Table A2.1a shows an example of monthly reporting by 10 districts over a period of 12 months. Five of the 10 districts (50%) have completeness reporting rates of 75% or less, while 3 out of 10 districts have 100% reporting completeness rates.
Table A2.1a District reporting example
District health offices submitting monthly reports on time are indicated with tick marks. Districts with poor reporting (i.e. completeness rate ≤ 75%) are shown in red.
Month
Total Completeness rate1 2 3 4 5 6 7 8 9 10 11 12
District 1 ü ü ü ü ü ü ü ü ü 9 75%
District 2 ü ü ü ü ü ü ü ü ü ü ü ü 12 100%
District 3 ü ü ü ü ü ü ü ü ü ü ü ü 12 100%
District 4 ü ü ü ü ü ü ü ü ü ü 10 83%
District 5 ü ü ü ü ü ü ü ü ü ü ü 11 92%
District 6 ü ü ü ü ü ü ü ü ü 9 75%
District 7 ü ü ü ü ü ü ü 7 58%
District 8 ü ü ü ü ü ü ü ü ü ü ü ü 12 100%
District 9 ü ü ü ü ü ü ü 7 58%
District 10 ü ü ü ü ü ü ü ü 8 67%
National 10 8 6 8 7 10 8 8 9 9 8 6 97 81%
Table A2.1b Summary results example
Metric Results
National district monthly reporting completeness rate 81%
Number (%) of districts with completeness rate below 75% 5 (50%)
Districts with completeness rate below 75% District 1, District 6, District 7, District 9, District 10
Number (%) of districts with 100% of expected reports 3 (30%)
Districts with 100% of expected reports District 2, District 3, District 8
25

Data
Qua
lity A
ssur
ance
. Mod
ule 2
: Des
k rev
iew
of d
ata q
ualit
y
Data quality metric: completeness and timeliness of facility reporting
DefinitionCompleteness of facility reporting is defined as the number of reports received from all health facilities nationally, divided by the total number of expected reports from all facilities that are supposed to report to the HMIS for a specified time period (usually one year). The numerator is the actual number of facilities that submit a report and the denominator is the total number of health facilities that are expected to submit a report (Box A2.2).
Timeliness of facility reporting is defined similarly – i.e. the proportion of reports received from health facilities by subnational administrative units by the deadline for reporting.
Data requirementsThe total number of reports received in the fiscal year of analysis from health facilities in the administrative level of analysis (e.g. district) – for instance, the total number of health facilities’ monthly reports received for January−December 2012 by the administrative level of analysis. For timeliness, the data requirement is the number of reports received by the deadline for reporting.The total number of health facilities by administrative level of analysis should include only the facilities that are expected to report to the HMIS system (or any other programme reporting system). If private facilities in a district are not expected to report to any system, they should not be included in this total count. Timeliness refers to the number of reports received by the deadline for reporting.
Calculation
NationalThe number of reports received from all health facilities nationally, divided by the total expected reports from all facilities that are supposed to report to the HMIS for a specified time period (usually one year).
SubnationalThe facility reporting completeness rate is computed for each administrative unit over the specified time period (usually one year). The number of health facilities that submit a report is divided by the number of facilities expected to submit a report for each administrative unit. Administrative units with reporting rates of 75% or less for facilities within their administrative boundaries are considered to have poor reporting completeness.
26
Anne
x 2. D
efin
ition
s and
requ
irem
ents
for t
he ca
lcula
tion
of m
etric
s for
the d
esk r
evie
w o
f dat
a qua
lity
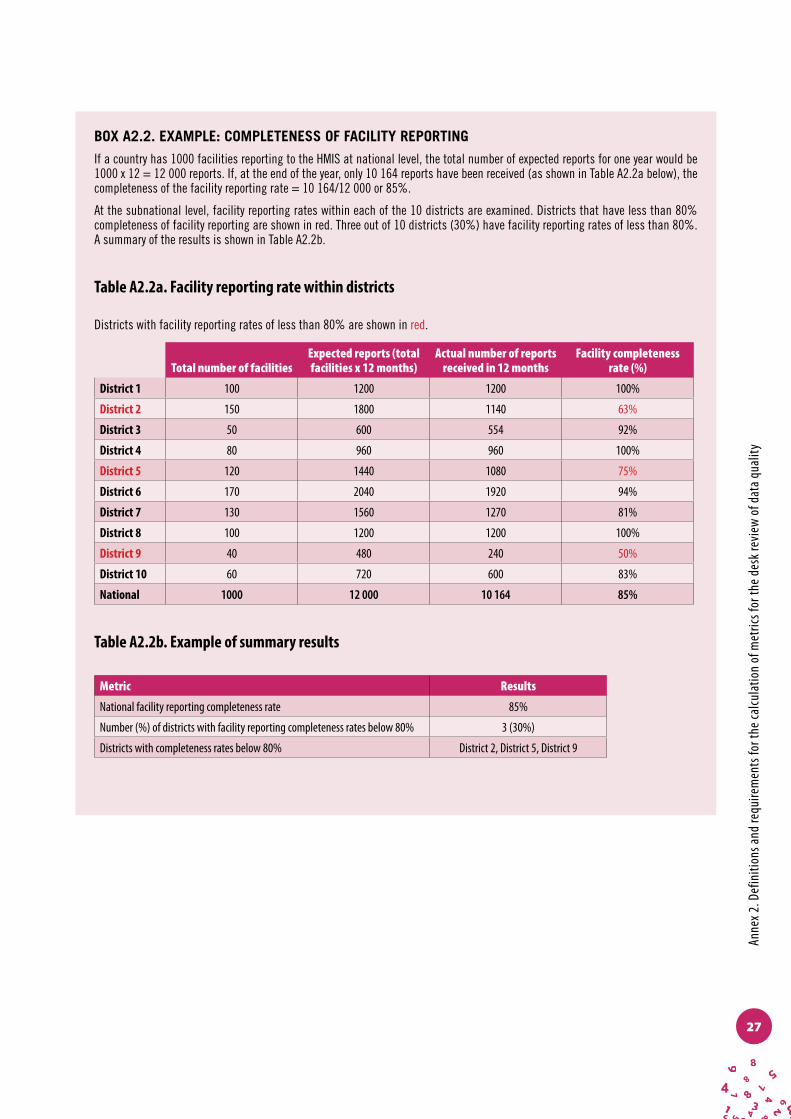
BOX A2.2. EXAMPLE: COMPLETENESS OF FACILITY REPORTING
If a country has 1000 facilities reporting to the HMIS at national level, the total number of expected reports for one year would be 1000 x 12 = 12 000 reports. If, at the end of the year, only 10 164 reports have been received (as shown in Table A2.2a below), the completeness of the facility reporting rate = 10 164/12 000 or 85%.
At the subnational level, facility reporting rates within each of the 10 districts are examined. Districts that have less than 80% completeness of facility reporting are shown in red. Three out of 10 districts (30%) have facility reporting rates of less than 80%. A summary of the results is shown in Table A2.2b.
Table A2.2a. Facility reporting rate within districts
Districts with facility reporting rates of less than 80% are shown in red.
Total number of facilitiesExpected reports (total facilities x 12 months)
Actual number of reports received in 12 months
Facility completeness rate (%)
District 1 100 1200 1200 100%
District 2 150 1800 1140 63%
District 3 50 600 554 92%
District 4 80 960 960 100%
District 5 120 1440 1080 75%
District 6 170 2040 1920 94%
District 7 130 1560 1270 81%
District 8 100 1200 1200 100%
District 9 40 480 240 50%
District 10 60 720 600 83%
National 1000 12 000 10 164 85%
Table A2.2b. Example of summary results
Metric Results
National facility reporting completeness rate 85%
Number (%) of districts with facility reporting completeness rates below 80% 3 (30%)
Districts with completeness rates below 80% District 2, District 5, District 9
27

Data
Qua
lity A
ssur
ance
. Mod
ule 2
: Des
k rev
iew
of d
ata q
ualit
y
Data quality metric: completeness of indicator data
DefinitionCompleteness of indicator data is measured by examining the proportion of non-zero values for specific indicators. This is achieved in two ways: 1) by measuring on reporting forms the proportion of blank cells (i.e. the cells where a specific indicator value should be recorded); and 2) by measuring the proportion of cells with a zero recorded as the value.
Missing data should be clearly differentiated from true zero values in district and facility reports. A true zero value indicates that no reportable events occurred during the specified reporting period; a missing value indicates that reportable events occurred but were not in fact reported. In many HMIS reports, missing entries are assigned a value of zero, making it impossible to distinguish between a true zero value (no events occurred) and a missing value (events occurred but were not reported). Because it is difficult to differentiate between a true zero value and a true missing value, both these criteria are assessed here. The results of these indicators must be interpreted by data managers and programme managers to ascertain whether zero values represent true zeros (Box A2.3).
Data requirements
NationalNumber of missing values for selected indicators on reports from administrative units. Number of zero values for selected indicators on reports from administrative units. Number of reports received from administrative units at the national level.
SubnationalNumber of health-facility reports in which no value is recorded for selected indicators in place of an expected indicator value.
Number of health-facility reports in which a zero value is recorded for selected indicators in place of an expected indicator value.
Number of health-facility reports received for the specified reporting period.1
1 These data may not be available at national level.
28
Anne
x 2. D
efin
ition
s and
requ
irem
ents
for t
he ca
lcula
tion
of m
etric
s for
the d
esk r
evie
w o
f dat
a qua
lity
Calculation
National î Completeness of indicator data (zero) (%) is defined as the average percentage of monthly
values for selected indicators combined that are not zero for the specified time period (usually one year). Therefore the indicator is calculated by subtracting the percentage of values that are zeros from 100%.
î Completeness of indicator data (missing) (%) is defined as the average percentage of monthly values for selected indicators combined that are non-missing for the specified time period (usually one year). Therefore the indicator is calculated by subtracting the percentage of values that are missing from 100%.
SubnationalAt subnational level (e.g. district, province or region), this indicator is defined as the percentage of administrative units in which < 90% of the monthly values are non-zero values. This percentage is calculated by summing all the zero values within an administrative unit for each selected indicator for a specified time period, and then dividing by the total number of expected values for the administrative unit for the same specified time period.
The percentage of administrative units in which non-missing values account for < 90% of monthly values on submitted reports is calculated as above.
Note that the quality threshold for this metric will vary by health programme (and possibly by country).
29

Data
Qua
lity A
ssur
ance
. Mod
ule 2
: Des
k rev
iew
of d
ata q
ualit
y
BOX A2.3. EXAMPLE: COMPLETENESS OF INDICATOR DATA − MISSING VALUES AT NATIONAL AND SUBNATIONAL LEVELS
(Use the same procedure as that used to identify the extent of zero values in reported data.)
The example in Table A2.3a below shows the percentage of missing values for ANC1. Each ‘ü’means that the district had a non-missing value for the month in question. When examining monthly district-level data for ANC1 over a period of one year, it is seen that, nationally, district data show that values are missing on 21 occasions. (The same procedure should be followed to calculate the percentage of zero values.)
The numerator (21) is the national total of missing values for ANC1 at district level. The denominator is the total expected number of values. With 10 districts and 12 expected monthly values for ANC1 in each district, the total of expected values nationally is 120. The total percentage of missing values nationally for ANC1 is 17.5% (21/120). However, since we are calculating values that are not missing, the indicator is 100% minus 17.5% = 82.5%.
At the subnational level, Table A2.3a shows that 5 out of 10 districts (50%) have more than 10% missing values for ANC1 within their districts.
Table A2.3a: Missing values by district for ANC1
Districts are marked in red if 10% or more of their values are missing values.
Month
Total Completeness rate1 2 3 4 5 6 7 8 9 10 11 12
District 1 ü ü ü ü ü ü ü ü ü ü 2 83%
District 2 ü ü ü ü ü ü ü ü ü ü ü ü 0 100%
District 3 ü ü ü ü ü ü ü ü ü ü ü ü 0 100%
District 4 ü ü ü ü ü ü ü ü ü ü ü 1 92%
District 5 ü ü ü ü ü ü ü ü ü ü ü 1 92%
District 6 ü ü ü ü ü ü ü ü ü 3 75%
District 7 ü ü ü ü ü ü ü 5 58%
District 8 ü ü ü ü ü ü ü ü ü ü ü ü 0 100%
District 9 ü ü ü ü ü ü ü 5 58%
District 10 ü ü ü ü ü ü ü ü 4 67%
National 0 2 4 2 3 0 2 1 1 0 2 4 21 17.5%
Table A2.3b. Example of summary results
Metric Results
National district monthly reporting completeness rate 100% minus 17.5% = 82.5%
Number (%) of districts with completeness rate below 90% 5 (50%)
Districts with completeness rate below 90% District 1, District 6, District 7, District 9, District 10
30
Anne
x 2. D
efin
ition
s and
requ
irem
ents
for t
he ca
lcula
tion
of m
etric
s for
the d
esk r
evie
w o
f dat
a qua
lity
Dimension 2. Internal consistency of reported dataThis dimension examines the plausibility of reported results for selected programme indicators based on the history of reporting of those indicators. Trends in reported data are evaluated over time (one year) to assess whether specific reported values (e.g. for a particular month or months) within the selected period are extreme in relation to the other values reported and if they are potentially indicative of problems in data quality. Trends in reporting over multiple years are also evaluated in order to identify extreme or implausible values year-to-year.
Within this dimension, the results of programme indicators are compared to other indicators with which they have a predictable relationship to determine whether the expected relationship exists between the two indicators. In other words, is the observed relationship between the indicators, as reflected in the reported data, that which we would expect on the basis of our knowledge of the indicators, the health programme and the country?
This dimension also seeks to determine the accuracy of reporting of selected indicators on the basis of review of source documents (i.e. the documents in which reported events are first recorded) in order to compare reported values to a validated value. This aspect of the DQR is conducted through a health-facility assessment linked to the implementation of the DQR (see “Data verification” below).
Data quality metric: outliers in the current year
DefinitionAn outlier is defined as a value in a series of values that is extreme in relation to the other values in the series. Outliers can be the result of changes in programmatic activities (such as an intensified campaign) or of data quality problems. Extreme values should be identified and investigated to determine whether they are valid or if they are the result of insufficiencies in data quality. Two types of outliers – moderate and extreme – are defined below. It is important to note, however, that moderate outliers might be plausible fluctuations of service delivery and not necessarily the result of problems of data quality. Knowledge of programme data is necessary when examining and interpreting these data. It is more important to focus on extreme outliers − i.e. the values that have the most distorting effect on the statistics and which demand assertive follow-up (Box A2.4).
Outliers can be identified by various methods, though it is recommended that one of the following methods be used:
î Multiples of the standard deviation of the mean: Values in a series greater than multiples of the standard deviation (SD) of the mean of the series of values (i.e. ± 2SD, ± 3SD, etc.) are identified as potential outliers and are assessed for problems of data quality. Outliers identified as greater than 2SD from the mean are considered as “moderate” outliers, while
31

Data
Qua
lity A
ssur
ance
. Mod
ule 2
: Des
k rev
iew
of d
ata q
ualit
y
those identified as greater than 3SD from the mean are considered “extreme” outliers. î Modified z-score: The z-score of an observation refers to the number of standard deviations
from the mean. A “modified z-score” applies the median computation technique to measure the deviation and, in many cases, provides more robust statistical detection of outliers (than use of the mean). This method is useful for small samples and is more tolerant than the z-score to extreme values. Mathematically, the modified z-score can be written as:
Mi = 0.6745 * (Xi -Median(Xi)) / MAD,
where MAD is defined as the median absolute deviation. MAD = median(|Xi - (X|), where X is the median of the series. Any number in a data set with the absolute value of modified Z-score exceeding 3.5 is considered an outlier.2,3
Data requirements
NationalMonthly indicator values are needed for selected indicators from administrative units reporting to the national level from HMIS reports (or database) for the selected period. Identify extreme values (outliers) by selecting one of the above methods.
SubnationalMonthly indicator values are required for selected indicators from health facilities based on HMIS reports (or database) for the selected period. Identify extreme values (outliers) by selecting one of the above methods.
Calculation
NationalModerate outliers for monthly values of a selected indicator are identified from values reported for a given period using the methods described above. The total number is divided by the expected number of values for the indicator. If the period of analysis is one year and reporting is monthly, the total number of expected values for one indicator equals the total number of administrative units of analysis multiplied by 12. A similar calculation is performed for extreme outliers.
2 Iglewicz B, Hoaglin D. The ASQC basic references in quality control: statistical techniques. Volume 16: How to detect and handle outliers. Milwaukee (WI): American Society for Quality; 1993.
3 While the current definition for extreme outlier does not use the modified z-score, as there is less of a consensus among statisticians on the use of the modified z-score to define extreme outliers, the WHO DQ app in DHIS 2 has configured the use of a modified z-score of 5.0 as the threshold for an extreme outlier as well as using ± 3SD from the mean. The Excel tool for desk review of data quality only uses ± 3SD.
32
Anne
x 2. D
efin
ition
s and
requ
irem
ents
for t
he ca
lcula
tion
of m
etric
s for
the d
esk r
evie
w o
f dat
a qua
lity
SubnationalModerate outliers: At the subnational level (e.g. district, province or region), the aim is to calculate the percentage of administrative units in which two or more of the monthly values of the selected indicator are moderate outliers (± 2−3 SD from the administrative unit mean, or a value of > 3.5 on the modified z-score). This percentage is calculated by identifying and counting all moderate outliers within an administrative unit for the selected indicator for a specified period of time and dividing the result by the total number of expected values for the indicator in the administrative unit for the same period of time.
Extreme outliers: At the subnational level, the percentage of administrative units in which one or more of the monthly administrative unit values for the selected indicator is an extreme outlier (± 3SD from the administrative unit mean) is calculated by dividing the total number of administrative units with extreme outliers for the specified time period by the total number of administrative units.
33

Data
Qua
lity A
ssur
ance
. Mod
ule 2
: Des
k rev
iew
of d
ata q
ualit
y
BOX A2.4. EXAMPLE: OUTLIERS IN THE CURRENT YEAR
Table A2.4a below shows moderate outliers for ANC1. There are nine moderate outliers for ANC1, and these are highlighted in red. Eight of the districts have at least one occurrence of a monthly ANC1 value that is a moderate outlier.
Table A2.4a Monthly ANC1 values by district
Values in red are moderate outliers.
Month
Total
% of values that are outliers1 2 3 4 5 6 7 8 9 10 11 12
District 1 2543 2482 2492 2574 3012 2709 3019 2750 3127 2841 2725 2103 1 8.3%
District 2 1547 1340 1403 1593 2161 1729 1646 1642 1355 1581 1412 1410 1 8.3%
District 3 776 541 515 527 857 782 735 694 687 628 596 543 0 0.0%
District 4 1184 1118 1195 1228 1601 1324 1322 711 1160 1178 1084 1112 2 16.7%
District 5 1956 1773 1768 2062 2997 2056 1839 1842 2028 2002 2032 1904 1 8.3%
District 6 819 788 832 802 999 596 672 792 933 1134 810 789 1 8.3%
District 7 781 1199 981 963 818 897 853 736 2208 2734 1323 1229 1 8.3%
District 8 1382 1379 1134 1378 1417 1302 1415 1169 1369 1184 1207 1079 0 0.0%
District 9 1992 1751 1658 1823 3306 2692 2300 2218 2026 2003 1752 1753 1 8.3%
District 10 3114 2931 2956 4637 6288 4340 3788 3939 3708 4035 3738 3606 1 8.3%
National 0 0 0 0 5 0 0 1 0 2 0 1 9 6.7%
Nationally, this indicator is a percentage of values that are moderate outliers for the indicator. The numerator is the number of outliers across all administrative units (9). The denominator, which is the total number of expected reported values for the indicator for all the administrative units, is calculated by multiplying the total number of units (at the level of the selected administrative unit) by the expected number of reported values for one indicator for one administrative unit. The denominator is then calculated as follows: 10 districts x 12 expected monthly reported values per district for one indicator = 120 total expected reported values. The average percentage of reported values that are moderate outliers equals (9/120) x 100 ≈ 7.5%.
Subnationally, the number of outliers is calculated for each district. This is done by counting the districts where there are two or more outliers (for moderate outliers) among the monthly values for the district. This is then divided by the total number of administrative units: 1/10 = 0.1 x 100% = 10%.
Table A2.4b. Example of summary results
Metric Results
% of district monthly values that are moderate outliers (± 2−3 SD from the district mean) 7.5%
Number and % of districts in which two or more of the monthly district values for the indicator are moderate outliers (± 2−3 SD from the district mean)
1, 10.0%
34
Anne
x 2. D
efin
ition
s and
requ
irem
ents
for t
he ca
lcula
tion
of m
etric
s for
the d
esk r
evie
w o
f dat
a qua
lity
Data quality metric: consistency over time
DefinitionConsistency over time (%) is defined as the average ratio of events or service outputs for the current year of analysis to the mean events/service outputs of up to three preceding years for selected indicators. Consistency over time is also measured as a comparison of the current year to the value predicted from the trend over the three preceding years for indicators or programmes with expected growth or decline. Current-year values are compared to forecasted values (the value predicted by the slope of the values of the three previous years) for indicators with nonconstant trend (i.e. increasing or decreasing) (Box A2.5).
This indicator shows the consistency of the values for key indicators in the most recent year compared with the mean value of the same indicator for the previous three years combined (or the forecasted value for indicators with nonconstant trend). Differences in values are expected from one year to the next; however, differences that are very large warrant further scrutiny. While large differences usually suggest some type of reporting error, it is also possible that the introduction of a new intervention may contribute to a large percentage increase in indicator values from one year to the next. Hence, interpretation of the results with programme managers is critical.
Data requirementsAnnual totals by subnational unit are required for selected indicators for the year of analysis plus the preceding three years.
Calculation
NationalAt the national level this indicator is as defined above. It is the ratio of the current year total to the average of the preceding three years, or the current year value compared to the value forecasted from the three previous years of values for indicators with nonconstant trend (i.e. increasing or decreasing).
SubnationalSubnationally, this indicator looks at the percentage of administrative units at the selected administrative level of analysis with at least 33% difference between their ratio and the national ratio for selected indicators.
Alternatively, the subnational unit ratios can be compared to the “expected value” – i.e. equality between the current-year value and the average of the three preceding years (or forecasted value). For this comparison, the subnational unit value is compared to 1± the quality threshold. For example, if the quality threshold is set at 33%, subnational units with ratios ≥ 133% or ≤ 67% would be flagged as indicating potential data quality problems.
35
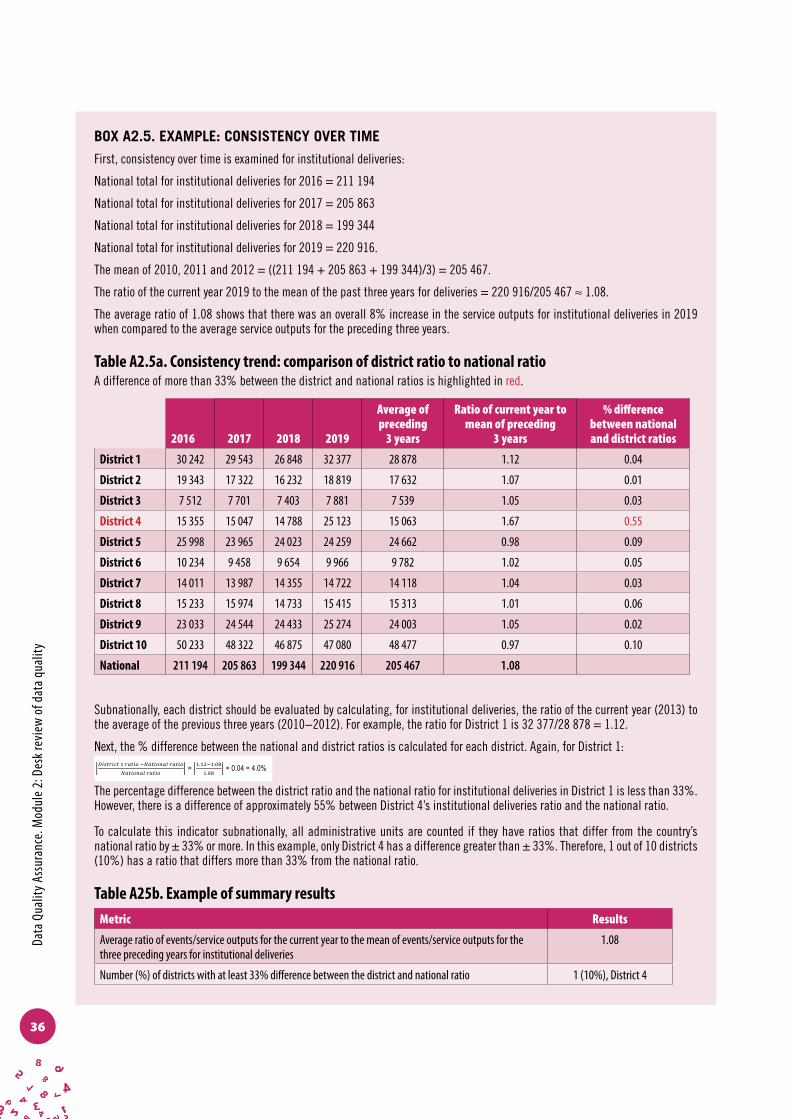
Data
Qua
lity A
ssur
ance
. Mod
ule 2
: Des
k rev
iew
of d
ata q
ualit
y
BOX A2.5. EXAMPLE: CONSISTENCY OVER TIME
First, consistency over time is examined for institutional deliveries:
National total for institutional deliveries for 2016 = 211 194
National total for institutional deliveries for 2017 = 205 863
National total for institutional deliveries for 2018 = 199 344
National total for institutional deliveries for 2019 = 220 916.
The mean of 2010, 2011 and 2012 = ((211 194 + 205 863 + 199 344)/3) = 205 467.
The ratio of the current year 2019 to the mean of the past three years for deliveries = 220 916/205 467 ≈ 1.08.
The average ratio of 1.08 shows that there was an overall 8% increase in the service outputs for institutional deliveries in 2019 when compared to the average service outputs for the preceding three years.
Table A2.5a. Consistency trend: comparison of district ratio to national ratioA difference of more than 33% between the district and national ratios is highlighted in red.
2016 2017 2018 2019
Average of preceding
3 years
Ratio of current year to mean of preceding
3 years
% difference between national and district ratios
District 1 30 242 29 543 26 848 32 377 28 878 1.12 0.04
District 2 19 343 17 322 16 232 18 819 17 632 1.07 0.01
District 3 7 512 7 701 7 403 7 881 7 539 1.05 0.03
District 4 15 355 15 047 14 788 25 123 15 063 1.67 0.55
District 5 25 998 23 965 24 023 24 259 24 662 0.98 0.09
District 6 10 234 9 458 9 654 9 966 9 782 1.02 0.05
District 7 14 011 13 987 14 355 14 722 14 118 1.04 0.03
District 8 15 233 15 974 14 733 15 415 15 313 1.01 0.06
District 9 23 033 24 544 24 433 25 274 24 003 1.05 0.02
District 10 50 233 48 322 46 875 47 080 48 477 0.97 0.10
National 211 194 205 863 199 344 220 916 205 467 1.08
Subnationally, each district should be evaluated by calculating, for institutional deliveries, the ratio of the current year (2013) to the average of the previous three years (2010−2012). For example, the ratio for District 1 is 32 377/28 878 = 1.12.
Next, the % difference between the national and district ratios is calculated for each district. Again, for District 1:!"!"#$%" ! !"#$% !!"#$%&"' !"#$%
!"#$%&"' !"#$% =
!.!"!!.!"
!.!" = 0.04 = 4.0%
The percentage difference between the district ratio and the national ratio for institutional deliveries in District 1 is less than 33%. However, there is a difference of approximately 55% between District 4’s institutional deliveries ratio and the national ratio.
To calculate this indicator subnationally, all administrative units are counted if they have ratios that differ from the country’s national ratio by ± 33% or more. In this example, only District 4 has a difference greater than ± 33%. Therefore, 1 out of 10 districts (10%) has a ratio that differs more than 33% from the national ratio.
Table A25b. Example of summary resultsMetric Results
Average ratio of events/service outputs for the current year to the mean of events/service outputs for the three preceding years for institutional deliveries
1.08
Number (%) of districts with at least 33% difference between the district and national ratio 1 (10%), District 4
36

Anne
x 2. D
efin
ition
s and
requ
irem
ents
for t
he ca
lcula
tion
of m
etric
s for
the d
esk r
evie
w o
f dat
a qua
lity
Data quality metric: consistency between related indicators
DefinitionThis data quality metric examines the extent to which two related indicators follow a predictable pattern. If this pattern is not followed at the national level or for a particular subpopulation, it may indicate data quality problems (Box A2.6).
Consistency between two indicators is defined as the ratio between the two indicators. For some indicators, the ratio should be 1 or below; for other indicators the ratio is ≥ 1 (see Annex 1 for indicator-specific details).
Data requirementsYearly values of selected indicators at national and subnational levels.
Calculation
NationalAt the national level, this indicator is the ratio of the two selected indicators.
SubnationalFor indicators which should be approximately equal, this indicator shows the percentage of subnational administrative units that have an extreme difference (e.g. ≥ ± 10%). For indicators which should be ≥ 1, districts with ratios of < 1 should be flagged. The number and percentage of subnational units with anomalous values is calculated (i.e. the number of subnational units with anomalous values divided by the total number of subnational administrative units).
The relationship between two indicators at subnational level can also be assessed by comparing their ratio with the ratio between the two indicators at national level. In this instance the ratio percentage difference is calculated between the ratio at subnational level and the ratio at national level. Subnational units with a percentage difference greater than the specified quality threshold (e.g. ≥ 10%) are flagged for follow-up.
37
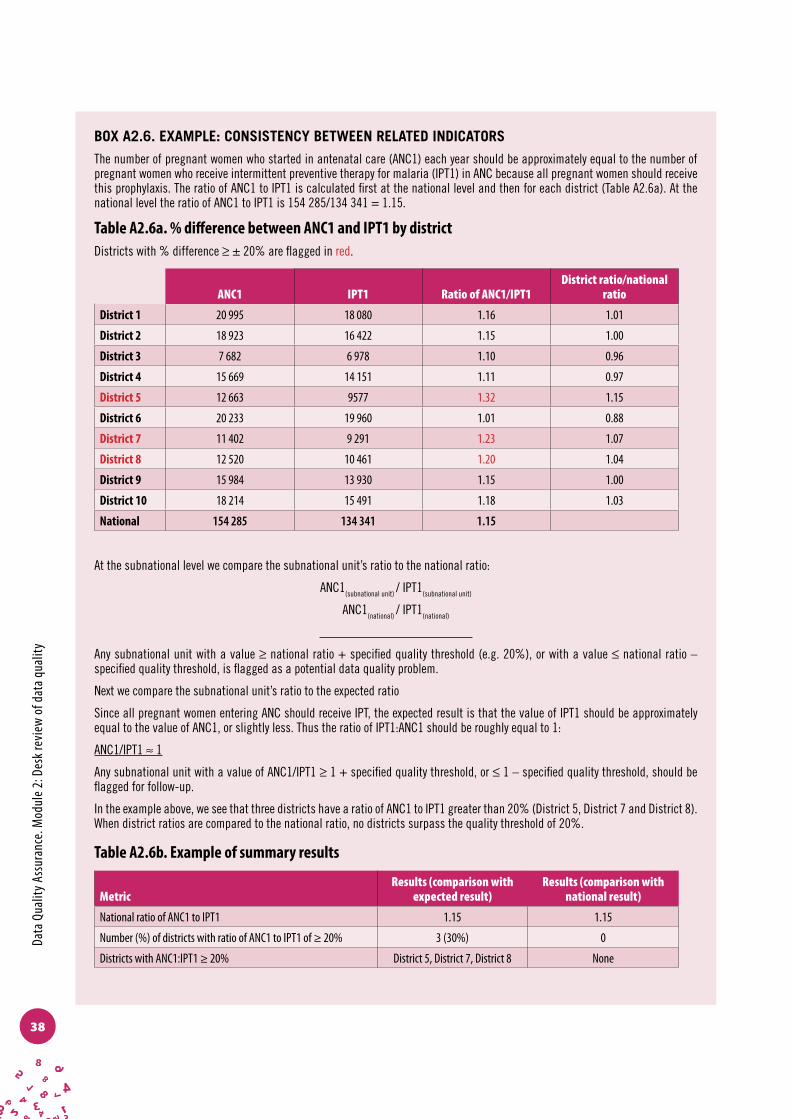
Data
Qua
lity A
ssur
ance
. Mod
ule 2
: Des
k rev
iew
of d
ata q
ualit
y
BOX A2.6. EXAMPLE: CONSISTENCY BETWEEN RELATED INDICATORS
The number of pregnant women who started in antenatal care (ANC1) each year should be approximately equal to the number of pregnant women who receive intermittent preventive therapy for malaria (IPT1) in ANC because all pregnant women should receive this prophylaxis. The ratio of ANC1 to IPT1 is calculated first at the national level and then for each district (Table A2.6a). At the national level the ratio of ANC1 to IPT1 is 154 285/134 341 = 1.15.
Table A2.6a. % difference between ANC1 and IPT1 by districtDistricts with % difference ≥ ± 20% are flagged in red.
ANC1 IPT1 Ratio of ANC1/IPT1District ratio/national
ratio
District 1 20 995 18 080 1.16 1.01
District 2 18 923 16 422 1.15 1.00
District 3 7 682 6 978 1.10 0.96
District 4 15 669 14 151 1.11 0.97
District 5 12 663 9577 1.32 1.15
District 6 20 233 19 960 1.01 0.88
District 7 11 402 9 291 1.23 1.07
District 8 12 520 10 461 1.20 1.04
District 9 15 984 13 930 1.15 1.00
District 10 18 214 15 491 1.18 1.03
National 154 285 134 341 1.15
At the subnational level we compare the subnational unit’s ratio to the national ratio:
ANC1(subnational unit) / IPT1(subnational unit)
ANC1(national) / IPT1(national)
Any subnational unit with a value ≥ national ratio + specified quality threshold (e.g. 20%), or with a value ≤ national ratio – specified quality threshold, is flagged as a potential data quality problem.
Next we compare the subnational unit’s ratio to the expected ratio
Since all pregnant women entering ANC should receive IPT, the expected result is that the value of IPT1 should be approximately equal to the value of ANC1, or slightly less. Thus the ratio of IPT1:ANC1 should be roughly equal to 1:
ANC1/IPT1 ≈ 1
Any subnational unit with a value of ANC1/IPT1 ≥ 1 + specified quality threshold, or ≤ 1 – specified quality threshold, should be flagged for follow-up.
In the example above, we see that three districts have a ratio of ANC1 to IPT1 greater than 20% (District 5, District 7 and District 8). When district ratios are compared to the national ratio, no districts surpass the quality threshold of 20%.
Table A2.6b. Example of summary results
MetricResults (comparison with
expected result)Results (comparison with
national result)
National ratio of ANC1 to IPT1 1.15 1.15
Number (%) of districts with ratio of ANC1 to IPT1 of ≥ 20% 3 (30%) 0
Districts with ANC1:IPT1 ≥ 20% District 5, District 7, District 8 None
38

Anne
x 2. D
efin
ition
s and
requ
irem
ents
for t
he ca
lcula
tion
of m
etric
s for
the d
esk r
evie
w o
f dat
a qua
lity
Dimension 3. External comparison and cross-checks (with other data sources)(Agreement with other sources of data such as surveys)
The purpose of this dimension is to examine the level of agreement (i.e. external consistency) between two sources of data that measure the same health indicator. The two sources of data are: 1) the data that are routinely collected and reported from the HMIS or programme-specific information system; and 2) periodic population-based surveys. Surveys are generally considered to have reliable results since the methods of conducting surveys are highly standardized; great care and expense go into ensuring high-quality implementation and estimates of health indicators. Survey results are often considered to represent the “gold standard” or true value of the indicator in the population.
The expense of surveys means that they cannot be conducted regularly, and there are limitations on the interpretation of survey results in smaller geographical areas. For these reasons, surveys alone are not adequate for routine monitoring of the health sector and programme results.
Although survey results are often considered to have a high standard, surveys are also subject to data quality problems and, if these problems are systematic, the survey-based estimate of coverage may be far from the true value. In addition, surveys are based on a sample and therefore have a range of possible values (i.e. confidence intervals, limits). Confidence intervals are larger if the sample is smaller, and therefore much larger at subnational levels than at the national level. (Confidence intervals are often presented in the annexes of survey reports, such as the Demographic and Health Surveys, or DHS). In a comparison with routine data, the survey confidence limits must be taken into account. If the routine value lies within the range, it cannot be concluded that there is a significant difference from the survey value. Additionally, survey results may reflect past performance (often three or five years before the survey), while coverage rates based on routine data are usually for the most recent year. Thus, any comparison should be made with caution.
Data quality metric: external comparison with survey results DefinitionExternal comparison of selected indicators is defined as the ratio of the coverage derived from routinely reported data (e.g. HMIS) to data from other sources such as the coverage rate derived from household survey data.
39

Data
Qua
lity A
ssur
ance
. Mod
ule 2
: Des
k rev
iew
of d
ata q
ualit
y
Comparison of HMIS values to health programme values for selected indicators can be calculated using the same method as the comparison of routinely reported data to survey results (e.g. comparison of HMIS estimates of immunization coverage with EPI programme estimates of immunization coverage) (Box A2.7).
Data requirementsData requirements are:
î National and subnational administrative values for selected indicators and year; î Appropriate denominators to derive coverage rates for routine data.;Analogous survey
value for the same year from a recent household survey with a methodology that meets international standards for quality (e.g. MICS, DHS).
Calculation
NationalAt the national level this indicator is defined as the ratio of the routine value to the survey value.
SubnationalAt the subnational level, the ratio of coverage rates is calculated for each administrative unit. Any administrative ratio that has at least a 33% difference between the two coverage rates is flagged for review. The number and percentage of administrative units that have at least a 33% difference are then calculated. This comparison is possible only if the survey’s coverage estimates are available for the indicator at the same administrative level. For instance, if the administrative unit of analysis is a district but survey coverage rates for the indicator are not available at the district level, the subnational comparison will not be possible at the district level. However, if provincial or regional-level survey data are available, the comparison can be made at that level, assuming that the survey was performed in the last 2−3 years.
40
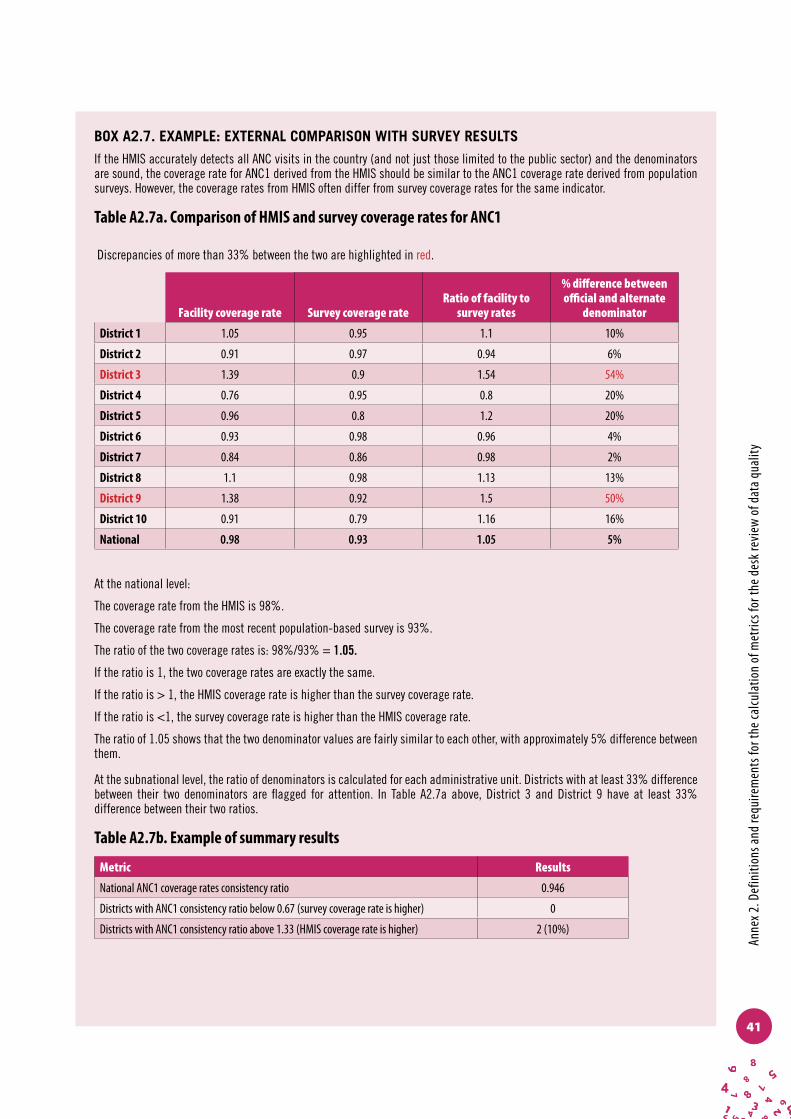
Anne
x 2. D
efin
ition
s and
requ
irem
ents
for t
he ca
lcula
tion
of m
etric
s for
the d
esk r
evie
w o
f dat
a qua
lity
BOX A2.7. EXAMPLE: EXTERNAL COMPARISON WITH SURVEY RESULTS
If the HMIS accurately detects all ANC visits in the country (and not just those limited to the public sector) and the denominators are sound, the coverage rate for ANC1 derived from the HMIS should be similar to the ANC1 coverage rate derived from population surveys. However, the coverage rates from HMIS often differ from survey coverage rates for the same indicator.
Table A2.7a. Comparison of HMIS and survey coverage rates for ANC1
Discrepancies of more than 33% between the two are highlighted in red.
Facility coverage rate Survey coverage rateRatio of facility to
survey rates
% difference between official and alternate
denominator
District 1 1.05 0.95 1.1 10%
District 2 0.91 0.97 0.94 6%
District 3 1.39 0.9 1.54 54%
District 4 0.76 0.95 0.8 20%
District 5 0.96 0.8 1.2 20%
District 6 0.93 0.98 0.96 4%
District 7 0.84 0.86 0.98 2%
District 8 1.1 0.98 1.13 13%
District 9 1.38 0.92 1.5 50%
District 10 0.91 0.79 1.16 16%
National 0.98 0.93 1.05 5%
At the national level:
The coverage rate from the HMIS is 98%.
The coverage rate from the most recent population-based survey is 93%.
The ratio of the two coverage rates is: 98%/93% = 1.05.
If the ratio is 1, the two coverage rates are exactly the same.
If the ratio is > 1, the HMIS coverage rate is higher than the survey coverage rate.
If the ratio is <1, the survey coverage rate is higher than the HMIS coverage rate.
The ratio of 1.05 shows that the two denominator values are fairly similar to each other, with approximately 5% difference between them.
At the subnational level, the ratio of denominators is calculated for each administrative unit. Districts with at least 33% difference between their two denominators are flagged for attention. In Table A2.7a above, District 3 and District 9 have at least 33% difference between their two ratios.
Table A2.7b. Example of summary results
Metric Results
National ANC1 coverage rates consistency ratio 0.946
Districts with ANC1 consistency ratio below 0.67 (survey coverage rate is higher) 0
Districts with ANC1 consistency ratio above 1.33 (HMIS coverage rate is higher) 2 (10%)
41

Data
Qua
lity A
ssur
ance
. Mod
ule 2
: Des
k rev
iew
of d
ata q
ualit
y
Dimension 4. Consistency of population data (Review of denominator data used to measure performance indicators)
The use of population data in the calculation of health indicators allows comparisons of results within or across geographical areas, over time, and between population subgroups. The population data for a specific indicator and a specific geographical area or population subgroup (e.g. pregnant women) serve as the denominator in the calculation of a rate or a proportion and provide context to the numerator (e.g. the number of events, patients, commodities, etc. for the health process in question). The use of population data for calculating indicators is critical to effective monitoring and evaluation of health programmes. However, the quality of population data is known to be poor in many countries. The purpose of this dimension is to determine the adequacy of the population data used in calculating health indicators. This is achieved by looking at consistency in population trends and comparing two different sources of population estimates to assess the level of congruence between the two sources. If the two population estimates are discrepant, or if population estimates differ dramatically over time, the coverage estimates for a given indicator can differ greatly even though the programmatic result is the same (i.e. the number of events). The higher the level of consistency between denominators, the more confidence can be placed in the accuracy of population projections.
Data quality metric: consistency with United Nations population projections
DefinitionFor this indicator, the denominator (total population of interest) used for one of the selected indicators included in the DQR is compared to United Nations population projections. Denominators that are used to calculate rates and ratios are usually derived from the census or civil registration system. Denominators from the census are usually population projections based on estimates of natural growth and migration.
Consistency with United Nations population projections is defined as the ratio between the official country projection for the number of live births or pregnant women divided by the official United Nations projection for the same population for the same year (Box A2.8).
Consistency of denominators between programme data and official government statistics must be considered. If health programmes maintain their own population estimates, as is often the case in immunization programmes which conduct community microplanning, these programme-specific denominators can be compared with the same population estimates of the National Statistics Office using the procedure outlined here (Box A2.9).
42

Anne
x 2. D
efin
ition
s and
requ
irem
ents
for t
he ca
lcula
tion
of m
etric
s for
the d
esk r
evie
w o
f dat
a qua
lity
Data requirementsPopulation estimates are used as denominators for calculating rates for selected indicators. The most common denominator used for calculating ANC rates and delivery rates is the total number of live births in a specified period of time. For immunization, the most common denominator is the total number of surviving infants (total live births adjusted for infant mortality), and for outpatient visits the usual denominator is the total population. Comparable denominators available from United Nations projections are births and total population.
Calculation
NationalAt the national level this indicator is defined as the ratio between the official country projection (from the Census Office or National Statistics Office) and the United Nations population projection.
This quality metric is not calculated for the subnational level.
BOX A2.8. EXAMPLE: CONSISTENCY WITH UNITED NATIONS POPULATION PROJECTIONS
If the official estimate of live births for the year of analysis is 255 000 and the projected United Nations population is 200 000, the ratio of country population estimate to United Nations population projection is 255 000/200 000 ≈ 1.28.
This ratio shows that the country population estimate for live births is higher than the United Nations population projection for the same year.
Data quality metric: consistency between related denominators
DefinitionThis metric measures the consistency of population estimates used for the calculation of health-system performance indicators. Different comparisons can be conducted. For example, population data for common indicators from official government sources (e.g. National Statistics Office, or NSO) are compared to values for the same populations used by health programmes (if applicable) to determine the level of agreement between the two sources. Other comparisons can include comparing expected pregnancies to live births and the population under 1 year.
Data requirementsExample of comparison of official NSO population denominator with a programme-specific denominator (not all comparisons are presented below. The same logic can be used for other comparisons).
43

Data
Qua
lity A
ssur
ance
. Mod
ule 2
: Des
k rev
iew
of d
ata q
ualit
y
NationalOfficial government population estimates are required for denominators used in the calculation of rates for selected indicators for the year of analysis (live births, expected pregnancies, children < 1 year, total population). Data for analogous subpopulations used by health programmes are also needed.
SubnationalSubnational administrative unit population estimates are required for denominators used in the calculation of rates for selected indicators for the year of analysis.
CalculationNational values from official government statistics for live births, expected pregnancies, children < 1 year and the total population are divided by analogous health programme values to determine if there is agreement. Values that differ significantly (10% recommended, but the proportion can also be defined by users) are flagged for review.
At the subnational level, this indicator is defined as the number and percentage of subnational units where there is a significant discrepancy (± 10%) between the two denominators.
(The same methodology can be used for other examples. For instance, live births can be compared to children < 1 year.)
44
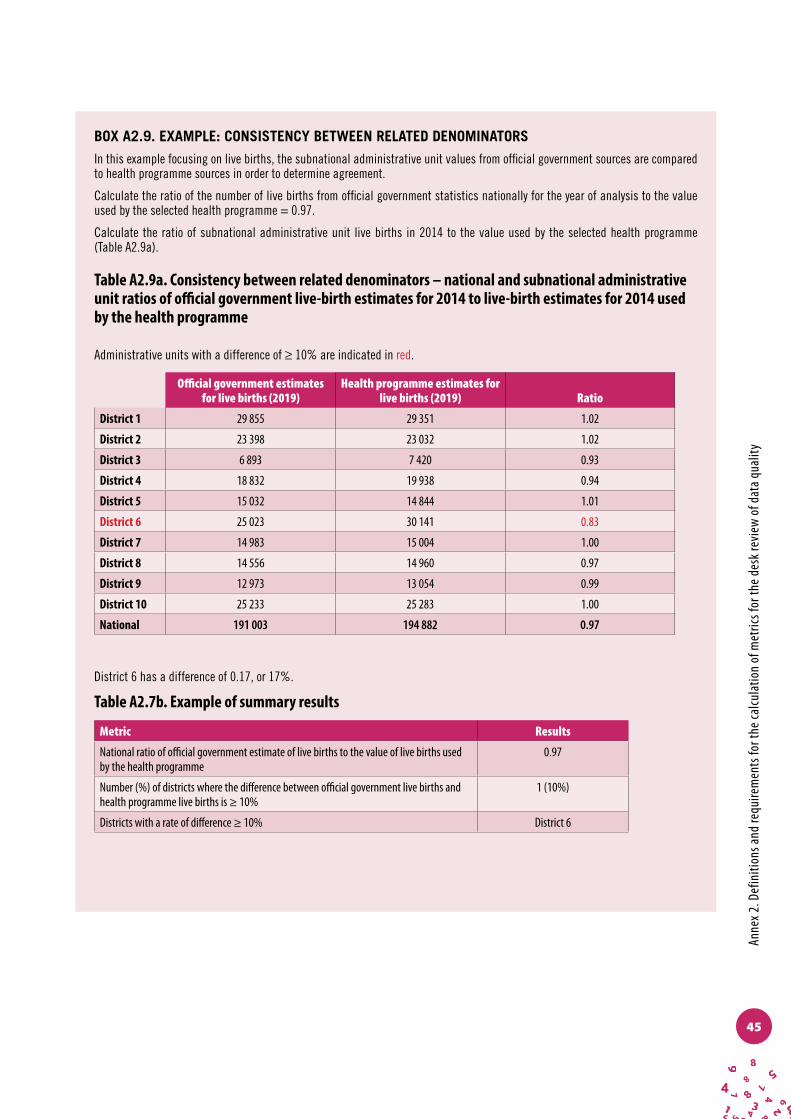
Anne
x 2. D
efin
ition
s and
requ
irem
ents
for t
he ca
lcula
tion
of m
etric
s for
the d
esk r
evie
w o
f dat
a qua
lity
BOX A2.9. EXAMPLE: CONSISTENCY BETWEEN RELATED DENOMINATORS
In this example focusing on live births, the subnational administrative unit values from official government sources are compared to health programme sources in order to determine agreement.
Calculate the ratio of the number of live births from official government statistics nationally for the year of analysis to the value used by the selected health programme = 0.97.
Calculate the ratio of subnational administrative unit live births in 2014 to the value used by the selected health programme (Table A2.9a).
Table A2.9a. Consistency between related denominators – national and subnational administrative unit ratios of official government live-birth estimates for 2014 to live-birth estimates for 2014 used by the health programme
Administrative units with a difference of ≥ 10% are indicated in red.
Official government estimates for live births (2019)
Health programme estimates for live births (2019) Ratio
District 1 29 855 29 351 1.02
District 2 23 398 23 032 1.02
District 3 6 893 7 420 0.93
District 4 18 832 19 938 0.94
District 5 15 032 14 844 1.01
District 6 25 023 30 141 0.83
District 7 14 983 15 004 1.00
District 8 14 556 14 960 0.97
District 9 12 973 13 054 0.99
District 10 25 233 25 283 1.00
National 191 003 194 882 0.97
District 6 has a difference of 0.17, or 17%.
Table A2.7b. Example of summary results
Metric Results
National ratio of official government estimate of live births to the value of live births used by the health programme
0.97
Number (%) of districts where the difference between official government live births and health programme live births is ≥ 10%
1 (10%)
Districts with a rate of difference ≥ 10% District 6
45

Data
Qua
lity A
ssur
ance
. Mod
ule 2
: Des
k rev
iew
of d
ata q
ualit
y
Data quality metric: consistency of population trend
DefinitionThere should be no large fluctuations in population trends as population estimates usually follow a predictable trajectory. A marked difference in year-to-year population estimates requires investigation. While there are times when fluctuations happen, consistency over time is also measured as a comparison of the current year to the value predicted from the trend over the three preceding years for selected indicators. Current-year values are compared to forecasted values (the value predicted by the slope of the values of three previous years).
Differences in values are expected from one year to the next; however, differences that are very large (greater than ± 10%) warrant further scrutiny.
Data requirementsAnnual totals by subnational unit for selected indicators for the year of analysis plus the preceding three years.
Calculation
NationalAt the national level this indicator is defined as above – the ratio of the current year value compared to the value forecasted from the three previous years of values for indicators with nonconstant trend (i.e. increasing or decreasing).
SubnationalSubnationally, the indicator looks at the percentage of administrative units at the selected administrative level of analysis that have at least 10% difference between their ratio and the national ratio for selected indicators.
Alternatively, the subnational unit ratios can be compared to the “expected value” – i.e. equality between the current-year value and the forecasted value. For this comparison, the subnational unit value is compared to 1± the quality threshold. For example, if the quality threshold is set at 33%, subnational units with ratios ≥ 133% or ≤ 67% would be flagged as potential data quality problems.
46

Anne
x 2. D
efin
ition
s and
requ
irem
ents
for t
he ca
lcula
tion
of m
etric
s for
the d
esk r
evie
w o
f dat
a qua
lity
BOX A2.10. EXAMPLE: CONSISTENCY OF POPULATION TREND
First, consistency over time is examined for institutional deliveries:
National total for institutional deliveries for 2016= 152 138
National total for institutional deliveries for 2017= 155 374
National total for institutional deliveries for 2018 = 158 501
National total for institutional deliveries for 2019 = 220 916
The mean of 2010, 2011 and 2012 = ((211 194 + 205 863 + 199 344)/3) = 205 467.
The ratio of the current year 2019 to the forecasted value for 2019 = 166 817/161 519) ≈ 1.03.
The average ratio of 1.08 shows that there was an overall 8% increase in the service outputs for institutional deliveries in 2013 when compared to the average service outputs for the preceding three years.
Table A2.10a Consistency trend: comparison of district ratio to national ratioA difference of more than 10% between the district and national ratios is highlighted in red.
2016 2017 2018
Forecasted value for
2019
Actual value for
2019
Ratio of current year value to forecasted
value
% difference between forecasted and
current 2019 value
District 1 14,811 15,293 15,776 16,258 15,145 0.93 0.07
District 2 10,833 11,139 11,446 11,752 14,400 1.23 0.20
District 3 6,648 7,047 7,447 7,846 9,976 1.27 0.24
District 4 15,607 15,975 16,344 16,712 16,570 0.99 0.01
District 5 2,814 2,893 2,973 3,052 1,354 0.44 0.77
District 6 29,622 30,587 31,551 32,516 31000 0.95 0.05
District 7 21,666 22,279 22,892 23,505 28,800 1.23 0.20
District 8 13,296 13,640 13,933 14,174 14364 1.01 0.01
District 9 31,214 30,920 30,579 30,190 29754 0.99 0.01
District 10 5,628 5,600 5,562 5,513 5454 0.99 0.01
National 152,138 155,374 158,501 161,519 166,817 1.03
Subnationally, each district should be evaluated by calculating, for live births, the ratio of the actual value for the current year (2019) to the forecasted value for 2019. For example, the ratio for District 1 is 15 145/16 258 = 0.93
Next, the % difference between the national and district ratios is calculated for each district. Again, for District 1:!"#$%"!" !"#$%!!"#$%&"' !"#$%(!"#$%"&$ !"#$%!!"#$%&"' !"#$%)
!
= .!"
.!" = 0.10 = 10%
The percentage difference between the district ratio and the national ratio for live births in District 1 is less than 10%. However, there are other districts that have more than 10% difference..
To calculate this indicator subnationally, all administrative units which have ratios that differ from the country’s national ratio by ± 10% or more are counted. In this example, Districts 2, 3, 5, and 7 have a difference greater than ± 10%. Therefore, 4 out of 10 districts (40%) has a ratio that differs more than 10% from the national ratio.
Table A2.10b Example of summary results
Metric Results
Average ratio of live births for 2019 to the forecasted value for 2019 1.03
Number (%) of districts with at least 10% difference between the forecasted and actual estimate. 4 (40%), Districts 2, 3, 5, 7
47
Data
Qua
lity A
ssur
ance
. Mod
ule 2
: Des
k rev
iew
of d
ata q
ualit
y
Annex 3: Preparation for discrete desk review of data quality
Data requirementsFor the desk review, monthly or quarterly data by subnational administrative area are required for the selected indicators for the most recent reporting year, with annual aggregated data for the last three reporting years.
Information on submitted aggregate reports and when they were received will be required in order to evaluate the completeness and timeliness of reporting. Data on the number of submitted reports and the number of facilities expected to report for the three years prior to the year of analysis are required in order to evaluate the trend in reporting completeness. If information for all selected primary indicators is reported on the same forms, such as the HMIS form, these data will suffice for all selected indicators. If indicator values are reported on separate forms (e.g. programme-specific reporting forms), a separate analysis will be required for each set of reporting forms used for the selected indicators.
Other data requirements include denominator data for calculating coverage rates for the selected indicators and survey results (and their standard errors) from the most recent population-based survey – such as MICS, DHS and immunization coverage surveys. The Implementation guide has a more detailed description of the data and formatting requirements for the desk review.
Data collectionData for the indicators are collected from the HMIS or health programmes, depending on which source is used most frequently for programme planning, monitoring and evaluation. Because the purpose of the DQR is to evaluate the quality of routine health-facility data, support from the leadership of the health ministry is essential to acquire and evaluate the quality of data from the HMIS or programmes. It is necessary to work closely with managers of the programme, of monitoring and evaluation, and the HMIS to analyse the quality of facility-reported data.
48
Anne
x 3. P
repa
ratio
n fo
r disc
rete
des
k rev
iew
of d
ata q
ualit
y
Data formatting and compilationOnce acquired, data must be formatted to facilitate the analysis, typically by creating a “flat file” in which data for facilities and/or districts are contained in rows and where indicator values by month or year are in columns (e.g. Excel, CSV). Detailed guidance for formatting data for the DQR is available in the Implementation guide. The DQR analyses can be programmed into most software applications and can also be conducted on paper.
After the data are formatted appropriately the analysis can go ahead. Data quality metrics should be programmed into the software selected by the DQR coordinating group, with output to graphs (where appropriate), tables and lists (in many countries that have the DHIS2 system as their HMIS, the WHO Data Quality App already does this). Metrics that identify administrative units with potential data quality problems should generate lists of those administrative units so that attempts can be made to understand the anomalies and, if possible, to correct the data. Indicators that compare trends should produce graphs showing the trend lines side-by-side for ease of comparison. Comparisons of administrative units should generate bar charts of performance by unit to facilitate understanding of their relative performance.
However, for countries that do not wish to invest in modifying existing software to accommodate the DQR methodology and do not use DHIS2 for all their programmes, an MS Excel-based tool is available from WHO for compiling and formatting data in layouts which facilitate data analysis. Once the data are entered into the standardized tool, the data quality metrics are automatically calculated, as are graphic depictions of performance.
Results from the health-facility survey component of the DQR (data verification and system assessment results) should be integrated into the desk review analysis. Information on the accuracy of reporting for selected indicators will influence the confidence that policy-makers place in the reported data. Information on weaknesses or gaps in the adequacy of the reporting system can point to activities that will strengthen the system.
49

Data
Qua
lity A
ssur
ance
. Mod
ule 2
: Des
k rev
iew
of d
ata q
ualit
y
Notes. . . . . . . . . . . . . . . . . . . . . . . . . . . . . . . . . . . . . . . . . . . . . . . . . . . . . . . . . . . . . . . . . . . . . . . . . . . . . . . . . . . . . .
. . . . . . . . . . . . . . . . . . . . . . . . . . . . . . . . . . . . . . . . . . . . . . . . . . . . . . . . . . . . . . . . . . . . . . . . . . . . . . . . . . . . . .
. . . . . . . . . . . . . . . . . . . . . . . . . . . . . . . . . . . . . . . . . . . . . . . . . . . . . . . . . . . . . . . . . . . . . . . . . . . . . . . . . . . . . .
. . . . . . . . . . . . . . . . . . . . . . . . . . . . . . . . . . . . . . . . . . . . . . . . . . . . . . . . . . . . . . . . . . . . . . . . . . . . . . . . . . . . . .
. . . . . . . . . . . . . . . . . . . . . . . . . . . . . . . . . . . . . . . . . . . . . . . . . . . . . . . . . . . . . . . . . . . . . . . . . . . . . . . . . . . . . .
. . . . . . . . . . . . . . . . . . . . . . . . . . . . . . . . . . . . . . . . . . . . . . . . . . . . . . . . . . . . . . . . . . . . . . . . . . . . . . . . . . . . . .
. . . . . . . . . . . . . . . . . . . . . . . . . . . . . . . . . . . . . . . . . . . . . . . . . . . . . . . . . . . . . . . . . . . . . . . . . . . . . . . . . . . . . .
. . . . . . . . . . . . . . . . . . . . . . . . . . . . . . . . . . . . . . . . . . . . . . . . . . . . . . . . . . . . . . . . . . . . . . . . . . . . . . . . . . . . . .
. . . . . . . . . . . . . . . . . . . . . . . . . . . . . . . . . . . . . . . . . . . . . . . . . . . . . . . . . . . . . . . . . . . . . . . . . . . . . . . . . . . . . .
. . . . . . . . . . . . . . . . . . . . . . . . . . . . . . . . . . . . . . . . . . . . . . . . . . . . . . . . . . . . . . . . . . . . . . . . . . . . . . . . . . . . . .
. . . . . . . . . . . . . . . . . . . . . . . . . . . . . . . . . . . . . . . . . . . . . . . . . . . . . . . . . . . . . . . . . . . . . . . . . . . . . . . . . . . . . .
. . . . . . . . . . . . . . . . . . . . . . . . . . . . . . . . . . . . . . . . . . . . . . . . . . . . . . . . . . . . . . . . . . . . . . . . . . . . . . . . . . . . . .
. . . . . . . . . . . . . . . . . . . . . . . . . . . . . . . . . . . . . . . . . . . . . . . . . . . . . . . . . . . . . . . . . . . . . . . . . . . . . . . . . . . . . .
. . . . . . . . . . . . . . . . . . . . . . . . . . . . . . . . . . . . . . . . . . . . . . . . . . . . . . . . . . . . . . . . . . . . . . . . . . . . . . . . . . . . . .
. . . . . . . . . . . . . . . . . . . . . . . . . . . . . . . . . . . . . . . . . . . . . . . . . . . . . . . . . . . . . . . . . . . . . . . . . . . . . . . . . . . . . .
. . . . . . . . . . . . . . . . . . . . . . . . . . . . . . . . . . . . . . . . . . . . . . . . . . . . . . . . . . . . . . . . . . . . . . . . . . . . . . . . . . . . . .
. . . . . . . . . . . . . . . . . . . . . . . . . . . . . . . . . . . . . . . . . . . . . . . . . . . . . . . . . . . . . . . . . . . . . . . . . . . . . . . . . . . . . .
. . . . . . . . . . . . . . . . . . . . . . . . . . . . . . . . . . . . . . . . . . . . . . . . . . . . . . . . . . . . . . . . . . . . . . . . . . . . . . . . . . . . . .
. . . . . . . . . . . . . . . . . . . . . . . . . . . . . . . . . . . . . . . . . . . . . . . . . . . . . . . . . . . . . . . . . . . . . . . . . . . . . . . . . . . . . .
. . . . . . . . . . . . . . . . . . . . . . . . . . . . . . . . . . . . . . . . . . . . . . . . . . . . . . . . . . . . . . . . . . . . . . . . . . . . . . . . . . . . . .
. . . . . . . . . . . . . . . . . . . . . . . . . . . . . . . . . . . . . . . . . . . . . . . . . . . . . . . . . . . . . . . . . . . . . . . . . . . . . . . . . . . . . .
. . . . . . . . . . . . . . . . . . . . . . . . . . . . . . . . . . . . . . . . . . . . . . . . . . . . . . . . . . . . . . . . . . . . . . . . . . . . . . . . . . . . . .
. . . . . . . . . . . . . . . . . . . . . . . . . . . . . . . . . . . . . . . . . . . . . . . . . . . . . . . . . . . . . . . . . . . . . . . . . . . . . . . . . . . . . .
. . . . . . . . . . . . . . . . . . . . . . . . . . . . . . . . . . . . . . . . . . . . . . . . . . . . . . . . . . . . . . . . . . . . . . . . . . . . . . . . . . . . . .
. . . . . . . . . . . . . . . . . . . . . . . . . . . . . . . . . . . . . . . . . . . . . . . . . . . . . . . . . . . . . . . . . . . . . . . . . . . . . . . . . . . . . .
. . . . . . . . . . . . . . . . . . . . . . . . . . . . . . . . . . . . . . . . . . . . . . . . . . . . . . . . . . . . . . . . . . . . . . . . . . . . . . . . . . . . . .
. . . . . . . . . . . . . . . . . . . . . . . . . . . . . . . . . . . . . . . . . . . . . . . . . . . . . . . . . . . . . . . . . . . . . . . . . . . . . . . . . . . . . .
. . . . . . . . . . . . . . . . . . . . . . . . . . . . . . . . . . . . . . . . . . . . . . . . . . . . . . . . . . . . . . . . . . . . . . . . . . . . . . . . . . . . . .
. . . . . . . . . . . . . . . . . . . . . . . . . . . . . . . . . . . . . . . . . . . . . . . . . . . . . . . . . . . . . . . . . . . . . . . . . . . . . . . . . . . . . .
. . . . . . . . . . . . . . . . . . . . . . . . . . . . . . . . . . . . . . . . . . . . . . . . . . . . . . . . . . . . . . . . . . . . . . . . . . . . . . . . . . . . . .
. . . . . . . . . . . . . . . . . . . . . . . . . . . . . . . . . . . . . . . . . . . . . . . . . . . . . . . . . . . . . . . . . . . . . . . . . . . . . . . . . . . . . .
. . . . . . . . . . . . . . . . . . . . . . . . . . . . . . . . . . . . . . . . . . . . . . . . . . . . . . . . . . . . . . . . . . . . . . . . . . . . . . . . . . . . . .
50

Notes. . . . . . . . . . . . . . . . . . . . . . . . . . . . . . . . . . . . . . . . . . . . . . . . . . . . . . . . . . . . . . . . . . . . . . . . . . . . . . . . . . . . . .
. . . . . . . . . . . . . . . . . . . . . . . . . . . . . . . . . . . . . . . . . . . . . . . . . . . . . . . . . . . . . . . . . . . . . . . . . . . . . . . . . . . . . .
. . . . . . . . . . . . . . . . . . . . . . . . . . . . . . . . . . . . . . . . . . . . . . . . . . . . . . . . . . . . . . . . . . . . . . . . . . . . . . . . . . . . . .
. . . . . . . . . . . . . . . . . . . . . . . . . . . . . . . . . . . . . . . . . . . . . . . . . . . . . . . . . . . . . . . . . . . . . . . . . . . . . . . . . . . . . .
. . . . . . . . . . . . . . . . . . . . . . . . . . . . . . . . . . . . . . . . . . . . . . . . . . . . . . . . . . . . . . . . . . . . . . . . . . . . . . . . . . . . . .
. . . . . . . . . . . . . . . . . . . . . . . . . . . . . . . . . . . . . . . . . . . . . . . . . . . . . . . . . . . . . . . . . . . . . . . . . . . . . . . . . . . . . .
. . . . . . . . . . . . . . . . . . . . . . . . . . . . . . . . . . . . . . . . . . . . . . . . . . . . . . . . . . . . . . . . . . . . . . . . . . . . . . . . . . . . . .
. . . . . . . . . . . . . . . . . . . . . . . . . . . . . . . . . . . . . . . . . . . . . . . . . . . . . . . . . . . . . . . . . . . . . . . . . . . . . . . . . . . . . .
. . . . . . . . . . . . . . . . . . . . . . . . . . . . . . . . . . . . . . . . . . . . . . . . . . . . . . . . . . . . . . . . . . . . . . . . . . . . . . . . . . . . . .
. . . . . . . . . . . . . . . . . . . . . . . . . . . . . . . . . . . . . . . . . . . . . . . . . . . . . . . . . . . . . . . . . . . . . . . . . . . . . . . . . . . . . .
. . . . . . . . . . . . . . . . . . . . . . . . . . . . . . . . . . . . . . . . . . . . . . . . . . . . . . . . . . . . . . . . . . . . . . . . . . . . . . . . . . . . . .
. . . . . . . . . . . . . . . . . . . . . . . . . . . . . . . . . . . . . . . . . . . . . . . . . . . . . . . . . . . . . . . . . . . . . . . . . . . . . . . . . . . . . .
. . . . . . . . . . . . . . . . . . . . . . . . . . . . . . . . . . . . . . . . . . . . . . . . . . . . . . . . . . . . . . . . . . . . . . . . . . . . . . . . . . . . . .
. . . . . . . . . . . . . . . . . . . . . . . . . . . . . . . . . . . . . . . . . . . . . . . . . . . . . . . . . . . . . . . . . . . . . . . . . . . . . . . . . . . . . .
. . . . . . . . . . . . . . . . . . . . . . . . . . . . . . . . . . . . . . . . . . . . . . . . . . . . . . . . . . . . . . . . . . . . . . . . . . . . . . . . . . . . . .
. . . . . . . . . . . . . . . . . . . . . . . . . . . . . . . . . . . . . . . . . . . . . . . . . . . . . . . . . . . . . . . . . . . . . . . . . . . . . . . . . . . . . .
. . . . . . . . . . . . . . . . . . . . . . . . . . . . . . . . . . . . . . . . . . . . . . . . . . . . . . . . . . . . . . . . . . . . . . . . . . . . . . . . . . . . . .
. . . . . . . . . . . . . . . . . . . . . . . . . . . . . . . . . . . . . . . . . . . . . . . . . . . . . . . . . . . . . . . . . . . . . . . . . . . . . . . . . . . . . .
. . . . . . . . . . . . . . . . . . . . . . . . . . . . . . . . . . . . . . . . . . . . . . . . . . . . . . . . . . . . . . . . . . . . . . . . . . . . . . . . . . . . . .
. . . . . . . . . . . . . . . . . . . . . . . . . . . . . . . . . . . . . . . . . . . . . . . . . . . . . . . . . . . . . . . . . . . . . . . . . . . . . . . . . . . . . .
. . . . . . . . . . . . . . . . . . . . . . . . . . . . . . . . . . . . . . . . . . . . . . . . . . . . . . . . . . . . . . . . . . . . . . . . . . . . . . . . . . . . . .
. . . . . . . . . . . . . . . . . . . . . . . . . . . . . . . . . . . . . . . . . . . . . . . . . . . . . . . . . . . . . . . . . . . . . . . . . . . . . . . . . . . . . .
. . . . . . . . . . . . . . . . . . . . . . . . . . . . . . . . . . . . . . . . . . . . . . . . . . . . . . . . . . . . . . . . . . . . . . . . . . . . . . . . . . . . . .
. . . . . . . . . . . . . . . . . . . . . . . . . . . . . . . . . . . . . . . . . . . . . . . . . . . . . . . . . . . . . . . . . . . . . . . . . . . . . . . . . . . . . .
. . . . . . . . . . . . . . . . . . . . . . . . . . . . . . . . . . . . . . . . . . . . . . . . . . . . . . . . . . . . . . . . . . . . . . . . . . . . . . . . . . . . . .
. . . . . . . . . . . . . . . . . . . . . . . . . . . . . . . . . . . . . . . . . . . . . . . . . . . . . . . . . . . . . . . . . . . . . . . . . . . . . . . . . . . . . .
. . . . . . . . . . . . . . . . . . . . . . . . . . . . . . . . . . . . . . . . . . . . . . . . . . . . . . . . . . . . . . . . . . . . . . . . . . . . . . . . . . . . . .
. . . . . . . . . . . . . . . . . . . . . . . . . . . . . . . . . . . . . . . . . . . . . . . . . . . . . . . . . . . . . . . . . . . . . . . . . . . . . . . . . . . . . .
. . . . . . . . . . . . . . . . . . . . . . . . . . . . . . . . . . . . . . . . . . . . . . . . . . . . . . . . . . . . . . . . . . . . . . . . . . . . . . . . . . . . . .
. . . . . . . . . . . . . . . . . . . . . . . . . . . . . . . . . . . . . . . . . . . . . . . . . . . . . . . . . . . . . . . . . . . . . . . . . . . . . . . . . . . . . .
. . . . . . . . . . . . . . . . . . . . . . . . . . . . . . . . . . . . . . . . . . . . . . . . . . . . . . . . . . . . . . . . . . . . . . . . . . . . . . . . . . . . . .
. . . . . . . . . . . . . . . . . . . . . . . . . . . . . . . . . . . . . . . . . . . . . . . . . . . . . . . . . . . . . . . . . . . . . . . . . . . . . . . . . . . . . .
51
Data
Qua
lity A
ssur
ance
. Mod
ule 2
: Des
k rev
iew
of d
ata q
ualit
y
Notes. . . . . . . . . . . . . . . . . . . . . . . . . . . . . . . . . . . . . . . . . . . . . . . . . . . . . . . . . . . . . . . . . . . . . . . . . . . . . . . . . . . . . .
. . . . . . . . . . . . . . . . . . . . . . . . . . . . . . . . . . . . . . . . . . . . . . . . . . . . . . . . . . . . . . . . . . . . . . . . . . . . . . . . . . . . . .
. . . . . . . . . . . . . . . . . . . . . . . . . . . . . . . . . . . . . . . . . . . . . . . . . . . . . . . . . . . . . . . . . . . . . . . . . . . . . . . . . . . . . .
. . . . . . . . . . . . . . . . . . . . . . . . . . . . . . . . . . . . . . . . . . . . . . . . . . . . . . . . . . . . . . . . . . . . . . . . . . . . . . . . . . . . . .
. . . . . . . . . . . . . . . . . . . . . . . . . . . . . . . . . . . . . . . . . . . . . . . . . . . . . . . . . . . . . . . . . . . . . . . . . . . . . . . . . . . . . .
. . . . . . . . . . . . . . . . . . . . . . . . . . . . . . . . . . . . . . . . . . . . . . . . . . . . . . . . . . . . . . . . . . . . . . . . . . . . . . . . . . . . . .
. . . . . . . . . . . . . . . . . . . . . . . . . . . . . . . . . . . . . . . . . . . . . . . . . . . . . . . . . . . . . . . . . . . . . . . . . . . . . . . . . . . . . .
. . . . . . . . . . . . . . . . . . . . . . . . . . . . . . . . . . . . . . . . . . . . . . . . . . . . . . . . . . . . . . . . . . . . . . . . . . . . . . . . . . . . . .
. . . . . . . . . . . . . . . . . . . . . . . . . . . . . . . . . . . . . . . . . . . . . . . . . . . . . . . . . . . . . . . . . . . . . . . . . . . . . . . . . . . . . .
. . . . . . . . . . . . . . . . . . . . . . . . . . . . . . . . . . . . . . . . . . . . . . . . . . . . . . . . . . . . . . . . . . . . . . . . . . . . . . . . . . . . . .
. . . . . . . . . . . . . . . . . . . . . . . . . . . . . . . . . . . . . . . . . . . . . . . . . . . . . . . . . . . . . . . . . . . . . . . . . . . . . . . . . . . . . .
. . . . . . . . . . . . . . . . . . . . . . . . . . . . . . . . . . . . . . . . . . . . . . . . . . . . . . . . . . . . . . . . . . . . . . . . . . . . . . . . . . . . . .
. . . . . . . . . . . . . . . . . . . . . . . . . . . . . . . . . . . . . . . . . . . . . . . . . . . . . . . . . . . . . . . . . . . . . . . . . . . . . . . . . . . . . .
. . . . . . . . . . . . . . . . . . . . . . . . . . . . . . . . . . . . . . . . . . . . . . . . . . . . . . . . . . . . . . . . . . . . . . . . . . . . . . . . . . . . . .
. . . . . . . . . . . . . . . . . . . . . . . . . . . . . . . . . . . . . . . . . . . . . . . . . . . . . . . . . . . . . . . . . . . . . . . . . . . . . . . . . . . . . .
. . . . . . . . . . . . . . . . . . . . . . . . . . . . . . . . . . . . . . . . . . . . . . . . . . . . . . . . . . . . . . . . . . . . . . . . . . . . . . . . . . . . . .
. . . . . . . . . . . . . . . . . . . . . . . . . . . . . . . . . . . . . . . . . . . . . . . . . . . . . . . . . . . . . . . . . . . . . . . . . . . . . . . . . . . . . .
. . . . . . . . . . . . . . . . . . . . . . . . . . . . . . . . . . . . . . . . . . . . . . . . . . . . . . . . . . . . . . . . . . . . . . . . . . . . . . . . . . . . . .
. . . . . . . . . . . . . . . . . . . . . . . . . . . . . . . . . . . . . . . . . . . . . . . . . . . . . . . . . . . . . . . . . . . . . . . . . . . . . . . . . . . . . .
. . . . . . . . . . . . . . . . . . . . . . . . . . . . . . . . . . . . . . . . . . . . . . . . . . . . . . . . . . . . . . . . . . . . . . . . . . . . . . . . . . . . . .
. . . . . . . . . . . . . . . . . . . . . . . . . . . . . . . . . . . . . . . . . . . . . . . . . . . . . . . . . . . . . . . . . . . . . . . . . . . . . . . . . . . . . .
. . . . . . . . . . . . . . . . . . . . . . . . . . . . . . . . . . . . . . . . . . . . . . . . . . . . . . . . . . . . . . . . . . . . . . . . . . . . . . . . . . . . . .
. . . . . . . . . . . . . . . . . . . . . . . . . . . . . . . . . . . . . . . . . . . . . . . . . . . . . . . . . . . . . . . . . . . . . . . . . . . . . . . . . . . . . .
. . . . . . . . . . . . . . . . . . . . . . . . . . . . . . . . . . . . . . . . . . . . . . . . . . . . . . . . . . . . . . . . . . . . . . . . . . . . . . . . . . . . . .
. . . . . . . . . . . . . . . . . . . . . . . . . . . . . . . . . . . . . . . . . . . . . . . . . . . . . . . . . . . . . . . . . . . . . . . . . . . . . . . . . . . . . .
. . . . . . . . . . . . . . . . . . . . . . . . . . . . . . . . . . . . . . . . . . . . . . . . . . . . . . . . . . . . . . . . . . . . . . . . . . . . . . . . . . . . . .
. . . . . . . . . . . . . . . . . . . . . . . . . . . . . . . . . . . . . . . . . . . . . . . . . . . . . . . . . . . . . . . . . . . . . . . . . . . . . . . . . . . . . .
. . . . . . . . . . . . . . . . . . . . . . . . . . . . . . . . . . . . . . . . . . . . . . . . . . . . . . . . . . . . . . . . . . . . . . . . . . . . . . . . . . . . . .
. . . . . . . . . . . . . . . . . . . . . . . . . . . . . . . . . . . . . . . . . . . . . . . . . . . . . . . . . . . . . . . . . . . . . . . . . . . . . . . . . . . . . .
. . . . . . . . . . . . . . . . . . . . . . . . . . . . . . . . . . . . . . . . . . . . . . . . . . . . . . . . . . . . . . . . . . . . . . . . . . . . . . . . . . . . . .
. . . . . . . . . . . . . . . . . . . . . . . . . . . . . . . . . . . . . . . . . . . . . . . . . . . . . . . . . . . . . . . . . . . . . . . . . . . . . . . . . . . . . .
. . . . . . . . . . . . . . . . . . . . . . . . . . . . . . . . . . . . . . . . . . . . . . . . . . . . . . . . . . . . . . . . . . . . . . . . . . . . . . . . . . . . . .
52

Please supply barcode
DATA QUALITY ASSURANCEDATA QUALITY ASSURANCE