DATA QUALITY AND ERROR Terminology, types and sources Importance Handling error and uncertainty.
30
DATA QUALITY AND ERROR Terminology, types and sources Importance Handling error and uncertainty
-
Upload
lenard-williams -
Category
Documents
-
view
232 -
download
1
Transcript of DATA QUALITY AND ERROR Terminology, types and sources Importance Handling error and uncertainty.
DATA QUALITY AND ERROR
Terminology, types and sources Importance Handling error and uncertainty

DATA QUALITY
GIGO: garbage in, garbage out
Because it’s in the computer, don’t mean it’s right
Accept there will always be errors in GIS
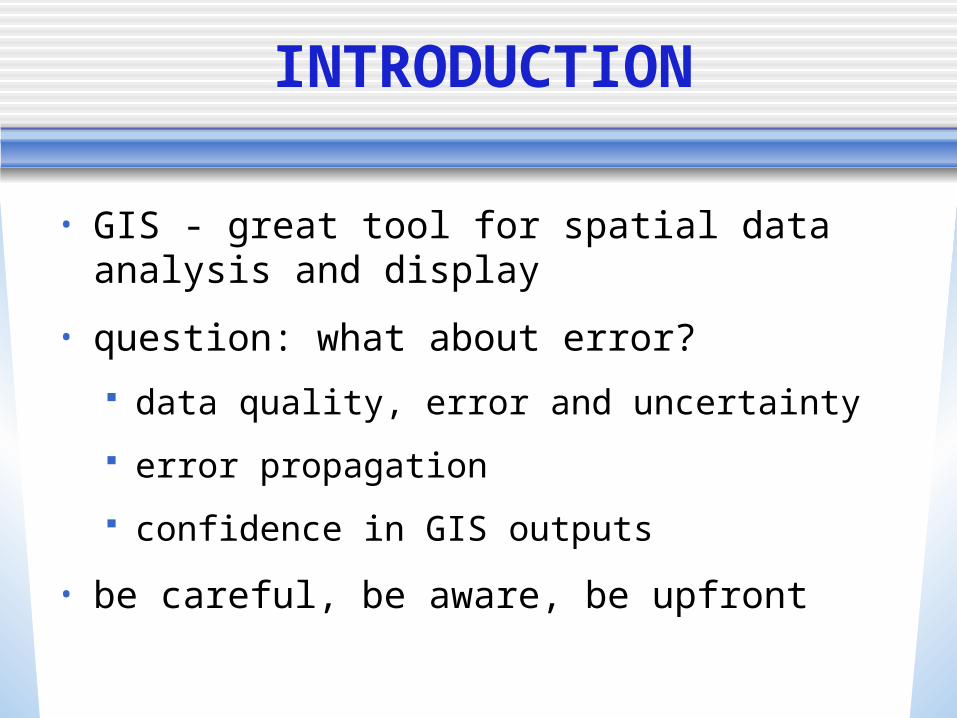
INTRODUCTION
• GIS - great tool for spatial data analysis and display
• question: what about error?
data quality, error and uncertainty
error propagation
confidence in GIS outputs
• be careful, be aware, be upfront
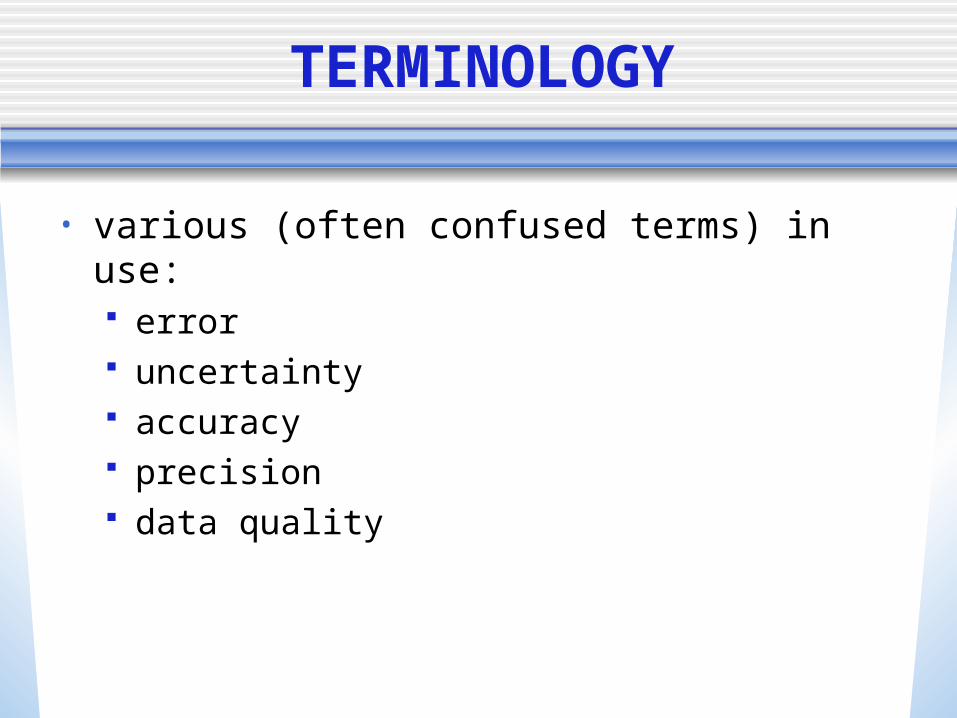
TERMINOLOGY
• various (often confused terms) in use: error uncertainty accuracy precision data quality
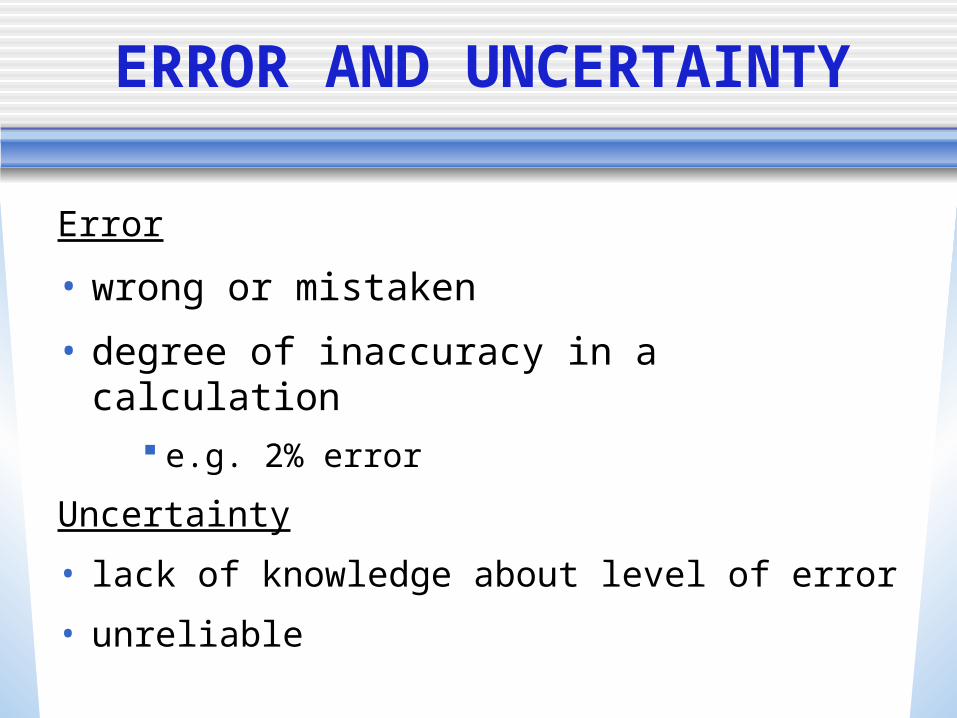
ERROR AND UNCERTAINTY
Error
• wrong or mistaken
• degree of inaccuracy in a calculation e.g. 2% error
Uncertainty
• lack of knowledge about level of error
• unreliable
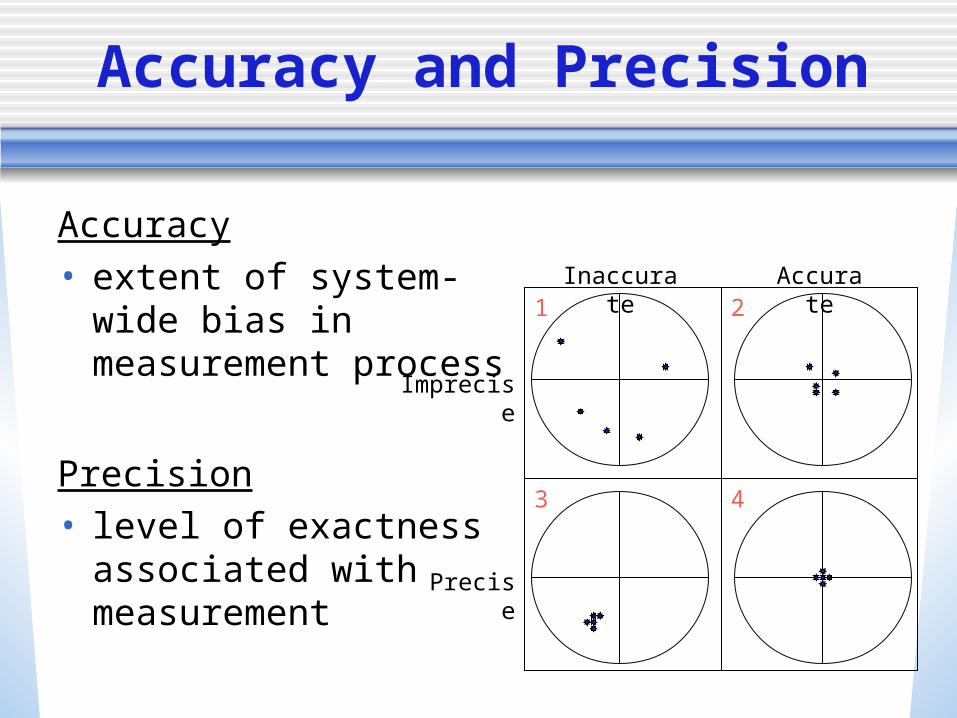
Accuracy and Precision
Accuracy• extent of system-wide
bias in measurement process
Precision• level of exactness
associated with measurement
Imprecise
Precise
Inaccurate
Accurate1
43
2
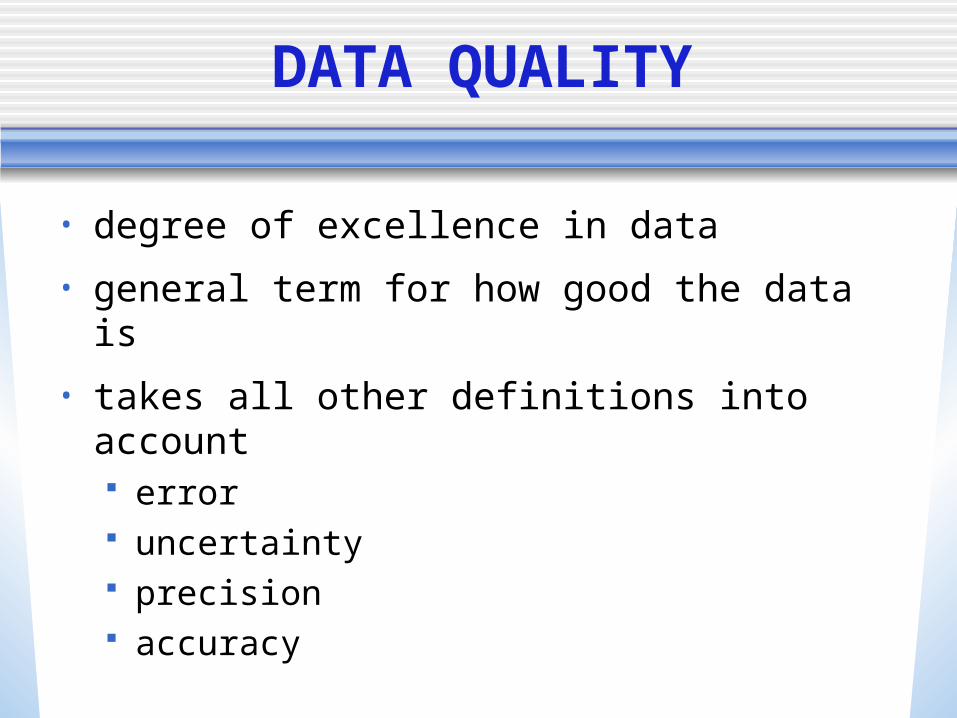
DATA QUALITY
• degree of excellence in data
• general term for how good the data is
• takes all other definitions into account error uncertainty precision accuracy
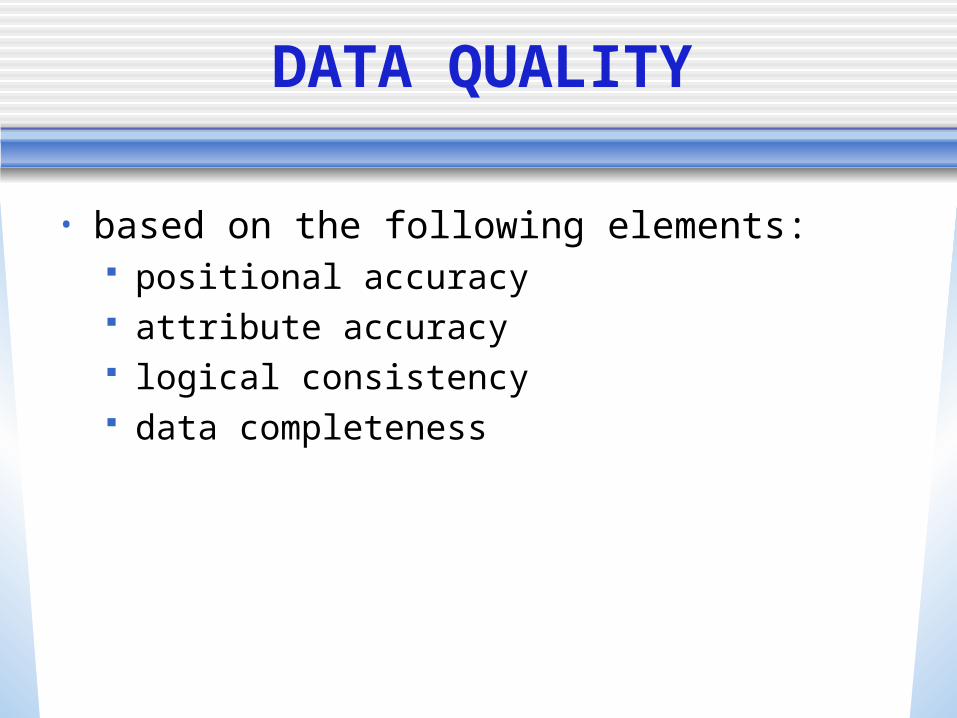
DATA QUALITY
• based on the following elements: positional accuracy attribute accuracy logical consistency data completeness
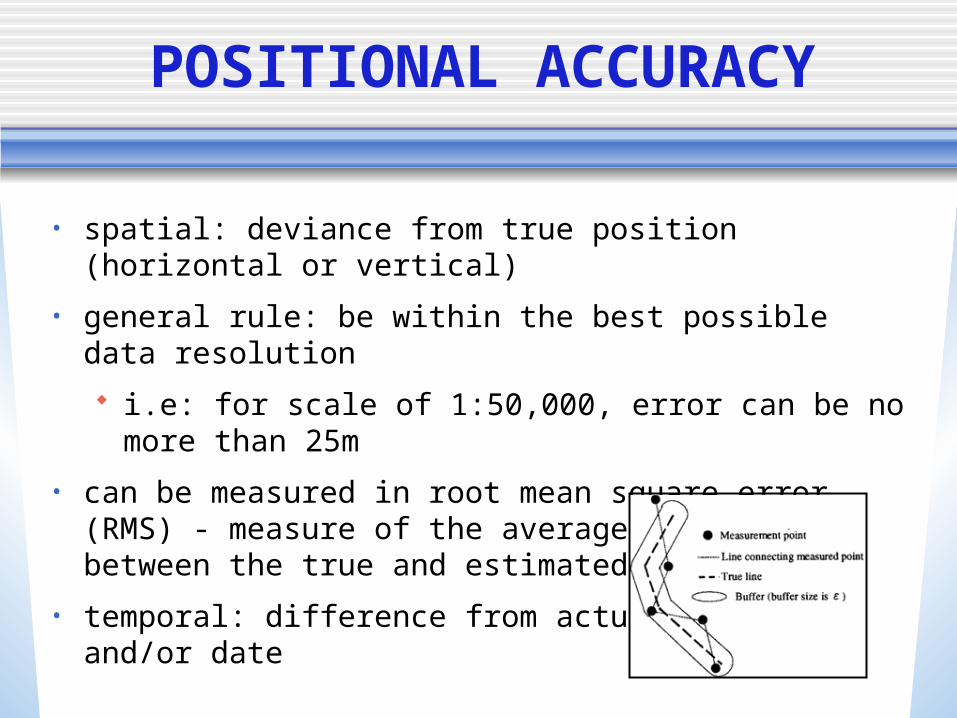
POSITIONAL ACCURACY
• spatial: deviance from true position (horizontal or vertical)
• general rule: be within the best possible data resolution
i.e: for scale of 1:50,000, error can be no more than 25m
• can be measured in root mean square error (RMS) - measure of the average distance between the true and estimated location
• temporal: difference from actual time and/or date
ATTRIBUTE ACCURACY
• classification and measurement accuracy
a feature is what the GIS thinks it to be
i.e. a railroad is a railroad and not a road
i.e. a soil sample agrees with the type mapped
• rated in terms of % correct
• in a database, forest types are grouped and placed within a boundary
• in reality - no solid boundary where only pine trees grow on one side and spruce on the other
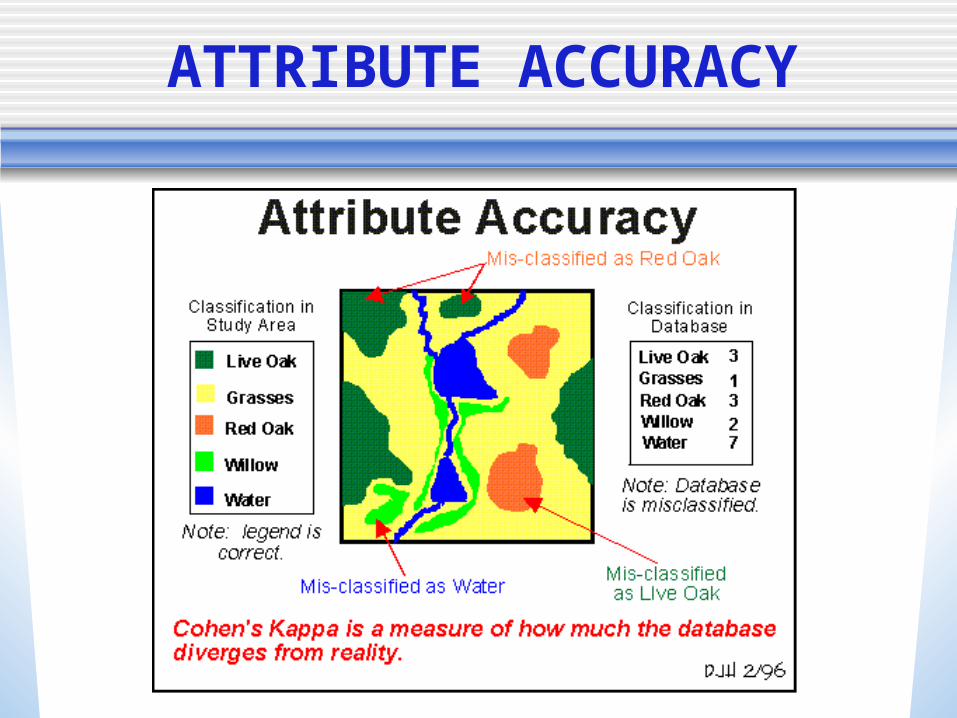
ATTRIBUTE ACCURACY
LOGICAL CONSISTENCY
• presence of contradictory relationships in the database
• non-spatial
crimes recorded at place of occurrence, others at place where report taken
data for one country is for 2000, another for 2001
data uses different source or estimation technique for different years
LOGICAL CONSISTENCY
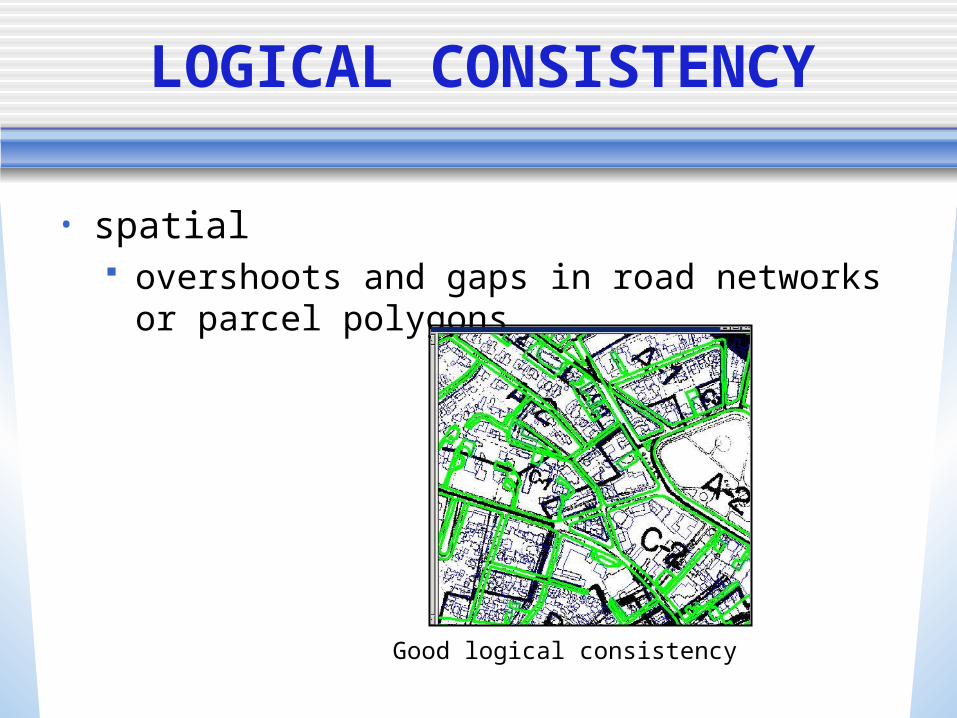
• spatial overshoots and gaps in road networks or parcel
polygons
Good logical consistency
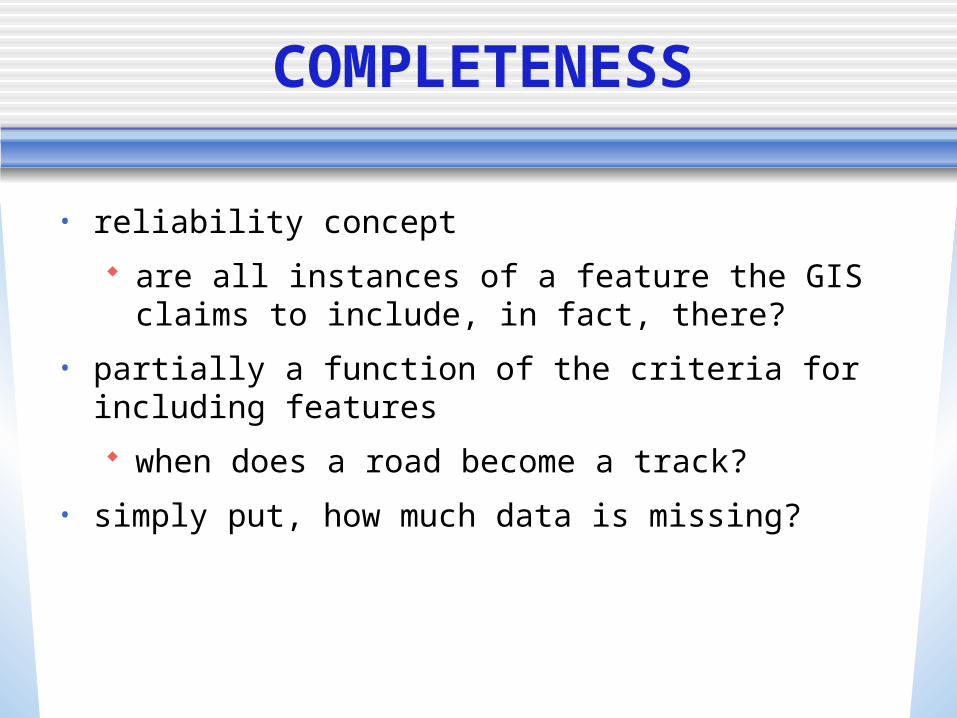
COMPLETENESS
• reliability concept
are all instances of a feature the GIS claims to include, in fact, there?
• partially a function of the criteria for including features
when does a road become a track?
• simply put, how much data is missing?
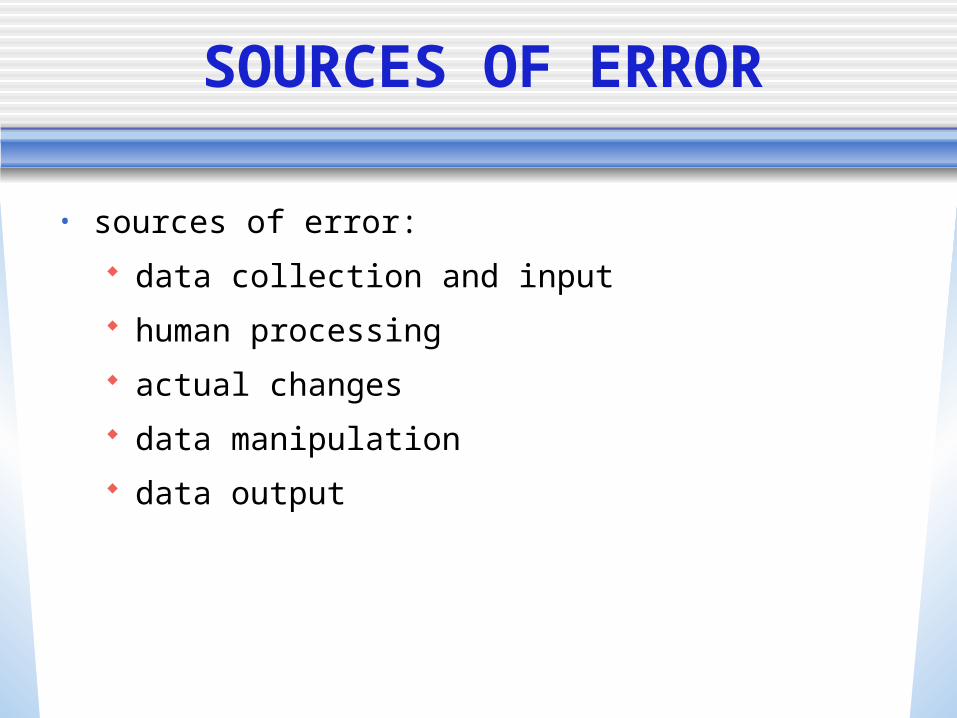
SOURCES OF ERROR
• sources of error:
data collection and input
human processing
actual changes
data manipulation
data output
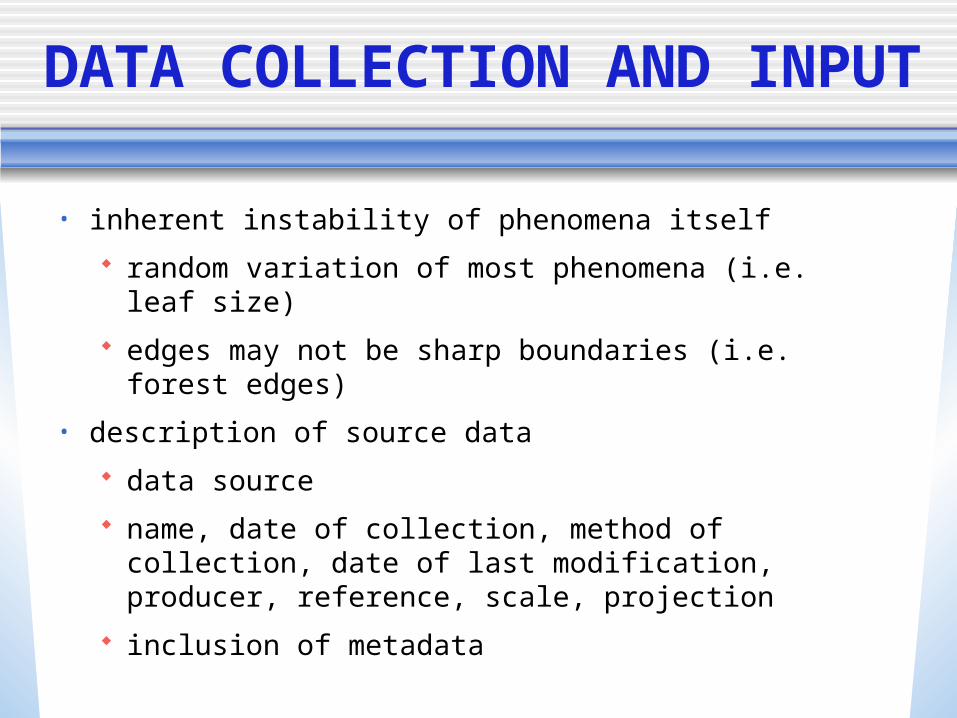
DATA COLLECTION AND INPUT
• inherent instability of phenomena itself
random variation of most phenomena (i.e. leaf size)
edges may not be sharp boundaries (i.e. forest edges)
• description of source data
data source
name, date of collection, method of collection, date of last modification, producer, reference, scale, projection
inclusion of metadata
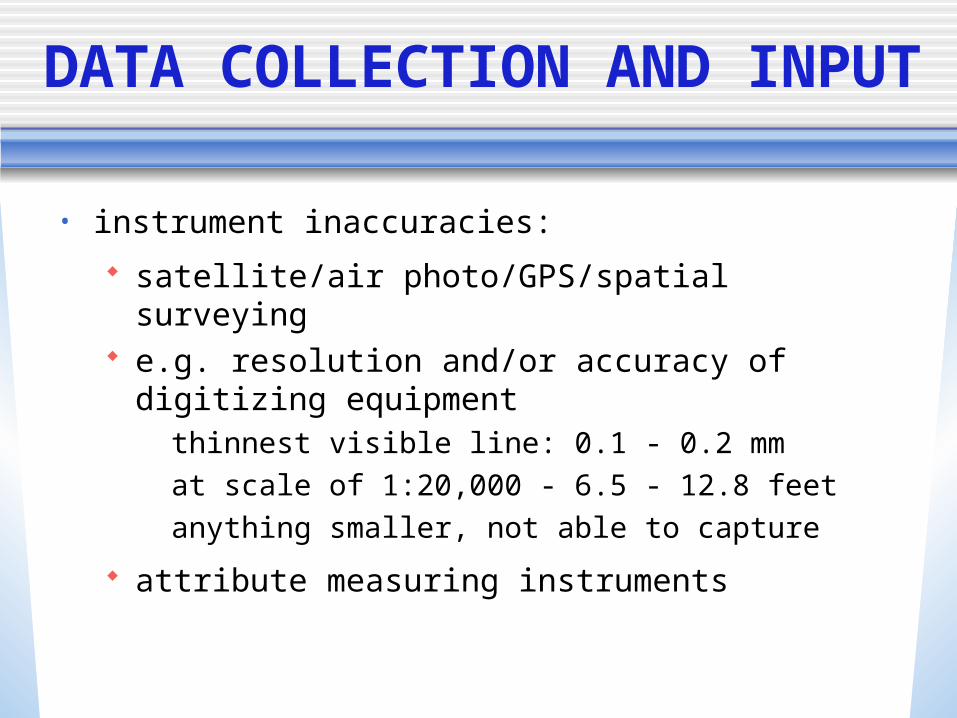
DATA COLLECTION AND INPUT
• instrument inaccuracies:
satellite/air photo/GPS/spatial surveying e.g. resolution and/or accuracy of digitizing equipment
thinnest visible line: 0.1 - 0.2 mm
at scale of 1:20,000 - 6.5 - 12.8 feet
anything smaller, not able to capture
attribute measuring instruments
DATA COLLECTION AND INPUT
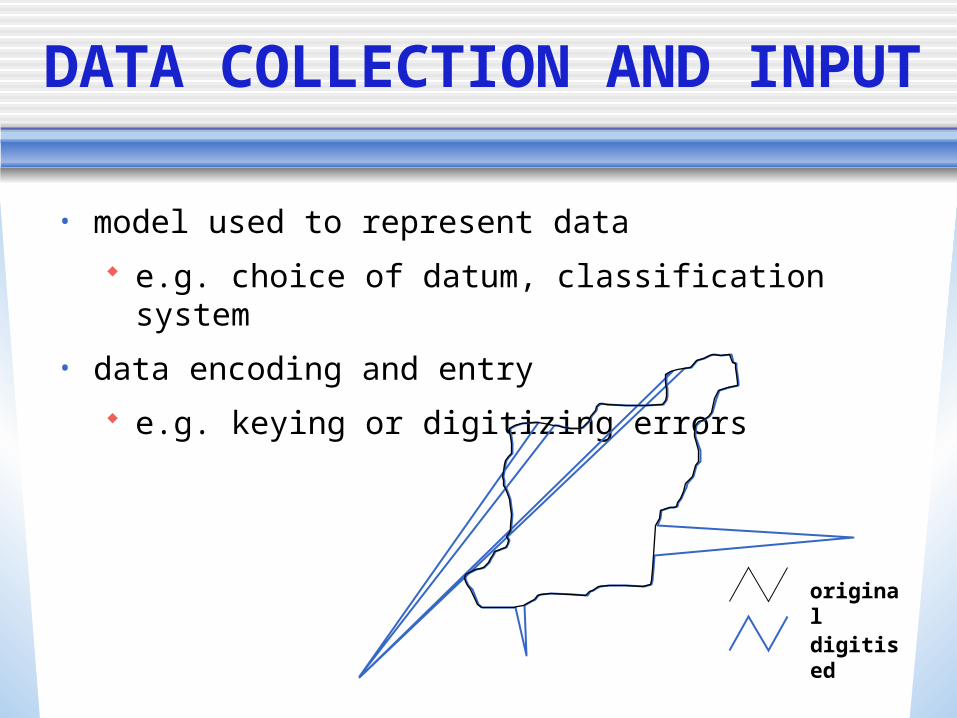
• model used to represent data
e.g. choice of datum, classification system
• data encoding and entry
e.g. keying or digitizing errors
original
digitised
DATA COLLECTION AND INPUT
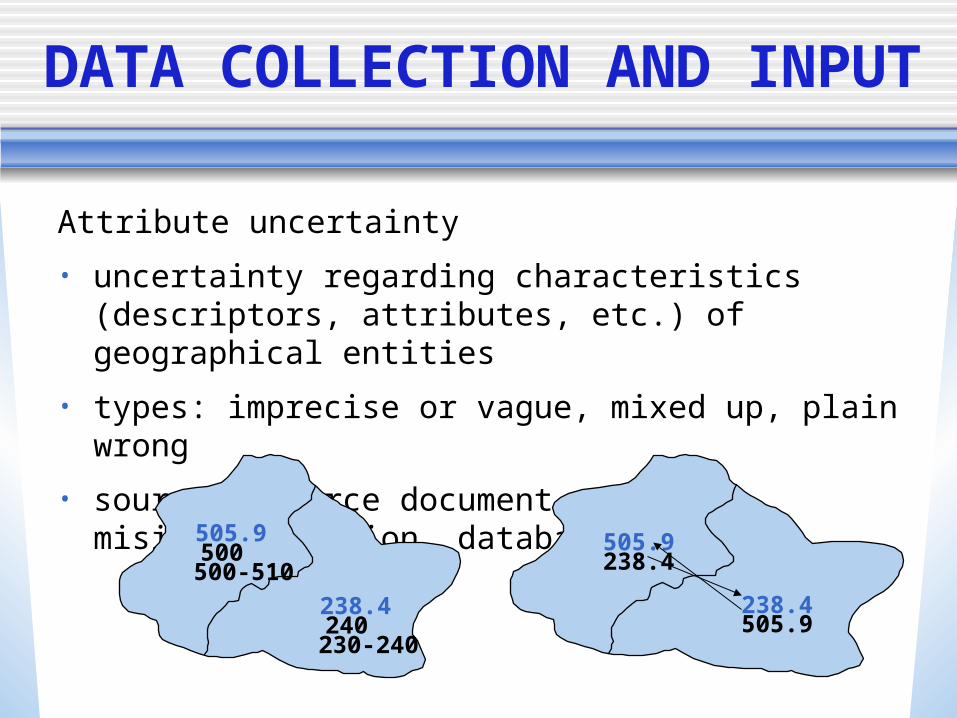
Attribute uncertainty
• uncertainty regarding characteristics (descriptors, attributes, etc.) of geographical entities
• types: imprecise or vague, mixed up, plain wrong
• sources: source document, misinterpretation, database error
505.9
238.4
500
240
500-510
230-240
238.4
505.9238.4
505.9
HUMAN PROCESSING
• misinterpretation (i.e. photos), spatial and attribute
• effects of classification (nominal/ordinal/ interval)
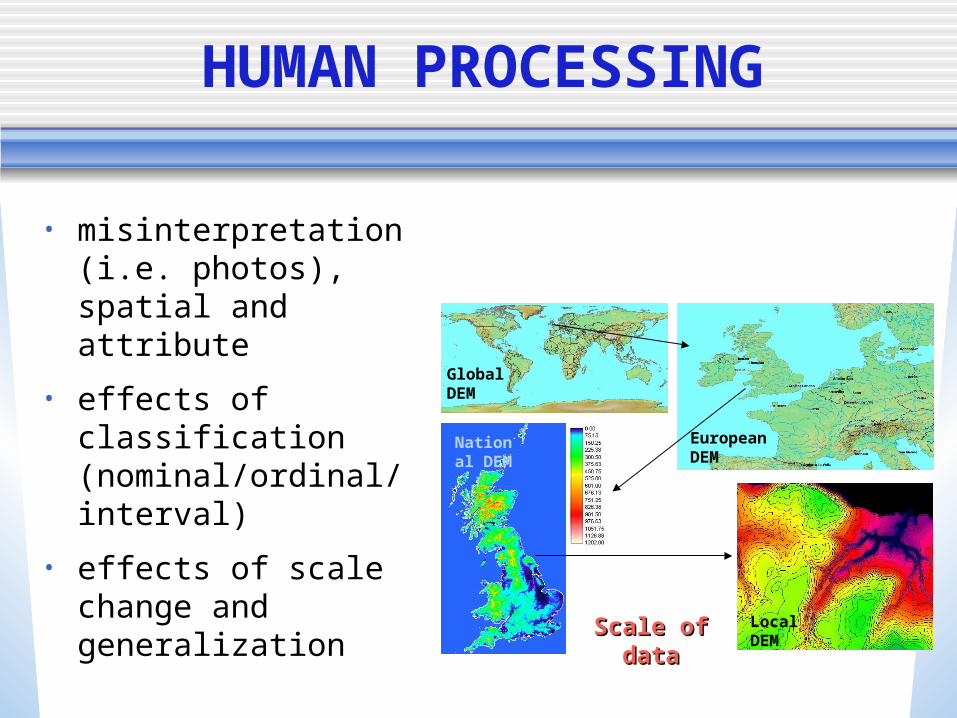
• effects of scale change and generalization
Scale of dataScale of data
Global DEM
European DEM
National DEM
Local DEM
HUMAN PROCESSING
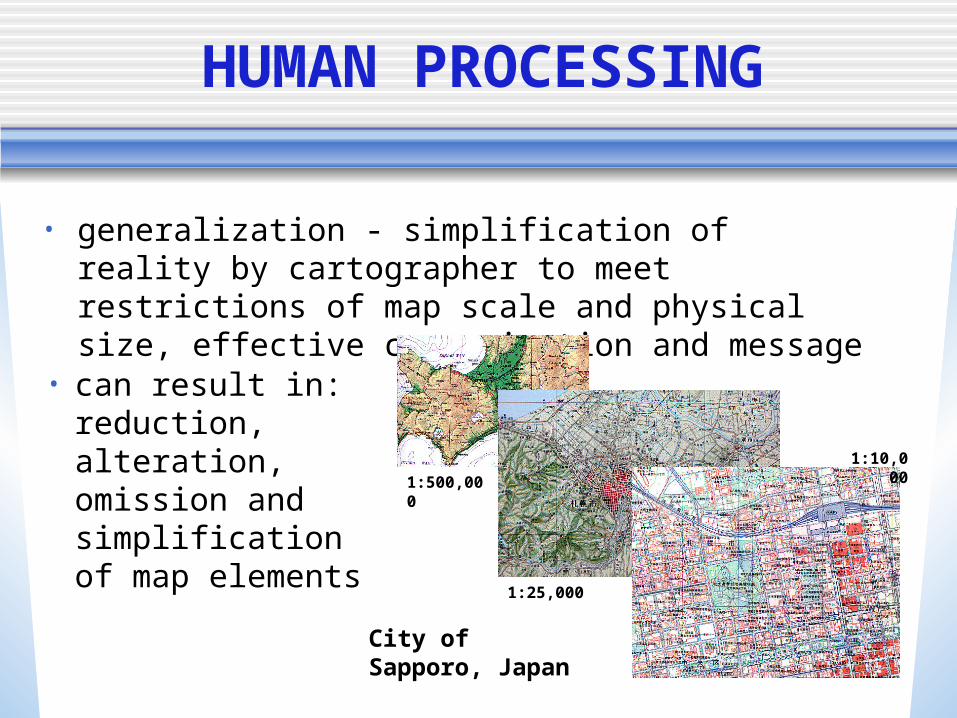
• generalization - simplification of reality by cartographer to meet restrictions of map scale and physical size, effective communication and message
1:500,000
1:25,000
1:10,000
City of Sapporo, Japan
• can result in: reduction, alteration, omission and simplification of map elements
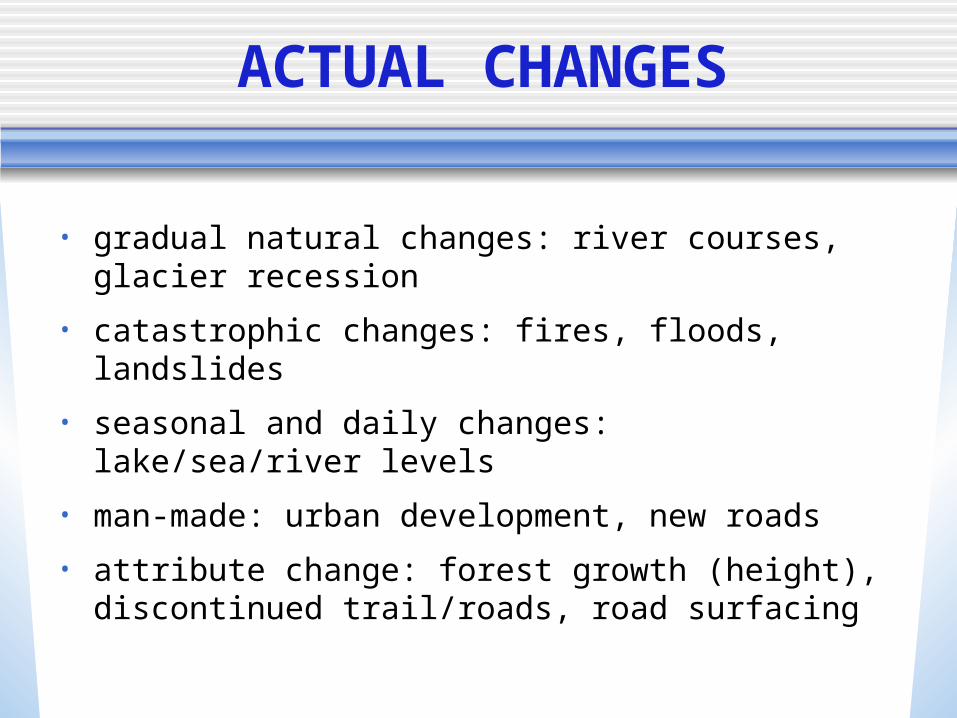
ACTUAL CHANGES
• gradual natural changes: river courses, glacier recession
• catastrophic changes: fires, floods, landslides
• seasonal and daily changes: lake/sea/river levels
• man-made: urban development, new roads
• attribute change: forest growth (height), discontinued trail/roads, road surfacing
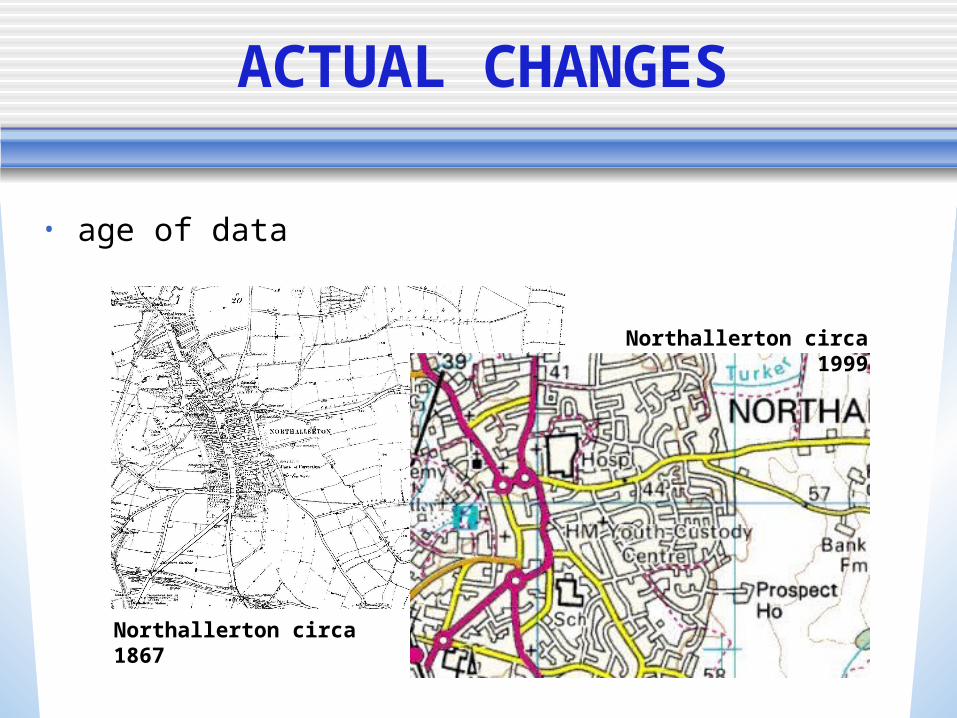
ACTUAL CHANGES
• age of data
Northallerton circa 1867
Northallerton circa 1999
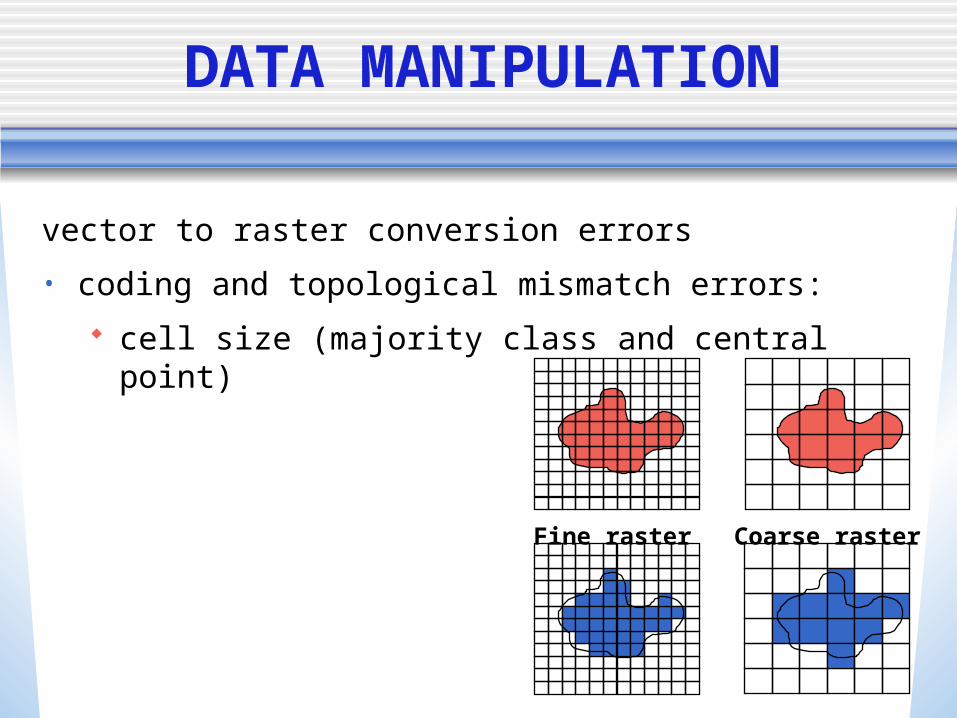
DATA MANIPULATION
vector to raster conversion errors
• coding and topological mismatch errors:
cell size (majority class and central point)
Fine raster Coarse raster
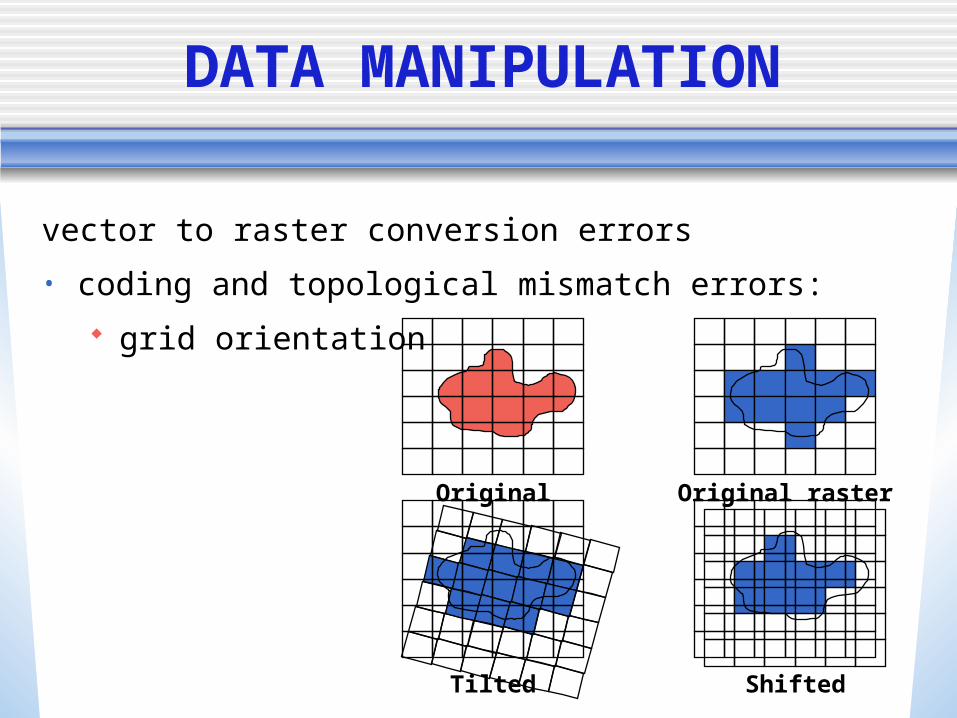
DATA MANIPULATION
vector to raster conversion errors
• coding and topological mismatch errors:
grid orientation
Original Original raster
Tilted Shifted
DATA MANIPULATION
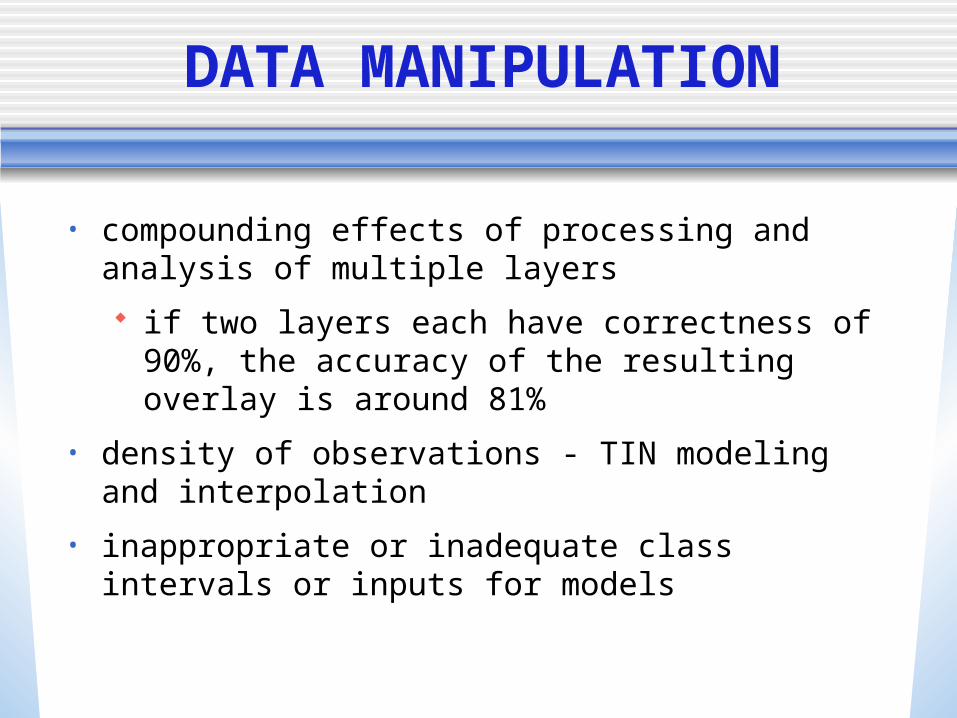
• compounding effects of processing and analysis of multiple layers
if two layers each have correctness of 90%, the accuracy of the resulting overlay is around 81%
• density of observations - TIN modeling and interpolation
• inappropriate or inadequate class intervals or inputs for models
DATA OUTPUT
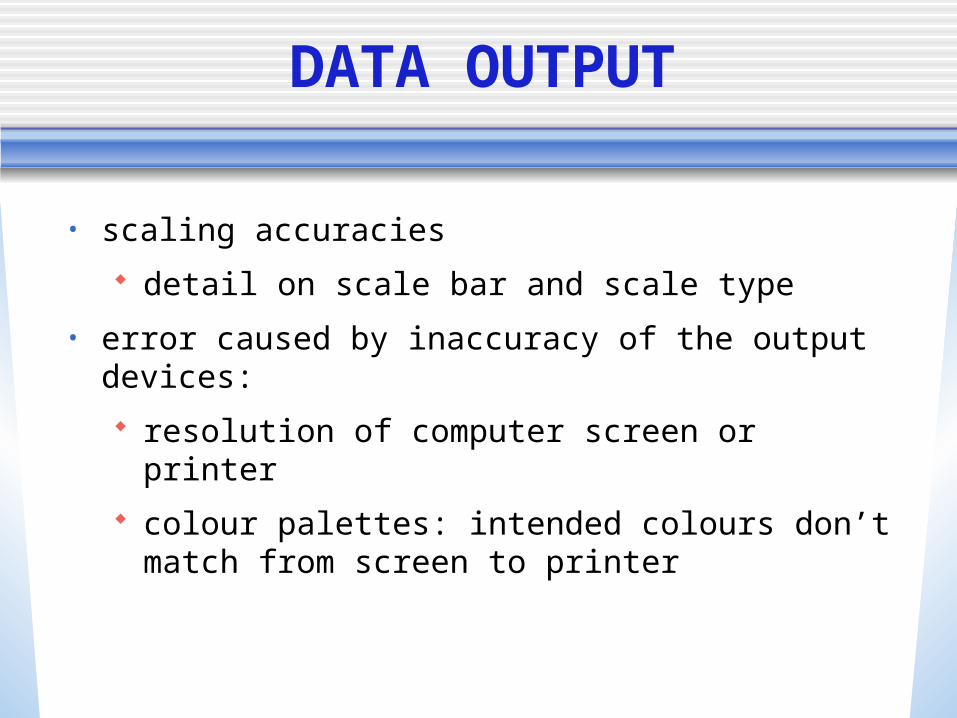
• scaling accuracies
detail on scale bar and scale type
• error caused by inaccuracy of the output devices:
resolution of computer screen or printer
colour palettes: intended colours don’t match from screen to printer
DATA OUTPUT USE
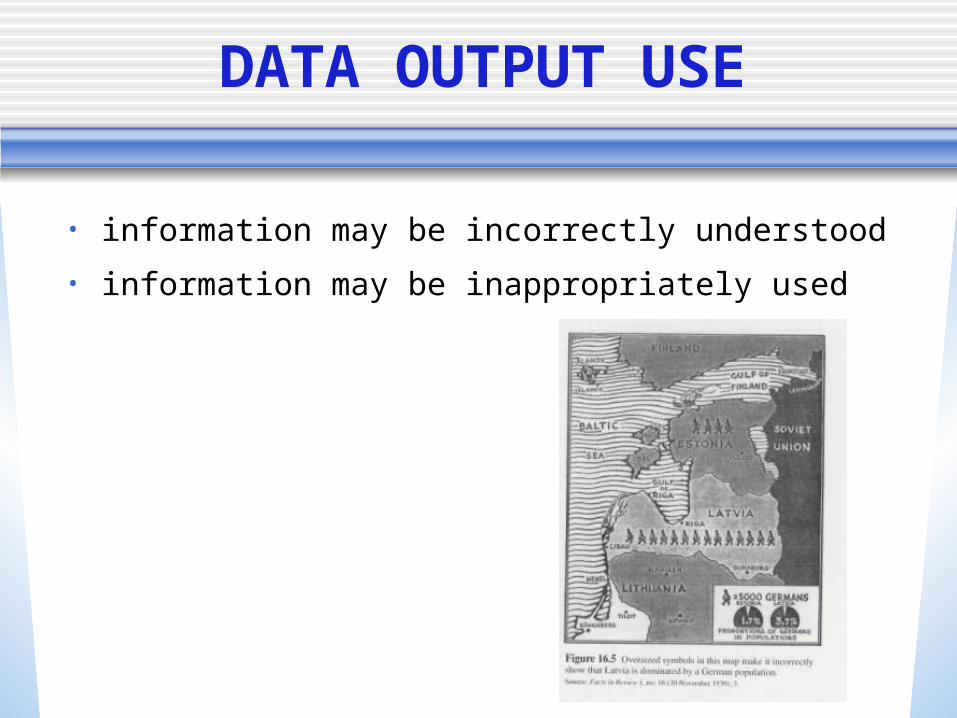
• information may be incorrectly understood
• information may be inappropriately used
HANDLING ERROR
• must learn to cope with error and uncertainty in GIS applications
minimise risk of erroneous results
minimise risk to life/property/environment
• more research needed: mathematical models procedures for handling data error and propagation empirical investigation of data error and effects procedures for using output data uncertainty estimates incorporation as standard GIS tools
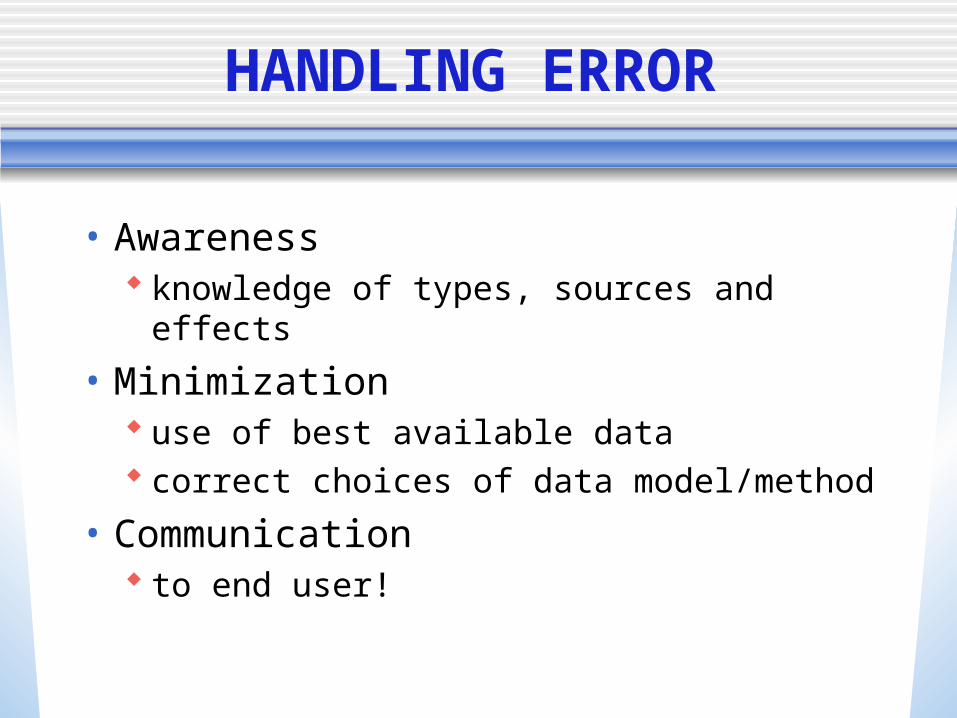
HANDLING ERROR
• Awareness knowledge of types, sources and effects
• Minimization use of best available data correct choices of data model/method
• Communication to end user!