Data Partitions and Complex Models in Bayesian Analysis: The ...
22
Syst. Biol. 53(3):448–469, 2004 Copyright c Society of Systematic Biologists ISSN: 1063-5157 print / 1076-836X online DOI: 10.1080/10635150490445797 Data Partitions and Complex Models in Bayesian Analysis: The Phylogeny of Gymnophthalmid Lizards TODD A. CASTOE, 1 TIFFANY M. DOAN, 2 AND CHRISTOPHER L. PARKINSON 1 1 Department of Biology, University of Central Florida, 4000 Central Florida Boulevard, Orlando, FL 32816-2368, USA; E-mail: [email protected] (T.A.C.), [email protected] (C.L.P.) 2 Biology Department, Vassar College, Box 555, 124 Raymond Avenue, Poughkeepsie, NY 12604-0555, USA; E-mail: [email protected] Abstract.—Phylogenetic studies incorporating multiple loci, and multiple genomes, are becoming increasingly common. Coincident with this trend in genetic sampling, model-based likelihood techniques including Bayesian phylogenetic methods continue to gain popularity. Few studies, however, have examined model fit and sensitivity to such potentially heterogeneous data partitions within combined data analyses using empirical data. Here we investigate the relative model fit and sensitivity of Bayesian phylogenetic methods when alternative site-specific partitions of among-site rate variation (with and without autocorrelated rates) are considered. Our primary goal in choosing a best-fit model was to employ the simplest model that was a good fit to the data while optimizing topology and/or Bayesian posterior probabilities. Thus, we were not interested in complex models that did not practically affect our interpretation of the topology under study. We applied these alternative models to a four-gene data set including one protein-coding nuclear gene (c-mos), one protein-coding mitochondrial gene (ND4), and two mitochondrial rRNA genes (12S and 16S) for the diverse yet poorly known lizard family Gymnophthalmidae. Our results suggest that the best-fit model partitioned among-site rate variation separately among the c-mos, ND4, and 12S + 16S gene regions. We found this model yielded identical topologies to those from analyses based on the GTR+I+G model, but significantly changed posterior probability estimates of clade support. This partitioned model also produced more precise (less variable) estimates of posterior probabilities across generations of long Bayesian runs, compared to runs employing a GTR+I+G model estimated for the combined data. We use this three-way gamma partitioning in Bayesian analyses to reconstruct a robust phylogenetic hypothesis for the relationships of genera within the lizard family Gymnophthalmidae. We then reevaluate the higher-level taxonomic arrangement of the Gymnophthalmidae. Based on our findings, we discuss the utility of nontraditional parameters for modeling among-site rate variation and the implications and future directions for complex model building and testing. [Autocorrelated gamma; Bayesian analysis; combining data; Gymnophthalmidae; likelihood models; partitioning data; Reptilia; site-specific gamma.] Incorporating genetic data from multiple genes, often from multiple genomes, is becoming standard in molec- ular phylogenetics, as is the use of complex model-based likelihood techniques to estimate phylogenetic relation- ships based on these data. Despite numerous authors ad- vocating the superiority of using multiple loci (especially from multiple genomes) to reconstruct phylogenies (e.g., Pamilo and Nei, 1988; Wu, 1991), few have addressed the- oretical and practical effects of modeling sequence evo- lution simultaneously for different genes (but see exam- ples: Yang, 1996a; Caterino et al., 2001; Pupko et al., 2002; Nylander et al., 2004). Using a single model with a single set of parameters to account for evolution over multiple loci in a combined analysis may fail to accurately por- tray locus-specific evolutionary patterns. For instance, protein-coding versus rRNA genes may evolve under drastically different constraints because protein-coding genes commonly experience particularly elevated rates of substitution at the third positions of codons. Riboso- mal RNA genes, on the other hand, may experience rel- atively slow rates of compensatory change over regions corresponding to stem-forming secondary structures in the core of the molecule, yet generally more rapid rates in regions corresponding to functionally unconstrained loops and short-range stems (e.g., Dixon and Hillis, 1993; Simon et al., 1994; Muse, 1995; Hickson et al., 1996; Sav- ill et al., 2001). Even among protein-coding genes or rRNA genes, different patterns of substitution rate het- erogeneity may result from overall differential rates of evolution or differential functional constraints on partic- ular regions within a gene (Hickson et al., 1996; Yang, 1996b; Moncalvo et al., 2000). Considering these poten- tial variations in evolutionary rates across sites, it seems logical that models of molecular evolution that account for heterogeneity with regard to among-site rate vari- ation should be employed to reconstruct phylogenetic trees. The recent shift in phylogenetic methodology towards Bayesian inference of phylogeny has heightened the importance of the use of more realistic evolutionary models. This is important for topological accuracy (e.g., Huelsenbeck, 1995; Huelsenbeck, 1997; Sullivan and Swofford, 2001) as well as accurate estimation of poste- rior probabilities (e.g., Buckley, 2002; Suzuki et al., 2002; Erixon et al., 2003). In general, it has been shown that likelihood methods are fairly robust to model choice in their estimation of topology (Yang et al., 1994; Posada and Crandall, 2001; Sullivan and Swofford, 2001). A ma- jor strength of Bayesian analyses is that posterior prob- ability distributions of trees allow direct interpretation of the likelihood of a particular relationship recovered being true, given the data, the model, and the priors (although the robustness of posterior probabilities has not been thoroughly investigated). However, because the accuracy of posterior probabilities in Bayesian phylo- genetic methods relies inherently on the model, mod- els that do not affect the consensus topology may have notable effects on the posterior probability distribution of parameters, and thus on confidence regarding phy- logenetic conclusions. Therefore, employing complex 448
-
Upload
truongthien -
Category
Documents
-
view
215 -
download
0
Transcript of Data Partitions and Complex Models in Bayesian Analysis: The ...

Syst. Biol. 53(3):448–469, 2004Copyright c© Society of Systematic BiologistsISSN: 1063-5157 print / 1076-836X onlineDOI: 10.1080/10635150490445797
Data Partitions and Complex Models in Bayesian Analysis: The Phylogenyof Gymnophthalmid Lizards
TODD A. CASTOE,1 TIFFANY M. DOAN,2 AND CHRISTOPHER L. PARKINSON1
1Department of Biology, University of Central Florida, 4000 Central Florida Boulevard, Orlando, FL 32816-2368, USA;E-mail: [email protected] (T.A.C.), [email protected] (C.L.P.)
2Biology Department, Vassar College, Box 555, 124 Raymond Avenue, Poughkeepsie, NY 12604-0555, USA;E-mail: [email protected]
Abstract.—Phylogenetic studies incorporating multiple loci, and multiple genomes, are becoming increasingly common.Coincident with this trend in genetic sampling, model-based likelihood techniques including Bayesian phylogenetic methodscontinue to gain popularity. Few studies, however, have examined model fit and sensitivity to such potentially heterogeneousdata partitions within combined data analyses using empirical data. Here we investigate the relative model fit and sensitivityof Bayesian phylogenetic methods when alternative site-specific partitions of among-site rate variation (with and withoutautocorrelated rates) are considered. Our primary goal in choosing a best-fit model was to employ the simplest model thatwas a good fit to the data while optimizing topology and/or Bayesian posterior probabilities. Thus, we were not interestedin complex models that did not practically affect our interpretation of the topology under study. We applied these alternativemodels to a four-gene data set including one protein-coding nuclear gene (c-mos), one protein-coding mitochondrial gene(ND4), and two mitochondrial rRNA genes (12S and 16S) for the diverse yet poorly known lizard family Gymnophthalmidae.Our results suggest that the best-fit model partitioned among-site rate variation separately among the c-mos, ND4, and 12S +16S gene regions. We found this model yielded identical topologies to those from analyses based on the GTR+I+G model, butsignificantly changed posterior probability estimates of clade support. This partitioned model also produced more precise(less variable) estimates of posterior probabilities across generations of long Bayesian runs, compared to runs employinga GTR+I+G model estimated for the combined data. We use this three-way gamma partitioning in Bayesian analyses toreconstruct a robust phylogenetic hypothesis for the relationships of genera within the lizard family Gymnophthalmidae.We then reevaluate the higher-level taxonomic arrangement of the Gymnophthalmidae. Based on our findings, we discussthe utility of nontraditional parameters for modeling among-site rate variation and the implications and future directionsfor complex model building and testing. [Autocorrelated gamma; Bayesian analysis; combining data; Gymnophthalmidae;likelihood models; partitioning data; Reptilia; site-specific gamma.]
Incorporating genetic data from multiple genes, oftenfrom multiple genomes, is becoming standard in molec-ular phylogenetics, as is the use of complex model-basedlikelihood techniques to estimate phylogenetic relation-ships based on these data. Despite numerous authors ad-vocating the superiority of using multiple loci (especiallyfrom multiple genomes) to reconstruct phylogenies (e.g.,Pamilo and Nei, 1988; Wu, 1991), few have addressed the-oretical and practical effects of modeling sequence evo-lution simultaneously for different genes (but see exam-ples: Yang, 1996a; Caterino et al., 2001; Pupko et al., 2002;Nylander et al., 2004). Using a single model with a singleset of parameters to account for evolution over multipleloci in a combined analysis may fail to accurately por-tray locus-specific evolutionary patterns. For instance,protein-coding versus rRNA genes may evolve underdrastically different constraints because protein-codinggenes commonly experience particularly elevated ratesof substitution at the third positions of codons. Riboso-mal RNA genes, on the other hand, may experience rel-atively slow rates of compensatory change over regionscorresponding to stem-forming secondary structures inthe core of the molecule, yet generally more rapid ratesin regions corresponding to functionally unconstrainedloops and short-range stems (e.g., Dixon and Hillis, 1993;Simon et al., 1994; Muse, 1995; Hickson et al., 1996; Sav-ill et al., 2001). Even among protein-coding genes orrRNA genes, different patterns of substitution rate het-erogeneity may result from overall differential rates ofevolution or differential functional constraints on partic-
ular regions within a gene (Hickson et al., 1996; Yang,1996b; Moncalvo et al., 2000). Considering these poten-tial variations in evolutionary rates across sites, it seemslogical that models of molecular evolution that accountfor heterogeneity with regard to among-site rate vari-ation should be employed to reconstruct phylogenetictrees.
The recent shift in phylogenetic methodology towardsBayesian inference of phylogeny has heightened theimportance of the use of more realistic evolutionarymodels. This is important for topological accuracy (e.g.,Huelsenbeck, 1995; Huelsenbeck, 1997; Sullivan andSwofford, 2001) as well as accurate estimation of poste-rior probabilities (e.g., Buckley, 2002; Suzuki et al., 2002;Erixon et al., 2003). In general, it has been shown thatlikelihood methods are fairly robust to model choice intheir estimation of topology (Yang et al., 1994; Posadaand Crandall, 2001; Sullivan and Swofford, 2001). A ma-jor strength of Bayesian analyses is that posterior prob-ability distributions of trees allow direct interpretationof the likelihood of a particular relationship recoveredbeing true, given the data, the model, and the priors(although the robustness of posterior probabilities hasnot been thoroughly investigated). However, because theaccuracy of posterior probabilities in Bayesian phylo-genetic methods relies inherently on the model, mod-els that do not affect the consensus topology may havenotable effects on the posterior probability distributionof parameters, and thus on confidence regarding phy-logenetic conclusions. Therefore, employing complex
448

2004 CASTOE ET AL.—BAYESIAN ANALYSIS WITH PARTITIONS AND COMPLEX MODELS 449
models that more accurately portray DNA evolutionshould produce less biased posterior probability esti-mates as long as parameters can be accurately estimatedfrom the data.
The accuracy of posterior probability estimates inBayesian phylogenetic reconstruction and the factorsthat may affect this accuracy remain unclear. Many stud-ies suggest Bayesian posterior probabilities appear tobe inflated compared to conventional bootstrap support(e.g., Leache and Reeder, 2002; Cummings et al., 2003;Douady et al., 2003). However, the accuracy of poste-rior probability support values in terms of both type Iand type II error remains unresolved (e.g., Buckley, 2002;Suzuki et al., 2002; Wilcox et al., 2002; Alfaro et al., 2003).Despite this, evidence is accumulating that suggests adirect relationship between accuracy of posterior proba-bilities and model complexity whereby Bayesian analy-ses conducted with underparameterized models appearto experience higher error rates compared with param-eter rich models (Suzuki et al., 2002; Wilcox et al., 2002;Erixon et al., 2003). However, benefits of constructingand employing more realistic evolutionary models ofDNA substitution are challenged by the potential for im-precise and inaccurate parameter estimation (includingtopology) resulting from overparameterization. Givenever-increasing computational power, in addition to thespeed afforded by Bayesian Markov Chain Monte Carlophylogenetic methods, the need for accurate models andmodel testing is apparent.
Our primary goal in this paper is to concentrate onevaluation of alternative models that practically affectphylogenetic inference. Specifically, we designed ourapproaches to make final decisions about best-fittingmodels based on the effects they had on topology andposterior probability estimates. This is important be-cause although some alternative, relatively parameter-rich models may provide a better fit to the data, theymay not result in alternative topologies or significantlydifferent posterior probability estimates. In such cases,our strategy would instead favor a model with fewerparameters that produced essentially the same topologyand posterior probability support estimates.
In this study, the genes used to reconstruct phylo-genies are diverse and include one protein-coding nu-clear gene (c-mos), one protein-coding mitochondrialgene (ND4), and two rRNA mitochondrial gene frag-ments (12S and 16S). We focused on the constructionand evaluation of models that utilize alternatively par-titioned patterns of among-site rate variation to accountfor heterogeneous evolution of multiple loci in a com-bined phylogenetic analysis. Particularly, MrBayes v2.01allows among-site rate variation (gamma; Yang, 1993) tobe partitioned among defined sites (site-specific gamma)as well as allowing the use of an autocorrelated gammaparameter to account for local autocorrelation of among-site rates (Kimura, 1985; Schoniger and von Haeseler,1994; Yang, 1995; Nielsen, 1997). These models allowgamma parameter for among-site rate variation to berescaled across partitions while using a single rate nu-cleotide substitution rate matrix for the entire data set.
Along with conventional models of sequence evolution(e.g., GTR+I+G), we explore more complex models thatpartition the among-site rate variation in various waysamong loci, in addition to those that employ an addi-tional parameter for autocorrelation of site rate varia-tion. We examine the phylogenetic hypotheses result-ing from several alternative partitions of among-site ratevariation and discuss their relevance to Bayesian sup-port for clades and support for alternative topologicalplacements of clades.
The taxonomic group examined in this study, lizardsof the family Gymnophthalmidae, comprises a large ra-diation consisting of approximately 34 genera and 180species occurring throughout South America with rela-tively few species in Middle America (Pellegrino et al.,2001; Doan, 2003a). The family is composed of small tomedium lizards that occur in a variety of habitats andoccupy a wide range of niches. This lizard group hasbeen poorly studied with many species unknown be-yond their original descriptions.
Relationships of genera within the family Gymnoph-thalmidae are poorly understood. The most comprehen-sive and contemporary revision of the supergeneric clas-sification of the family Gymnophthalmidae was madeby Pellegrino et al. (2001). They reconstructed a phy-logeny of 50 species in 24 genera (recently reduced from26 by Doan, 2003a) using five genes (two nuclear andthree mitochondrial). Based on their reconstruction theyerected four subfamilies and four tribes. The subfam-ily Alopoglossinae, consists solely of Alopoglossus. Thesubfamily Gymnophthalminae contains 13 genera, di-vided into two tribes, the Heterodactylini (5 genera)and the Gymnophthalmini (8 genera). The subfamilyRhachisaurinae is monotypic, consisting of Rhachisaurusbrachylepis, a new genus separated from Anotosaura. Thefinal subfamily, the Cercosaurinae, consists of 20 generadivided into tribe Cercosaurini (14 genera) and tribe Ec-pleopini (6 genera).
Harris (2003) used c-mos sequences to reconstruct aphylogeny of the Squamata with concentrated taxonsampling in the Gymnophthalmidae. He primarily usedPellegrino et al.’s (2001) sequences but added a new se-quence of Proctoporus bolivianus. Harris’s (2003) recon-struction differed from Pellegrino et al.’s in the placementof Ptychoglossus, Bachia, Arthrosaura, and several smallerscale relationships. In addition, a teiid genus, Tupinambis,was nested within the Gymnophthalmidae as the sisterto Ptychoglossus and Alopoglossus (although this relation-ship received bootstrap and posterior probability sup-port below 50%).
Missing from Pellegrino et al.’s (2001) study were 10genera. Whereas Pellegrino et al. sampled all generaof Alopoglossinae, Rhachisaurinae, and Gymnoph-thalmini, they lacked Stenolepis from the Heterodactylini,Amapasaurus from the Ecpleopini, and eight genera fromthe Cercosaurini. The limited taxon sampling of the Cer-cosaurini renders conclusions about that tribe problem-atic (see Hillis, 1998) because only half of the generaand 18 of the approximately 121 species were sampled(14.9%).

450 SYSTEMATIC BIOLOGY VOL. 53
In addition to limited taxon sampling, the separategene partitions were often in conflict with regards to thepositions and relationships of many key taxa (Pellegrinoet al., 2001). Such conflicts put into doubt the subfamilialand/or tribal placement of genera such as Ptychoglos-sus, Rhachisaurus, Bachia, and Neusticurus. Our study ad-dresses some of the problems suggested in the combinedanalysis of Pellegrino et al. (2001) and fills in some sig-nificant gaps in taxon sampling. Concentrating on theCercosaurini, we add 19 new individuals, including 12new species and one new genus, as well as an additionalindividual of Ptychoglossus brevifrontalis (a total of 73 ad-ditional sequences). With this greater taxon samplingwe clarify the relationships and classification withinfamily Gymnophthalmidae. In addition to adding moretaxa, we utilize a Bayesian approach to the phylogenyto complement the standard parsimony and likelihoodmethods used by Pellegrino et al. (2001). We synthe-size this information, emphasizing overall phylogeneticevidence, and propose an alternative hypothesis forthe intergeneric relationships and taxonomy within thefamily.
The objectives of our study included (1) evaluatingthe effects of partitioning among-site rate variation andamong-site rate autocorrelation parameters on phyloge-netic topology and posterior probabilities for relation-ships, (2) developing a robust strategy for choosing thebest-fit model for among-site rate variation consideringpractical effects on topology and posterior probabilitysupport, (3) identifying the most likely and robust phy-logenetic hypothesis for relationships among gymnoph-thalmid lizards, and (4) reevaluating the supergenericclassification of the family based on our best estimate ofgymnophthalmid phylogeny.
METHODS
DNA Sequences Used
A significant subset of the sequences used in this studyis from Pellegrino et al. (2001) and Doan and Castoe(2003). Additional sequences of gymnophthalmid lizardswere added to this dataset. Of the five genes used by Pel-legrino et al. (2001), we chose to use and expand uponfour: mitochondrial NADH dehydrogenase subunit 4(ND4), mitochondrial small subunit rRNA gene (12S),mitochondrial large subunit rRNA gene (16S), and thenuclear oocyte maturation factor gene (c-mos). The nu-clear small subunit rRNA gene (18S) used by Pellegrinoet al. (2001) was omitted from our study for two reasons:(1) low phylogenetic signal apparent from the Pellegrinoet al. (2001) study, and (2) the nuclear gene for 18S oc-curs in hundreds or thousands of copies per nucleargenome (e.g., humans: International Human GenomeSequencing Consortium, 2001; Xenopus: Pardue, 1974;Long and Dawid, 1980). Using sequences of this mul-ticopy gene to resolve relationships principally amongspecies and genera within a family may increase thepotential for recovery of misleading phylogenetic esti-mates based on incomplete gene conversion among al-leles at different loci or differential fixation of alleles
among loci (Gasser et al., 1998; Gonzalez and Sylvester,2001).
Laboratory methods for obtaining novel sequencesused in this study are as follows. Where possible, two in-dividuals of each taxon from distant sampling localitieswere added to the data set. Genomic DNA was isolatedfrom tissue samples (liver or skin preserved in ethanol)using the Qiagen DNeasy extraction kit and protocol(Qiagen Inc., Hilden, Germany). The mitochondrial ND4gene was amplified via polymerase chain reaction (PCR)using the primers ND4 and LEU as described in Arevaloet al. (1994). Mitochondrial ribosomal small and largesubunit genes (12S and 16S) were amplified as describedin Parkinson et al. (1997, 1999). The nuclear c-mos genewas amplified with primers G73 and G74 as describedin Saint et al. (1998) and Pellegrino et al. (2001). PositivePCR products were excised from agarose electrophoreticgels and purified using the GeneCleanIII kit (BIO101).Purified PCR products were sequenced in both directionswith the amplification primers (and for ND4, an addi-tional internal primer HIS, Arevalo et al., 1994). Samplesthat could not be sufficiently sequenced directly werecloned using the Topo TA cloning kit (Invitrogen) ac-cording to the manufacturer’s protocols. Plasmids wereisolated from multiple clones per individual using theQiaquick spin miniprep kit (Qiagen). Plasmids were se-quenced using M13 primers (provided by Topo TA kit,Invitrogen) and, in some cases, the internal HIS primerfor ND4. Purified PCR products and plasmids were se-quenced using the CEQ D Dye Terminator Cycle Se-quencing (DTCS) Quick Start Kit (Beckman-Coulter) andrun on a Beckman CEQ2000 automated sequencer ac-cording to the manufacturers’ protocols. Raw sequencechromatographs for sequences generated in this studywere edited using Sequencher 3.1 (Gene Codes Corp.).In cases where gene fragments were cloned, all sequencesfrom a single individual were edited together. Novel se-quences were deposited in GenBank. The GenBank ac-cession number for each gene sequence used in this study(including novel sequences) are given in Appendix 1.
Sequence Homology and Alignment
Multiple sequence alignment was performed usingClustalW (Thompson et al., 1994). Initial alignmentswere conducted with a gap opening penalty of 10, agap extension penalty of 1, and a transition weight of0.5. For rRNA genes (12S and 16S), alternative multi-ple alignments were examined with gap opening andgap extension penalties ranging from 10 and 10 (re-spectively) to 1 and 1, including varying ratios in thisrange. Initial alignments for protein-coding genes (ND4and c-mos) were rechecked based on the homology oftheir translated amino acid sequence using GeneDoc(Nicholas and Nicholas, 1997). The ND4 alignment wasunambiguous and not edited manually and the c-mosalignment was slightly manually modified to maximizeamino acid similarity over a short indel region withinthe alignment. Alternative automated alignments (fromClustalW) for rRNA genes (12S and 16S) were compared,

2004 CASTOE ET AL.—BAYESIAN ANALYSIS WITH PARTITIONS AND COMPLEX MODELS 451
along with estimates of secondary structures (Gutell,1994; Gutell et al., 1994; Titus and Frost, 1996), to evalu-ate evidence for positional homology. Positions in rRNAgenes where alignment was ambiguous were excluded.To minimize the effects of missing data resulting fromincomplete sequences, all gene alignments were trun-cated at the 5′ and 3′ ends. The final alignment of allconcatenated genes, including positions excluded fromphylogenetic analyses, is available as supplemental dataat http://biology.ucf.edu/∼clp/Lab/Lab.htm.
Phylogeny Estimation Using Maximum Parsimony
We inferred phylogenies based on the maximum parsi-mony (MP) criterion in PAUP∗ v4.0b10 (Swofford, 2002)and Bayesian (Markov Chain Monte Carlo, MCMC) anal-ysis in MrBayes v2.01 (Huelsenbeck and Ronquist, 2001).Phylogenetic inference was conducted, hierarchically,in three steps: (1) all genes individually, (2) intermedi-ate partitions including both rRNA genes (12S + 16S)and all mitochondrial genes (mtgenes), and (3) the com-bined concatenated data set including all four genes.For MP analyses of independent genes and intermedi-ate partitions, we conducted equally weighted parsi-mony searches using the heuristic strategy with 200 ran-dom taxon addition sequence replicates. Settings for MPanalyses were tree bisection-reconnection branch swap-ping, steepest descent off, and MULTREES option on(Swofford, 2002). For all individual genes and interme-diate partitions (rRNA and mtgenes), we assessed sup-port for clades using 200 nonparametric bootstrap pseu-doreplicates (Felsenstein, 1985) with 20 random taxonaddition sequence replicates implemented with PAUP∗.For the combined MP analysis of all genes, we searchedfor trees using equally weighted parsimony heuristicsearches with 1000 random taxon addition sequencereplicates and assessed clade support with 200 bootstrappseudoreplicates with 200 random addition sequencereplicates per bootstrap pseudoreplicate. We consider re-lationships that are supported by at least 70% bootstrapto be significantly resolved (Hillis and Bull, 1993).
Bayesian Phylogeny Estimation
ModelTest version 3.0 (Posada and Crandall, 1998)was used to infer the best-fit model of evolution foreach gene data set (individual genes, intermediate par-titions, and total combined data) based on hierarchicallog-likelihood ratio tests comparing successively com-plex models (Huelsenbeck and Crandall, 1997; Posadaand Crandall, 2001).
All MCMC phylogenetic reconstructions were con-ducted in MrBayes v2.01 (Huelsenbeck and Ronquist,2001) with vague priors (as per the program’s defaults)and model parameters estimated as part of the analyses.Three heated chains and a single cold chain were usedin all MCMC analyses and runs were initiated with ran-dom trees, as per the program’s defaults. Trees were sam-pled every 100 generations and majority rule consensusphylograms and posterior probabilities for nodes wereassembled from all post burn-in sampled trees. Phylo-
genetic reconstructions for all data partitions were es-timated using three independent runs to confirm thatstationarity (or global optimality) was reached and thatindependent runs converged on similar stationary pa-rameter estimates. Each of these data partition runs wasconducted with a total of 1.4 million generations, 400,000of which were discarded as burn-in, yielding 1 millionpost burn-in generations.
Each MCMC run for all individual gene and interme-diate data partitions employed the model selected byModelTest for that partition, or the nearest model to thatmodel that could be implemented in MrBayes. The to-tal combined data set was subjected to MCMC analysesunder multiple alternative evolutionary models whichdiffered in the way they parameterized among-site ratevariation.
The most complex (parameter rich) model that Mod-elTest v3.0 can evaluate is a general time reversible(GTR; Tavare, 1986) model with an estimated propor-tion of invariant sites (I) and gamma distributed among-site rate variation (G; Yang, 1993). MrBayes v2.01 iscapable of employing more complex models than thisGTR+I+G model. MrBayes allows among-site rate vari-ation to be partitioned among user defined sites (site-specific gamma; SSG) as well as allowing the use of anautocorrelated gamma (A; e.g., Yang, 1995; Penny et al.,2001; Huelsenbeck, 2002) to account for autocorrelationof among-site rates. These two modifications of among-site rate variation may be used independently as well assimultaneously in a given model in MrBayes. In addi-tion to the GTR+I+G model, we conducted combineddata MCMC analyses with alternative models that par-titioned gamma with (SAG) and without (SSG) account-ing for autocorrelation (A) of rates. These two alternativeways to estimate among-site rate variation were invokedby the commands “rates = ssadgamma” and “rates = ss-gamma” (respectively) in the MrBayes 2.01 commandblock. All models applied a single common GTR sub-stitution rate matrix across all data and differed onlyin the way they modeled and partitioned among-siterates according to the following a priori partitions: GTR+ autocorrelated gamma (GTR+AG); protein-codinggenes versus rRNA genes (PR-SSG and PR-SAG); nuclearversus mitochondrial genes (NM-SSG and NM-SAG);c-mos versus ND4 versus rRNA genes (CNR-SSG andCNR-SAG); all genes partitioned independently (4gene-SSG and 4gene-SAG). Table 1 provides a summary of theparametric content of each of these models.
Choosing among these models to identify the bestmodel of evolution on which to base phylogenetic andtaxonomic decisions was approached in several ways.Our goal was to find the model of evolution which bestfit the data yet contained the fewest total parameters(the best-fit model). Specifically, our major criteria foridentification of the simplest best-fit model included thedemonstration of clear improvements of likelihood es-timates under that model, along with a practical effecton topology and/or posterior probability support forclades. Therefore, we were not interested in more com-plex models that did not estimate a different topology

452 SYSTEMATIC BIOLOGY VOL. 53
TABLE 1. Parametric composition of models tested in Bayesian MCMC analyses of the combined data.
Nucleotide Model parameters in addition Gamma autocorrelation Site (= partition)-Model name substitution matrix to GTR matrix Gamma parameter parameter specific gamma parameters
GTR+I+G GTR 2 + − −GTR+AG GTR 2 + + −NM-SSG GTR 3 + − 2PR-SSG GTR 3 + − 2NM-SAG GTR 4 + + 2PR-SAG GTR 4 + + 2CNR-SSG GTR 5 + − 3CNR-SAG GTR 6 + + 34gene-SSG GTR 6 + − 44gene-SAG GTR 7 + + 4
or have significant effects on posterior probability esti-mates. Once a tentative model was chosen, this modelwas rigorously tested for overparameterization and un-reliability (which would suggest it was not a candidatefor the best-fit model).
We examined the burn-in plots of likelihoods forMCMC chains for each model to determine the rate ofascent to an apparent stationary plateau, in additionto the degree of overlap between models and superi-ority (based on chain likelihood values) of models, rel-ative to the number of parameters they employed. Toexamine the relative improvement in likelihood scoreswith respect to model complexity, we compared the95% credibility interval (CI) of MCMC chain likeli-hood scores between models. To calculate the 95% CI,we ranked all post burn-in tree estimates by ln like-lihood and included the most likely 95% (Felsenstein,1968; Huelsenbeck et al., 2002). Once a tentative best-fitwas identified, we evaluated parameter burn-in plots ofthese models for evidence of identifiability of param-eters by checking for commonality in parameter esti-mates among runs. We also examined the sensitivity ofposterior probability values to model complexity usingWilcoxon signed rank tests implemented with Statistica(StatSoft, 1993) to test for significant changes in poste-rior probability estimates between the chosen model andthose which were proximal alternative best-fit models.For interpretation of phylogenetic inferences, we con-sider posterior probability values over 95% to be wellresolved.
In addition to the three independent MCMC runs (1.4million generations each) conducted for each model, weconducted a single MCMC run for an extended numberof generations (33 million generations) for the two mainalternative best-fit models (GTR+I+G and CNR-SSG) forthe combined data set. For each long MCMC run, the pos-terior probabilities for clades were monitored in intervalsof two million generations to examine any trends and theoverall precision associated with posterior probabilityestimates through generations of extended MCMC runs.Additionally, posterior probabilities of clades estimatedfrom these long MCMC runs were compared to thoseestimated from the initial three MCMC runs per model(run for 1.4 million generations) to examine the effect thatMCMC analysis strategy (multiple short runs versus sin-gle long run) has on estimates of posterior probabilities.
Posterior probabilities estimated from these long runswere also used to re-test for significant changes in poste-rior probability estimates derived from analyses underalternative models (as described above).
RESULTS
A total of 1810 characters were included in the analy-sis (c-mos 408 bp; ND4 623 bp; 12S 331 bp; 16S 448 bp).Details of optimal trees selected by maximum parsimonyand best-fit models of evolution selected by ModelTest(Posada and Crandall, 1998) are presented in Table 2.After preliminary phylogenetic reconstructions, weidentified several apparent problems with the Pelle-grino et al. (2001) data set, including switching of taxonnames and apparent contamination, which we rectifiedprior to final analyses. These are discussed in detail inAppendix 2.
Parsimony Phylogenetic Reconstruction
The total evidence (all four genes) equally weightedparsimony reconstruction resulted in two most parsimo-nious trees of 6600 steps with 769 parsimony-informativecharacters and CI = 0.228, RI = 0.543, RC = 0.124, HI =0.772 (Fig. 1). Six major clades were recovered, eachwith high bootstrap support (70% to 100%) and differ-ing from the reconstruction of Pellegrino et al. (2001).Whereas the earliest split within the Gymnophthalmi-dae in Pellegrino et al. (2001) was the divergence of aclade composed of the three Alopoglossus species fromall others, we recovered a clade of Alopoglossus spp. andPtychoglossus brevifrontalis. As explained in Appendix2, an apparent taxon name error in the 12S and 16Sdata sets presumably resulted in the erroneous place-ment of Ptychoglossus in the Cercosaurinae. In additionto the Alopoglossus + Ptychoglossus clade, five other ma-jor clades were present, each of which had bootstrapsupport of 70% or greater. Relationships among theseclades did not receive high bootstrap support. The Het-erodactylini was sister to the Gymnophthalmini, sup-porting a monophyletic Gymnophthalminae with highbootstrap support (99%). The other three clades includeda clade of Bachia + Rhachisaurus, the Ecpleopini, and theCercosaurini. Monophyly of the Cercosaurinae did notreceive strong bootstrap support.

2004 CASTOE ET AL.—BAYESIAN ANALYSIS WITH PARTITIONS AND COMPLEX MODELS 453
TABLE 2. Statistics for datasets used, including results from MP searches and suggested model from hierarchical ln likelihood ratio test(hLRT) criterion from ModelTest.
c-mos ND4 12S 16Sa All rRNA All mt All protein Total
Number of characters 408 623 331 448 779 1402 1031 1810Parsimony-informative 173 363 112 121 233 596 536 769Number of trees 666 30 5195 >120,000 5065 6 4 2Optimal tree score 566 4365 749 739 1547 5990 4976 6600CI 0.528 0.177 0.290 0.296 0.282 0.202 0.215 0.228HI 0.472 0.823 0.710 0.704 0.718 0.798 0.785 0.772hLRT-selected model K80+G GTR+I+G TrN+I+G TrN+I+G HKY+I+G TVM+I+G TVM+I+G GTR+I+GProportion invariable sites — 0.321 0.421 0.551 0.535 0.461 0.331 0.432Gamma parameter 0.595 0.506 0.543 0.511 0.657 0.564 0.519 0.553Ti:Tv ratio 2.67 — — — 2.651 — — —Rate matrix
r(A-C) — 0.301 1 1 — 0.438 0.411 0.553r(A-G) — 6.907 12.086 3.023 — 3.531 4.370 4.101r(A-T) — 0.648 1 1 — 0.476 0.543 0.530r(C-G) — 0.429 1 1 — 0.179 0.630 0.384r(C-T) — 4.648 5.352 7.150 — 3.531 4.370 3.608r(G-T) — 1 1 1 — 1 1 1
aWe were unable to complete the 16S run due to the enormous computational time required to store and evaluate the high number of optimal trees. To makesearching this data set feasible, we ran a heuristic search with 8000 random addition sequence replicates saving no more than 50 trees at each step.
Mitochondrial Gene MCMC AnalysesBased on hierarchical log likelihood ratio tests (hLRTs)
of successively complex models of sequence evolution,ModelTest indicated the best-fit model for the combinedmitochondrial dataset was the TVM+I+G (Table 2). Thismodel of evolution, characterized by a five-parameternucleotide substitution rate matrix, is not currently avail-able in MrBayes. Instead, the next best-fitting param-eter rich model, which employs a GTR six-parameternucleotide substitution rate matrix, was employed withproportion of invariant sites (I) and gamma distributedamong-site rate variation (G). Parameter estimates de-rived from the combination of all post burn-in estimatesfrom the three independent MCMC runs are summarizedin Table 3. All three runs reached apparent stationarity(in estimates of substitution model parameters, as wellas chain likelihood scores) prior to 50,000 generations,well before the conservative burn-in period of 400,000generations.
The all mitochondrial data partition MCMC recon-struction (Fig. 2a) contrasts with the Pellegrino et al.(2001) reconstruction in the relative phylogenetic place-
TABLE 3. Parameter estimates for all mitochondrial gene and c-mos.
All mt genes—All runs c-mos—All runs
ln likelihood −26274.1 (−26295.6 to −26254.2) −3616.0 (−3634.3 to −3599.0)pi(A) 0.397 (0.380–0.416) 0.259 (0.0.230–0.289)pi(C) 0.283 (0.269–0.297) 0.265 (0.236–0.294)pi(G) 0.077 (0.070–0.084) 0.243 (0.215–0.272)pi(T) 0.243 (0.230–0.256) 0.233 (0.205–0.262)r(A-C) 0.406 (0.310–0.524) —r(A-G) 4.236 (3.497–5.091) —r(A-T) 0.470 (0.351–0.604) —r(C-G) 0.201 (0.124–0.300) —r(C-T) 3.641 (2.910–4.459) —r(G-T) 1 —Tv:Ti ratio — 5.432 (4.490–6.534)Gamma parameter 0.503 (0.462–0.547) 0.644 (0.517–0.803)Proportion of invariable sites 0.419 (0.387–0.450) —
ment of major clades deep in the phylogeny, but poste-rior probability support for some the relationships wasnot high. As in the parsimony reconstruction describedabove, Alopoglossus and Ptychoglossus form a clade sisterto the remaining gymnophthalmids. The next node splitsthe Ecpleopini from the remainder of the taxa (but withlow posterior probability support). Of the three MCMCruns, one differed slightly with regard to the structureof the remainder of the tree. Examination of this differ-ence among runs revealed that the difference betweenthe majority rule topologies from post burn-in MCMCtrees resulted from an approximately 1% difference be-tween runs in the posterior probability density support-ing one relationship over another (both of which receivedposterior probabilities below 50%). Figure 2a depicts theconsensus of those three runs that collapses nodes inconflict, creating a polytomy of Rhachisaurus, Bachia, theGymnophthalminae, and the Cercosaurini minus Bachia.Even with the differences among the reconstructions,the lack of monophyly of the Cercosaurinae differs fromPellegrino et al. (2001; their Fig. 4) and our parsimonyreconstruction (Fig. 1).

454 SYSTEMATIC BIOLOGY VOL. 53
FIGURE 1. Strict consensus phylogram of two most parsimonious trees based on the equally weighted maximum parsimony search includingall four genes (c-mos, ND4, 12S, and 16S). Labels (a) and (b) indicate individuals of a species (see Appendix 1). For reference, labels on the rightside represent the taxonomy presented by Pellegrino et al. (2001). Taxa that are not labeled have relationships that do not agree with that formertaxonomy.
C-mos (Nuclear Gene) MCMC AnalysesBased on hLRTs of successively complex models of
sequence evolution, ModelTest indicated the best-fitmodel for the combined mitochondrial dataset was the
K80+G model (Table 2). Parameter estimates derivedfrom the combination of all post burn-in estimates fromthe three independent MCMC runs, using a K80 + Gmodel, are summarized in Table 3. All three runs reached

2004 CASTOE ET AL.—BAYESIAN ANALYSIS WITH PARTITIONS AND COMPLEX MODELS 455
FIGURE 2. Bayesian phylogenetic trees for the independent nuclear and mitochondrial data partitions. Labels (a) and (b) indicate individualsof a species (see Appendix 1). (a) Majority rule phylogram and posterior probabilities resulting from Bayesian analysis of all three mitochondrialgenes combined (ND4, 12S, and 16S) based on a combined 3 million post burn-in generations under the GTR+I+G model of evolution. (b) Majorityrule phylogram and posterior probabilities resulting from Bayesian analysis of nuclear c-mos gene data based on a combined 3 million postburn-in generations under the K80+G model of evolution.

456 SYSTEMATIC BIOLOGY VOL. 53
apparent stationarity (in estimates of substitution modelparameters, as well as chain likelihood scores) prior to50,000 generations.
The nuclear c-mos reconstruction (Fig. 2b) differs fromthat of Pellegrino et al. (2001), Harris (2003), in our par-simony reconstruction (Fig. 1), and our mitochondrialreconstruction (Fig. 2a). As with Harris (2003), in ourparsimony reconstruction, and our mitochondrial DNAreconstruction, Alopoglossus and Ptychoglossus form abasal clade. Similar to our parsimony reconstruction,four additional major clades are formed, each with highposterior probability support for clade monophyly, butlow support of the relationships among the clades. TheGymnophthalminae forms a monophyletic group withstrong posterior probability support. The Cercosauri-nae is not monophyletic because there is strong sup-port for the Ecpleopini being only distantly related tothe Cercosaurini. Additionally, as in the parsimony re-construction, Bachia and Rhachisaurus form a clade. Asin Pellegrino et al.’s (2001) maximum likelihood recon-struction, but differing from our parsimony reconstruc-tion, tribe Heterodactylini is not monophyletic but is pa-raphyletic with respect to the Gymnophthalmini.
Combined MCMC Analyses
Based on the hLRT criterion for model selection, Mod-elTest chose the GTR+I+G model of nucleotide substi-tution for the combined data set (Table 2). Burn-in plotsof likelihood scores of MCMC chains conducted withthis model and alternative models are shown in Figure 3and mean stationary values (with 95% CI) across mod-
-30700
-30650
-30600
-30550
-30500
-30450
-30400
-30350
-30300
-302500 200000 400000 600000 800000 1000000 1200000 1400000
Generation
CNR-SAG
4gene-SAG
4gene-SSG
CNR-SSG
GTR+I+G
PR-SAG
NM-SAG
PR-SSG
NM-SSG
GTR-AG
FIGURE 3. The ln likelihood scores of MCMC chains based on alternative models of evolution, sampled in 10,000 generation intervals forclarity of presentation. See text for descriptions of alternative models.
Models
-30650
-30600
-30550
-30500
-30450
-30400
-30350
-30300
-30250
FIGURE 4. The mean and 95% credibility interval for post burn-inln likelihood scores of MCMC chains based on alternative models ofevolution. See text for descriptions of alternative models.
els are compared in Figure 4. A more detailed plot ofthe ascent of likelihood scores of chains toward station-arity for each model is shown in Figure 5. Although weonly show burn-in plots for chains from one of three

2004 CASTOE ET AL.—BAYESIAN ANALYSIS WITH PARTITIONS AND COMPLEX MODELS 457
Generations
-30800
-30700
-30600
-30500
-30400
-30300
-302000 5000 10000 15000 20000 25000 30000 35000 40000 45000 50000
Generations
4gene-SAG
CNR-SAG
CNR-SSG
4gene-SSG
GTR+I+G
PR-SAG
PR-SSG
NM-SAG
NM-SSG
GTR+AG
FIGURE 5. The ln likelihood scores of MCMC chains based on alternative models of evolution, focusing on the period below 50,000 generations,sampled every 100 generations. See text for descriptions of alternative models.
individual MCMC analyses for each model, no singlerun (under a particular model) was noticeably differentwith regard to burn-in time, parameter estimate mean,or CI at stationarity.
Based on the post-burn-in plateau of chain likelihoodvalues observed in Figures 3 and 4, the GTR+I+G modelappears to out-perform models that partition among-siterate variation between either nuclear versus mitochon-drial genes (NM-SSG and NM-SAG) or between protein-coding versus ribosomal RNA genes (PR-SSG and PR-SAG). The GTR+AG model resulted in chain likelihoodscores that were markedly lower than those estimatedunder the GTR+I+G model. Two groups of models thatpartition among-site rate variation into either three orfour classes appeared to result in clear improvementsin the likelihood scores of stationary chains when com-pared to the GTR+I+G model: models that partitionedamong-site rate variation among c-mos (nuclear protein-coding) versus ND4 (mitochondrial protein-coding) ver-sus ribosomal RNA genes (CNR-SSG and CNR-SAG;three site partitions) and those that partitioned rate vari-ation among all individual genes (4gene-SSG and 4gene-SAG; four site partitions). Within this group of modelswith either three or four partitions of among-site ratevariation (with and without autocorrelated gamma), nosingle model clearly outperformed any other based onestimates of stationary chain likelihood scores (Fig. 3).From Figure 5 we observe that all models, includingthose with three or four partitions for among-site rate
variation, achieve stationarity rapidly by approximately30,000 generations (although we conservatively dis-carded trees prior to 400,000 generations as burn-in).
Consensus topologies estimated from post-burn-ingenerations were identical among multiple indepen-dent runs under a particular model (Fig. 6). We founda general correlation between topology and model fit(inferred based on relative values of stationary chainlikelihood scores), whereby the two models with thelowest range of ln likelihood scores (mean ln likeli-hood less than −30,550) for chains produced slightlydifferent topologies compared with all models result-ing in chains with higher ln likelihoods (mean lnlikelihood less than −30,550). Analyses of the com-bined data employing all models except NM-SSG andGTR+AG recovered the identical topology. The anal-yses under the NM-SSG and GTR+AG models recov-ered a topology identical to the others except for aswap in the relative branching order with respect totwo clades (Rhachisaurus + Gymnophthalminae and Ec-pleopini; neither rearrangement received high posteriorprobability support), in addition to a modification affect-ing the phylogenetic position of Proctoporus ventrimacu-latus + P . cf. ventrimaculatus.
Based on our a priori criteria for initial identificationof the preferred evolutionary model as that which con-tained the fewest number of parameters while demon-strating a clear optimization of overall chain likelihood,we chose the CNR-SSG model. To examine the effect of
458 SYSTEMATIC BIOLOGY VOL. 53
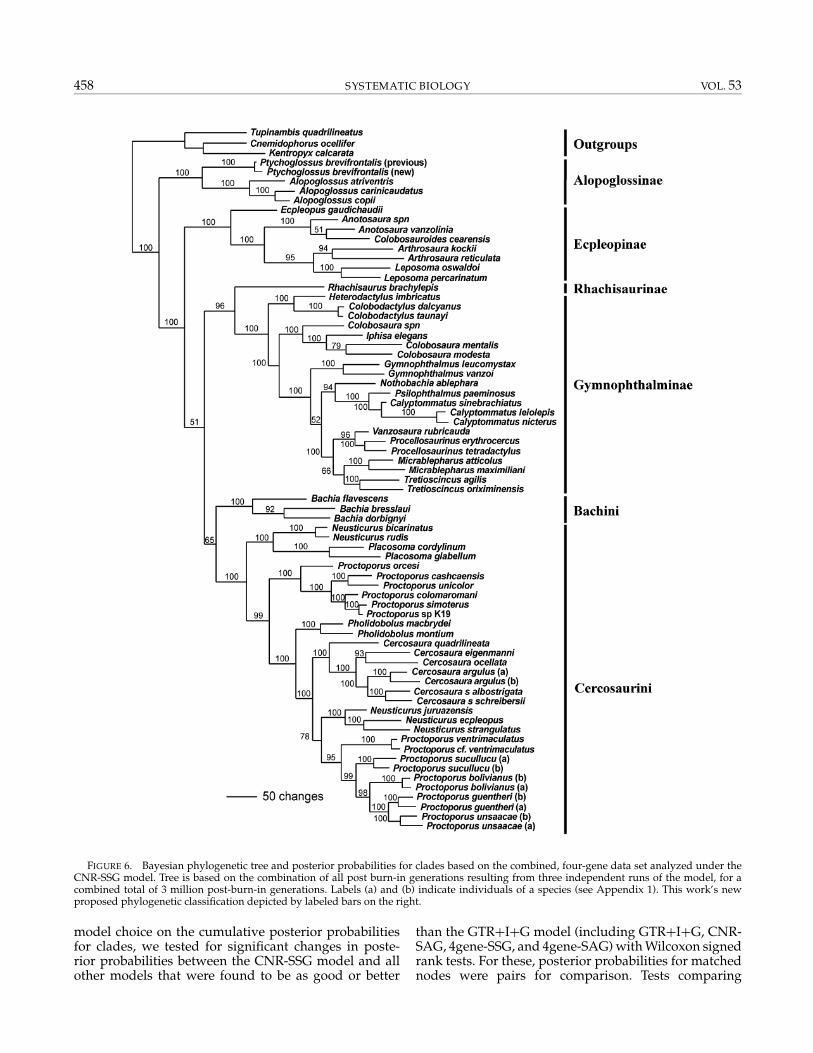
FIGURE 6. Bayesian phylogenetic tree and posterior probabilities for clades based on the combined, four-gene data set analyzed under theCNR-SSG model. Tree is based on the combination of all post burn-in generations resulting from three independent runs of the model, for acombined total of 3 million post-burn-in generations. Labels (a) and (b) indicate individuals of a species (see Appendix 1). This work’s newproposed phylogenetic classification depicted by labeled bars on the right.
model choice on the cumulative posterior probabilitiesfor clades, we tested for significant changes in poste-rior probabilities between the CNR-SSG model and allother models that were found to be as good or better
than the GTR+I+G model (including GTR+I+G, CNR-SAG, 4gene-SSG, and 4gene-SAG) with Wilcoxon signedrank tests. For these, posterior probabilities for matchednodes were pairs for comparison. Tests comparing

2004 CASTOE ET AL.—BAYESIAN ANALYSIS WITH PARTITIONS AND COMPLEX MODELS 459
30
40
50
60
70
80
90
100
30 40 50 60 70 80 90 100
GTR+I+G Posterior Probabilities
FIGURE 7. Plot of the posterior probabilities derived from the GTR+I+G MCMC analyses (all three runs combined) versus the posteriorprobabilities derived from the CNR-SSG model (all three runs combined). For comparison, a 1:1 line is plotted on the same axis.
the overall change in posterior probabilities betweenthe CNR-SSG model and other models with three orfour gamma partitions (with and without autocorrelatedgamma) were not significant. However, the GTR+I+Gmodel was found to produce, overall, significantly lowerestimates for posterior probabilities of clades than thepreferred model (CNR-SSG; z = 2.173, P = 0.029). Thistrend is demonstrated by the relationship between pos-terior probabilities from the GTR+I+G model and theCNR-SSG model, plotted against one another in Figure 7.Overall, a majority of nodes plotted in this figure fallabove the 1:1 line, indicating higher nodal support re-sulting from the CNR-SSG model. It is also important tonote, however, that several nodes did decrease in poste-rior probability support under the CNR-SSG model.
As described above, burn-in plots of ln likelihoodof MCMC chain scores from all independent MCMCruns under the CNR-SSG model are essentially iden-tical with a rapid and direct approach to a commonstationary plateau (not shown). To investigate burn-inand common estimates at stationarity for the parame-ters of the independent (1.4 million generation) CNR-SSG model runs, burn-in plots of the reversible rate ofA-G and A-T substitutions as well as the gamma pa-rameter and site-specific partition rate parameters areshown in Figure 8. Similar to burn-in plots of likelihoodtree scores (Fig. 5), all parameters appear to approachstationarity rapidly (in less than 50,000 generations) andoscillate around a common stationary value (across inde-pendent runs). Because all three (1.4 million generation)independent runs of our preferred model (CNR-SSG) ap-pear to reach common stationary estimates of param-eters, produce identical topologies, and nearly identi-cal posterior probability estimates, hereafter we reportonly results based on the combination of all 3 millionpost burn-in generations pooled from the three indepen-dent runs of MCMC analyses using the CNR-SSG model.
Parameter values, with 95% credibility intervals, result-ing from MCMC CNR-SSG model analyses are given inTable 4.
Posterior probability estimates derived from postburn-in generations from the single long MCMC run(33 million generations) of the GTR+I+G and CNR-SSGmodels were very similar to estimates based on the com-bination of the three shorter (1.4 million generation) runs.Considering only clades supported with less than 100%posterior probability support, the long MCMC run ofthe GTR+I+G model produced estimates that were, onaverage, 1.05% different from the short run estimates,compared with 0.40% for the CNR-SSG model. Given thealmost identical posterior probability estimates (within1%) derived from the single long MCMC run under theCNR-SSG model as compared with those previously es-timated from the combination of the three short MCMCruns of this model, we retain the use of posterior proba-bilities derived from the three short runs for further dis-cussions of the phylogeny. Estimates of model param-eters derived from this long CNR-SSG MCMC run aregiven in Table 4.
Relative to the overall estimates of posterior probabil-ities (all 33 million generations minus 1 million burn-in), the deviation of posterior probability estimates atintervals of generations showed greater variance forthe GTR+I+G model than did the CNR-SSG estimates(Fig. 9). The GTR+I+G model produced less precisepoint (intermediate interval) estimates than did theCNR-SSG model. In other words, as MCMC chains pro-gressed through generations, the posterior probabilityestimates tended to vary more for the GTR+I+G thanthe CNR-SSG model. Although the GTR+I+G modelincluded 20 nodes supported below 100%, whereas theCNR-SSG model included only 17, this bias was factoredout by reporting deviations per interval after dividingby the number of nodes considered. This average nodal

460 SYSTEMATIC BIOLOGY VOL. 53
FIGURE 8. Plots of selected parameters of the CNR-SSG model through generations. All three independent runs are plotted per graph toshow common burn-in rates and similar parameter estimates. (a) Plot of parametric estimates of r(A-G) from the GTR rate matrix. (b) Plot of theparametric estimates of r(A-T) from the GTR rate matrix. (c) Plot of the gamma parameter estimates. (d) Plot of the site-specific rate multiplierfor the ND4, rRNA (12S+16S), and c-mos site specific partitions of the gamma parameter.
support deviation (from overall long run estimates) cal-culated from intervals of generations for the GTR+I+Gmodel was more than twice that for the CNR-SSG model(Fig. 9). In comparisons of variance for nodes receiv-ing similar levels of support (e.g., around 80% poste-rior probability), greater degrees of variation were ev-ident in the GTR+I+G than the CNR-SSG model run(see Appendix 3 for detail, available at the Society ofSystematic Biologists website, http://systematicbiology.org), suggesting that elevated deviation observed inGTR+I+G estimates were not particularly biased byoverall higher posterior probability estimates from theCNR-SSG model. Despite variance in posterior proba-bility estimates for intervals of generations, however,no latent trends were observed in posterior proba-bilities that may indicate that new tree islands weresampled only late in runs (after many generations) orthat chains were not completely burned-in after the in-ferred burn-in period (based on likelihood plateau). In-stead, fluctuations in nodal support through generationsappear to represent oscillating patterns (see Appendix 3for detail).
We reexamine the effect of model choice on the cumu-lative posterior probabilities for clades based on these
two extended MCMC runs (for the GTR+I+G and CNR-SSG models). Results from a Wilcoxon signed rank testreturned very similar results as previous estimates basedon the three short MCMC runs, suggesting the GTR+I+Gmodel produced overall significantly lower estimates forposterior probabilities of clades than the preferred model(CNR-SSG; z = 2.334, P = 0.019).
The topology of the MCMC CNR-SSG tree (Fig. 6)has similarities with each of the other reconstructionsbut also differs from all aforementioned reconstructionsin several ways. As with all of our phylogenetic recon-structions, Alopoglossus and Ptychoglossus form a well-supported clade sister to the rest of the Gymnophthalmi-dae. The Cercosaurinae is polyphyletic. As in the c-mosreconstruction, the Heterodactylini is paraphyletic withrespect to the Gymnophthalmini. Although the place-ment of Rhachisaurus as the sister taxon to the Gymnoph-thalminae is unique among the parsimony and datapartitions (mitochondrial and nuclear) in this study, itis in the same position as that was recovered by Pel-legrino et al. (2001; their Fig. 4). Additionally, Bachiais recovered (with weak support) as the sister taxonto the Cercosaurini, as was found by Pellegrino et al.(2001).

TAB
LE
4.Pa
ram
eter
esti
mat
esfo
rC
NR
-SSG
mod
elM
CM
Cru
nssu
mm
ariz
edas
mea
nsw
ith
95%
cred
ibili
tyin
terv
alin
pare
nthe
ses.
CN
R-S
SGru
n1
CN
R-S
SGru
n2
CN
R-S
SGru
n3
CN
R-S
SGal
lsho
rtru
nsC
NR
-SSG
long
run
(1.4
mill
ion
gene
rati
ons)
(1.4
mill
ion
gene
rati
ons)
(1.4
mill
ion
gene
rati
ons)
(1.4
mill
ion
gene
rati
ons
×3)
(33
mill
ion
gene
rati
ons)
lnlik
elih
ood
−303
18.7
(−30
338
to−3
0300
.6)
−303
17.6
(−30
336.
3to
−303
02.2
)−3
0319
.7(−
3034
0.0
to−3
0301
.8)
−303
18.7
(−30
338.
2to
−303
01.5
)−3
0319
.5(−
3033
5.6
to−3
0283
.4)
pi(A
)0.
393
(0.3
77–0
.409
)0.
393
(0.3
78–0
.409
)0.
393
(0.3
79–0
.410
)0.
393
(0.3
78–0
.410
)0.
393
(0.3
62–0
.385
)pi
(C)
0.28
3(0
.270
–0.2
95)
0.28
3(0
.270
–0.2
95)
0.28
3(0
.271
–0.2
94)
0.28
3(0
.270
–0.2
95)
0.28
3(0
.257
–0.2
84)
pi(G
)0.
087
(0.0
81–0
.094
)0.
087
(0.0
81–0
.094
)0.
087
(0.0
81–0
.094
)0.
087
(0.0
81–0
.094
)0.
087
(0.0
75–0
.088
)pi
(T)
0.23
7(0
.227
–0.2
48)
0.23
7(0
.226
–0.2
48)
0.23
7(0
.225
–0.2
48)
0.23
7(0
.226
–0.2
48)
0.23
7(0
.214
–0.2
43)
r(A
-C)
0.40
9(0
.312
–0.4
91)
0.41
2(0
.339
–0.5
06)
0.41
2(0
.325
–0.5
09)
0.41
1(0
.324
–0.5
04)
0.41
1(0
.269
–0.4
00)
r(A
-G)
4.49
1(3
.843
–5.2
57)
4.48
3(3
.86–
5.20
3)4.
489
(3.7
44–5
.210
)4.
488
(3.8
1–5.
221)
4.50
2(3
.163
–4.3
24)
r(A
-T)
0.50
4(0
.403
–0.6
14)
0.50
8(0
.414
–0.6
30)
0.50
4(0
.391
–0.6
22)
0.50
6(0
.404
–0.6
24)
0.50
7(0
.333
–0.4
90)
r(C
-G)
0.36
4(0
.257
–0.4
74)
0.35
8(0
.259
–0.4
88)
0.35
7(0
.262
–0.4
83)
0.35
9(0
.259
–0.4
81)
0.36
0(0
.178
–0.3
40)
r(C
-T)
3.74
5(3
.139
–4.4
23)
3.77
1(3
.199
–4.4
69)
3.75
9(3
.120
–4.5
03)
3.75
8(3
.152
–4.4
66)
3.76
7(2
.651
–3.5
09)
r(G
-T)
11
11
1G
amm
apa
ram
eter
0.32
6(0
.308
–0.3
44)
0.32
54(0
.308
–0.3
43)
0.32
5(0
.308
–0.3
43)
0.32
5(0
.308
–0.3
43)
0.32
5(0
.291
–0.3
29)
SS1
(c-m
os)
0.13
4(0
.113
–0.1
62)
0.13
4(0
.114
–0.1
58)
0.13
3(0
.112
–0.1
57)
0.13
4(0
.113
–0.1
58)
0.13
3(0
.095
–0.1
33)
SS2
(ND
4)2.
409
(2.3
59–2
.454
)2.
414
(2.3
65–2
.456
)2.
415
(2.3
70–2
.459
)2.
412
(2.3
64–2
.457
)2.
412
(2.3
12–2
.407
)SS
3(r
RN
Age
nes)
0.32
6(0
.295
–0.3
62)
0.32
3(0
.293
–0.3
56)
0.32
3(0
.290
–0.3
54)
0.32
4(0
.292
–0.3
58)
0.32
4(0
.262
–0.3
29)
461

462 SYSTEMATIC BIOLOGY VOL. 53
0
0.1
0.2
0.3
0.4
0.5
0.6
0.7
0.8
0.9
1.0
Generations
GTR+I+G
CNR-SSG
FIGURE 9. Comparison of deviation of posterior probability estimates at intervals of generations compared to overall means from longMCMC runs (33 million generations) for the GTR+I+G and CNR-SSG models. Values represent the absolute deviation of posterior probabilityestimates (relative to overall mean for long MCMC run) averaged across all nodes receiving less than 100% posterior probability.
Comparison Among Phylogenetic Reconstructions
Not all individual gene data sets (Fig. 2, and notshown) were in agreement with the combined tree(Fig. 6). The c-mos data partition agreed with the com-bined tree on higher-level relationships except for theplacement of Rhachisaurus and Bachia. Similar to theparsimony reconstruction (Fig. 1), Rhachisaurus andBachia formed a clade instead of Rhachisaurus being re-lated to the Gymnophthalminae and Bachia to the Cer-cosaurini. The ND4 data partition supported a mono-phyletic Heterodactylini. The 16S data partition resolvedthe same general relationship as the combined data CNR-SSG tree except that one of the outgroups, Tupinambisquadrilineatus, was nested within the ingroup. The 12Sdata partition produced topologies most divergent fromother genes, but nearly all of those relationships receivedpoor posterior probability support.
DISCUSSION
Model Selection and Evaluation
Bayesian methods have greatly improved our abil-ity to estimate phylogenies using larger datasets andcomplex models of evolution. However, this creates aseemingly paradoxical dilemma with regard to modelcomplexity and overparameterization. In general, it is as-sumed that more realistic models of evolution will yieldmore accurate trees and clade credibility (posterior prob-ability) values, thus perhaps favoring parameter-richmodels, because interpretations of posterior probabili-ties are contingent on model specifications (Huelsenbecket al., 2002). However, a key assumption of Wald’s(1949) proof of the consistency of maximum likelihood
estimates is that all of the parameters of the likelihoodfunction are identifiable from the true probability dis-tribution of the data (Rogers, 2001). Even if a particularparameter may be intrinsic in the evolution of DNA se-quences, we need to consider whether this parameter canbe accurately estimated based on the data. This dilemmais manifested when attempting to construct and imple-ment models that realistically describe DNA evolution,while avoiding overparameterization, or using more pa-rameters than can be meaningfully estimated from thedata.
In a Bayesian analysis, the problem of identifying thebest model may be condensed to two intertwined is-sues: evaluating model performance and fit and examin-ing the sensitivity of posterior probability distributionsto model specifications (Gelman et al., 1995; Huelsen-beck et al., 2002). Detecting overparameterized models,however, is not readily accomplished, especially in aBayesian phylogenetic framework (Huelsenbeck et al.,2002; Rannala, 2002). Several authors have suggested fea-tures of MCMC analyses that may be monitored to iden-tify overparameterization, including poor convergenceof MCMC chains (Carlin and Louis, 1996), a strong cor-relation among parameters in the posterior density de-spite independence under the prior density (Rannala,2002), delayed convergence of a MCMC chain to a sta-tionary plateau relative to less parameterized models(Rannala, 2002), and failure of multiple independentruns (chains) of the same model to converge on sim-ilar estimates of parameters and posterior probabili-ties (Huelsenbeck et al., 2002). We used these criteria,with the exception of testing among-parameter corre-lation, to guide the evaluation of what we tentatively

2004 CASTOE ET AL.—BAYESIAN ANALYSIS WITH PARTITIONS AND COMPLEX MODELS 463
identified as the best-fit model (CNR-SSG). Testingfor among-parameter correlation, in our case, was notpossible because the nature of the model causes in-herent correlation of the parameters of interest (thosewhich partition the among-site rate variation acrosspartitions).
Different evolutionary rates and among-site rate pat-terns may be intrinsic evolutionary characteristics of dif-ferent genes owing to their genomic origin (organellarversus nuclear) or function (e.g., protein-coding versusnon-protein-coding). Sufficient evidence exists to sug-gest that drastically different evolutionary rates and dis-tinct, gene-specific among-site rates can be observedamong different genes categorized within a particularclass (e.g., among protein-coding mitochondrial genes;Miyata, 1982; Kelly and Rice, 1996). We used these obser-vations to identify plausible alternative partitions acrosswhich to estimate specific rates of among-site rate vari-ation. Comparison of post burn-in MCMC chain like-lihood scores across alternative models for among-siterate variation showed that only the three partition (CNR-SSG and CNR-SAG) and four partition (4gene-SSG and4gene-SAG) models fit the data better than the GTR+I+Gmodel chosen by ModelTest. We found no evidence forsubstantial differences in burn-in time, chain likelihoodscore at stationarity, or overall clade posterior probabilityestimates across these models, yet we did detect a signif-icant overall improvement in clade posterior probabilityestimates between one of these four models (CNR-SSG)and the GTR+I+G model. We found no evidence that thisbest-fit model (CNR-SSG) was parametrically over-fitted(excessively parameter rich). In fact, based on the analy-sis of the extended MCMC runs, we found this model toproduce significantly more consistent posterior probabil-ities through generations than did the GTR+I+G model.Given available evidence, we concluded that the best-fitmodel of evolution, in keeping with our goal of practicalimprovement for the sake of phylogenetic inference, wasthe CNR-SSG model, upon which we base our preferredhypothesis for the phylogeny of Gymnophthalmidae.
Here, we summarize our approach to model con-struction and evaluation as an explicit hierarchicalprocess:
1. Use hLRTs (e.g., ModelTest) to first identify best-fit conventional parameters (although other modelchoice criteria such as AIC [Akaike, 1974; also avail-able in ModelTest], BIC [Schwarz, 1974], or DT [Mininet al., 2003] may be substituted)
2. Construct alternative models with data set partitionsdefined based on a priori expectations of potentiallybiologically relevant subsets of the data (e.g., protein-coding versus non-protein-coding genes or mitochon-drial versus nuclear genes)
3. Examine model fit based on 95% CI of post burn-inMCMC chain likelihood values
4. Tentatively choose best-fit model5. Examine this model for evidence of parameter identi-
fiability or over-fitting
i. Compare relative burn-in period across alternativemodels
ii. Check for topological consistency across multipleruns of tentative model
iii. Examine consistency of parameter estimatesacross multiple independent runs of the tentativelyoptimal model
iv. Check for consistency of clade posterior probabil-ities across independent runs
v. Check for consistency of posterior probability es-timates across generations for extended MCMCruns (with large number of generations)
6. Test for significant differences in posterior probabili-ties between tentative model and those models of sim-ilar fit to the data
7. Given evidence for parameter identifiability and sig-nificant changes to posterior probabilities, acceptmodel. If identifiability is questionable or no signif-icant changes to posterior probability are observed,reduce model parameterization and repeat modelevaluation.
Effects of Partitioning Gamma and UsingAutocorrelated Rate Variation
Several studies based on simulated data have stronglysupported the view that maximum likelihood estimatesof phylogeny remain accurate and robust even whenthe model used to estimate phylogeny differs markedlyfrom that used to generate simulated data (Fukami-Kobayashi and Tateno, 1991; Yang et al., 1994; Sullivanand Swofford, 2001). Our results support this conclu-sion using empirical data, in that several different mod-els for among-site rate variation support the same orvery similar topologies. Many authors have underscoredthe importance of including estimates of among-site ratevariation (e.g., Yang, 1993; Sullivan and Swofford, 2001;Buckley and Cunningham, 2002; Nylander et al., 2004;see review in Yang, 1996b) in models of sequence evo-lution for increasing the consistency and accuracy ofphylogenetic inference. Our results demonstrate that ap-parent inappropriate partitioning of gamma among loci(e.g., NM-SAG model) may lead to inconsistent and pre-sumably inaccurate phylogenetic inferences. The factthat our preferred model (CNR-SSG) provided a sig-nificant increase in overall posterior probability esti-mates for clades over the GTR+I+G model suggeststhat well fitted partitioning of among-site rate variationappears to significantly affect the posterior probabilitydistributions of MCMC analyses. These results paral-lel previous studies that have demonstrated the signif-icant effects of substitution model on maximum likeli-hood bootstrap support (Yang et al., 1995; Sullivan et al.,1997; Buckley et al, 2001; Buckley and Cunningham,2002).
An interesting, yet difficult to interpret, result wasobserved in comparisons of posterior probability mon-itored through intervals during extended MCMC runs.We found the CNR-SSG model to produce more consis-tent posterior probabilities through generations than did

464 SYSTEMATIC BIOLOGY VOL. 53
the GTR+I+G model. If we assume that the complexityof tree space remained relatively constant under the twomodels, this may suggest that the MCMC chains of theCNR-SSG model were more consistent over intervals ofgenerations with respect to the regular visitation of treeislands. Alternatively, it seems possible that implement-ing the partitioned gamma model (CNR-SSG) may havereduced the complexity of tree space by decreasing thenumber of optimal or near optimal peaks (reducing thenumber of major islands visited by MCMC chains overtime), thereby reducing the variance through generationsin trees sampled in the posterior distribution. This mayhave been accomplished by reducing the likelihood ofcertain peaks within tree space due to the different pa-rameterization of among-site rates, thereby decreasingthe number of near optimal tree islands. In general, theproperties associated with the behavior of MCMC chainsin tree space through generations has been essentiallyuntouched in the literature, yet represents a significantgap in our understanding of Bayesian MCMC analyses.Future research is clearly necessary to answer questionsabout the number of generations and independent runsrequired for robust conclusions from MCMC and alsohow this may relate to model complexity and changes tothe general topology of tree space.
Although the results of this study favor use of modelsthat partition among-site rate variation, they also high-light a potential pitfall of such parameter-rich models.Not all alternative models improved model fit relative toGTR+I+G. The GTR+AG, PR-SSG, PR-SAG, NM-SSG,and NM-SAG models all decreased the fit of the modelto the data, relative to the GTR+I+G model (chosen ini-tially by hLRT criteria). These results re-emphasize theneed to test the fit of alternative models instead of choos-ing a particular model a priori (e.g., Huelsenbeck andCrandall, 1997; Posada and Crandall, 2001; Minin et al.,2003). The GTR+I+G model not only fit the data betterthan some partitioned models (e.g., NM-SSG, PR-SAG;Fig. 4), but also recovered the identical topology while(on average) underestimating posterior probability sup-port for clades (Fig. 7). These findings support the utilityof this conventionally employed model and suggest thatprevious analyses using this model are likely to be asrobust (with regard to topology) as more complex mod-els, but provide more conservative estimates of posteriorprobability support for clades. However, our analysis ofextended MCMC runs suggests that, for a reason that isnot immediately clear, the GTR+I+G model appearedto take a large number of generations to undergo oscilla-tion cycles with respect to estimates of posterior proba-bilities. This suggests that, for some models, at least oneextended MCMC run (with a large number of genera-tions) is desirable to precisely and accurately estimateposterior probabilities so that trees are sampled in theposterior distribution according to their posterior proba-bility (Swofford, Warren, and Wilgenbusch, unpublisheddata). It is encouraging, from the standpoint of compu-tational feasibility, that the estimates of model parame-ters, chain likelihood scores, and, particularly, posteriorprobabilities derived from the combination of three short
(1.4 million generation) independent MCMC runs pro-vided what appears to be, at least, a sufficient approxima-tion of posterior probabilities derived from much longerMCMC runs.
Several authors have demonstrated the utility ofemploying a parameter to account for autocorrelatedamong-site rate variation in phylogenetic analyses (e.g.,Yang, 1995; Penny et al., 2001; Huelsenbeck, 2002). Al-though evidence for the occurrence of autocorrelatedrates has been well documented (Yang, 1995; Nielsen,1997; Penny et al., 2001), we found the addition of thisparameter to alternative models to be of limited valuefor improving the fit of models to our data. As can beseen in Figure 4, models which fit the data poorly (PR-SSG and NM-SSG) did appear to be notably improvedwith the addition of a parameter for autocorrelation ofamong-site rates, although this increase in fit did not ex-ceed that of the GTR+I+G model (or the CNR or 4genemodels). Among models which showed the best-fit to thedata (CNR and 4gene), the addition of a parameter to ac-count for among-site rate autocorrelation only slightlyincreased the likelihood scores for MCMC chains suchthat there was still broad overlap in the 95% CI of like-lihood scores (Fig. 4). Similarly, Wilcoxon signed ranktests comparing overall posterior probabilities for cladesbetween SSG and SAG variants of the CNR and 4genemodels found no significant differences attributable tothe addition of the auto-correlation parameter.
In this study we have concentrated on accounting forone particular type of heterogeneity in among-site ratepatterns in combined DNA sequence analysis, that whichexists at or above the level of a gene or locus, ignor-ing potential partitions that may be prescribed withingenes. Models that do examine and attempt to accountfor within gene heterogeneity by constructing partitionsbased on codon position (e.g., Yang, 1996a; Krajewskiet al., 1999; Buckley et al., 2001), protein domain (Herronet al., in press), or secondary structure for rRNA or tRNAgenes (e.g., Schoniger and von Haeseler, 1994; Savill et al.,2001) have also been implemented. These intralocus par-titions have yet to be thoroughly evaluated in a Bayesianframework and may potentially add additional realisticparameters to models of sequence evolution, especiallyin cases where very distant relationships are inferred(Penny et al., 2001) or where extreme accuracy of branchlength estimates or model parameters are particularlycritical to conclusions (Yang et al., 1994). Understand-ing and testing of parametric identifiability in complexmodels have been poorly studied and clearly requiresadditional attention. This issue, in addition to topologyand posterior probability sensitivity to model choice,would benefit from future investigations using both sim-ulated data and known phylogenies where more defini-tive conclusions about the effects of model choice may bedrawn.
Taxonomic Considerations and Alterations
Much of our phylogeny reconstruction is consistentwith that recovered by Pellegrino et al. (2001). However,

2004 CASTOE ET AL.—BAYESIAN ANALYSIS WITH PARTITIONS AND COMPLEX MODELS 465
our preferred phylogenetic hypothesis (combined dataMCMC CNR-SSG reconstruction; Fig. 6) suggests fourhigher level taxonomic changes to the current classifi-cation (Pellegrino et al., 2001). The first change is thatPtychoglossus appears to be most closely related to Alo-poglossus and not to the Cercosaurini. The placementof Ptychoglossus in the Cercosaurini by Pellegrino et al.(2001) was presumably the result of the swapping oftaxon names between Ptychoglossus and Neusticurus juru-azensis, as discussed in Appendix 2.This relationship wasalso inferred from the nuclear partition trees of Pellegrinoet al. (2001) (and the c-mos reconstruction of Harris, 2003)in which Ptychoglossus was sister to the three Alopoglos-sus species. After making the correction to the Pellegrinoet al. (2001) data set, and adding our own sequences forthis taxon, it seems clear that Ptychoglossus brevifrontalis issister to Alopoglossus; therefore, we remove Ptychoglossusfrom the Cercosaurinae and place it in the Alopoglossi-nae. This relationship is also supported by the morpho-logical synapomorphy (present in both Ptychoglossus andAlopoglossus) of infralingual plicae, unique in the familyGymnophthalmidae.
The second taxonomic alteration involves the tribeHeterodactylini. This tribe is paraphyletic with respectto the Gymnophthalmini in our combined tree (Fig. 6)and in the c-mos (Fig. 2) and 16S (not shown) reconstruc-tions. The paraphyly of the tribe was also apparent inPellegrino et al.’s (2001) maximum likelihood tree. Be-cause there does not appear to be sufficient support forrecognizing a separate tribe Heterodactylini, we removeboth of the Gymnophthalmini and Heterodactylini tribalnames and refer all of the pertaining genera to subfamilyGymnophthalminae with no tribes.
The third taxonomic alteration involves species be-longing to the cercosaurine tribe Ecpleopini. The CNR-SSG tree (Fig. 6) suggests that the ecpleopiines and thecercosauriines do not comprise a monophyletic Cer-cosaurinae. Although posterior probability support forintervening clades is low, monophyly of both groups iswell supported. The Ecpleopini appears to be distantlyrelated to the Cercosaurini and we hereby raise the statusof the former members of tribe Ecpleopini (Amapasaurus,Anotosaura, Arthrosaura, Colobosauroides, Ecpleopus, andLeposoma; Pellegrino et al., 2001) to subfamily status, theEcpleopinae Fitzinger.
The fourth taxonomic alteration involves the place-ment of Bachia. Pellegrino et al. (2001) recovered its place-ment as basal within the Cercosaurini. The node join-ing Bachia to the rest of the Cercosaurini was supportedby bootstrap values less than 50% on their parsimonytree and by 81% on their maximum likelihood tree. Wefound conflict between our parsimony reconstructionsand Bayesian reconstructions. In the parsimony trees(and 16S and c-mos individual Bayesian gene trees; 16Snot shown) we found Bachia to be closely related toRhachisaurus brachylepis, either joined with the Ecpleopinior distantly related to the Cercosaurinae. In our CNR-SSG reconstruction Bachia appears to be the sister lin-eage to the rest of the Cercosaurini with low posteriorprobabilities supporting Bachia in that position. In addi-
tion, a large genetic distance separated Bachia from theother cercosauriines. Based on these data we are still un-sure of the phylogenetic placement of Bachia within thefamily. However, we are confident that Bachia appearsto be distantly related to all other sampled taxa. We be-lieve the best course of action at the present time is toleave Bachia in the Cercosaurinae but elevate the genusto tribe status, the Bachini. In this way the relationships ofthis genus with other genera of the Cercosaurinae are notconfused.
A new phylogenetic classification for the family is pre-sented in Table 5. Based on the additions we made to thePellegrino et al. (2001) data set, several other taxonomicissues warrant mention. The addition of Pholidobolus
TABLE 5. Current phylogenetic classification of family Gymno-phthalmidae.
Taxon
Gymnophthalmidae Merrem, 1820Alopoglossinae Pellegrino, Rodrigues, Yonenaga-Yassuda,
and Sites, 2001Alopoglossus Boulenger, 1885Ptychoglossus Boulenger, 1890
Cercosaurinae Gray, 1838Tribe Bachini New Tribe
Bachia Gray, 1845Tribe Cercosaurini Gray, 1838
Anadia Gray, 1845Cercosaura Wagler, 1830Echinosaura Boulenger, 1890Euspondylus Tschudi, 1845Macropholidus Noble, 1921Neusticurus Dumeril and Bibron, 1839Opipeuter Uzzell, 1969Pholidobolus Peters, 1862Placosoma Tschudi, 1847Proctoporus Tschudi, 1845Riolama Uzzell, 1973Teuchocercus Fritts and Smith, 1969
Ecpleopinae Fitzinger, 1843Amapasaurus Cunha, 1970Anotosaura Amaral, 1933Arthrosaura Boulenger, 1885Colobosauroides Cunha and Lima Verde, 1991Ecpleopus Dumeril and Bibron, 1839Leposoma Spix, 1825
Gymnophthalminae Merrem, 1820Calyptommatus Rodrigues, 1991Colobodactylus Amaral, 1933Colobosaura Boulenger, 1887Heterodactylus Spix, 1825Iphisa Gray, 1851Gymnophthalmus Merrem, 1820Micrablepharus Dunn, 1932Nothobachia Rodrigues, 1984Procellosaurinus Rodrigues, 1991Psilophthalmus Rodrigues, 1991Stenolepis Boulenger, 1888Tretioscincus Cope, 1862Vanzosaura Rodrigues, 1991
Rhachisaurinae Pellegrino, Rodrigues, Yonenaga-Yassuda,and Sites, 2001
Rhachisaurus Pellegrino, Rodrigues, Yonenaga-Yassuda,and Sites, 2001
Note. We are unable to place Adercosaurus Myers and Donnelly, 2001, defini-tively in a subfamily because we were unable to examine specimens of that genus.Based on the information provided by Myers and Donnelly (2001), this genus maybelong in the Alopoglossinae, the Ecpleopinae, or the Cercosaurini.

466 SYSTEMATIC BIOLOGY VOL. 53
macbrydei provides preliminary support for a mono-phyletic Pholidobolus. The newly redesignated genusCercosaura, which now includes all taxa formerly placedin Pantodactylus and Prionodactylus (Doan, 2003a), is sup-ported in this study. The addition of Neusticurus stran-gulatus shows that this species forms a clade with twoother members of its genus, N. ecpleopus and N. juruazen-sis, but overall the genus is polyphyletic. Additionally,Anotosaura is paraphyletic with respect to Colobosa-uroides and Colobosaura is paraphyletic with respect toIphisa.
Proctoporus is the genus that was not included byPellegrino et al. (2001). Contrary to the conclusions madeby Doan (2003b) using morphological data, Proctoporusappears to be a polyphyletic member of the Cercosaurini.In the CNR-SSG reconstruction two separate Proctoporusclades are apparent, separated from each other by Pholi-dobolus, Cercosaura, and one clade of Neusticurus. OneProctoporus clade is composed of members from Ecuador,whereas the other includes members from Peru and Bo-livia. In the parsimony reconstruction Proctoporus ventri-maculatus additionally forms a third lineage that appearsto be most closely related to Cercosaura. This species (in-cluding an unidentified specimen designated as P.cf.ventrimaculatus) is the sole species from northern Peru,separated by a vast distance from the Ecuadorian clade toits north and the southern Peruvian and Bolivian clade toits south. It is clear that taxonomic rearrangement is nec-essary to rectify the taxonomy of this genus. This workis underway by Doan and Castoe (in preparation).
ACKNOWLEDGMENTS
We would like to thank L. Ford and C. Raxworthy of AMNH andL. Trueb of KU for the donation of tissues. We thank D. Calloway,P. Chippindale, M. Herron, B. Noonan, C. O’Reilly, A. Rambout, R.Ruggierio, C. Simon, J. Sites, E. Smith, J. Sullivan and two anonymousreviewers for helpful methodological suggestions and comments onthe manuscript. We thank the Biology Department at the University ofCentral Florida, J. Fauth, and J. Weishample for providing computeraccess.
REFERENCES
Akaike, H. 1974. A new look at statistical model identification. IEETrans. Autom. Contr. 19:716–723.
Alfaro, M. E., S. Zoller, and F. Lutzoni. 2003. Bayes or bootstrap? A sim-ulation study comparing the performance of Bayesian Markov chainMonte Carlo sampling and Bootstrapping in assessing phylogeneticconfidence. Mol. Biol. Evol. 20:255–266.
Arevalo, E. S., S. K. Davis, and J. W. Sites Jr. 1994. Mitochondrial DNAsequence divergence and phylogenetic relationships among eightchromosome races of the Sceloporus grammicus complex (Phrynoso-matidae) in central Mexico. Syst. Biol. 43:387–418.
Buckley, T. R. 2002. Model misspecification and probabilistic tests oftopology: Evidence from empirical data sets. Syst. Biol. 51:509–523.
Buckley, T. R., and C. W. Cunningham. 2002. The effects of nucleotidesubstitution model assumptions on estimates of nonparametric boot-strap support. Mol. Biol. Evol. 19:394–405.
Buckley, T. R., C. Simon, and G. K. Chambers. 2001. Exploring among-site rate variation models in a maximum likelihood framework us-ing empirical data: Effects of model assumptions on estimates oftopology, branch lengths, and bootstrap support. Syst. Biol. 50:67–86.
Carlin, B. P., and T. A. Louis. 1996. Bayes and empirical Bayes methodsfor data analysis. Chapman and Hall, New York.
Caterino, M. S., R. D. Reed, M. M. Kuo, and F. A. H. Sperling. 2001.A partitioned likelihood analysis of swallowtail butterfly phylogeny(Lepidoptera: Papilionidae). Syst. Biol. 50:106–127.
Cummings, M. P., S. A. Handley, D. S. Meyers, D. L. Reed, A. Rokas,and K. Winka. 2003. Comparing bootstrap and posterior probabilityvalues in the four-taxon case. Syst. Biol. 52:477–487.
Dixon, M. T., and D. M. Hillis. 1993. Ribosomal RNA secondary struc-ture: Compensatory mutations and implications for phylogeneticanalysis. Mol. Biol. Evol. 10:256–267.
Doan, T. M. 2003a. A new phylogenetic classification for the gymnoph-thalmid genera Cercosaura, Pantodactylus, and Prionodactylus (Rep-tilia: Squamata). Zool. J. Linn. Soc. 137:101–115.
Doan, T. M. 2003b. A south-to-north biogeographic hypothesis forAndean speciation: Evidence from the lizard genus Proctoporus(Reptilia, Gymnophthalmidae). J. Biogeography 30:361–374.
Doan, T. M., and T. A. Castoe. 2003. Using morphological and molecu-lar evidence to infer species boundaries within Proctoporus bolivianusWerner (Squamata: Gymnophthalmidae). Herpetologica 59:433–450.
Douady, C. J., F. Delsuc, Y. Boucher, W. F. Doolittle, and E. J. P. Douzery.2003. Comparison of Bayesian and maximum likelihood bootstrapmeasures of phylogenetic reliability. Mol. Biol. Evol. 20:248–254.
Erixon, S. P., B. Britton, and B. Oxelman. 2003. Reliability of Bayesianposterior probabilities and bootstrap frequencies in phylogenetics.Syst. Biol. 52:665–673.
Felsenstein, J. 1968. Statistical inference and the estimation of phyloge-nies. University of Chicago, Chicago.
Felsenstein, J. 1985. Confidence limits on phylogenies: An approachusing the bootstrap. Evolution 39:783–791.
Fukami-Kobayashi, K., and Y. Tateno. 1991. Robustness of maximumlikelihood tree estimation against different patterns of base substitu-tions. J. Mol. Evol. 32:79–91.
Gasser, R. B., X. Zhu, N. B. Chilton, L. A. Newton, T. Nedergaard,and P. Guldberg. 1998. Analysis of sequence homogenization inrDNA arrays of Haemonchus contortus by denaturing gradient gelelectrophoresis. Electrophoresis 19:2391–2395.
Gene Codes Corp. 1996. Sequencher, version 3.1. Gene Codes, AnnArbor.
Gonzales, I. L., and J. E. Sylvester. 2001. Human rRNA: Evolution-ary patterns within genes and tandem arrays derived from multiplechromosomes. Genomics 73:255–263.
Gutell, R. R. 1994. Collection of small subunit (16S and 16S-like) ribo-somal RNA structures. Nucleic Acid Res. 22:3502–3507.
Gutell, R. R., N. Larsen, and C. R. Woese. 1994. Lessons from an evolvingrRNA: 16S and 23S rRNA structures from a comparative perspective.Microbiol. Rev. 58:10–26.
Harris, D. J. 2003. Codon bias variation in C-mos between squamatefamilies might distort phylogenetic inferences. Mol. Phylogenet.Evol. 27:540–544.
Herron, M. D., T. A. Castoe, and C. L. Parkinson. in press. Sciuridphylogeny and the paraphyly of Holarctic ground squirrels (Sper-mophilus). Mol. Phylogenet. Evol.
Hickson, R., C. Simon, A. Cooper, G. Spicer, J. Sullivan, and D. Penny.1996. Conserved sequence motifs, alignment, and secondary struc-ture for the third domain of animal 12s rRNA. Mol. Biol. Evol. 13:150–169.
Hillis, D. M. 1998. Taxonomic sampling, phylogenetic accuracy, andinvestigator bias. Syst. Biol. 47:3–8.
Hillis, D. M., and J. J. Bull. 1993. An empirical test of bootstrapping as amethod for assessing confidence in phylogenetic analysis. Syst. Biol.42:182–192.
Huelsenbeck, J. P. 1995. Performance of phylogenetic methods in sim-ulation. Syst. Biol. 44:17–48.
Huelsenbeck, J. P. 1997. Is the Felsenstein zone a fly trap? Syst. Biol.46:69–74.
Huelsenbeck, J. P. 2002. Testing a covariotide model of DNA substitu-tion. Mol. Biol. Evol. 19:698–707.
Huelsenbeck, J. P., and K. A. Crandall. 1997. Phylogeny estimation andhypothesis testing using maximum likelihood. Ann. Rev. Ecol. Syst.28:437–466.
Huelsenbeck, J. P., B. Larget, R. Miller, and F. Ronquist. 2002. Potentialapplications and pitfalls of bayesian inference of phylogeny. Syst.Biol. 51:673–688.
2004 CASTOE ET AL.—BAYESIAN ANALYSIS WITH PARTITIONS AND COMPLEX MODELS 467
Huelsenbeck, J. P., and F. Ronquist. 2001. MrBayes: Bayesian inferenceof phylogeny. Bioinformatics 17:754–755.
Huelsenbeck, J. P., R. Ronquist, R. Nielsen, and J. Bollback. 2001.Bayesian inference of phylogeny and its impacts on evolutionarybiology. Science 294:2310–2314.
International Human Genome Sequencing Consortium. 2001. Initialsequencing and analysis of the human genome. Nature 409:860–921.
Kelly, C., and J. Rice. 1996. Modeling nucleotide evolution: A hetero-geneous rate analysis. Math. Biosci. 133:85–109.
Kimura, M. 1986. The role of compensatory neutral mutations in molec-ular evolution. J. Genetics 64:7–19
Krajewski, C., M. G. Fain, L. Buckley, and D. G. King. 1999. Dynamicallyheterogeneous partitions and phylogenetic inference: An evaluationof analytical strategies with cytochrome b and ND6 gene sequencesin cranes. Mol. Phylogenet. Evol. 13:302–313.
Leache, A. D., and T. W. Reeder. 2002. Molecular systematics of the east-ern fence lizard (Sceloporus undulatus): A comparison of parsimony,likelihood, and Bayesian approaches. Syst. Biol. 51:44–68.
Long, E. O., and I. B. Dawid. 1980. Repeated genes in eukaryotes. Ann.Rev. Biochem. 49:727–764.
Minin, V., Z. Abdo, P. Joyce, and J. Sullivan. 2003. Performance-basedselection of likelihood models for phylogeny estimation. Syst. Biol.52:674–683.
Miyata, T. 1982. Evolutionary changes and functional constraints inDNA sequences. Pages 233–266 in Molecular evolution, protein poly-morphism and the neutral allele theory (M. Kimura, ed.). Japan Sci-entific Press, Tokyo.
Moncalvo, J. M., D. Drehmel, and R. Vilgalys. 2000. Variation in modesand rates of evolution in nuclear and mitochondrial ribosomal DNAin the mushroom genus Aminita (Agaricales, Basidiomycota): Phy-logenetic implications. Mol. Phylogenet. Evol. 16:48–63.
Muse, S. V. 1995. Evolutionary analyses when nucleotides do not evolveindependently. Pages 115–124 in Current topics on molecular evolu-tion (M. Nei and N. Takahata, eds.). Institute on Molecular Evolutionand Genetics, University Park, PA.
Myers, C. W., and M. A. Donnelly. 2001. Herpetofauna of the Yutaje-Corocoro Massif, Venezuela: Second report from the Robert G. GoeletAmerican Museum-Terramar expedition to the northwestern tepuis.Bull. Am. Mus. Nat. Hist. 261:1–85.
Nielsen, R. 1997. Site-by-site estimation of the rate of substitution andthe correlation of rates in mitochondrial DNA. Syst. Biol. 46:346–353.
Nicholas, K. B., and H. B. Nicholas, Jr. 1997. GeneDoc: A tool for editingand annotating multiple sequence alignments. Distributed by theauthor at: www.cris.com/∼Ketchup/genedoc.shtml.
Nylander, J. A. A., F. Ronquist, J. P. Huelsenbeck, and J. L. Nieves-Aldrey. 2004. Bayesian phylogenetic analysis of combined data. Syst.Biol. 53:47–67.
Pamilo, P., and M. Nei. 1988. Relationships between gene trees andspecies trees. Mol. Biol. Evol. 5:568–583.
Pardue, M. L. 1974. Localization of repeated DNA sequences in Xeno-pus chromosomes. Cold Spring Harbor Symp. Quant. Biol. 38:475–482.
Parkinson, C. L. 1999. Molecular systematics and biogeographical his-tory of pitvipers as determined by mitochondrial ribosomal DNAsequences. Copeia 1999:576–586.
Parkinson, C. L., S. M. Moody, and J. E. Alquist. 1997. Phylogenetic re-lationships of the ‘Agkistrodon Complex’ based on mitochondrialDNA sequence data. Pages 63–78 in Venomous snakes: Ecology,evolution, and snakebite (R. S. Thorpe, W. Wuster, and A. Malho-tra, eds.). Symposia of the Zoological Society of London. ClarendonPress, Oxford.
Pellegrino, K. C. M., M. T. Rodrigues, Y. Yonenaga-Yassuda, and J. W.Sites Jr. 2001. A molecular perspective on the evolution of microteiidlizards (Squamata: Gymnophthalmidae), and a new classification forthe family. Biol. J. Linnean Soc. 74:315–338.
Penny, D., B. J. McComish, M. A. Carleston, and M. D. Hendy.2001. Mathematical elegance with biochemical realism: The covar-ion model of molecular evolution. J. Mol. Evol. 53:711–723.
Posada, D., and K. A. Crandall. 1998. Model-Test: Testing the model ofDNA substitution. Bioinformatics 14:817–818.
Posada, D., and K. A. Crandall. 2001. Selecting the best-fit model ofnucleotide substitution. Syst. Biol. 50:580–601.
Pupko, T., D. Huchon, Y. Cao, N. Okada, and M. Hasegawa. 2002.Combining multiple data sets in a likelihood analysis: Which modelsare the best? Mol. Biol. Evol. 19:2294–2307.
Rannala, B. 2002. Identifiability of parameters in MCMC Bayesian in-ference of phylogeny. Syst. Biol. 51:754–760.
Rogers, J. S. 2001. Maximum likelihood estimation of phylogenetic treesin consistent when substitution rates vary according to the invariablesites plus gamma distribution. Syst. Biol. 50:713–722.
Saint K. M., C. C. Austin, S. C. Donnellan, and M. N. Hutchinson. 1998.C-mos, a nuclear marker useful for squamate phylogenetic analysis.Mol. Phylogenet. Evol. 10:259–263.
Savill, N. J., D. C. Hoyle, and P. G. Higgs. 2001. RNA sequence evolutionwith secondary structure constraints: Comparison of substitutionrate models using maximum-likelihood methods. Genetics 157:399–411.
Schoniger, M., and A. von Haeseler. 1994. A stochastic model and theevolution of autocorrelated DNA sequences. Mol. Phylogenet. Evol.3:240–247.
Schwarz, G. 1974. Estimating the dimension of a model. Ann. Stat.6:461–464.
Simon, C., F. Frati, A. Beckenbach, B. Brespi, H. Liu, and P. Flook. 1994.Evolution, weighting, and phylogenetic utility of mitochondrial genesequences and a compilation of conserved PCR primers. Ann. Ento-mol. Soc. Am. 87:651–701.
StatSoft, Inc. 1993. Statistica for Windows, release 4.5. StatSoft, Tulsa.Sullivan, J., J. A. Markert, and C. William Kilpatrick. 1997. Phylogeog-
raphy and molecular systematics of the Peromyscus aztecus speciesgroup (Rodentia: Muridae) inferred using parsimony and likelihood.Syst. Biol. 46:426–440.
Sullivan, J., and D. L. Swofford. 2001. Should we use model-basedmethods for phylogenetic inference when we know that assumptionsabout among-site rate variation and nucleotide substitution patternare violated? Syst. Biol. 50:723–729.
Suzuki, Y., G. V. Glazko, and M. Nei. 2002. Overcredibility of molecularphylogenies obtained by Bayesian phylogenetics. Proc. Natl. Acad.Sci. U.S.A. 99:16138–16143.
Swofford, D. L. 2002. PAUP∗. Phylogenetic Analysis Using Parsi-mony (∗and Other Methods), version 4.0b10, Sinauer Associates,Sunderland, MA.
Tavare, S. 1986. Some probabilistic and statistical problems on the anal-ysis of DNA sequences. Pages 57–86 in Some mathematical questionsin biology—DNA sequence analysis (R. M. Miura, ed.). AmericanMath Society, Providence, RI.
Titus, T. A., and D. R. Frost. 1996. Molecular homology assessment andphylogeny in the lizard family Opluridae (Squamata: Iguania). Mol.Phylogenet. Evol. 6:49–62.
Wald, A. 1949. Note on the consistency of the maximum likelihoodestimate. Ann. Math. Stat. 20:595–601.
Wilcox, T. P., D. J. Zwickl, T. A. Heath, and D. M. Hillis. 2002. Phyloge-netic relationships of the dwarf boas and a comparison of Bayesianand bootstrap measures of phylogenetic support. Mol. Phylogenet.Evol. 25:361–371.
Wu, C. I. 1991. Inferences of species phylogeny in relation to segregationof ancient polymorphisms. Genetics 127:429–435.
Yang, Z. 1993. Maximum likelihood estimation of phylogeny fromDNA sequences when substitution rates differ over sites: Approxi-mate methods. Mol. Biol. Evol. 10:1396–1401.
Yang, Z. 1995. A space-time process model for the evolution of DNAsequences. Genetics 139:993—1005.
Yang, Z. 1996a. Maximum likelihood models for combined analyses ofmultiple sequence data. J. Mol. Evol. 42:587–596.
Yang, Z. 1996b. Among-site rate variation and its impacts on phyloge-netic analyses. Trends Ecol. Evol. 11:367–372.
Yang, Z., N. Goldman, and A. Friday. 1994. Comparison of models fornucleotide substitution used in maximum-likelihood phylogeneticestimation. Mol. Biol. Evol. 11:316–324.
Yang, Z., N. Goldman, and A. Friday. 1995. Maximum likelihood treesfrom DNA sequences: A peculiar statistical estimation problem. Syst.Biol. 44:384–399.
First submitted 18 May 2003; reviews returned 15 March 2003;final acceptance 14 December 2003
Associate Editor: Jack Sites

468 SYSTEMATIC BIOLOGY VOL. 53
APPENDIX 1List of operational taxonomic units (OTUs) used in this study with GenBank accession numbers. Cells with an X indicate that gene sequencewas not used in this study. (a) and (b) refer to individuals indicated in the figures. Museum accession numbers for specimens sequenced in thisstudy are given. Acronyms for museums are KU (University of Kansas), MHNSM (Museo de Historia Natural, Universidad Nacional Mayorde San Marcos, Lima, Peru), QCAZ (Museo de Zoologıa, Pontifica Universidad Catolica del Ecuador, Quito, Ecuador), and UTA (University ofTexas at Arlington).
OTU Museum number ND4 c-mos 12S 16S
Alopoglossus atriventris AF420908 AF420821 AF420695 AF420746Alopoglossus carinicaudatus AF420909 AF420847 AF420693 AF420744Alopoglossus copii AF420865 AF420819 AF420692 AF420745Anotosaura spn AF420902 X AF420682 AF420719Anotosaura vanzolinia AF420910 X AF420670 AF420724Arthrosaura kockii AF420866 X AF420680 AF420721Arthrosaura reticulata AF420894 X AF420676 AF420722Bachia bresslaui AF420876 AF420860 X AF420755Bachia dorbignyi AF420892 X AF420688 AF420754Bachia flavescens AF420869 AF420859 AF420705 AF420753Calyptommatus leiolepis AF420874 AF420858 AF420683 AF420712Calyptommatus nicterus AF420903 AF420822 AF420684 AF420747Calyptommatus sinebrachiatus AF420873 AF420832 AF420685 AF420720Cercosaura argulus (a) AF420896 AF420838 AF420698 AF420751Cercosaura argulus (b) AF420893 AF420852 AF420696 AF420750Cercosaura eigenmanni AF420895 AF420828 AF420690 AF420728Cercosaura ocellata AF420883 AF420834 AF420677 AF420731Cercosaura quadrilineata AF420880 AF420830 AF420672 AF420717Cercosaura schreibersii albostrigata AF420882 AF420856 AF420658 AF420729Cercosaura schreibersii schreibersii AF420911 AF420817 AF420686 AF420749Colobodactylus dalcyanus AF420881 AF420844 AF420663 AF420736Colobodactylus taunayi X AF420831 AF420662 AF420741Colobosaura mentalis AF420899 AF420842 AF420694 AF420726Colobosaura modesta AF420887 AF420845 AF420666 AF420733Colobosaura spn AF420868 AF420840 AF420667 AF420739Colobosauroides cearensis AF420886 AF420849 AF420659 AF420727Ecpleopus gaudichaudii AF420901 AF420855 AF420660 AF420738Gymnophthalmus leucomystax AF420906 AF420824 AF420675 AF420715Gymnophthalmus vanzoi AF420867 AF420827 AF420687 AF420743Heterodactylus imbricatus AF420885 AF420835 AF420661 AF420725Iphisa elegans AF420889 AF420843 AF420668 AF420714Leposoma oswaldoi AF420897 AF420854 AF420678 AF420723Leposoma percarinatum AF420898 X AF420700 AF420735Micrablepharus atticolus AF420904 AF420826 AF420664 AF420718Micrablepharus maximiliani AF420875 AF420850 AF420657 AF420730Neusticurus bicarinatus X AF420816 AF420671 AF420708Neusticurus ecpleopus AF420890 AF420829 AF420656 AF420748Neusticurus juruazensis AF420878 AF420857 AF420704 AF420758Neusticurus rudis AF420905 X AF420689 AF420709Neusticurus strangulatus KU 21677 AY507885 X AY507847 AY507866Nothobachia ablephara AF420900 AF420851 AF420669 AF420740Pholidobolus macbrydei KU 218406 AY507886 AY507896 AY507848 AY507867Pholidobolus montium AF420884 AF420820 AF420701 AF420756Placosoma cordylinum AF420879 AF420823 AF420673 AF420734Placosoma glabellum AF420907 AF420833 AF420674 AF420742Procellosaurinus erythrocercus AF420870 AF420836 AF420679 AF420711Procellosaurinus tetradactylus AF420871 AF420818 AF420703 AF420713Proctoporus bolivianus (a) UTA R-51506 AY225175 AY507898 AY507851 AY507869Proctoporus bolivianus (b) UTA R-51487 AY225180 AY507897 AY507850 AY507868Proctoporus cashcaensis KU 217205 AY507887 X AY507852 AY507870Proctoporus colomaromani KU 217209 AY507888 AY507899 AY507853 AY507871Proctoporus guentheri (a) UTA R-51515 AY225185 AY507900 AY507849 AY507872Proctoporus guentheri (b) UTA R-51517 AY225169 AY507901 AY507854 AY507873Proctoporus orcesi KU 221772 AY507889 X AY507855 AY507874Proctoporus simoterus KU 217207 AY507890 AY507902 AY507856 AY507875Proctoporus sucullucu (a) UTA R-51478 AY225171 AY507903 AY507857 AY507878Proctoporus sucullucu (b) UTA R-51496 AY225177 AY507904 AY507858 AY507879Proctoporus unicolor KU 217211 AY507893 AY507907 AY507862 AY507880Proctoporus unsaacae (a) UTA R-51477 AY225170 AY507909 AY507860 AY507881Proctoporus unsaacae (b) UTA R-51488 AY225186 AY507908 AY507859 AY507882Proctoporus ventrimaculatus KU 219838 AY507894 AY507910 AY507863 AY507883Proctoporus cf. ventrimaculatus KU 212687 AY507891 AY507903 AY507864 AY507876Proctoporus sp. K19 QCAZ 879 AY507892 AY507904 AY507861 AY507877
(Continued on next page)

2004 CASTOE ET AL.—BAYESIAN ANALYSIS WITH PARTITIONS AND COMPLEX MODELS 469
APPENDIX 1 (CONTINUED)
OTU Museum number ND4 c-mos 12S 16S
Psilophthalmus paeminosus AF420872 AF420825 AF420702 AF420710Ptychoglossus brevifrontalis X AF420848 AF420697 AF420757Ptychoglossus brevifrontalis MHNSM AY507895 AY507911 AY507865 AY507884Rhachisaurus brachylepis AF420877 AF420853 AF420665 AF420737Tretioscincus agilis AF420891 AF420837 AF420681 AF420732Tretioscincus oriximinensis AF420888 AF420846 AF420691 AF420752Vanzosaura rubricauda X AF420839 AF420699 AF420716Cnemidophorus ocellifer AF420914 AF420862 AF420706 AF420759Kentropyx calcarata AF420913 AF420864 AF420707 AF420760Tupinambis quadrilineatus AF420912 AF420863 X AF420761
APPENDIX 2PROBLEMS DISCOVERED WITH THE PELLEGRINO ET AL.
(2001) DATA SET
After reconstructing phylogenies of each data partition separatelyand combined, we identified four taxa from the Pellegrino et al. (2001)study that demonstrated remarkable incongruence with regard to topo-logical placement among individual gene phylogenies. After carefulexamination of sequences, phylogenetic trees for independent datapartitions, and verification based on our own data collection, we con-clude that the names Neusticurus juruazensis and Ptychoglossus brev-ifrontalis were mistakenly switched by Pellegrino et al. (2001) in the12S and 16S data sets. With the addition of our specimen of P. brev-ifrontalis, this was obvious when examining the individual gene treesfor 12S and 16S; P. brevifrontalis of Pellegrino et al. (2001) (GenBank nos.AF420757, AF420697) formed a clade with N. ecpleopus and N. strangu-latus, whereas N. juruazensis (GenBank nos. AF420758, AF420704) wasvirtually identical to our P. brevifrontalis. After examining the ND4 andc-mos trees, it was evident that these taxa were inadvertently switchedin the 12S and 16S data sets. We swapped the names for these taxa forall of our reconstructions.
An additional problem stems from the inferred phylogenetic place-ment of Bachia dorbignyi (GenBank no. AF420861) and Arthrosaurareticulata (GenBank no. AF420841) in the c-mos gene partition. Thesetwo species had identical sequences and formed a close sisterrelationship with Cercosaura eigenmanni. This relationship can been seenin the squamate phylogeny reconstruction of Harris (2003), which usedthese same sequences. They differed from C. eigenmanni by one basesubstitution and appeared to be distantly related to other species ofBachia (47 and 51 base substitutions) and from the other three mem-bers of the Ecpleopini, for which c-mos sequence was available by52 to 89 base differences (Colobosauroides cearensis, 77; Ecpleopus gau-dichaudii, 52; Leposoma oswaldoi, 89). In all other gene partitions Bachiadorbignyi is closely related to its congeners and Arthrosaura reticu-lata is closely related to other ecpleopiines. These phylogenetic po-sitions are further supported by morphological features such as legreduction in all species of Bachia. We cannot say with certainty whatthis sequence represents but it appears most similar to Cercosauraeigenmanni. Because we could not determine the true origin of thesequences, we excluded these two c-mos sequences from all finalanalyses.