Data Modul fileGood news for Data Modul shareholders: Arrow intends to offer EUR 27.5 per share Data...
12
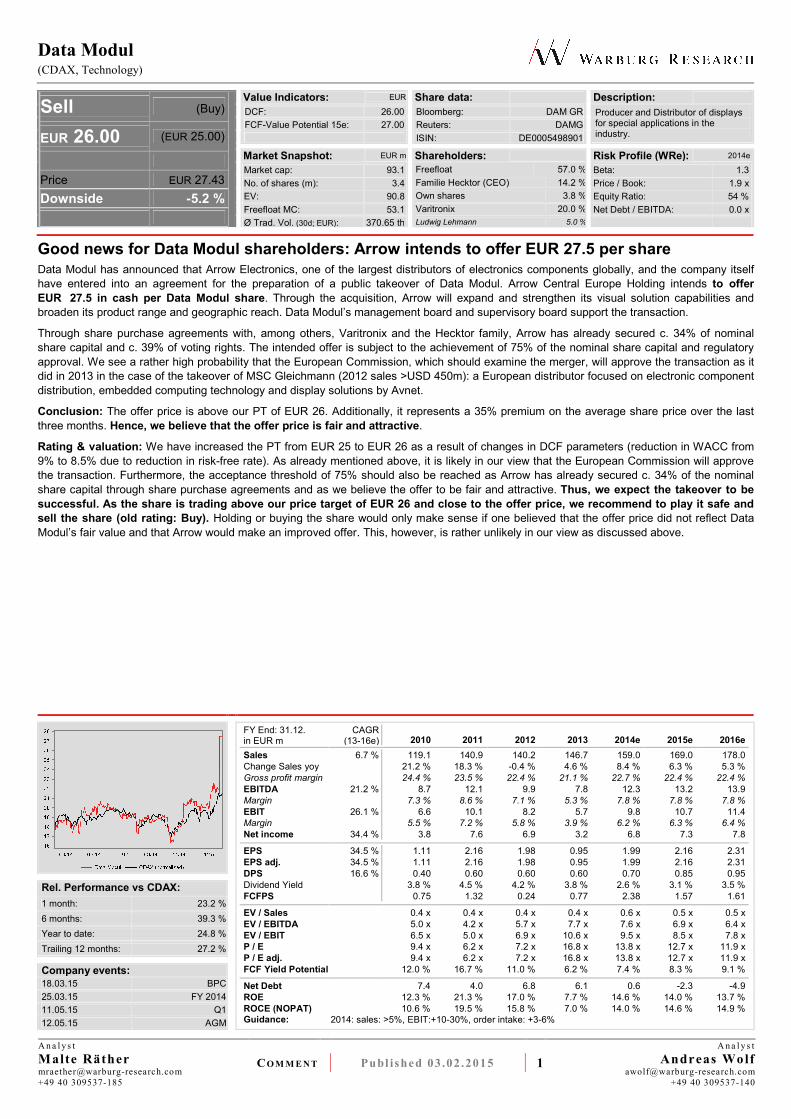
Data Modul (CDAX, Technology) C OMMENT Published 03.02.2015 1 Analyst Malte Räther [email protected] +49 40 309537 - 185 Analyst Andreas Wolf [email protected] +49 40 309537 - 140 Value Indicators: EUR Share data: Description: DCF: 26.00 FCF-Value Potential 15e: 27.00 Bloomberg: DAM GR Reuters: DAMG ISIN: DE0005498901 Producer and Distributor of displays for special applications in the industry. Market Snapshot: EUR m Shareholders: Risk Profile (WRe): 2014e Sell (Buy) EUR 26.00 (EUR 25.00) Price EUR 27.43 Downside -5.2 % Market cap: 93.1 No. of shares (m): 3.4 EV: 90.8 Freefloat MC: 53.1 Ø Trad. Vol. (30d; EUR): 370.65 th Freefloat 57.0 % Familie Hecktor (CEO) 14.2 % Own shares 3.8 % Varitronix 20.0 % Ludwig Lehmann 5.0 % Beta: 1.3 Price / Book: 1.9 x Equity Ratio: 54 % Net Debt / EBITDA: 0.0 x Good news for Data Modul shareholders: Arrow intends to offer EUR 27.5 per share Data Modul has announced that Arrow Electronics, one of the largest distributors of electronics components globally, and the company itself have entered into an agreement for the preparation of a public takeover of Data Modul. Arrow Central Europe Holding intends to offer EUR 27.5 in cash per Data Modul share. Through the acquisition, Arrow will expand and strengthen its visual solution capabilities and broaden its product range and geographic reach. Data Modul’s management board and supervisory board support the transaction. Through share purchase agreements with, among others, Varitronix and the Hecktor family, Arrow has already secured c. 34% of nominal share capital and c. 39% of voting rights. The intended offer is subject to the achievement of 75% of the nominal share capital and regulatory approval. We see a rather high probability that the European Commission, which should examine the merger, will approve the transaction as it did in 2013 in the case of the takeover of MSC Gleichmann (2012 sales >USD 450m): a European distributor focused on electronic component distribution, embedded computing technology and display solutions by Avnet. Conclusion: The offer price is above our PT of EUR 26. Additionally, it represents a 35% premium on the average share price over the last three months. Hence, we believe that the offer price is fair and attractive. Rating & valuation: We have increased the PT from EUR 25 to EUR 26 as a result of changes in DCF parameters (reduction in WACC from 9% to 8.5% due to reduction in risk-free rate). As already mentioned above, it is likely in our view that the European Commission will approve the transaction. Furthermore, the acceptance threshold of 75% should also be reached as Arrow has already secured c. 34% of the nominal share capital through share purchase agreements and as we believe the offer to be fair and attractive. Thus, we expect the takeover to be successful. As the share is trading above our price target of EUR 26 and close to the offer price, we recommend to play it safe and sell the share (old rating: Buy). Holding or buying the share would only make sense if one believed that the offer price did not reflect Data Modul’s fair value and that Arrow would make an improved offer. This, however, is rather unlikely in our view as discussed above. Rel. Performance vs CDAX: 1 month: 23.2 % 6 months: 39.3 % Year to date: 24.8 % Trailing 12 months: 27.2 % Company events: 18.03.15 BPC 25.03.15 FY 2014 11.05.15 Q1 12.05.15 AGM FY End: 31.12. in EUR m CAGR (13-16e) 2010 2011 2012 2013 2014e 2015e 2016e Sales 6.7 % 119.1 140.9 140.2 146.7 159.0 169.0 178.0 Change Sales yoy 21.2 % 18.3 % -0.4 % 4.6 % 8.4 % 6.3 % 5.3 % Gross profit margin 24.4 % 23.5 % 22.4 % 21.1 % 22.7 % 22.4 % 22.4 % EBITDA 21.2 % 8.7 12.1 9.9 7.8 12.3 13.2 13.9 Margin 7.3 % 8.6 % 7.1 % 5.3 % 7.8 % 7.8 % 7.8 % EBIT 26.1 % 6.6 10.1 8.2 5.7 9.8 10.7 11.4 Margin 5.5 % 7.2 % 5.8 % 3.9 % 6.2 % 6.3 % 6.4 % Net income 34.4 % 3.8 7.6 6.9 3.2 6.8 7.3 7.8 EPS 34.5 % 1.11 2.16 1.98 0.95 1.99 2.16 2.31 EPS adj. 34.5 % 1.11 2.16 1.98 0.95 1.99 2.16 2.31 DPS 16.6 % 0.40 0.60 0.60 0.60 0.70 0.85 0.95 Dividend Yield 3.8 % 4.5 % 4.2 % 3.8 % 2.6 % 3.1 % 3.5 % FCFPS 0.75 1.32 0.24 0.77 2.38 1.57 1.61 EV / Sales 0.4 x 0.4 x 0.4 x 0.4 x 0.6 x 0.5 x 0.5 x EV / EBITDA 5.0 x 4.2 x 5.7 x 7.7 x 7.6 x 6.9 x 6.4 x EV / EBIT 6.5 x 5.0 x 6.9 x 10.6 x 9.5 x 8.5 x 7.8 x P / E 9.4 x 6.2 x 7.2 x 16.8 x 13.8 x 12.7 x 11.9 x P / E adj. 9.4 x 6.2 x 7.2 x 16.8 x 13.8 x 12.7 x 11.9 x FCF Yield Potential 12.0 % 16.7 % 11.0 % 6.2 % 7.4 % 8.3 % 9.1 % Net Debt 7.4 4.0 6.8 6.1 0.6 -2.3 -4.9 ROE 12.3 % 21.3 % 17.0 % 7.7 % 14.6 % 14.0 % 13.7 % ROCE (NOPAT) 10.6 % 19.5 % 15.8 % 7.0 % 14.0 % 14.6 % 14.9 % Guidance: 2014: sales: >5%, EBIT:+10-30%, order intake: +3-6%
Transcript of Data Modul fileGood news for Data Modul shareholders: Arrow intends to offer EUR 27.5 per share Data...
Data Modul
(CDAX, Technology)
CO M M E N T Publ ished 03 .02 .2015 1
A n a l y s t
Malte Räther [email protected]
+49 40 309537-185
A n a l y s t
Andreas [email protected]
+49 40 309537-140
Value Indicators: EUR Share data: Description:
DCF: 26.00
FCF-Value Potential 15e: 27.00
Bloomberg: DAM GR
Reuters: DAMG
ISIN: DE0005498901
Producer and Distributor of displays for special applications in the industry.
Market Snapshot: EUR m Shareholders: Risk Profile (WRe): 2014e
Sell (Buy)
EUR 26.00 (EUR 25.00)
Price EUR 27.43
Downside -5.2 %
Market cap: 93.1
No. of shares (m): 3.4
EV: 90.8
Freefloat MC: 53.1
Ø Trad. Vol. (30d; EUR): 370.65 th
Freefloat 57.0 %
Familie Hecktor (CEO) 14.2 %
Own shares 3.8 %
Varitronix 20.0 %
Ludwig Lehmann 5.0 %
Beta: 1.3
Price / Book: 1.9 x
Equity Ratio: 54 %
Net Debt / EBITDA: 0.0 x
Good news for Data Modul shareholders: Arrow intends to offer EUR 27.5 per share Data Modul has announced that Arrow Electronics, one of the largest distributors of electronics components globally, and the company itself
have entered into an agreement for the preparation of a public takeover of Data Modul. Arrow Central Europe Holding intends to offer EUR 27.5 in cash per Data Modul share. Through the acquisition, Arrow will expand and strengthen its visual solution capabilities and
broaden its product range and geographic reach. Data Modul’s management board and supervisory board support the transaction.
Through share purchase agreements with, among others, Varitronix and the Hecktor family, Arrow has already secured c. 34% of nominal
share capital and c. 39% of voting rights. The intended offer is subject to the achievement of 75% of the nominal share capital and regulatory
approval. We see a rather high probability that the European Commission, which should examine the merger, will approve the transaction as it
did in 2013 in the case of the takeover of MSC Gleichmann (2012 sales >USD 450m): a European distributor focused on electronic component
distribution, embedded computing technology and display solutions by Avnet.
Conclusion: The offer price is above our PT of EUR 26. Additionally, it represents a 35% premium on the average share price over the last
three months. Hence, we believe that the offer price is fair and attractive.
Rating & valuation: We have increased the PT from EUR 25 to EUR 26 as a result of changes in DCF parameters (reduction in WACC from
9% to 8.5% due to reduction in risk-free rate). As already mentioned above, it is likely in our view that the European Commission will approve
the transaction. Furthermore, the acceptance threshold of 75% should also be reached as Arrow has already secured c. 34% of the nominal
share capital through share purchase agreements and as we believe the offer to be fair and attractive. Thus, we expect the takeover to be successful. As the share is trading above our price target of EUR 26 and close to the offer price, we recommend to play it safe and sell the share (old rating: Buy). Holding or buying the share would only make sense if one believed that the offer price did not reflect Data
Modul’s fair value and that Arrow would make an improved offer. This, however, is rather unlikely in our view as discussed above.
Rel. Performance vs CDAX:
1 month: 23.2 %
6 months: 39.3 %
Year to date: 24.8 %
Trailing 12 months: 27.2 %
Company events: 18.03.15 BPC
25.03.15 FY 2014
11.05.15 Q1
12.05.15 AGM
FY End: 31.12. in EUR m
CAGR (13-16e) 2010 2011 2012 2013 2014e 2015e 2016e
Sales 6.7 % 119.1 140.9 140.2 146.7 159.0 169.0 178.0
Change Sales yoy 21.2 % 18.3 % -0.4 % 4.6 % 8.4 % 6.3 % 5.3 %
Gross profit margin 24.4 % 23.5 % 22.4 % 21.1 % 22.7 % 22.4 % 22.4 %
EBITDA 21.2 % 8.7 12.1 9.9 7.8 12.3 13.2 13.9
Margin 7.3 % 8.6 % 7.1 % 5.3 % 7.8 % 7.8 % 7.8 %
EBIT 26.1 % 6.6 10.1 8.2 5.7 9.8 10.7 11.4
Margin 5.5 % 7.2 % 5.8 % 3.9 % 6.2 % 6.3 % 6.4 %
Net income 34.4 % 3.8 7.6 6.9 3.2 6.8 7.3 7.8
EPS 34.5 % 1.11 2.16 1.98 0.95 1.99 2.16 2.31
EPS adj. 34.5 % 1.11 2.16 1.98 0.95 1.99 2.16 2.31
DPS 16.6 % 0.40 0.60 0.60 0.60 0.70 0.85 0.95
Dividend Yield 3.8 % 4.5 % 4.2 % 3.8 % 2.6 % 3.1 % 3.5 %
FCFPS 0.75 1.32 0.24 0.77 2.38 1.57 1.61
EV / Sales 0.4 x 0.4 x 0.4 x 0.4 x 0.6 x 0.5 x 0.5 x
EV / EBITDA 5.0 x 4.2 x 5.7 x 7.7 x 7.6 x 6.9 x 6.4 x
EV / EBIT 6.5 x 5.0 x 6.9 x 10.6 x 9.5 x 8.5 x 7.8 x
P / E 9.4 x 6.2 x 7.2 x 16.8 x 13.8 x 12.7 x 11.9 x
P / E adj. 9.4 x 6.2 x 7.2 x 16.8 x 13.8 x 12.7 x 11.9 x
FCF Yield Potential 12.0 % 16.7 % 11.0 % 6.2 % 7.4 % 8.3 % 9.1 %
Net Debt 7.4 4.0 6.8 6.1 0.6 -2.3 -4.9
ROE 12.3 % 21.3 % 17.0 % 7.7 % 14.6 % 14.0 % 13.7 %
ROCE (NOPAT) 10.6 % 19.5 % 15.8 % 7.0 % 14.0 % 14.6 % 14.9 % Guidance: 2014: sales: >5%, EBIT:+10-30%, order intake: +3-6%

Data Modul
CO M M E N T Publ ished 03 .02 .2015 2
Sales development in EUR m
Source: Warburg Research
Sales by regions 2013; in %
Source: Warburg Research
EBIT development in EUR m
Source: Warburg Research
Company Background
� Display solutions for OEMs. With its own products, Data Modul forms the value-added connection between panel producers (LG,
Sharp, Samsung etc.) and customers. Trade products complete the offering.
� Displays segment: distribution of standard and added-value products (e.g. additional equipping of the displays with PC components
and software).
� In the Systems segment, Data Modul mainly develops and sells its own products and customer-specific solutions. This includes e.g.
special monitors for marine navigation or medical technology.
� Increasingly important areas of business growth are embedded computer solutions and touch solutions.
Competitive Quality
� Europe's largest display distributor.
� Strong customer loyalty with in-house design (Design-In) of customers' products.
� The company supplies displays equipped for customer-specific usage, such as to withstand various weather conditions or displays
which are shock-resistant, magnetic field independent or energy-optimised.
� Earlier access to new technologies through the Distribution business.
� Expertise built up over 30 years.
EBT development in EUR m
Source: Warburg Research
Sales by segments 2013; in %
Source: Warburg Research
Net income development in EUR m
Source: Warburg Research
Data Modul
CO M M E N T Publ ished 03 .02 .2015 3
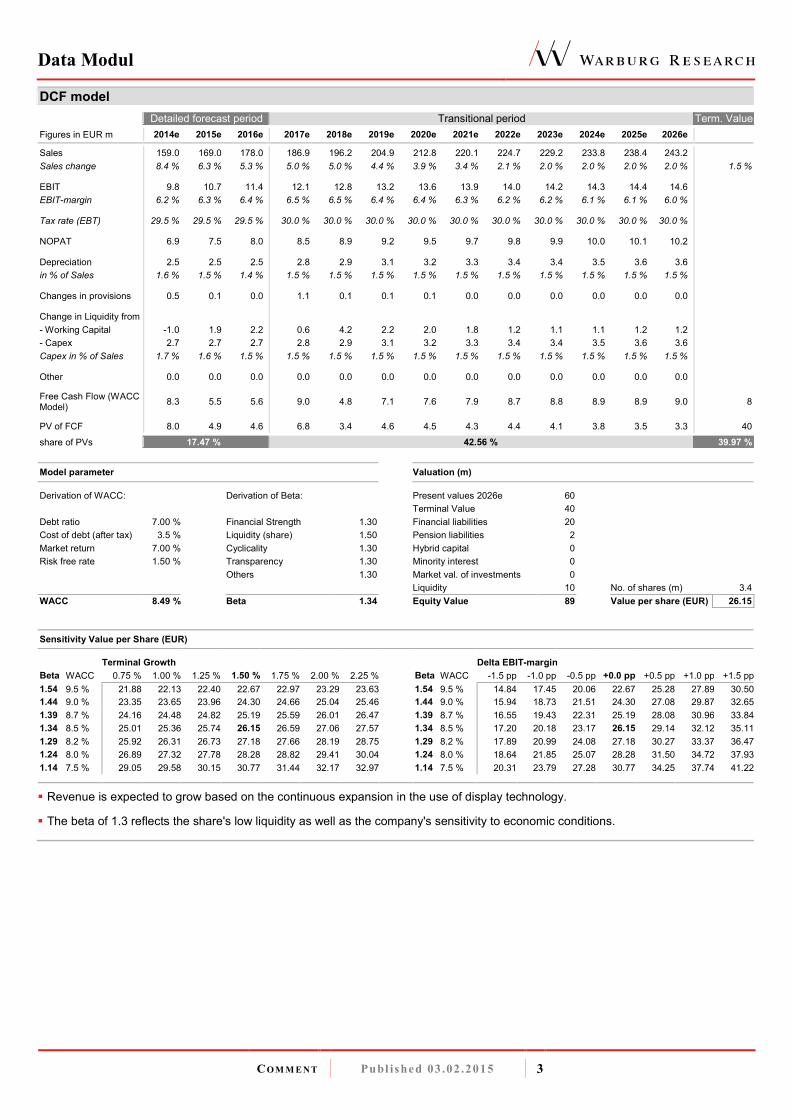
DCF model
Detailed forecast period Transitional period Term. Value
Figures in EUR m 2014e 2015e 2016e 2017e 2018e 2019e 2020e 2021e 2022e 2023e 2024e 2025e 2026e
Sales 159.0 169.0 178.0 186.9 196.2 204.9 212.8 220.1 224.7 229.2 233.8 238.4 243.2
Sales change 8.4 % 6.3 % 5.3 % 5.0 % 5.0 % 4.4 % 3.9 % 3.4 % 2.1 % 2.0 % 2.0 % 2.0 % 2.0 % 1.5 %
EBIT 9.8 10.7 11.4 12.1 12.8 13.2 13.6 13.9 14.0 14.2 14.3 14.4 14.6
EBIT-margin 6.2 % 6.3 % 6.4 % 6.5 % 6.5 % 6.4 % 6.4 % 6.3 % 6.2 % 6.2 % 6.1 % 6.1 % 6.0 %
Tax rate (EBT) 29.5 % 29.5 % 29.5 % 30.0 % 30.0 % 30.0 % 30.0 % 30.0 % 30.0 % 30.0 % 30.0 % 30.0 % 30.0 %
NOPAT 6.9 7.5 8.0 8.5 8.9 9.2 9.5 9.7 9.8 9.9 10.0 10.1 10.2
Depreciation 2.5 2.5 2.5 2.8 2.9 3.1 3.2 3.3 3.4 3.4 3.5 3.6 3.6
in % of Sales 1.6 % 1.5 % 1.4 % 1.5 % 1.5 % 1.5 % 1.5 % 1.5 % 1.5 % 1.5 % 1.5 % 1.5 % 1.5 %
Changes in provisions 0.5 0.1 0.0 1.1 0.1 0.1 0.1 0.0 0.0 0.0 0.0 0.0 0.0
Change in Liquidity from
- Working Capital -1.0 1.9 2.2 0.6 4.2 2.2 2.0 1.8 1.2 1.1 1.1 1.2 1.2
- Capex 2.7 2.7 2.7 2.8 2.9 3.1 3.2 3.3 3.4 3.4 3.5 3.6 3.6
Capex in % of Sales 1.7 % 1.6 % 1.5 % 1.5 % 1.5 % 1.5 % 1.5 % 1.5 % 1.5 % 1.5 % 1.5 % 1.5 % 1.5 %
Other 0.0 0.0 0.0 0.0 0.0 0.0 0.0 0.0 0.0 0.0 0.0 0.0 0.0
Free Cash Flow (WACC Model)
8.3 5.5 5.6 9.0 4.8 7.1 7.6 7.9 8.7 8.8 8.9 8.9 9.0 8
PV of FCF 8.0 4.9 4.6 6.8 3.4 4.6 4.5 4.3 4.4 4.1 3.8 3.5 3.3 40 share of PVs 17.47 % 42.56 % 39.97 %
Model parameter Valuation (m)
Derivation of WACC: Derivation of Beta: Present values 2026e 60
Terminal Value 40
Debt ratio 7.00 % Financial Strength 1.30 Financial liabilities 20
Cost of debt (after tax) 3.5 % Liquidity (share) 1.50 Pension liabilities 2
Market return 7.00 % Cyclicality 1.30 Hybrid capital 0
Risk free rate 1.50 % Transparency 1.30 Minority interest 0
Others 1.30 Market val. of investments 0
Liquidity 10 No. of shares (m) 3.4
WACC 8.49 % Beta 1.34 Equity Value 89 Value per share (EUR) 26.15
Sensitivity Value per Share (EUR)
Terminal Growth Delta EBIT-margin
Beta WACC 0.75 % 1.00 % 1.25 % 1.50 % 1.75 % 2.00 % 2.25 % Beta WACC -1.5 pp -1.0 pp -0.5 pp +0.0 pp +0.5 pp +1.0 pp +1.5 pp
1.54 9.5 % 21.88 22.13 22.40 22.67 22.97 23.29 23.63 1.54 9.5 % 14.84 17.45 20.06 22.67 25.28 27.89 30.50
1.44 9.0 % 23.35 23.65 23.96 24.30 24.66 25.04 25.46 1.44 9.0 % 15.94 18.73 21.51 24.30 27.08 29.87 32.65
1.39 8.7 % 24.16 24.48 24.82 25.19 25.59 26.01 26.47 1.39 8.7 % 16.55 19.43 22.31 25.19 28.08 30.96 33.84
1.34 8.5 % 25.01 25.36 25.74 26.15 26.59 27.06 27.57 1.34 8.5 % 17.20 20.18 23.17 26.15 29.14 32.12 35.11
1.29 8.2 % 25.92 26.31 26.73 27.18 27.66 28.19 28.75 1.29 8.2 % 17.89 20.99 24.08 27.18 30.27 33.37 36.47
1.24 8.0 % 26.89 27.32 27.78 28.28 28.82 29.41 30.04 1.24 8.0 % 18.64 21.85 25.07 28.28 31.50 34.72 37.93
1.14 7.5 % 29.05 29.58 30.15 30.77 31.44 32.17 32.97 1.14 7.5 % 20.31 23.79 27.28 30.77 34.25 37.74 41.22
� Revenue is expected to grow based on the continuous expansion in the use of display technology.
� The beta of 1.3 reflects the share's low liquidity as well as the company's sensitivity to economic conditions.
Data Modul
CO M M E N T Publ ished 03 .02 .2015 4
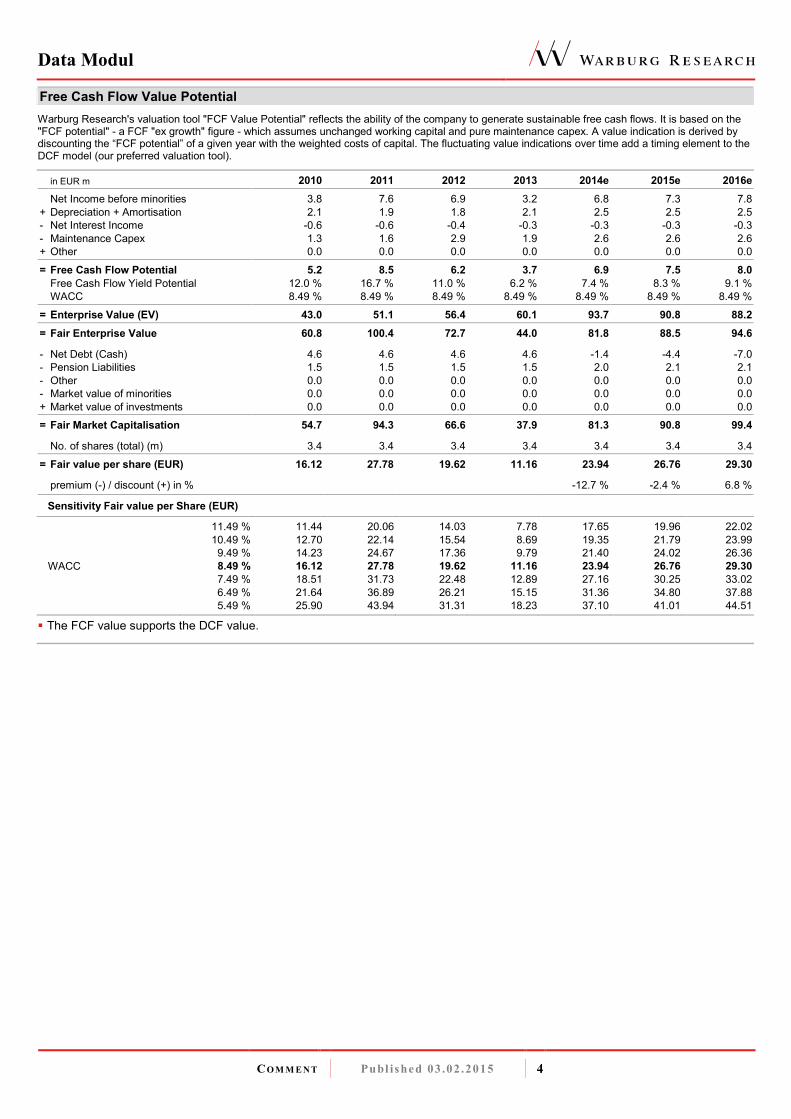
Free Cash Flow Value Potential Warburg Research's valuation tool "FCF Value Potential" reflects the ability of the company to generate sustainable free cash flows. It is based on the "FCF potential" - a FCF "ex growth" figure - which assumes unchanged working capital and pure maintenance capex. A value indication is derived by discounting the “FCF potential” of a given year with the weighted costs of capital. The fluctuating value indications over time add a timing element to the DCF model (our preferred valuation tool). in EUR m 2010 2011 2012 2013 2014e 2015e 2016e
Net Income before minorities 3.8 7.6 6.9 3.2 6.8 7.3 7.8
+ Depreciation + Amortisation 2.1 1.9 1.8 2.1 2.5 2.5 2.5
- Net Interest Income -0.6 -0.6 -0.4 -0.3 -0.3 -0.3 -0.3
- Maintenance Capex 1.3 1.6 2.9 1.9 2.6 2.6 2.6
+ Other 0.0 0.0 0.0 0.0 0.0 0.0 0.0
= Free Cash Flow Potential 5.2 8.5 6.2 3.7 6.9 7.5 8.0 Free Cash Flow Yield Potential 12.0 % 16.7 % 11.0 % 6.2 % 7.4 % 8.3 % 9.1 %
WACC 8.49 % 8.49 % 8.49 % 8.49 % 8.49 % 8.49 % 8.49 %
= Enterprise Value (EV) 43.0 51.1 56.4 60.1 93.7 90.8 88.2 = Fair Enterprise Value 60.8 100.4 72.7 44.0 81.8 88.5 94.6
- Net Debt (Cash) 4.6 4.6 4.6 4.6 -1.4 -4.4 -7.0
- Pension Liabilities 1.5 1.5 1.5 1.5 2.0 2.1 2.1
- Other 0.0 0.0 0.0 0.0 0.0 0.0 0.0
- Market value of minorities 0.0 0.0 0.0 0.0 0.0 0.0 0.0
+ Market value of investments 0.0 0.0 0.0 0.0 0.0 0.0 0.0
= Fair Market Capitalisation 54.7 94.3 66.6 37.9 81.3 90.8 99.4
No. of shares (total) (m) 3.4 3.4 3.4 3.4 3.4 3.4 3.4
= Fair value per share (EUR) 16.12 27.78 19.62 11.16 23.94 26.76 29.30
premium (-) / discount (+) in % -12.7 % -2.4 % 6.8 %
Sensitivity Fair value per Share (EUR)
11.49 % 11.44 20.06 14.03 7.78 17.65 19.96 22.02
10.49 % 12.70 22.14 15.54 8.69 19.35 21.79 23.99
9.49 % 14.23 24.67 17.36 9.79 21.40 24.02 26.36
WACC 8.49 % 16.12 27.78 19.62 11.16 23.94 26.76 29.30 7.49 % 18.51 31.73 22.48 12.89 27.16 30.25 33.02
6.49 % 21.64 36.89 26.21 15.15 31.36 34.80 37.88
5.49 % 25.90 43.94 31.31 18.23 37.10 41.01 44.51
� The FCF value supports the DCF value.

Data Modul
CO M M E N T Publ ished 03 .02 .2015 5
Valuation
2010 2011 2012 2013 2014e 2015e 2016e Price / Book 1.1 x 1.2 x 1.2 x 1.3 x 1.9 x 1.7 x 1.6 x
Book value per share ex intangibles 8.05 9.64 10.51 11.12 12.82 14.22 15.65
EV / Sales 0.4 x 0.4 x 0.4 x 0.4 x 0.6 x 0.5 x 0.5 x
EV / EBITDA 5.0 x 4.2 x 5.7 x 7.7 x 7.6 x 6.9 x 6.4 x
EV / EBIT 6.5 x 5.0 x 6.9 x 10.6 x 9.5 x 8.5 x 7.8 x
EV / EBIT adj.* 6.5 x 5.0 x 6.9 x 10.6 x 9.5 x 8.5 x 7.8 x
P / FCF 14.0 x 10.1 x 60.7 x 26.3 x 11.5 x 17.4 x 17.1 x
P / E 9.4 x 6.2 x 7.2 x 16.8 x 13.8 x 12.7 x 11.9 x
P / E adj.* 9.4 x 6.2 x 7.2 x 16.8 x 13.8 x 12.7 x 11.9 x
Dividend Yield 3.8 % 4.5 % 4.2 % 3.8 % 2.6 % 3.1 % 3.5 %
Free Cash Flow Yield Potential 12.0 % 16.7 % 11.0 % 6.2 % 7.4 % 8.3 % 9.1 %
*Adjustments made for: -

Data Modul
CO M M E N T Publ ished 03 .02 .2015 6
Consolidated profit and loss In EUR m 2010 2011 2012 2013 2014e 2015e 2016e Sales 119.1 140.9 140.2 146.7 159.0 169.0 178.0 Change Sales yoy 21.2 % 18.3 % -0.4 % 4.6 % 8.4 % 6.3 % 5.3 %
COGS 90.0 107.8 108.9 115.7 123.0 131.1 138.2
Gross profit 29.1 33.1 31.4 31.0 36.0 37.9 39.8 Gross margin 24.4 % 23.5 % 22.4 % 21.1 % 22.7 % 22.4 % 22.4 %
Research and development 2.3 2.9 3.1 4.9 4.0 4.0 4.0
Sales and marketing 20.1 20.0 20.1 20.4 22.2 23.2 24.4
Administration expenses 0.0 0.0 0.0 0.0 0.0 0.0 0.0
Other operating expenses 0.0 0.0 0.0 0.0 0.0 0.0 0.0
Other operating income 0.0 0.0 0.0 0.0 0.0 0.0 0.0
Unfrequent items 0.0 0.0 0.0 0.0 0.0 0.0 0.0
EBITDA 8.7 12.1 9.9 7.8 12.3 13.2 13.9 Margin 7.3 % 8.6 % 7.1 % 5.3 % 7.8 % 7.8 % 7.8 %
Depreciation of fixed assets 0.9 0.7 0.8 1.1 1.1 1.1 1.1
EBITA 7.8 11.3 9.1 6.6 11.2 12.1 12.8 Amortisation of intangible fixed assets 1.2 1.2 1.0 1.0 1.4 1.4 1.4
Goodwill amortization 0.0 0.0 0.0 0.0 0.0 0.0 0.0
EBIT 6.6 10.1 8.2 5.7 9.8 10.7 11.4 Margin 5.5 % 7.2 % 5.8 % 3.9 % 6.2 % 6.3 % 6.4 %
EBIT adj. 6.6 10.1 8.2 5.7 9.8 10.7 11.4 Interest income 0.0 0.0 0.0 0.0 0.0 0.0 0.0
Interest expenses 0.7 0.7 0.4 0.3 0.3 0.3 0.3
Other financial income (loss) 0.0 0.0 0.0 0.0 0.0 0.0 0.0
EBT 6.0 9.5 7.7 5.4 9.6 10.4 11.1 Margin 5.0 % 6.8 % 5.5 % 3.7 % 6.0 % 6.2 % 6.3 %
Total taxes 2.2 1.9 0.9 2.2 2.8 3.1 3.3
Net income from continuing operations 3.8 7.6 6.9 3.2 6.8 7.3 7.8 Income from discontinued operations (net of tax) 0.0 0.0 0.0 0.0 0.0 0.0 0.0
Net income before minorities 3.8 7.6 6.9 3.2 6.8 7.3 7.8 Minority interest 0.0 0.0 0.0 0.0 0.0 0.0 0.0
Net income 3.8 7.6 6.9 3.2 6.8 7.3 7.8 Margin 3.2 % 5.4 % 4.9 % 2.2 % 4.3 % 4.3 % 4.4 %
Number of shares, average 3.4 3.5 3.5 3.4 3.4 3.4 3.4
EPS 1.11 2.16 1.98 0.95 1.99 2.16 2.31 EPS adj. 1.11 2.16 1.98 0.95 1.99 2.16 2.31
*Adjustments made for:
Guidance: 2014: sales: >5%, EBIT:+10-30%, order intake: +3-6%
Financial Ratios 2010 2011 2012 2013 2014e 2015e 2016e Total Operating Costs / Sales 18.9 % 16.3 % 16.6 % 17.2 % 16.5 % 16.1 % 16.0 %
Operating Leverage n.a. 3.0 x 43.9 x -6.6 x 8.8 x 1.3 x 1.3 x
EBITDA / Interest expenses 13.0 x 18.6 x 22.4 x 24.0 x 49.4 x 52.6 x 55.5 x
Tax rate (EBT) 36.5 % 20.2 % 11.5 % 40.0 % 29.5 % 29.5 % 29.5 %
Dividend Payout Ratio 36.2 % 27.8 % 30.3 % 62.9 % 35.1 % 39.3 % 41.1 %
Sales per Employee 436,201 464,917 445,222 440,559 477,477 507,508 534,535
Sales, EBITDA in EUR m
Source: Warburg Research
Operating Performance in %
Source: Warburg Research
Performance per Share
Source: Warburg Research

Data Modul
CO M M E N T Publ ished 03 .02 .2015 7
Consolidated balance sheet In EUR m 2010 2011 2012 2013 2014e 2015e 2016e Assets Goodwill and other intangible assets 5.1 4.8 5.4 5.0 6.4 6.5 6.6
thereof other intangible assets 1.0 0.8 1.6 2.5 2.6 2.7 2.8
thereof Goodwill 2.4 2.4 2.4 2.4 2.4 2.4 2.4
Property, plant and equipment 7.8 7.8 8.4 9.0 9.1 9.2 9.3
Financial assets 0.0 0.0 0.0 0.0 0.0 0.0 0.0
Other long-term assets 0.0 1.5 1.4 0.3 1.5 1.5 1.5
Fixed assets 12.8 14.1 15.2 14.2 17.0 17.2 17.4 Inventories 22.9 27.1 30.4 29.8 32.4 33.8 35.6
Accounts receivable 18.5 17.7 15.8 22.4 19.6 20.8 21.9
Liquid assets 6.5 8.4 9.5 15.3 21.3 24.3 26.9
Other short-term assets 3.6 2.5 3.3 2.3 2.3 2.3 2.3
Current assets 51.5 55.8 59.1 69.7 75.6 81.2 86.6 Total Assets 64.3 69.9 74.3 83.9 92.6 98.3 104.0 Liabilities and shareholders' equity Subscribed capital 10.6 10.6 10.2 10.2 10.2 10.2 10.2
Capital reserve 22.4 22.4 22.4 22.4 22.4 22.4 22.4
Retained earnings 1.2 7.4 10.6 11.7 16.5 21.4 26.4
Other equity components -1.7 -1.7 -1.5 -1.7 0.8 0.7 0.7
Shareholder's equity 32.6 38.8 41.8 42.7 49.9 54.8 59.8
Minority interest 0.0 0.0 0.0 0.0 0.0 0.0 0.0
Total equity 32.6 38.8 41.8 42.7 49.9 54.8 59.8 Provisions 3.6 3.9 4.2 4.8 5.3 5.5 5.5
thereof provisions for pensions and similar obligations 2.1 1.9 1.6 1.5 2.0 2.1 2.1
Financial liabilites (total) 11.8 10.5 14.7 19.9 19.9 19.9 19.9
thereof short-term financial liabilities 8.3 6.2 10.0 19.0 19.0 19.0 19.0
Accounts payable 10.1 9.0 8.4 10.9 11.8 12.5 13.2
Other liabilities 6.3 7.8 5.2 5.6 5.6 5.6 5.6
Liabilities 31.7 31.1 32.5 41.2 42.6 43.5 44.2 Total liabilities and shareholders' equity 64.3 69.9 74.3 83.9 92.6 98.3 104.0
Financial Ratios 2010 2011 2012 2013 2014e 2015e 2016e Efficiency of Capital Employment Operating Assets Turnover 3.0 x 3.2 x 3.0 x 2.9 x 3.2 x 3.3 x 3.3 x
Capital Employed Turnover 3.0 x 3.3 x 2.9 x 3.0 x 3.1 x 3.2 x 3.2 x
ROA 29.5 % 54.0 % 45.0 % 22.7 % 39.9 % 42.7 % 45.2 %
Return on Capital ROCE (NOPAT) 10.6 % 19.5 % 15.8 % 7.0 % 14.0 % 14.6 % 14.9 %
ROE 12.3 % 21.3 % 17.0 % 7.7 % 14.6 % 14.0 % 13.7 %
Adj. ROE 12.3 % 21.3 % 17.0 % 7.7 % 14.6 % 14.0 % 13.7 %
Balance sheet quality Net Debt 7.4 4.0 6.8 6.1 0.6 -2.3 -4.9
Net Financial Debt 5.3 2.1 5.2 4.6 -1.4 -4.4 -7.0
Net Gearing 22.7 % 10.3 % 16.3 % 14.3 % 1.1 % -4.2 % -8.1 %
Net Fin. Debt / EBITDA 61.2 % 17.0 % 52.6 % 59.1 % n.a. n.a. n.a.
Book Value / Share 9.5 11.0 12.1 12.6 14.7 16.1 17.6
Book value per share ex intangibles 8.0 9.6 10.5 11.1 12.8 14.2 15.7
ROCE Development
Source: Warburg Research
Net debt in EUR m
Source: Warburg Research
Book Value per Share in EUR
Source: Warburg Research

Data Modul
CO M M E N T Publ ished 03 .02 .2015 8
Consolidated cash flow statement In EUR m 2010 2011 2012 2013 2014e 2015e 2016e Net income 3.8 7.6 6.9 3.2 6.8 7.3 7.8
Depreciation of fixed assets 0.9 0.7 0.8 1.1 1.1 1.1 1.1
Amortisation of goodwill 0.0 0.0 0.0 0.0 0.0 0.0 0.0
Amortisation of intangible assets 1.2 1.2 1.0 1.0 1.4 1.4 1.4
Increase/decrease in long-term provisions 0.0 0.1 0.5 -0.1 0.5 0.1 0.0
Other non-cash income and expenses 4.3 3.6 1.7 2.9 0.0 0.0 0.0
Cash Flow 10.2 13.2 10.8 8.2 9.8 9.9 10.3 Increase / decrease in inventory -4.8 -4.3 -3.3 0.6 -2.6 -1.4 -1.8
Increase / decrease in accounts receivable -5.7 0.8 2.2 -6.5 2.8 -1.2 -1.1
Increase / decrease in accounts payable 4.2 -0.9 -0.6 2.6 0.9 0.7 0.7
Increase / decrease in other working capital positions 0.1 -2.5 -5.3 0.0 0.0 0.0 0.0
Increase / decrease in working capital (total) -6.2 -6.9 -7.0 -3.3 1.0 -1.9 -2.2
Net cash provided by operating activities 4.0 6.3 3.9 4.9 10.8 8.0 8.1 Investments in intangible assets -1.1 -0.9 -1.6 -1.6 -1.5 -1.5 -1.5
Investments in property, plant and equipment -0.3 -0.8 -1.4 -1.2 -1.2 -1.2 -1.2
Payments for acquisitions 0.0 0.0 0.0 0.0 0.0 0.0 0.0
Financial investments 0.0 0.0 0.0 0.0 0.0 0.0 0.0
Income from asset disposals 0.0 0.0 0.0 0.0 0.0 0.0 0.0
Net cash provided by investing activities -1.4 -1.7 -3.0 -2.2 -2.7 -2.7 -2.7 Change in financial liabilities -0.9 -1.3 4.3 5.1 0.0 0.0 0.0
Dividends paid 0.0 -1.4 -2.1 -2.0 -2.0 -2.4 -2.9
Purchase of own shares 0.0 0.0 -1.9 0.0 0.0 0.0 0.0
Capital measures 0.0 0.0 0.0 0.0 0.0 0.0 0.0
Other 0.0 0.0 0.0 0.0 0.0 0.0 0.0
Net cash provided by financing activities -0.9 -2.7 0.3 3.1 -2.0 -2.4 -2.9 Change in liquid funds 1.6 1.9 1.1 5.7 6.1 3.0 2.6
Effects of exchange-rate changes on cash 0.0 0.0 0.0 0.1 0.0 0.0 0.0
Cash and cash equivalent at end of period 6.5 8.4 9.5 15.3 21.3 24.3 26.9
Financial Ratios 2010 2011 2012 2013 2014e 2015e 2016e Cash Flow FCF 2.6 4.7 0.8 2.6 8.1 5.3 5.4
Free Cash Flow / Sales 2.1 % 3.3 % 0.6 % 1.4 % 5.1 % 3.2 % 3.1 %
Free Cash Flow Potential 5.2 8.5 6.2 3.7 6.9 7.5 8.0
Free Cash Flow / Sales 2.1 % 3.3 % 0.6 % 1.4 % 5.1 % 3.2 % 3.1 %
Free Cash Flow / Net Profit 67.4 % 61.2 % 11.9 % 63.5 % 119.4 % 72.7 % 69.4 %
Interest Received / Avg. Cash 0.7 % 0.6 % 0.3 % 0.4 % 0.0 % 0.0 % 0.0 %
Interest Paid / Avg. Debt 5.4 % 5.8 % 3.5 % 1.9 % 1.3 % 1.3 % 1.3 %
Management of Funds Investment ratio 1.2 % 1.2 % 2.2 % 1.9 % 1.7 % 1.6 % 1.5 %
Maint. Capex / Sales 1.1 % 1.1 % 2.1 % 1.3 % 1.6 % 1.5 % 1.4 %
Capex / Dep 67.5 % 87.7 % 169.7 % 132.0 % 108.0 % 108.0 % 108.0 %
Avg. Working Capital / Sales 24.4 % 23.8 % 26.3 % 27.0 % 25.6 % 24.3 % 24.3 %
Trade Debtors / Trade Creditors 184.1 % 196.3 % 188.9 % 204.2 % 166.1 % 166.4 % 165.9 %
Inventory Turnover 3.9 x 4.0 x 3.6 x 3.9 x 3.8 x 3.9 x 3.9 x
Receivables collection period (days) 57 46 41 56 45 45 45
Payables payment period (days) 41 31 28 35 35 35 35
Cash conversion cycle (Days) 66 73 85 74 73 71 71
CAPEX and Cash Flow in EUR m
Source: Warburg Research
Free Cash Flow Generation
Source: Warburg Research
Working Capital
Source: Warburg Research

Data Modul
CO M M E N T Publ ished 03 .02 .2015 9
LEGAL DISCLAIMER
This research report was prepared by the Warburg Research GmbH, a subsidiary of the M.M.Warburg & CO (AG & Co.) KGaA and is passed on by the
M.M.Warburg & CO (AG & Co.) KGaA. It contains selected information and does not purport to be complete. The report is based on publicly available
information and data ("the information") believed to be accurate and complete. Warburg Research GmbH neither does examine the information to be
accurate and complete, nor guarantees its accuracy and completeness. Possible errors or incompleteness of the information do not constitute grounds
for liability of M.M.Warburg & CO (AG & Co.) KGaA or Warburg Research GmbH for damages of any kind whatsoever, and M.M.Warburg & CO (AG &
Co.) KGaA and Warburg Research GmbH are not liable for indirect and/or direct and/or consequential damages. In particular, neither M.M.Warburg &
CO (AG & Co.) KGaA nor Warburg Research GmbH are liable for the statements, plans or other details contained in these analyses concerning the
examined companies, their affiliated companies, strategies, economic situations, market and competitive situations, regulatory environment, etc.
Although due care has been taken in compiling this research report, it cannot be excluded that it is incomplete or contains errors. M.M.Warburg & CO
(AG & Co.) KGaA and Warburg Research GmbH, their shareholders and employees are not liable for the accuracy and completeness of the
statements, estimations and the conclusions derived from the information contained in this document. Provided a research report is being transmitted in
connection with an existing contractual relationship, i.e. financial advisory or similar services, the liability of M.M.Warburg & CO (AG & Co.) KGaA and
Warburg Research GmbH shall be restricted to gross negligence and wilful misconduct. In case of failure in essential tasks, M.M.Warburg & CO (AG &
Co.) KGaA and Warburg Research GmbH are liable for normal negligence. In any case, the liability of M.M.Warburg & CO (AG & Co.) KGaA and
Warburg Research GmbH is limited to typical, expectable damages. This research report does not constitute an offer or a solicitation of an offer for the
purchase or sale of any security. Partners, directors or employees of M.M.Warburg & CO (AG & Co.) KGaA, Warburg Research GmbH or affiliated
companies may serve in a position of responsibility, i.e. on the board of directors of companies mentioned in the report. Opinions expressed in this
report are subject to change without notice. All rights reserved.
COPYRIGHT NOTICE
This work including all its parts is protected by copyright. Any use beyond the limits provided by copyright law without permission is prohibited and
punishable. This applies, in particular, to reproductions, translations, microfilming, and storage and processing on electronic media of the entire content
or parts thereof.
DISCLOSURE ACCORDING TO §34B (1) OF THE GERMAN SECURITIES TRADING ACT (WHPG) AND THE ORDINANCE ON THE ANALYSIS OF FINANCIAL INSTRUMENTS (FINANV)
The valuation underlying the investment recommendation for the company analysed here is based on generally accepted and widely used methods of
fundamental analysis, such as e.g. DCF Model, Free Cash Flow Potential, Peer Group Comparison or Sum of the Parts Model. The result of this
fundamental valuation is modified to take into consideration the analyst’s assessment as regards the expected development of investor sentiment and
its impact on the share price.
Independent of the applied valuation methods, there is the risk that the price target will not be met, for instance because of unforeseen changes in
demand for the company’s products, changes in management, technology, economic development, interest rate development, operating and/or
material costs, competitive pressure, supervisory law, exchange rate, tax rate etc. For investments in foreign markets and instruments there are further
risks, generally based on exchange rate changes or changes in political and social conditions.
This commentary reflects the opinion of the relevant author at the point in time of its compilation. A change in the fundamental factors underlying the
valuation can mean that the valuation is subsequently no longer accurate. Whether, or in what time frame, an update of this commentary follows is not
determined in advance.
In accordance with § 5 (4) of the Ordinance on the Analysis of Financial Instruments (FinAnV) Warburg Research GmbH has implemented additional
internal and organisational arrangements to prevent or to deal with conflicts of interest. Among these are the spatial separation of Warburg Research
GmbH from M.M.Warburg & CO (AG & Co.) KGaA and the creation of areas of confidentiality. This prevents the exchange of information, which could
form the basis of conflicts of interest for Warburg Research in terms of the analysed issuers or their financial instruments.
The analysts of Warburg Research GmbH do not receive a gratuity – directly or indirectly – from the investment banking activities of M.M.Warburg &
CO (AG & Co.) KGaA or of any company within the Warburg Group.
All prices of financial instruments given in this financial analysis are the closing prices on the last stock-market trading day before the publication date
stated, unless another point in time is explicitly stated.
M.M.Warburg & CO (AG & Co.) KGaA and Warburg Research GmbH are subject to the supervision of the Federal Financial Supervisory Authority,
BaFin.
SOURCES
All data and consensus estimates have been obtained from FactSet except where stated otherwise.
Data Modul
CO M M E N T Publ ished 03 .02 .2015 10
Reference in accordance with section 34b of the German Securities Trading Act (WpHG) and the Ordiance on the Analysis of Financial Instruments (FinAnV) regarding possible conflicts of interest with the analysed company:
-1- The company preparing the analysis or any of its affiliated companies hold over 5% of shares in the analysed company’s equity
capital.
-2-
Within the last twelve months, the company preparing the analysis or any of its affiliated companies have participated in the
management of a consortium for the public offering of financial securities, which are (or the issuer of which) is the subject of
the analysis.
-3- The company preparing the analysis or any of its affiliated companies manage the securities of the analysed company on the
grounds of an existing contract.
-4-
On the grounds of an existing contract, the company preparing the analysis or any of its affiliated companies, have managed
investment banking services for the analysed company within the last twelve months, out of which a service or the promise of
a has service emerged.
-5- The company preparing the analysis and the analysed company came to an agreement regarding the preparation of the
financial analysis.
-6- The company preparing the analysis or any of its affiliated companies regularly trade in shares or derivatives of the analysed
company.
-7- The company preparing the analysis as well as its affiliated companies and employees have other important interests in
relation to the analysed company, such as, for example, the exercising of mandates at analysed companies.
Company Disclosure Link to the historical price targets and rating changes (last 12 months) Data Modul 3, 5, 6 http://www.mmwarburg.com/disclaimer/disclaimer_en/DE0005498901.htm
Data Modul
CO M M E N T Publ ished 03 .02 .2015 11
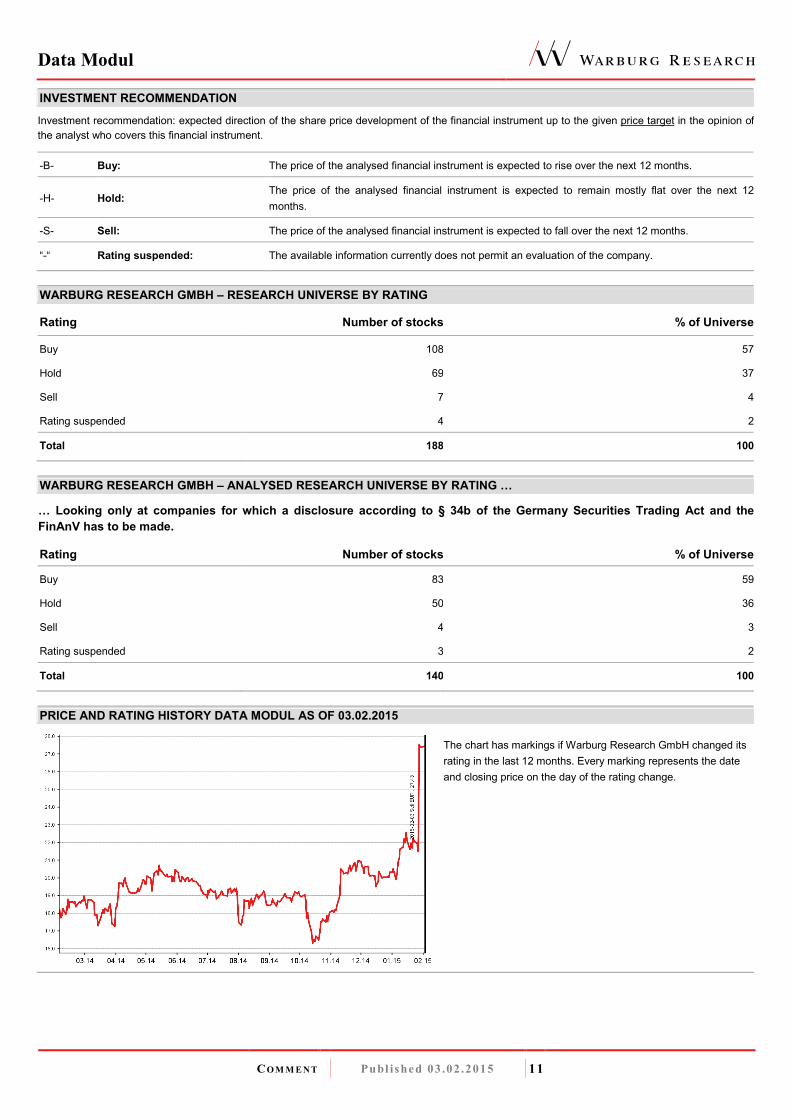
INVESTMENT RECOMMENDATION
Investment recommendation: expected direction of the share price development of the financial instrument up to the given price target in the opinion of
the analyst who covers this financial instrument.
-B- Buy: The price of the analysed financial instrument is expected to rise over the next 12 months.
-H- Hold: The price of the analysed financial instrument is expected to remain mostly flat over the next 12
months.
-S- Sell: The price of the analysed financial instrument is expected to fall over the next 12 months.
“-“ Rating suspended: The available information currently does not permit an evaluation of the company.
WARBURG RESEARCH GMBH – RESEARCH UNIVERSE BY RATING
Rating Number of stocks % of Universe
Buy 108 57
Hold 69 37
Sell 7 4
Rating suspended 4 2
Total 188 100
WARBURG RESEARCH GMBH – ANALYSED RESEARCH UNIVERSE BY RATING …
… Looking only at companies for which a disclosure according to § 34b of the Germany Securities Trading Act and the FinAnV has to be made.
Rating Number of stocks % of Universe
Buy 83 59
Hold 50 36
Sell 4 3
Rating suspended 3 2
Total 140 100
PRICE AND RATING HISTORY DATA MODUL AS OF 03.02.2015
The chart has markings if Warburg Research GmbH changed its
rating in the last 12 months. Every marking represents the date
and closing price on the day of the rating change.
Data Modul
CO M M E N T Publ ished 03 .02 .2015 12
EQUITIES Roland Rapelius +49 40 3282-2673 Head of Equities [email protected] RESEARCH Henner Rüschmeier +49 40 309537-270 Malte Räther +49 40 309537-185 Head of Research [email protected] Technology, Telco, Internet [email protected]
Christian Cohrs +49 40 309537-175 Jochen Reichert +49 40 309537-130 Engineering, Logistics [email protected] Telco, Internet, Media [email protected]
Felix Ellmann +49 40 309537-120 Christopher Rodler +49 40 309537-290 Software, IT [email protected] Utilities [email protected]
Jörg Philipp Frey +49 40 309537-258 Arash Roshan Zamir +49 40 309537-155 Retail, Consumer Goods [email protected] Engineering, Logistics [email protected]
Harald Hof +49 40 309537-125 Malte Schaumann +49 40 309537-170 Medtech [email protected] Technology [email protected]
Ulrich Huwald +49 40 309537-255 Oliver Schwarz +49 40 309537-250 Health Care, Pharma [email protected] Chemicals, Agriculture [email protected]
Thilo Kleibauer +49 40 309537-257 Marc-René Tonn +49 40 309537-259 Retail, Consumer Goods [email protected] Automobiles, Car Suppliers [email protected]
Eggert Kuls +49 40 309537-256 Björn Voss +49 40 309537-254 Engineering [email protected] Steel, Car Suppliers [email protected]
Frank Laser +49 40 309537-235 Andreas Wolf +49 40 309537-140 Construction, Industrials [email protected] Software, IT [email protected]
Andreas Pläsier +49 40 309537-246 Stephan Wulf +49 40 309537-150 Banks, Financial Services [email protected] Utilities [email protected] INSTITUTIONAL EQUITY SALES Holger Nass +49 40 3282-2669 Ömer Güven +49 40 3282-2633 Head of Equity Sales, USA [email protected] USA, Germany [email protected]
Klaus Schilling +49 40 3282-2664 Michael Kriszun +49 40 3282-2695 Dep. Head of Equity Sales, GER [email protected] United Kingdom [email protected]
Christian Alisch +49 40 3282-2667 Marc Niemann +49 40 3282-2660 Scandinavia, Spain [email protected] Germany [email protected]
Tim Beckmann +49 40 3282-2665 Sanjay Oberoi +49 69 5050-7410 United Kingdom [email protected] United Kingdom [email protected]
Matthias Fritsch +49 40 3282-2696 Philipp Stumpfegger +49 40 3282-2635 United Kingdom [email protected] Australia, United Kingdom [email protected]
Marie-Therese Grübner +49 40 3282-2630 Juliane Willenbruch +49 40 3282-2694 France [email protected] Roadshow/Marketing [email protected]
SALES TRADING Oliver Merckel +49 40 3282-2634 Bastian Quast +49 40 3282-2701 Head of Sales Trading [email protected] Sales Trading [email protected] Thekla Struve +49 40 3282-2668 Jörg Treptow +49 40 3262-2658 Dep. Head of Sales Trading [email protected] Sales Trading [email protected] Gudrun Bolsen +49 40 3282-2679 Jan Walter +49 40 3262-2662 Sales Trading [email protected] Sales Trading [email protected] Michael Ilgenstein +49 40 3282-2700 Sales Trading [email protected]
MACRO RESEARCH Carsten Klude +49 40 3282-2572 Dr. Christian Jasperneite +49 40 3282-2439 Macro Research [email protected] Investment Strategy [email protected] Matthias Thiel +49 40 3282-2401 Macro Research [email protected]
Our research can be found under: Warburg Research research.mmwarburg.com/en/index.html Thomson www.thomson.com Bloomberg MMWA GO Reuters www.knowledge.reuters.com FactSet www.factset.com Capital IQ www.capitaliq.com For access please contact:
Andrea Schaper +49 40 3282-2632 Kerstin Muthig +49 40 3282-2703 Sales Assistance [email protected] Sales Assistance [email protected]