Data models in geographical information system(GIS)
40
-
Upload
pramoda-raj -
Category
Education
-
view
630 -
download
1
Transcript of Data models in geographical information system(GIS)
Index Introduction Components of GIS Data types in GIS Data representation Raster data model Vector data model Differences between Raster and Vector Triangulated Irregular Network (TIN) Digital Elevation Model (DEM) Conclusion Reference
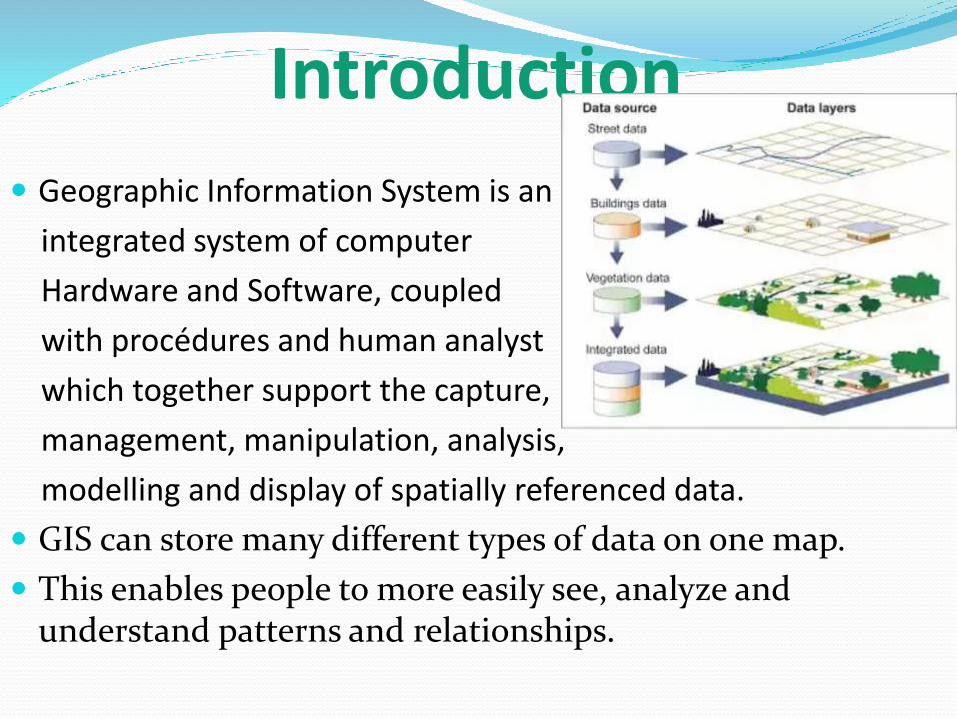
Introduction
Geographic Information System is an
integrated system of computer
Hardware and Software, coupled
with procédures and human analyst
which together support the capture,
management, manipulation, analysis,
modelling and display of spatially referenced data.
GIS can store many different types of data on one map.
This enables people to more easily see, analyze and understand patterns and relationships.
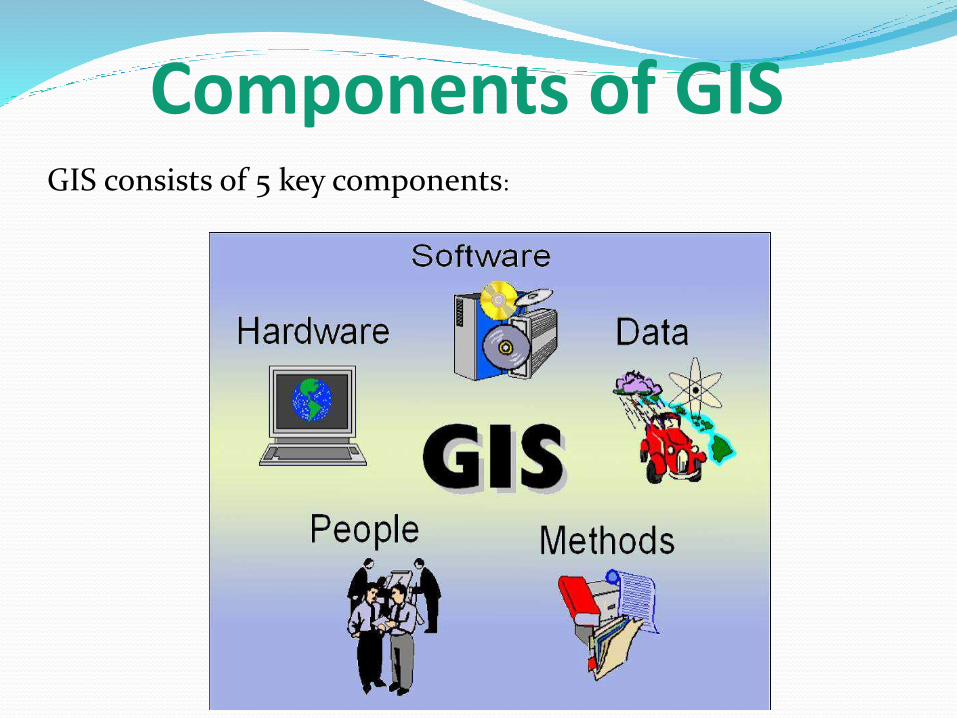
Components of GISGIS consists of 5 key components:

Hardware: it consists of a computer system on which the GIS software will run.
Software: GIS software provides the functions and tools needed to store, analyze, and display geographic information.
People: GIS users range from technical specialists who design and maintain the system to those who use it to help them perform their everyday work.
Method: a successful GIS operates according to a well-designed plan and business rules, which are the models and operating practices unique to each organizations.
Data: Geographic data and related tabular data that can be collected in-house. Digital map forms the basic data input for GIS.

Data Types in GISThe data in a GIS can be classified into two main
categories:
1. Spatial data
Describes the absolute and relative location of geographic features.
2. Attribute data or Non-spatial data
Describes characteristics of the spatial features. These characteristics can be quantitative and/or qualitative in nature.
The Data Model
Data model is a conceptual description (mental model) of how spatial data are organized for use by the GIS.
The data model represents a set of guidelines to convert the real world (called entity) to the digitally and logically represented spatial objects consisting of the attributes and geometry.
The attributes are managed by thematic or semantic structure while the geometry is represented by geometric-topological structure.

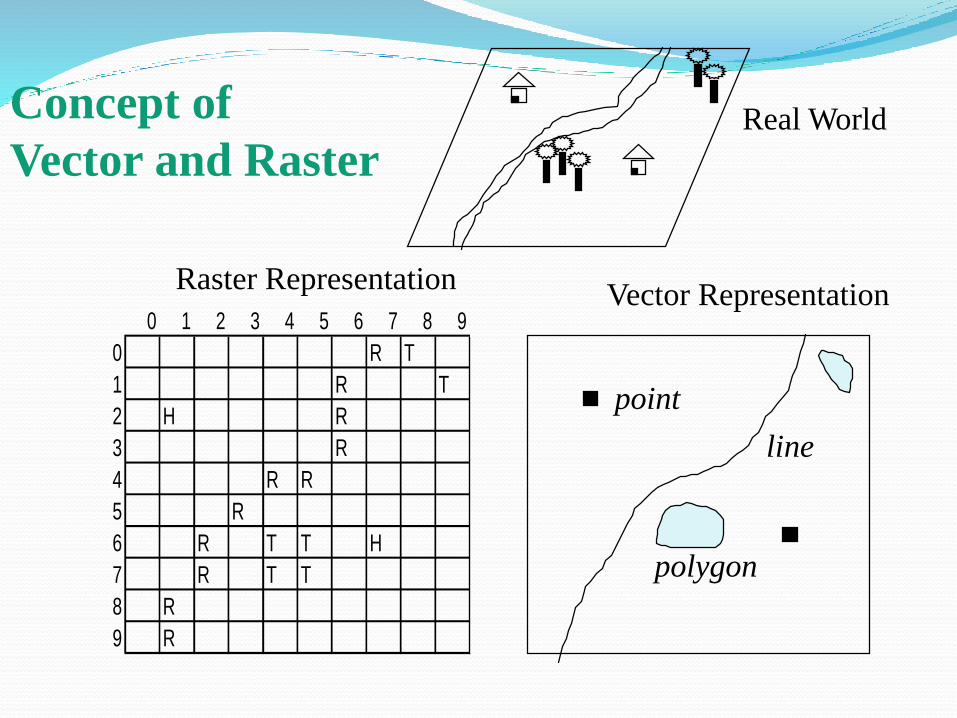
There are two major types of geometric data model ; vector and raster model.
a. Vector ModelVector model uses discrete points, lines and/or areas corresponding to discrete objects with name or code number of attributes.
b. Raster ModelRaster model uses regularly spaced grid cells in specficsequence. An element of the grid cell is called a pixel (picture cell). The conventional sequence is row by row from the left to the right and then line by line from the top to bottom. Every location is given in two dimensional image coordinates ; pixel number and line number, which contains a single value of attributes.
0 1 2 3 4 5 6 7 8 9
0 R T
1 R T
2 H R
3 R
4 R R
5 R
6 R T T H
7 R T T
8 R
9 R
Real World
Vector RepresentationRaster Representation
Concept of
Vector and Raster
line
polygon
point

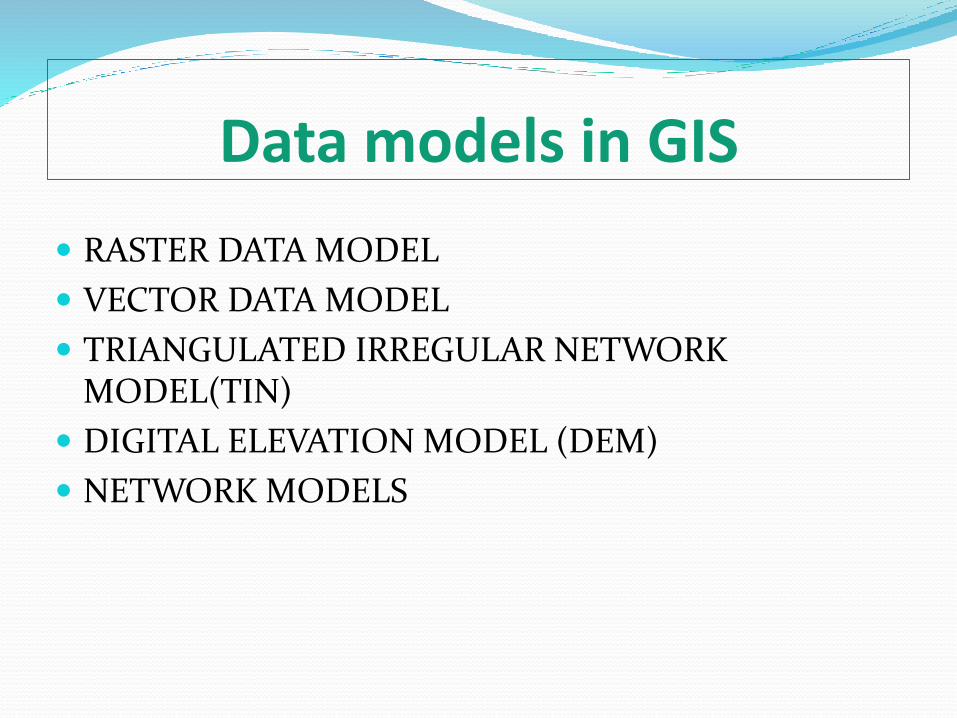
Data models in GIS
RASTER DATA MODEL
VECTOR DATA MODEL
TRIANGULATED IRREGULAR NETWORK MODEL(TIN)
DIGITAL ELEVATION MODEL (DEM)
NETWORK MODELS

Raster Data Model

The term raster implies a regularly spaced grid . Raster dataconsists of rows and columns of cells (or pixels). In this format asingle value is stored against each cell. Raster data can represent amultiplicity of things including:
• Visual images (that is colour and/or hue)
• Discrete value, such as land use
• Continuous value, such as rainfall
• Null values if no data is available.
Cell Size of Raster Data
The level of detail represented by a raster is often dependent on the cell (pixel) size or spatial resolution of the raster. The cell must be small enough to capture the required detail but large enough so computer storage and analysis can be performed efficiently.

Smaller cell size
Higher resolution
Higher feature spatial accuracy.
Slower display
Slower processing
Large file size
Larger cell size
Lower resolution
Lower feature spatial accuracy
Faster display
Faster processing
Smaller file size
Advantages of Raster It is a simple data structure.
It has the ability to represent continuous surfaces and perform surface analysis.
The ability to uniformly store points, lines, polygons and surfaces.
The ability to perform fast overlays with complex datasets.

Disadvantages of Raster There can be spatial inaccuracies due to limits
imposed by raster dataset cell dimension.
Raster datasets are potentially very large. Resolution increases as the size of cells decreases. Accordingly cost and disk space used also increases.
There is also a loss of precision that accompanies restructuring data to a regularly spaced raster cell boundary.
Vector Data Model

Vectors are graphical objects that have geometrical primitives such as points, lines and polygons to represent geographical entities in the computer graphics.
A vector refers to a geometrical space which has a precise direction, length and shape
Points, Lines and Polygons can be defined by the coordinate geometry.

A vector spatial data model uses two-dimensional Cartesian (x, y) coordinate system to store the shape of a spatial entity.

In vector world the point is the basic building block from which all spatial entities are constructed.
The simplest spatial entity, the point, is represented by a single (x, y) coordinate pair.
Line and area entities are constructed by connecting a series of points into chains and polygons.
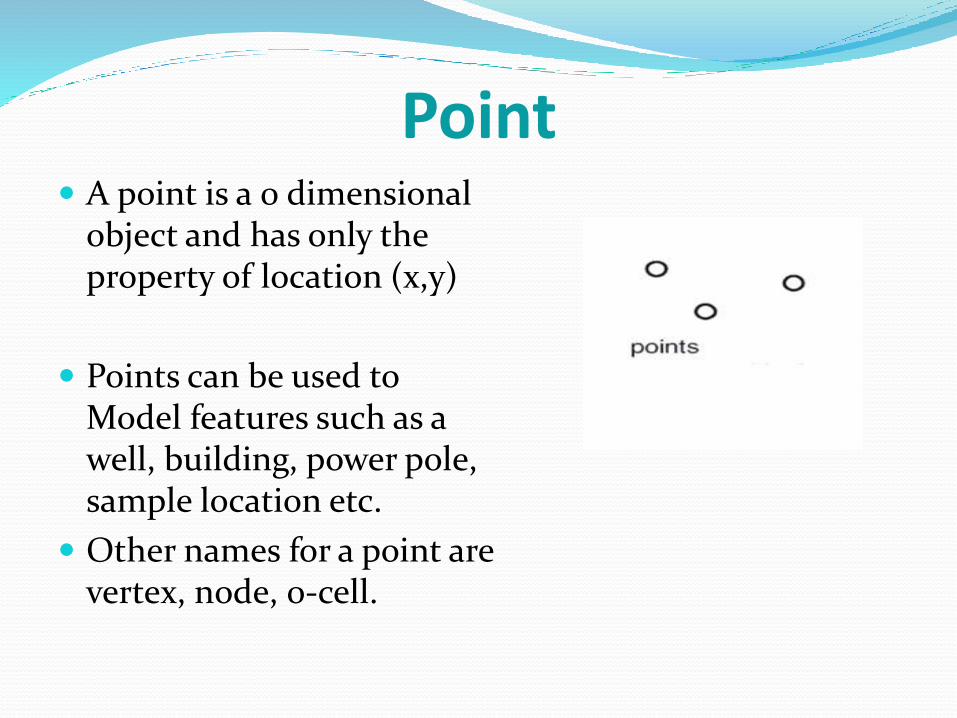
Point A point is a 0 dimensional
object and has only the property of location (x,y)
Points can be used to Model features such as a well, building, power pole, sample location etc.
Other names for a point are vertex, node, 0-cell.

Line A line is a one-dimensional
object that has the property of length
Lines can be used to represent road, streams, faults, dikes, marker beds, boundary, contacts etc.
Lines are also called an edge, link, chain, arc, 1-cell
Connected multiple lines are called polylines.

Polygon Polygon features are made of
one or more lines that encloses an area.
A polygon is a two-dimensional object with properties of area and perimeter represented by a closed sequence of lines.
A polygon can represent a city, geologic formation, dike, lake, river, etc.

Advantages of Vector
• Requires less disk storage space.
• Efficient for topological relationship
• Graphical output more closely resembles hand-drawn maps.
• Easy to edit
• Accurate map output
• Efficient projection transformation

Disadvantages of Vector• Complex data structure.
• Less compatibility with remotely sensed data.
• Expensive software and hardware.
• Not appropriate to represent continuous data
• Overlaying multiple vector are often time consuming.

Difference between Raster and Vector
Raster Vector
It is a simple data structure.
Overlay operations are easily and efficiently implemented.
High spatial variability is efficiently represented in a raster format.
The raster format is more or less required for efficient manipulation and enhancement of digital images.
More complex data structure.
Overlay operations are more difficult to implement.
The representation of high spatial variability is inefficient.
Manipulation and enhancement of digital images cannot be effectively done in the vector domain.
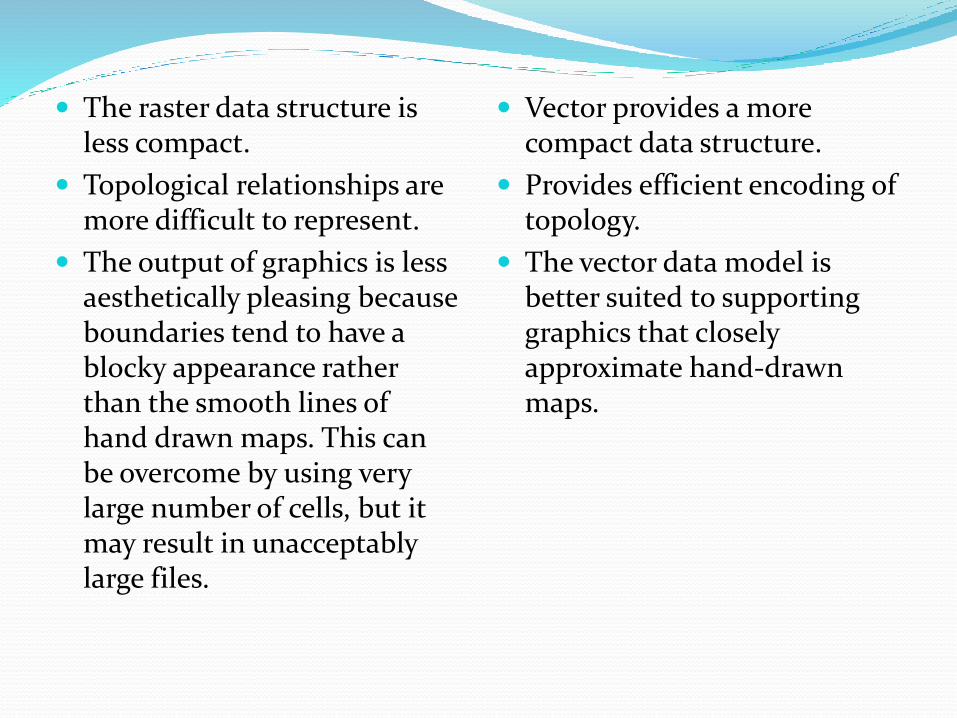
The raster data structure is less compact.
Topological relationships are more difficult to represent.
The output of graphics is less aesthetically pleasing because boundaries tend to have a blocky appearance rather than the smooth lines of hand drawn maps. This can be overcome by using very large number of cells, but it may result in unacceptably large files.
Vector provides a more compact data structure.
Provides efficient encoding of topology.
The vector data model is better suited to supporting graphics that closely approximate hand-drawn maps.
Triangulated Irregular Network

What is a TIN?
TIN stands for Triangular Irregular Network, which is a vector approach to handling a digital elevation model. TIN’s are used to interpolate surfaces using multiple triangles.
TIN’s are able to interpolate surfaces by selecting representative points that are usually data points. TIN’s connect these points to form a set of continuous and connected triangles. The data points consist of X, Y and Z values. The final result gives users a TIN surface.


Advantages of TIN TIN’s give researchers the ability to view 2.5D and 3D
at an area that was interpolated from minimal data collection.
Users can describe a surface at different levels of resolution based on the points that were collected.
TIN interpolation gives GIS users greater analytical capabilities. TIN models are easy to create and use.
They provide users a simplified model that represents collected data points.
Using a TIN surface in conjunction with ArcMapextensions such as Spatial Analysis and 3D Analyst, TIN users can also derive slope, aspect, elevation, contour lines, hillshades, etc.
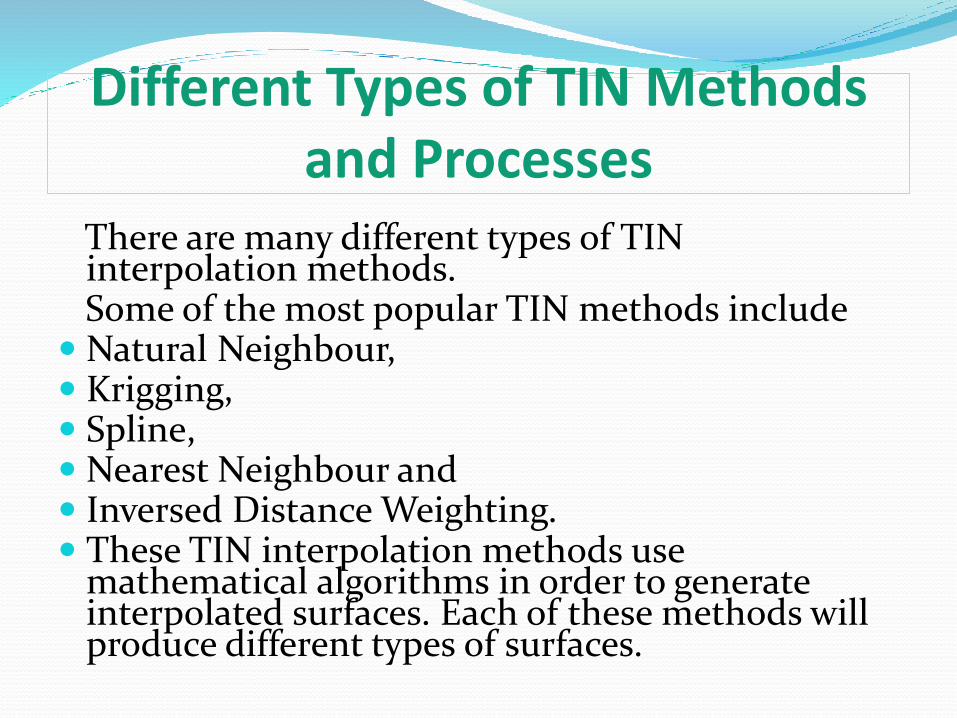
Different Types of TIN Methods and Processes
There are many different types of TIN interpolation methods. Some of the most popular TIN methods include
Natural Neighbour, Krigging, Spline, Nearest Neighbour and Inversed Distance Weighting. These TIN interpolation methods use
mathematical algorithms in order to generate interpolated surfaces. Each of these methods will produce different types of surfaces.
Digital Elevation Model (DEM)

DEM
Digital Elevation Model is a data model which represents the surface of a terrain in 3 dimension.
DEM can be represented as a raster or as TIN.
The TIN DEM dataset is also referred to as a primary DEM or measured DEM.
Raster DEM is referred to as secondary DEM or computed DEM.

3D rendering of DEM of Tithonium Chasma on Mars
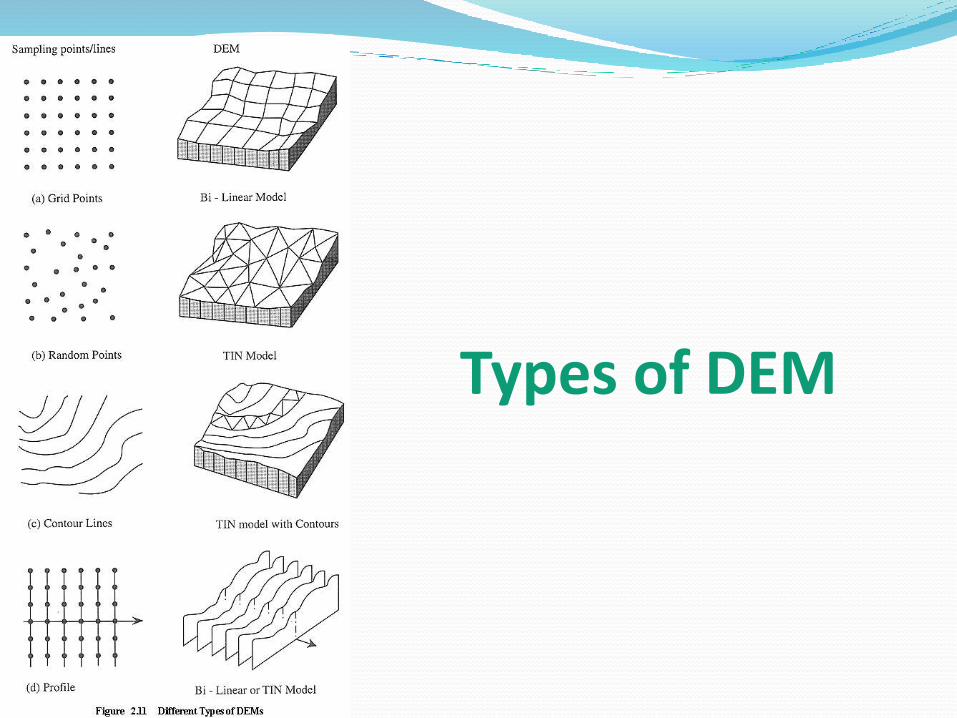
Types of DEM

Conclusion Geographic Information System is a computer system for
capturing, storing, checking, and displaying data related to positions on Earth’s surface.
A data model in GIS is a mathematical construct for representing geographic objects or surfaces as data.
The two basic data models of GIS are Raster and Vector. Otherimportant data models are TIN (Triangulated IrregularNetwork) and DEM (Digital Elevation Model).
Raster consists of matrix of cells organized into rows and coloumns where as vector represents data using points, linesand polygons. In TIN data is represented by irregular triangles. DEM can be represented as a raster or as TIN.
Reference M. Anji Reddy, Textbook of Remote Sensing And
Geographical Information System, IV edition, BS Publications, pp. 323-355.
S. Kumar, Basics of Remote Sensing and GIS, University Science Press, pp. 69-100.
http://bgis.sanbi.org/GIS-primer
www.education.nationalgeographic.org
www.wikipedia.org > Geographical Information System