Data mining Project
4
HIMANSHU AGARWAL 1207948816 IEE520 – Statistical learning for data mining FALL 2015 – Project A) INTRODUCTION: This report aims to build a classification model for the provided dataset using Weka. Since the dataset is very large, it is sensible to fit a random forest model since the random forest handles large amounts of dataset with a very high accuracy. The data is preprocessed and analyzed using the random forest model. It is validated using the accuracy measure through the cross-validation method. B) REASONS FOR CHOOSING RANDOM FOREST: 1) Works efficiently on large dataset such as this. 2) Provides method of balancing error when there is an imbalance in the dataset, which is present in this dataset. 3) Unlikely to overfit the data. 4) Produces model quickly and efficiently. C) DATA PREPROCESSING: Our dataset is large consisting of 11,959 instances. But there is an imbalance in our dataset. The number of instances of class a is 4274, b is 5647, c is 2038. So preprocessing the dataset is necessary. Therefore we choose resampling. Resampling is a mathematical technique to equal the number of rows of every class so that there is no imbalance. Here we set the biastouniform criteria to 1.0. We have the option of selecting the samplesixepercent based on if we are upsampling or downsampling. Class b has highest instance. So for upsampling since class b has 5647 instances, i.e. 47% of the whole dataset, we have to set samplesizepercent to 142%. Similarly, for downsampling, we have to set samplesizepercent to 50%.
-
Upload
himanshu-agarwal -
Category
Documents
-
view
79 -
download
0
Transcript of Data mining Project

HIMANSHU AGARWAL 1207948816
IEE520 – Statistical learning for data mining
FALL 2015 – Project
A) INTRODUCTION:
This report aims to build a classification model for the provided dataset using Weka. Since the
dataset is very large, it is sensible to fit a random forest model since the random forest handles
large amounts of dataset with a very high accuracy. The data is preprocessed and analyzed using
the random forest model. It is validated using the accuracy measure through the cross-validation
method.
B) REASONS FOR CHOOSING RANDOM FOREST:
1) Works efficiently on large dataset such as this.
2) Provides method of balancing error when there is an imbalance in the dataset, which is
present in this dataset.
3) Unlikely to overfit the data.
4) Produces model quickly and efficiently.
C) DATA PREPROCESSING:
Our dataset is large consisting of 11,959 instances. But there is an imbalance in our dataset. The
number of instances of class a is 4274, b is 5647, c is 2038. So preprocessing the dataset is
necessary. Therefore we choose resampling. Resampling is a mathematical technique to equal
the number of rows of every class so that there is no imbalance.
Here we set the biastouniform criteria to 1.0.
We have the option of selecting the
samplesixepercent based on if we are
upsampling or downsampling.
Class b has highest instance. So for upsampling
since class b has 5647 instances, i.e. 47% of the
whole dataset, we have to set
samplesizepercent to 142%.
Similarly, for downsampling, we have to set
samplesizepercent to 50%.

HIMANSHU AGARWAL 1207948816
And the third setting is to leave the value at 100%. That is, it upsamples classes which are less
than 33.33% and downsamples classes which are greater than 33.33%.
D) MODEL BUILDING:
A) Data splitting:
The training data was divided into 80% and 20%. The 80% was used to train the data and
the 20% was used to test the built model from the training data.
B) Classification:
The classifier chosen was random forest.
The features that would affect the result were
numFeatures and numTrees.
There are three values for numTrees that were
tried out, 6,7,8
And two values for number of trees, 100, 250.
The data was cross-validated for 5 folds.
Figure 1: After preprocessing the data.

HIMANSHU AGARWAL 1207948816
E) RESULTS:
On training data (80%):
Num of trees Overall
accuracy
Accuracy of
‘a’
Accuracy of
‘b’
Accuracy of
‘c’
Upsampling:
(142%)
100 94.45 91.4 92.3 99.7
250 94.58 91.4 92.6 99.7
Downsampling:
(50%)
100 87.47 80.2 84.2 98
250 87.62 79.7 84.9 98.2
Mixed sampling:
(100%)
100 92.03 86.9 90.2 99.1
250 92.07 86.9 90.0 99.2
On split data (test): As is seen that upsampling gives a better overall and individual error rates
than undersampling. However, mixed sampling gives a pretty close result to upsampling and
thus it can also be considered. Upon examination on the test set, it was found that the
upsampling data with 250 as maximum number of trees gives us an overall accuracy of 84.15%
individual error rates of 75.7%, 85.9%, 96.1% for classes a,b,c respectively. This is a pretty
accurate result as the accuracy measures was best as compared when undersampling and
mixed sampling is used.
F) Training the whole set:
We used the same model which we used for training the 80% data model for training the whole
dataset.
Parameters set for training the data:
Bias: 1.0
Sampling method: Resample
Sampling- 142% (Upsampling)
HIMANSHU AGARWAL 1207948816
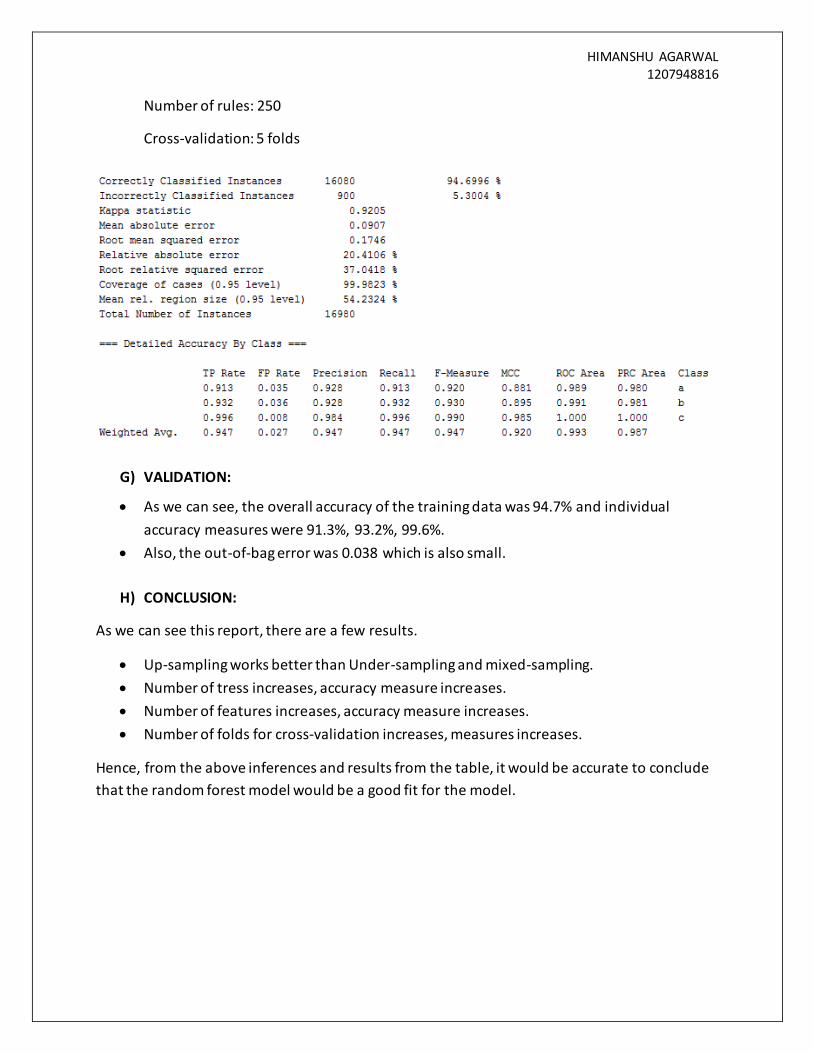
Number of rules: 250
Cross-validation: 5 folds
G) VALIDATION:
As we can see, the overall accuracy of the training data was 94.7% and individual
accuracy measures were 91.3%, 93.2%, 99.6%.
Also, the out-of-bag error was 0.038 which is also small.
H) CONCLUSION:
As we can see this report, there are a few results.
Up-sampling works better than Under-sampling and mixed-sampling.
Number of tress increases, accuracy measure increases.
Number of features increases, accuracy measure increases.
Number of folds for cross-validation increases, measures increases.
Hence, from the above inferences and results from the table, it would be accurate to conclude
that the random forest model would be a good fit for the model.