Data Mining for Knowledge Management...
26
1 Data Mining for Knowledge Management 1 Data Mining for Knowledge Management Clustering Themis Palpanas University of Trento http://disi.unitn.eu/~themis Data Mining for Knowledge Management 2 Thanks for slides to: Jiawei Han Eamonn Keogh Jeff Ullman
Transcript of Data Mining for Knowledge Management...

1
Data Mining for Knowledge Management 1
Data Mining for
Knowledge Management
Clustering
Themis Palpanas
University of Trento
http://disi.unitn.eu/~themis
Data Mining for Knowledge Management 2
Thanks for slides to:
Jiawei Han
Eamonn Keogh
Jeff Ullman

2
Data Mining for Knowledge Management 3
Roadmap
1. What is Cluster Analysis?
2. Types of Data in Cluster Analysis
3. A Categorization of Major Clustering Methods
4. Partitioning Methods
5. Hierarchical Methods
6. Density-Based Methods
7. Grid-Based Methods
8. Model-Based Methods
9. Clustering High-Dimensional Data
10. Constraint-Based Clustering
11. Summary
Data Mining for Knowledge Management 4
What is Cluster Analysis?
Cluster: a collection of data objects
Similar to one another within the same cluster
Dissimilar to the objects in other clusters
Cluster analysis
Finding similarities between data according to the characteristics
found in the data and grouping similar data objects into clusters

3
Data Mining for Knowledge Management 5
Example: Clusters
x x
x x x x
x x x x
x x x
x x
x
xx x
x x
x x x
x
x x x
x
x x
x x x x
x x x
x
x
x
Data Mining for Knowledge Management 6
Example: Clusters
x x
x x x x
x x x x
x x x
x x
x
xx x
x x
x x x
x
x x x
x
x x
x x x x
x x x
x
x
x

4
Data Mining for Knowledge Management 7
What is Cluster Analysis?
Cluster: a collection of data objects
Similar to one another within the same cluster
Dissimilar to the objects in other clusters
Cluster analysis
Finding similarities between data according to the characteristics
found in the data and grouping similar data objects into clusters
Unsupervised learning: no predefined classes
Typical applications
As a stand-alone tool to get insight into data distribution
As a preprocessing step for other algorithms
Data Mining for Knowledge Management 8
Clustering: Rich Applications and Multidisciplinary Efforts
Pattern Recognition
Spatial Data Analysis
Create thematic maps in GIS by clustering feature spaces
Detect spatial clusters or for other spatial mining tasks
Image Processing
Economic Science (especially market research)
WWW
Document classification
Cluster Weblog data to discover groups of similar access patterns
5
Data Mining for Knowledge Management 9
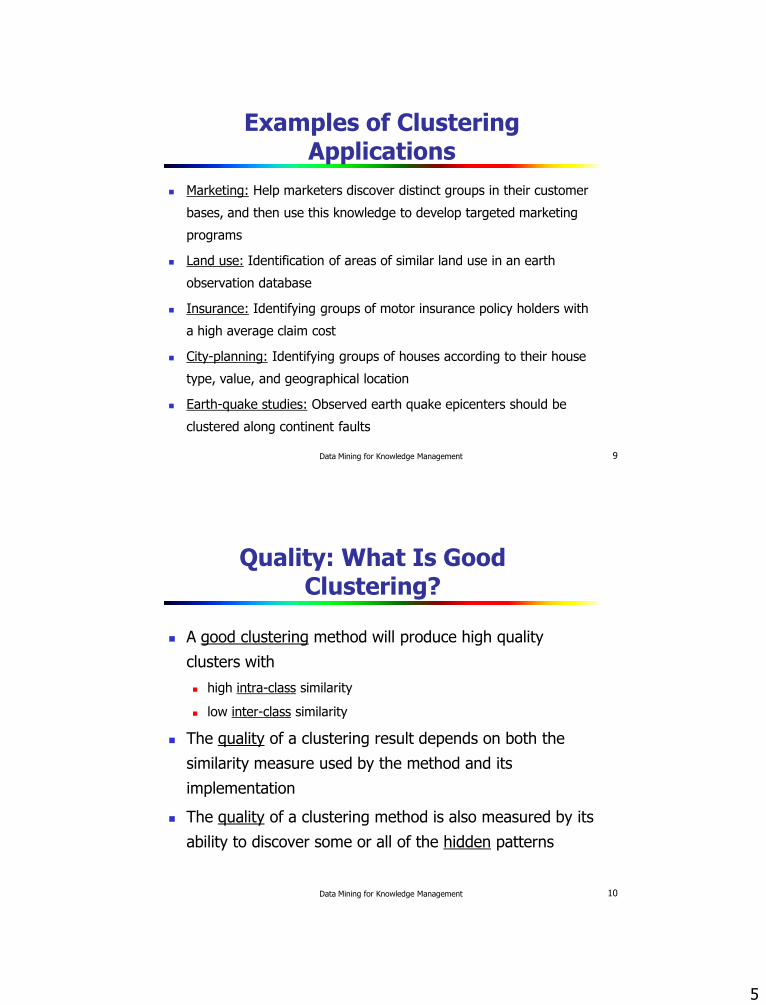
Examples of Clustering Applications
Marketing: Help marketers discover distinct groups in their customer
bases, and then use this knowledge to develop targeted marketing
programs
Land use: Identification of areas of similar land use in an earth
observation database
Insurance: Identifying groups of motor insurance policy holders with
a high average claim cost
City-planning: Identifying groups of houses according to their house
type, value, and geographical location
Earth-quake studies: Observed earth quake epicenters should be
clustered along continent faults
Data Mining for Knowledge Management 10
Quality: What Is Good Clustering?
A good clustering method will produce high quality
clusters with
high intra-class similarity
low inter-class similarity
The quality of a clustering result depends on both the
similarity measure used by the method and its
implementation
The quality of a clustering method is also measured by its
ability to discover some or all of the hidden patterns

6
Data Mining for Knowledge Management 11
Measure the Quality of Clustering
Dissimilarity/Similarity metric: Similarity is expressed in
terms of a distance function, typically metric: d(i, j)
There is a separate “quality” function that measures the
“goodness” of a cluster.
The definitions of distance functions are usually very
different for interval-scaled, boolean, categorical, ordinal
ratio, vector, and string variables.
Weights should be associated with different variables
based on applications and data semantics.
It is hard to define “similar enough” or “good enough”
the answer is typically highly subjective.
Data Mining for Knowledge Management 12
Problems With Clustering
Clustering in two dimensions looks easy.
Clustering small amounts of data looks easy.
And in most cases, looks are not deceiving.
7
Data Mining for Knowledge Management 13
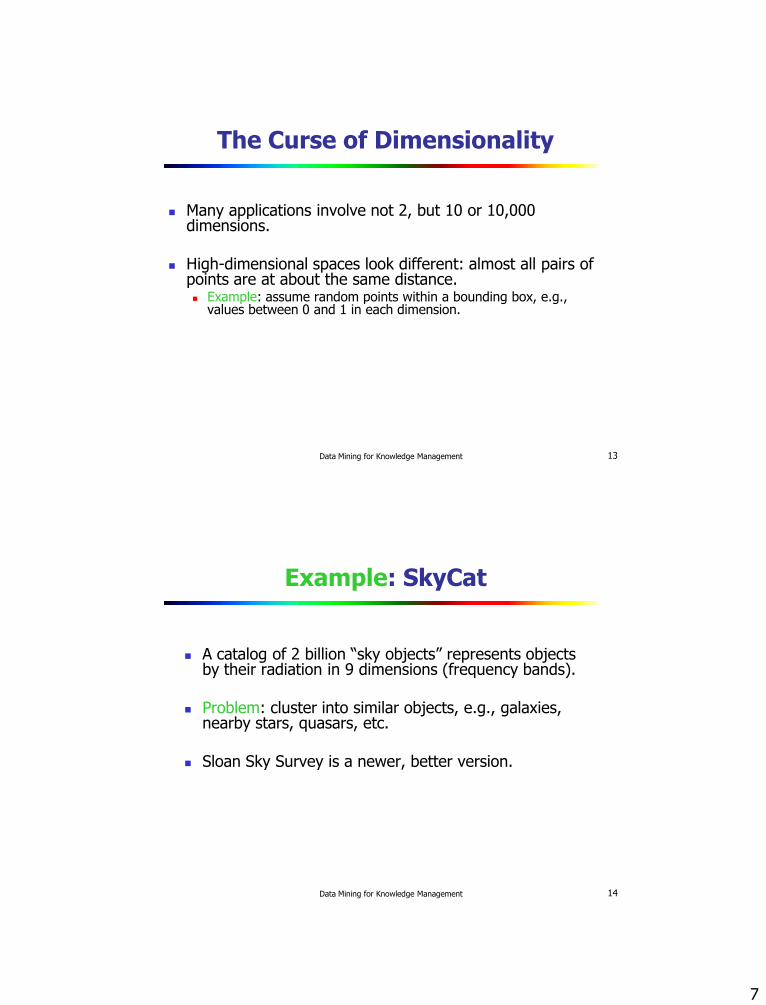
The Curse of Dimensionality
Many applications involve not 2, but 10 or 10,000 dimensions.
High-dimensional spaces look different: almost all pairs of points are at about the same distance. Example: assume random points within a bounding box, e.g.,
values between 0 and 1 in each dimension.
Data Mining for Knowledge Management 14
Example: SkyCat
A catalog of 2 billion “sky objects” represents objects by their radiation in 9 dimensions (frequency bands).
Problem: cluster into similar objects, e.g., galaxies, nearby stars, quasars, etc.
Sloan Sky Survey is a newer, better version.
8
Data Mining for Knowledge Management 15
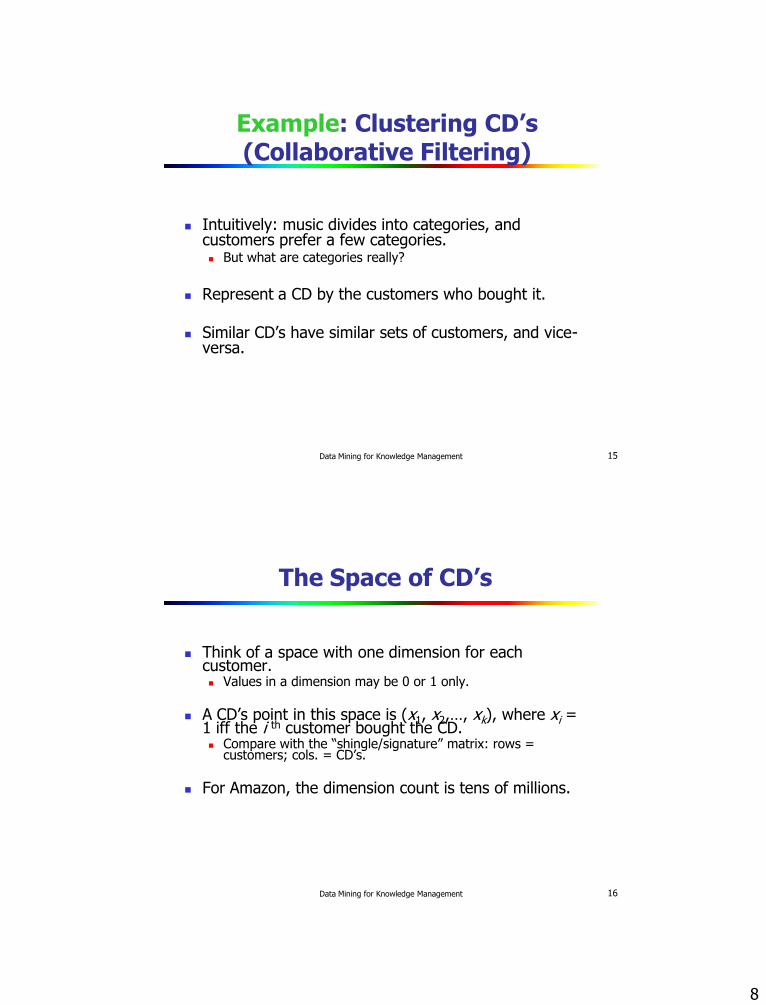
Example: Clustering CD’s (Collaborative Filtering)
Intuitively: music divides into categories, and customers prefer a few categories. But what are categories really?
Represent a CD by the customers who bought it.
Similar CD’s have similar sets of customers, and vice-versa.
Data Mining for Knowledge Management 16
The Space of CD’s
Think of a space with one dimension for each customer. Values in a dimension may be 0 or 1 only.
A CD’s point in this space is (x1, x2,…, xk), where xi = 1 iff the i th customer bought the CD. Compare with the “shingle/signature” matrix: rows =
customers; cols. = CD’s.
For Amazon, the dimension count is tens of millions.

9
Data Mining for Knowledge Management 17
Example: Clustering Documents
Represent a document by a vector (x1, x2,…, xk), where xi = 1 iff the i th word (in some order) appears in the document. It actually doesn’t matter if k is infinite; i.e., we don’t limit the set
of words.
Documents with similar sets of words may be about the same topic.
Data Mining for Knowledge Management 18
Example: Gene Sequences
Objects are sequences of {C,A,T,G}.
Distance between sequences is edit distance, the minimum number of inserts and deletes needed to turn one into the other.
Note there is a “distance,” but no convenient space in which points “live.”

10
Data Mining for Knowledge Management 19
Requirements of Clustering in Data Mining
Scalability
Ability to deal with different types of attributes
Ability to handle dynamic data
Discovery of clusters with arbitrary shape
Minimal requirements for domain knowledge to
determine input parameters
Able to deal with noise and outliers
Insensitive to order of input records
High dimensionality
Incorporation of user-specified constraints
Interpretability and usability
Data Mining for Knowledge Management 20
Roadmap
1. What is Cluster Analysis?
2. Types of Data in Cluster Analysis
3. A Categorization of Major Clustering Methods
4. Partitioning Methods
5. Hierarchical Methods
6. Density-Based Methods
7. Grid-Based Methods
8. Model-Based Methods
9. Clustering High-Dimensional Data
10. Constraint-Based Clustering
11. Summary
11
Data Mining for Knowledge Management 21
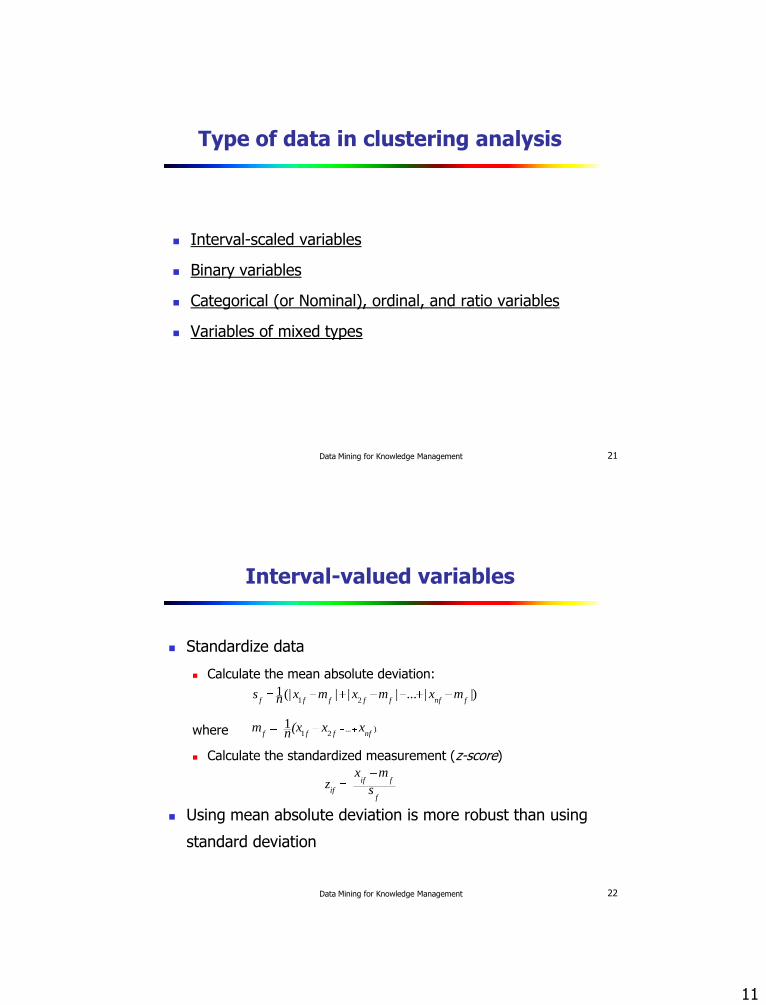
Type of data in clustering analysis
Interval-scaled variables
Binary variables
Categorical (or Nominal), ordinal, and ratio variables
Variables of mixed types
Data Mining for Knowledge Management 22
Interval-valued variables
Standardize data
Calculate the mean absolute deviation:
where
Calculate the standardized measurement (z-score)
Using mean absolute deviation is more robust than using
standard deviation
.)...21
1nffff
xx(xn m
|)|...|||(|121 fnffffff
mxmxmxns
f
fif
if s
mx z

12
Data Mining for Knowledge Management 23
Similarity and Dissimilarity Between Objects
Distances are normally used to measure the similarity or
dissimilarity between two data objects
Some popular ones include: Minkowski distance:
where i = (xi1, xi2, …, xip) and j = (xj1, xj2, …, xjp) are two p-
dimensional data objects, and q is a positive integer
Also, one can use weighted distance, parametric Pearson
product moment correlation, or other dissimilarity
measures
pp
jx
ix
jx
ix
jx
ixjid )||...|||(|),(
2211
Data Mining for Knowledge Management 24
Similarity and Dissimilarity Between Objects (Cont.)
If q = 1, d is Manhattan distance
||...||||),(2211 pp j
xi
xj
xi
xj
xi
xjid

13
Data Mining for Knowledge Management 25
Similarity and Dissimilarity Between Objects (Cont.)
Data Mining for Knowledge Management 26
Similarity and Dissimilarity Between Objects (Cont.)
If q = 1, d is Manhattan distance
If q = 2, d is Euclidean distance:
)||...|||(|),( 22
22
2
11 pp jx
ix
jx
ix
jx
ixjid
||...||||),(2211 pp j
xi
xj
xi
xj
xi
xjid
14
Data Mining for Knowledge Management 27
Metric Distances
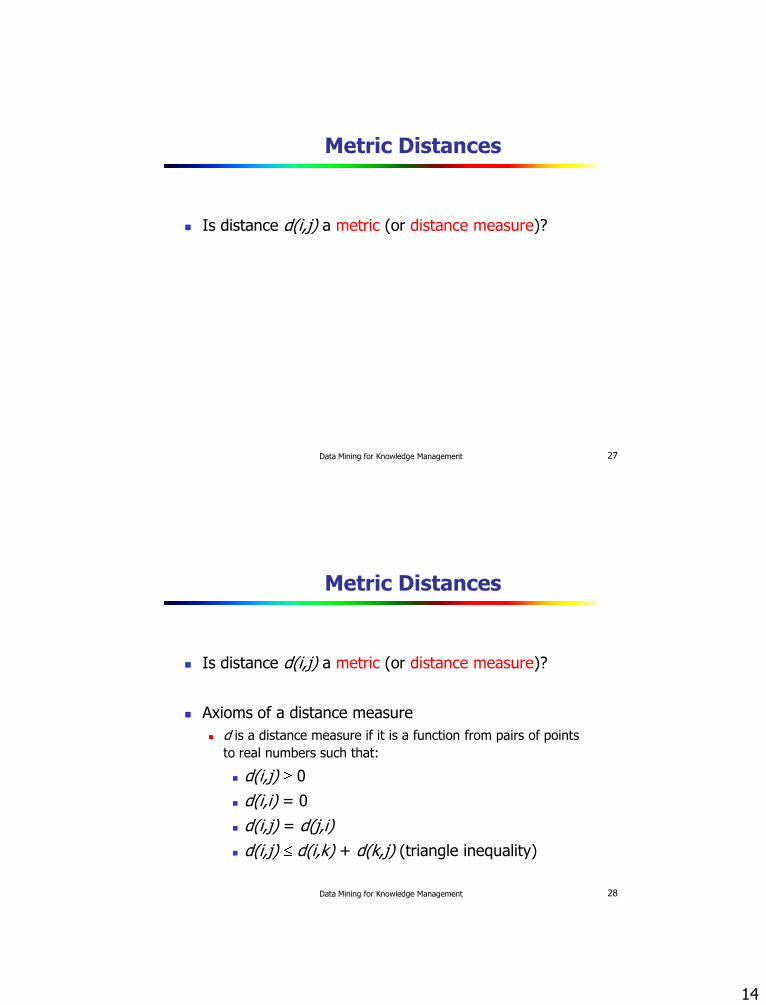
Is distance d(i,j) a metric (or distance measure)?
Data Mining for Knowledge Management 28
Metric Distances
Is distance d(i,j) a metric (or distance measure)?
Axioms of a distance measure
d is a distance measure if it is a function from pairs of points
to real numbers such that:
d(i,j) 0
d(i,i) = 0
d(i,j) = d(j,i)
d(i,j) d(i,k) + d(k,j) (triangle inequality)
15
Data Mining for Knowledge Management 29
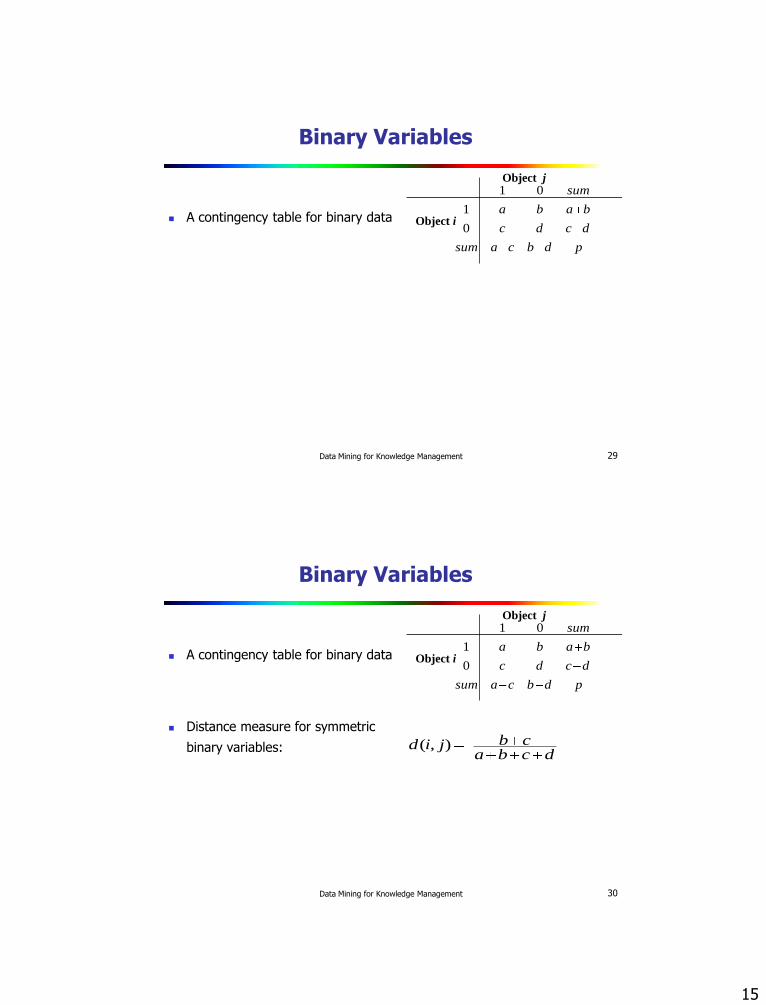
Binary Variables
A contingency table for binary data
pdbcasum
dcdc
baba
sum
0
1
01
Object i
Object j
Data Mining for Knowledge Management 30
Binary Variables
A contingency table for binary data
Distance measure for symmetric
binary variables: dcba
cb jid ),(
pdbcasum
dcdc
baba
sum
0
1
01
Object i
Object j
16
Data Mining for Knowledge Management 31
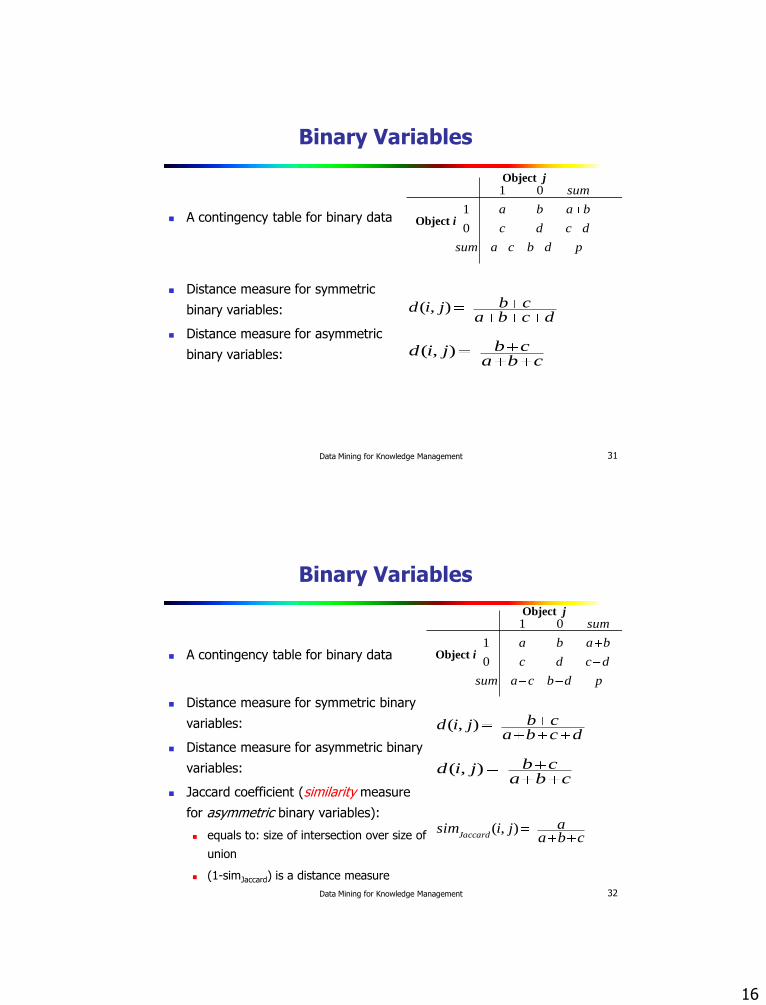
Binary Variables
A contingency table for binary data
Distance measure for symmetric
binary variables:
Distance measure for asymmetric
binary variables:
dcbacb jid ),(
cbacb jid ),(
pdbcasum
dcdc
baba
sum
0
1
01
Object i
Object j
Data Mining for Knowledge Management 32
Binary Variables
A contingency table for binary data
Distance measure for symmetric binary
variables:
Distance measure for asymmetric binary
variables:
Jaccard coefficient (similarity measure
for asymmetric binary variables):
equals to: size of intersection over size of
union
(1-simJaccard) is a distance measure
dcbacb jid ),(
cbacb jid ),(
pdbcasum
dcdc
baba
sum
0
1
01
Object i
Object j
cbaa jisim
Jaccard),(

17
Data Mining for Knowledge Management 33
Dissimilarity between Binary Variables
Example
gender is a symmetric attribute the remaining attributes are asymmetric binary let the values Y and P be set to 1, and the value N be set to 0
then, if we only take into account the asymmetric variables:
Name Gender Fever Cough Test-1 Test-2 Test-3 Test-4
Jack M Y N P N N N
Mary F Y N P N P N
Jim M Y P N N N N
75.0211
21),(
67.0111
11),(
33.0102
10),(
maryjimd
jimjackd
maryjackd
Data Mining for Knowledge Management 34
Categorical (Nominal) Variables
A generalization of the binary variable in that it can take
more than 2 states, e.g., red, yellow, blue, green
Method 1: Simple matching
m: # of matches, p: total # of variables
Method 2: use a large number of binary variables
creating a new binary variable for each of the M nominal states
pmp
jid ),(

18
Data Mining for Knowledge Management 35
Ordinal Variables
An ordinal variable can be discrete or continuous
Order is important, e.g., rank
Can be treated like interval-scaled
replace xif by their rank
map the range of each variable onto [0, 1] by replacing i-th object
in the f-th variable by
compute the dissimilarity using methods for interval-scaled
variables
1
1
f
if
if M
rz
},...,1{fif
Mr
Data Mining for Knowledge Management 36
Ratio-Scaled Variables
Ratio-scaled variable: a positive measurement on a
nonlinear scale, approximately at exponential scale,
such as AeBt or Ae-Bt
Methods:
treat them like interval-scaled variables—not a good choice!
(why?—the scale can be distorted)
apply logarithmic transformation
yif = log(xif)
treat them as continuous ordinal data treat their rank as interval-
scaled

19
Data Mining for Knowledge Management 37
Variables of Mixed Types
A database may contain all the six types of variables symmetric binary, asymmetric binary, categorical, ordinal,
interval and ratio
One may use a weighted formula to combine their effects
f is binary or nominal:
dij(f) = 0 if xif = xjf , or dij
(f) = 1 otherwise f is interval-based: use the normalized distance
f is ordinal or ratio-scaled
compute ranks rif and
and treat zif as interval-scaled
)(1
)()(1),(
fij
pf
fij
fij
pf
djid
1
1
f
if
Mr
zif
Data Mining for Knowledge Management 38
Vector objects: keywords in documents, gene features in micro-
arrays, etc.
Broad applications: information retrieval, biologic taxonomy, etc.
Cosine distance
cosine distance is a distance measure
A variant: Tanimoto coefficient
expresses the ration of number of attributes shared by x and y to the
number of total attributes of x and y
Vector Objects

20
Data Mining for Knowledge Management 39
string objects: words of a document, genes, etc.
Edit distance
number of inserts and deletes to change one string into another.
edit distance is a distance measure
example:
x = abcde ; y = bcduve. Turn x into y by deleting a, then inserting u and v after d.
Edit-distance = 3.
String Objects
Data Mining for Knowledge Management 40
Roadmap
1. What is Cluster Analysis?
2. Types of Data in Cluster Analysis
3. A Categorization of Major Clustering Methods
4. Partitioning Methods
5. Hierarchical Methods
6. Density-Based Methods
7. Grid-Based Methods
8. Model-Based Methods
9. Clustering High-Dimensional Data
10. Constraint-Based Clustering
11. Summary
21
Data Mining for Knowledge Management 41
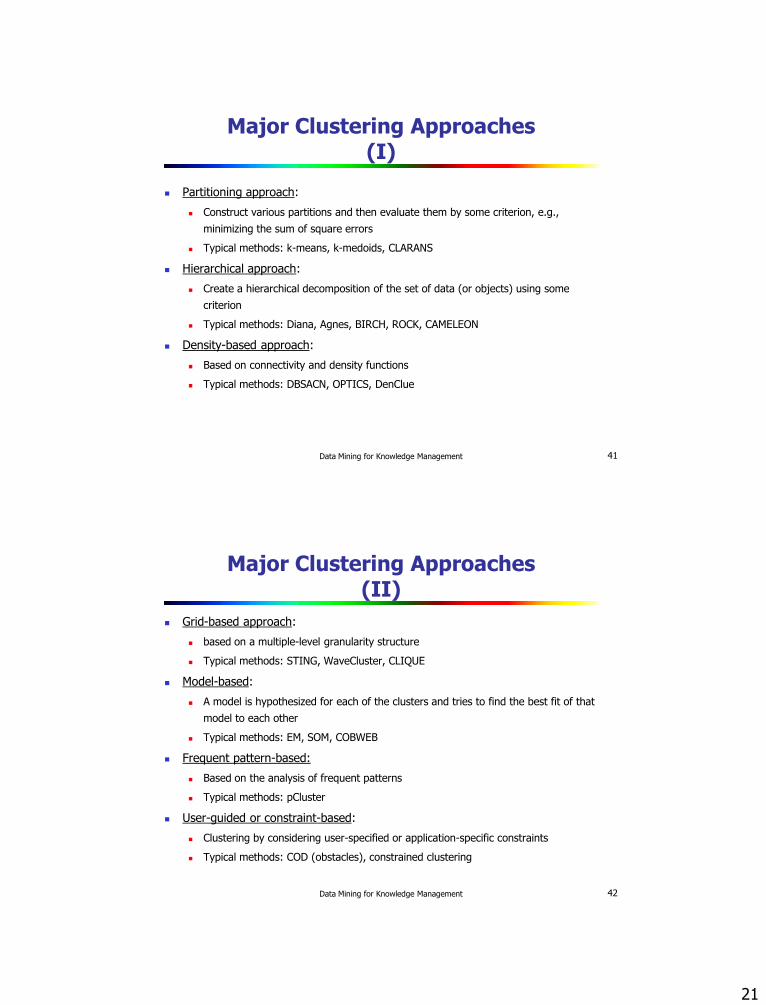
Major Clustering Approaches (I)
Partitioning approach:
Construct various partitions and then evaluate them by some criterion, e.g.,
minimizing the sum of square errors
Typical methods: k-means, k-medoids, CLARANS
Hierarchical approach:
Create a hierarchical decomposition of the set of data (or objects) using some
criterion
Typical methods: Diana, Agnes, BIRCH, ROCK, CAMELEON
Density-based approach:
Based on connectivity and density functions
Typical methods: DBSACN, OPTICS, DenClue
Data Mining for Knowledge Management 42
Major Clustering Approaches (II)
Grid-based approach:
based on a multiple-level granularity structure
Typical methods: STING, WaveCluster, CLIQUE
Model-based:
A model is hypothesized for each of the clusters and tries to find the best fit of that
model to each other
Typical methods: EM, SOM, COBWEB
Frequent pattern-based:
Based on the analysis of frequent patterns
Typical methods: pCluster
User-guided or constraint-based:
Clustering by considering user-specified or application-specific constraints
Typical methods: COD (obstacles), constrained clustering

22
Data Mining for Knowledge Management 43
Typical Alternatives to Calculate the Distance between Clusters
Single link: smallest distance between an element in one cluster
and an element in the other, i.e., dis(Ki, Kj) = min(tip, tjq)
Complete link: largest distance between an element in one cluster
and an element in the other, i.e., dis(Ki, Kj) = max(tip, tjq)
Average: avg distance between an element in one cluster and an
element in the other, i.e., dis(Ki, Kj) = avg(tip, tjq)
Centroid: distance between the centroids of two clusters, i.e.,
dis(Ki, Kj) = dis(Ci, Cj)
Medoid: distance between the medoids of two clusters, i.e., dis(Ki,
Kj) = dis(Mi, Mj)
Medoid: one chosen, centrally located object in the cluster
Data Mining for Knowledge Management 44
Centroid, Radius and Diameter of a Cluster (for numerical data sets)
Centroid: the “middle” of a cluster
Radius: square root of average distance from any point of the
cluster to its centroid
Diameter: square root of average mean squared distance between
all pairs of points in the cluster
N
tNi ip
mC)(
1
N
mcip
tNi
mR
2)(1
)1(
2)(11
NN
iqt
iptN
iNi
mD
23
Data Mining for Knowledge Management 45
Roadmap
1. What is Cluster Analysis?
2. Types of Data in Cluster Analysis
3. A Categorization of Major Clustering Methods
4. Partitioning Methods
5. Hierarchical Methods
6. Density-Based Methods
7. Grid-Based Methods
8. Model-Based Methods
9. Clustering High-Dimensional Data
10. Constraint-Based Clustering
11. Summary
Data Mining for Knowledge Management 46
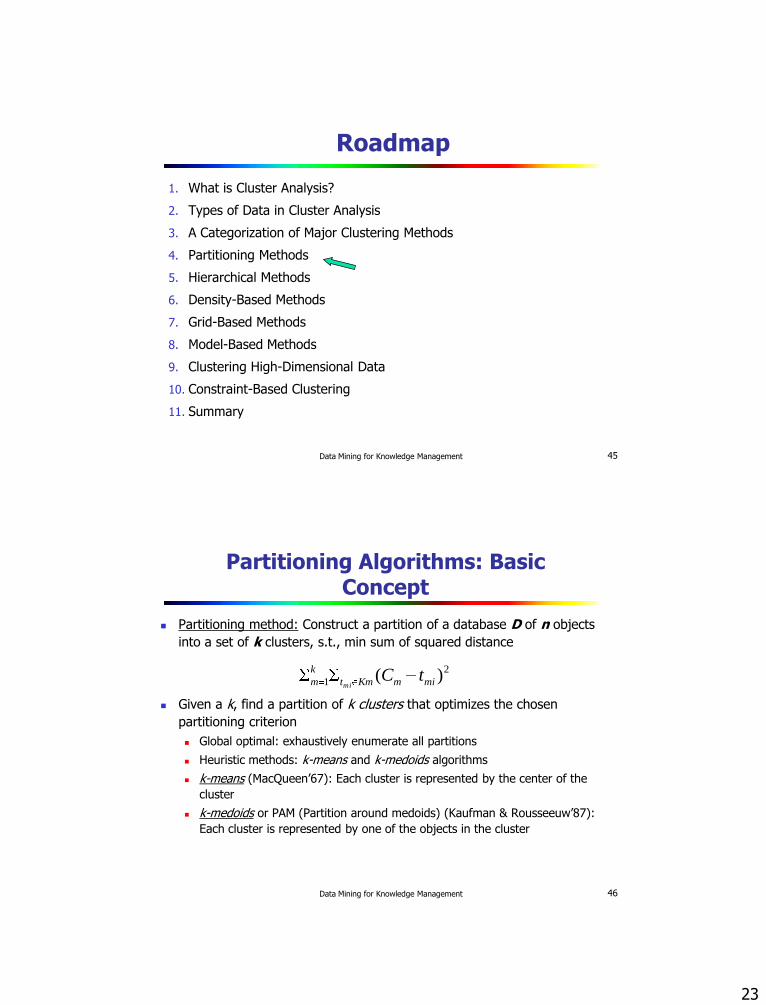
Partitioning Algorithms: Basic Concept
Partitioning method: Construct a partition of a database D of n objects
into a set of k clusters, s.t., min sum of squared distance
Given a k, find a partition of k clusters that optimizes the chosen
partitioning criterion
Global optimal: exhaustively enumerate all partitions
Heuristic methods: k-means and k-medoids algorithms
k-means (MacQueen’67): Each cluster is represented by the center of the
cluster
k-medoids or PAM (Partition around medoids) (Kaufman & Rousseeuw’87):
Each cluster is represented by one of the objects in the cluster
2
1 )( mimKmt
k
m tCmi
24
Data Mining for Knowledge Management 47
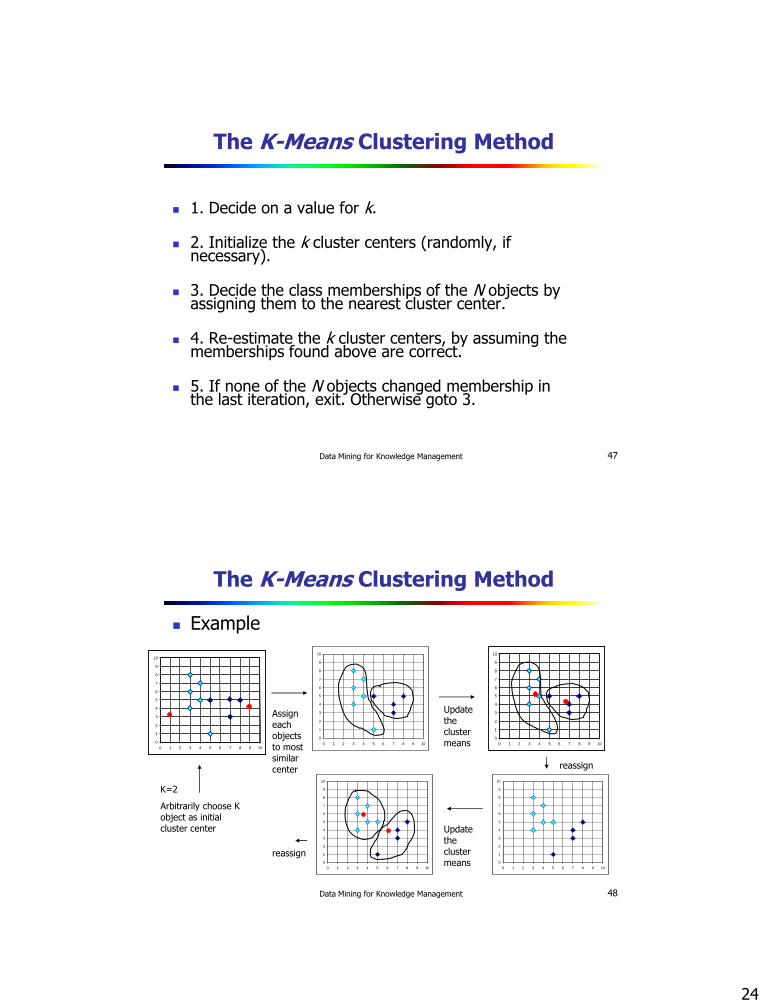
The K-Means Clustering Method
1. Decide on a value for k.
2. Initialize the k cluster centers (randomly, if necessary).
3. Decide the class memberships of the N objects by assigning them to the nearest cluster center.
4. Re-estimate the k cluster centers, by assuming the memberships found above are correct.
5. If none of the N objects changed membership in the last iteration, exit. Otherwise goto 3.
Data Mining for Knowledge Management 48
The K-Means Clustering Method
Example
0
1
2
3
4
5
6
7
8
9
10
0 1 2 3 4 5 6 7 8 9 10
0
1
2
3
4
5
6
7
8
9
10
0 1 2 3 4 5 6 7 8 9 10
0
1
2
3
4
5
6
7
8
9
10
0 1 2 3 4 5 6 7 8 9 10
0
1
2
3
4
5
6
7
8
9
10
0 1 2 3 4 5 6 7 8 9 10
0
1
2
3
4
5
6
7
8
9
10
0 1 2 3 4 5 6 7 8 9 10
K=2
Arbitrarily choose K object as initial cluster center
Assign each objects to most similar center
Update the cluster means
Update the cluster means
reassign
reassign

25
Data Mining for Knowledge Management 55
Comments on the K-Means Method
Strength: Relatively efficient: O(tkn), where n is # objects, k is #
clusters, and t is # iterations. Normally, k, t << n.
Comparing: PAM: O(k(n-k)2 ), CLARA: O(ks2 + k(n-k))
Comment: Often terminates at a local optimum. The global optimum
may be found using techniques such as: deterministic annealing and
genetic algorithms
Weakness
Applicable only when mean is defined, then what about categorical data?
Need to specify k, the number of clusters, in advance
Unable to handle noisy data and outliers
Not suitable to discover clusters with non-convex shapes
Data Mining for Knowledge Management 56
Variations of the K-Means Method
A few variants of the k-means which differ in
Selection of the initial k means
Dissimilarity calculations
Strategies to calculate cluster means
Handling categorical data: k-modes (Huang’98)
Replacing means of clusters with modes
Using new dissimilarity measures to deal with categorical objects
Using a frequency-based method to update modes of clusters
A mixture of categorical and numerical data: k-prototype method

26
Data Mining for Knowledge Management 57
What Is the Problem of the K-Means Method?
The k-means algorithm is sensitive to outliers !
Since an object with an extremely large value may substantially distort the
distribution of the data.
K-Medoids: Instead of taking the mean value of the object in a
cluster as a reference point, medoids can be used, which is the most
centrally located object in a cluster.
0
1
2
3
4
5
6
7
8
9
10
0 1 2 3 4 5 6 7 8 9 10
0
1
2
3
4
5
6
7
8
9
10
0 1 2 3 4 5 6 7 8 9 10
Data Mining for Knowledge Management 58
The K-Medoids Clustering Method
Find representative objects, called medoids, in clusters
PAM (Partitioning Around Medoids, 1987)
starts from an initial set of medoids and iteratively replaces one of the
medoids by one of the non-medoids if it improves the total distance of
the resulting clustering
PAM works effectively for small data sets, but does not scale well for
large data sets
CLARA (Kaufmann & Rousseeuw, 1990)
CLARANS (Ng & Han, 1994): Randomized sampling
Focusing + spatial data structure (Ester et al., 1995)