Data Gap Study Report - Lawrence, Kansas
56
GHD | 1801 Old Highway 8 Suite 114 St. Paul Minnesota 55112 USA | 1112345 | Report No 02 | February 24 2020 Data Gap Study Report Former Farmland Industries Nitrogen Plant 1608 North 1400 Road Lawrence, Kansas 66046 City of Lawrence, Kansas
Transcript of Data Gap Study Report - Lawrence, Kansas
GHD | 1801 Old Highway 8 Suite 114 St. Paul Minnesota 55112 USA | 1112345 | Report No 02 | February 24 2020
Data Gap Study Report Former Farmland Industries Nitrogen Plant 1608 North 1400 Road Lawrence, Kansas 66046 City of Lawrence, Kansas

GHD | Data Gap Study Report | 11152783 (02) | Page i
Table of Contents
1. Introduction ................................................................................................................................... 1
1.1 Site Background and History ............................................................................................. 1
1.2 Site Hydrogeology .............................................................................................................. 2
2. DGS Field Activities ...................................................................................................................... 2
2.1 Aquifer Testing ................................................................................................................... 3
2.1.1 Existing Alluvial Wells Aquifer Testing ............................................................. 3 2.1.2 PW-9 Aquifer Testing ....................................................................................... 4
2.2 Direct Push Field Investigation .......................................................................................... 4
2.2.1 Soil Sampling .................................................................................................... 5 2.2.2 Groundwater Sampling ..................................................................................... 5
3. DGS Sampling Results................................................................................................................. 5
3.1 Aquifer Testing Results ...................................................................................................... 6
3.1.1 October 2018 Aquifer Testing Results ............................................................. 6 3.1.2 September 2019 PW-9 Aquifer Testing Results ............................................... 6
3.2 Soil Sampling Analytical Results ....................................................................................... 7
3.2.1 Bag Warehouse Area ....................................................................................... 7 3.2.2 Western Ponds Area ........................................................................................ 8 3.2.3 Eastern Ponds Area ......................................................................................... 8
3.3 Groundwater Sampling Analytical Results ......................................................................... 8
3.3.1 Bag Warehouse Area ....................................................................................... 8 3.3.2 Western Ponds Area ........................................................................................ 9 3.3.3 Eastern Ponds Area ......................................................................................... 9 3.3.4 PSW-5B2 Area ................................................................................................. 9
4. Data Evaluation ............................................................................................................................ 9
4.1 Aquifer Testing Analysis .................................................................................................. 10
4.1.1 Groundwater Flow Velocity Analysis .............................................................. 10 4.1.2 Groundwater Capture Analysis ....................................................................... 11
4.2 Analytical Results Analysis .............................................................................................. 11
4.2.1 Soil .................................................................................................................. 11 4.2.2 Groundwater ................................................................................................... 12
4.3 Updated Conceptual Site Model ...................................................................................... 13
4.3.1 Sandstone Hill Area ........................................................................................ 13 4.3.2 Central Ponds Area ........................................................................................ 14 4.3.3 Western Ponds Area ...................................................................................... 14 4.3.4 Eastern Ponds Area ....................................................................................... 14 4.3.5 Bag Warehouse Area ..................................................................................... 14 4.3.6 Plant A ............................................................................................................ 14 4.3.7 Site Groundwater ............................................................................................ 15
5. Conclusions ................................................................................................................................ 16

GHD | Data Gap Study Report | 11152783 (02) | Page ii
Figure Index Figure 1 Site Location Map
Figure 2 Site Layout – DGS Soil Boring Locations
Figure 3 Soil Sampling Results – Bag Warehouse
Figure 4 Soil Sampling Results – West Extension Pond
Figure 5 Soil Sampling Results – East and West Lime Ponds
Figure 6 Groundwater Sampling Results – Bag Warehouse
Figure 7 Groundwater Sampling Results – West Extension Pond
Figure 8 Groundwater Sampling Results – East and West Lime Ponds
Figure 9 Groundwater Sampling Results – PSW-5A
Table Index Table 1 Aquifer Testing Summary
Table 2 Soil Sampling Summary
Table 3 Groundwater Sampling Summary
Table 4 Soil Analytical Results Summary
Table 5 Groundwater Analytical Results Summary
Appendix Index Appendix A Stratigraphic Logs for Extraction Wells PSW-3B3, PSW-6B4, and PSW-7B2
Appendix B Stratigraphic Logs for Data Gap Study Soil Borings
Appendix C Field Documentation
Appendix D AQTESOLVTM Analyses
Appendix E Data Validation Memo and Pace Analytical Laboratory Reports
Appendix F City of Lawrence Laboratory Reports

GHD | Data Gap Study Report | 11152783 (02) | Page 1
1. Introduction
GHD Services Inc. (GHD) prepared this Data Gap Study (DGS) Report on behalf of the City of Lawrence (the City). The Data Study Gap (DGS) Report presents the results of the investigation that GHD conducted at the Former Farmland Industries, Inc. (FII) Nitrogen Plant (Site), located at 1608 N 1400 Road, Lawrence, Kansas. The investigation focused on addressing the data gaps identified by GHD in the 2018 Data Gap Study Work Plan, which recommended additional aquifer testing, downgradient groundwater characterization, and additional potential source characterization in the Eastern and Western Ponds Area. This additional study was necessary to update Site conditions and prepare an updated Conceptual Site Model (CSM).
The DGS investigation was conducted in accordance with the procedures and protocols presented in the 2018 Data Gap Study Work Plan, dated November 16, 2018. Under the Data Gap Study Work Plan, GHD:
i. Performed aquifer tests on the four existing alluvial extraction wells (PW-9, PSW-3B3, PSW-6B4, and PSW-7B2).
ii. Performed a more comprehensive aquifer test on the PW-9 extraction system separate from the combine extraction system to define the hydraulic characteristics of the alluvial aquifer and calculate an appropriate pumping rate to establish hydraulic containment.
iii. Collected soil and groundwater samples from the areas surrounding the Bag Warehouse, the West Extension Pond, PSW-5B2, the West Lime Pond, the Rundown Pond, and the East Lime Pond for nitrogen mass characterization and downgradient migration.
Section 2 describes the DGS field activities. Section 3 presents the analytical results. Section 4 provides the data analysis. Section 5 provides conclusions.
1.1 Site Background and History
The FII Nitrogen Plant was a nitrogen fertilizer manufacturing plant located on the east side of Lawrence, Kansas, between E 1500 Road and Highway 10 (Figure 1). The products manufactured at this plant were anhydrous ammonia, nitric acid, urea liquid, ammonium nitrate liquid, and urea/ammonium nitrate (UAN) solution. On April 30, 2004, FII ceased to exist due to bankruptcy. Following approval of FII’s’ Plan of Reorganization by the Bankruptcy Court and concurrence from the United States Environmental Protection Agency (USEPA) and the Kansas Department of Health and Environment (KDHE), the FII Kansas Remediation Trust (Trust) was formed and funded to address the remaining environmental impairments at the Site. In 2006, the Trust was funded to facilitate the sale and manage the administrative activities of the Site.
The Trust, through SELS Administrative Services, LLC as Trustee, managed the environmental and administrative functions of the Site. The Trust retained Shaw Environmental and Infrastructure, Inc. (Shaw) to help manage the mandated compliance and cleanup of the Site in close cooperation and supervision with the KDHE and the USEPA.
On September 29, 2010, ownership of the Former Farmland Nitrogen Plant was transferred to the City. As part of the ownership transfer, the City entered into a consent agreement with KDHE

GHD | Data Gap Study Report | 11152783 (02) | Page 2
(Consent Order No. 10-E-94 BER) to accept responsibility for the environmental remediation and management of the Site. The current hydraulic control strategy of nitrogen in the alluvial aquifer follows the requirements of the KDHE-issued Corrective Action Decision (dated March 2010).
1.2 Site Hydrogeology
The FII Site is comprised of the following hydrostratigraphic (i.e., water bearing) units:
• Newman Terrace Deposits
• Kansas River Alluvial Deposits
• Tonganoxie Sandstone
• Weston Shale
The Newman Terrace Deposits consists of silty clay of low permeability and varies in thickness between 0 and 45 feet. The terrace deposits are partially saturated and exist under unconfined conditions and is considered an aquitard. The groundwater in the terrace can exist under perched conditions that is hydraulically separate from the regional groundwater system. The terrace deposits occur along the northern portion of the Site in the area of the process ponds. The terrace deposits can overlie the sandstone along its southern extent, but it typically overlies the Kansas River Alluvial deposits.
The Kansas River Alluvial Deposits are predominantly sand with interbedded units of sandy clay and gravel. The alluvial deposits vary in thickness from 0 to 30 feet at the Site, but increase in thickness north of the Site towards the Kansas River. The alluvial deposits are classified as an aquifer because of its permeability and exists under unconfined or semi-confined conditions. The alluvial deposits are found along the northern portion of the Site along Sandstone Hill and portions of the process ponds. Groundwater flow in the alluvial deposit is towards the north-northeast to the Kansas River.
Tonganoxie Sandstone is an interbedded sandstone that consists of sandstone, shale and limestone. The sandstone represents a prominent topographic high feature known as Sandstone Hill (see Figure 2) where several nitrogen processes occurred. The sandstone is partially saturated and can exist under unconfined or confined conditions. Given its interbedded nature, the permeability is variable with the interbedded shale units acting as aquitards. Groundwater flow is radially from the Sandstone Hill and controlled by fractures. On the north end of the Site, the sandstone groundwater discharges into the alluvial aquifer, which abuts up against the sandstone.
The Weston Shale represents the basal confining unit for the Site. The shale is an aquitard and prohibits downward migration from the overlying alluvial and sandstone groundwater systems.
2. DGS Field Activities
GHD conducted the following activities to further investigate the identified data gaps:
• Performed aquifer tests on the four existing alluvial extraction wells (PW-9, PSW-3B3, PSW-6B4, and PSW-7B2) to help in calculation of the alluvial aquifer properties and update hydraulic capture estimates.

GHD | Data Gap Study Report | 11152783 (02) | Page 3
• Performed additional aquifer testing on PW-9 to better characterize the alluvial aquifer’s hydraulic characteristics to determine the hydraulic capture estimate in the PW-9 area.
• Advanced 17 direct push probe borings in the area surrounding the Bag Warehouse for soil sampling and groundwater vertical aquifer profiling (VAP) sampling.
• Advanced 12 direct push probe borings in the area surrounding the West Extension Pond for soil sampling and groundwater VAP sampling.
• Advanced 10 direct push probe borings in the area surrounding the Eastern Ponds (West Lime Pond, Rundown Pond, Overflow Pond, and East Lime Pond) and for soil sampling and groundwater VAP sampling.
• Advanced 10 direct push probe borings in the area surrounding PSW-5B2 for groundwater VAP sampling.
During the DGS work planning and field implementation phase, sampling soil and groundwater within the Overflow Pond was inaccessible. The Site layout and the direct push boring locations are shown on Figure 2.
2.1 Aquifer Testing
2.1.1 Existing Alluvial Wells Aquifer Testing
Aquifer testing was conducted October 5 through October 8, 2018 on each of the four alluvial extraction wells: PW-9, PSW-3B3, PSW-6B4, and PSW-7B2. Extraction well logs are presented in Appendix A, with the exception of PW-9 which is not available. This approach analyzed the PW-9 extraction system separately from the combined extraction system (PSW-3B3, PSW-6B4, and PSW-7B2). These two systems are approximately 2,000 feet apart and act as independent extraction systems. The two tests involved installing water level transducers in select monitoring wells and the extraction wells, turning off the pumps in all of the extraction wells, and then monitoring groundwater recovery for approximately 24 hours. After 24 hours, the pumps were turned back on. For the combined extraction system, the pumping wells were turned on individually to evaluate the additive effects of these pumping wells with PSW-3B3 followed by PSW-6B4 (after 6 hours) and PSW-7B2 (after 32 hours) and then monitoring drawdown for approximately 24 hours. At PW-9, drawdown was monitored approximately 60 hours at the combined extraction system. To reflect the current operating conditions of the systems, all pumps were allowed to operate with throttling valves fully open at their maximum and constant pumping rate during aquifer testing.
Besides the extraction wells, electronic pressure transducers with data loggers were deployed at selected surrounding monitoring wells (PW-8, PSW-19B, PSW-20B, and SW-10) for the PW-9 test, and at PSW5B2 and PSW-6A for the combined extraction well tests to monitor the hydraulic response during recovery and pumping. Transducers recorded pressure head measurements at 30-second intervals. A barometer data logger was deployed at the SW-10 location to measure background barometric atmospheric pressure changes. Water levels and total well depths were manually measured and recorded to within one hundredth of a foot before transducers were deployed in the wells. A summary of the aquifer testing is provided in Table 1. Following the testing, the transducer data were downloaded and compensated for barometric changes that occurred during the tests. Depending on the hydraulic response and data plots, the water level data were

GHD | Data Gap Study Report | 11152783 (02) | Page 4
analyzed using the software AQTESOLVTM (Duffield, 2007)1. Groundwater analytical solutions were selected based on the aquifer characteristics and data plots to estimate the hydraulic properties of the alluvial aquifer, which are discussed further in Section 3.1.
2.1.2 PW-9 Aquifer Testing
The PW-9 aquifer test during October 2018 achieved a maximum constant pumping rate of approximately 13 gallons per minute (gpm). This pumping rate depressed the water table less than one foot and yielded insufficient data for a meaningful aquifer analysis. It was determined that additional aquifer testing was necessary at PW-9 using a much higher pumping rate. After upgrading the piping, pump, and electrical power supply at PW-9, additional aquifer testing was completed during the week of September 2, 2019.
Prior to the aquifer test, the City video-logged PW-9 on May 2, 2019. There is no well construction log for PW-9. Hence, the video-log determined the total well depth, well screen location, and the quality of the well screen.
The second round of aquifer testing at PW-9 occurred after the installation of a new pump with a flow rate capacity and pressure head capability greater than 50 gpm. Before the 24-hour aquifer test was conducted, a step test was done. The step test was a series of 1-hour tests performed at progressively higher pumping rates (e.g., 20 gpm, 30 gpm, and 40 gpm) to measure the drawdown in the pumping well and determine its specific capacity and hydraulic efficiency. Based on the results of the step test, the 24-hour aquifer test was conducted at a constant rate of 63 gpm.
Transducers were placed in select surrounding monitoring wells (PW-8, PSW-19B, PSW-20B, and SW-10) to measure the hydraulic response during pumping and subsequent recovery with the pump turned off. Transducers were programmed to measure hydraulic pressure head at 30-second intervals. A barometer data logger was deployed at PSW-19B. Initial water levels in monitoring and extraction wells were measured and recorded to within one hundredth of a foot before transducers were deployed. During the test, manual water level measurements were collected periodically to compare with the transducer data. A summary of the second round of aquifer testing at PW-9 is provided in Table 1. Transducer data were downloaded and compensated for barometric changes during the test. Aquifer testing data were inputted into the AQTESOLVTM software for analysis using appropriate analytical solutions, which is discussed in Section 3.1.2.
2.2 Direct Push Field Investigation
GHD advanced 49 direct-push borings at the locations shown on Figure 2. Borings were advanced to a maximum depth of 70 feet below ground surface (bgs), or until competent bedrock refusal was met. The depth was also guided by field screening nitrate results. A GHD representative, under the supervision of a Kansas-licensed geologist, examined and classified recovered unsaturated soil samples in the field in accordance with the Unified Soil Classification System (USCS). Stratigraphic boring logs are found in Appendix B. Field documentation is found in Appendix C.
1 Duffield, G.M., 2007. AQTESOLV for Windows Version 4.5 User's Guide, HydroSOLVE, Inc., Reston, VA.

GHD | Data Gap Study Report | 11152783 (02) | Page 5
2.2.1 Soil Sampling
Soil sampling was performed continuously in 5-foot increments for lithologic logging purposes until bedrock or perched groundwater was encountered, whichever occurred first. Unsaturated soil samples were collected at 5-foot intervals starting from the bottom of topsoil or fill material to bedrock refusal or until perched groundwater was encountered, whichever occurred first.
Additional field screening was performed using soil test colorimetric strips for nitrate and nitrite (LaMotte Insta-Test) and ammonia (MicroEssential Labs Hydrion) to adjust sampling location, depth, and frequency. Selected soil samples were submitted to Pace Analytical Laboratories (Pace) in Lenexa, Kansas for laboratory analyses of nitrate content, ammonia content, and percent moisture, under standard chain of custody procedures. A soil sample summary is shown in Table 2. The City laboratory is not enabled to, and therefore did not analyze nitrate and ammonia in soil.
Downhole equipment was field cleaned before the field work and between each new boring. All soil cuttings from direct-push activities were staged on-site with other nitrate/ammonia affected soil and are currently kept covered, until a future date when corrective action alternatives approved for the Site are implemented.
2.2.2 Groundwater Sampling
Groundwater samples were collected from within the direct push drilling equipment. Samples were collected using dedicated polyethylene tubing fitted with a foot valve or with a peristaltic pump. Concurrent with sample collection, the sampled groundwater was measured for pH, temperature, and conductivity. Between one and four groundwater samples were collected from each boring at various depths, depending on geology encountered and the ability of the location to produce groundwater. Groundwater was collected from the perched groundwater (if possible), the upper alluvial aquifer (approximately 30-35 feet bgs), the middle alluvial aquifer (approximately 40-45 feet bgs), and the bottom of each boring (approximately 65-70 feet bgs). Groundwater samples were submitted to the laboratory for analyses of nitrate and ammonia content.
The City, as is customary for this project, performed all water analyses. Duplicate quality control groundwater samples (at the rate of approximately 2 in 10) were analyzed by Pace. A groundwater sampling summary is provided in Table 3. Field documentation is found in Appendix C.
Downhole equipment was cleaned before the field work and between each new boring. As is currently the sampling protocol for the Site, all purged groundwater (not otherwise submitted for analysis) was containerized and disposed of at the City’s waste water treatment plant as previously approved by KDHE for investigative derived waste (IDW) water generated during routine groundwater monitoring at the Site.
3. DGS Sampling Results
This section presents the aquifer testing, soil sampling, and groundwater sampling results from the DGS investigation activities. AQTESOLVTM analyses are presented in Appendix D. GHD data validation memorandum and Pace analytical laboratory reports are presented in Appendix E. The

GHD | Data Gap Study Report | 11152783 (02) | Page 6
City analytical laboratory reports are presented in Appendix F. GHD did not complete data validation for the City laboratory reports.
3.1 Aquifer Testing Results
3.1.1 October 2018 Aquifer Testing Results
Aquifer testing was conducted to estimate the alluvial aquifer properties in order to identify the groundwater extraction rates necessary to establish and sustain hydraulic capture of nitrate and ammonia in the alluvial aquifer at each alluvial recovery well in accordance with the current CAD for the Site. The results of the first aquifer test at PW-9 showed that a constant pumping rate of 13 gpm created insufficient hydraulic response beyond the pumping well to yield meaningful data analysis. From the combined extraction well test, monitoring wells PSW-5B2 (alluvial aquifer) and PSW-6A (terrace deposits) showed no response during the aquifer test. Hence, the only noted responses were in the three pumping wells.
The aquifer test results were analyzed using one or more of the following methods: Theis (19352) Recovery, Cooper and Jacobs (19463), and Papadopulos and Cooper (19674). GHD used AQTESOLVTM to analyze the results from each pumping well and estimate transmissivities of the aquifer at each location. The average transmissivity for PSW-3B3 is 0.70 square feet per minute (ft2/min); however, this low transmissivity value may be influenced by the well’s poor hydraulic efficiency due to clogging issues. For PSW-6B4 and PSW-7B2 the average transmissivities are 3.26 ft2/min and 3.88 ft2/min, respectively. At PW-9, due to its low pumping rate, only the Theis Recovery method could be applied. The average transmissivity for PW-9 was calculated to be 7.91 ft2/min. A summary of aquifer testing results is shown in Table 3.1. AQTESOLV plots are provided in Appendix D.
Table 3.1 2018 Aquifer Testing Transmissivity Results
Well
Theis Recovery Cooper-Jacob Papadopulos-Cooper
Transmissivity Average
PW-9 7.91 - - 7.91 PSW-3B3 0.90 0.50 - 0.70 PSW-6B4 2.36 2.58 4.83 3.26 PSW-7B2 3.05 4.29 4.29 3.88 All results in ft2/min
3.1.2 September 2019 PW-9 Aquifer Testing Results
During the second aquifer test at PW-9, the new pump operated at a higher rate (i.e., 63 gpm), which created a measurable hydraulic response at PSW-19B, PW-8, and PSW-20B. Given their hydraulic response, the aquifer test data from PW-9 and PSW-19B were entered into the
2 Theis, C.V., 1935. The relation between the lowering of the piezometric surface and the rate and duration of
discharge of a well using groundwater storage, Am. Geophys. Union Trans., vol. 16, pp. 519-524. 3 Cooper, H.H. and C.E. Jacob, 1946. A generalized graphical method for evaluating formation constants and
summarizing well field history, Am. Geophys. Union Trans., vol. 27, pp. 526-534. 4 Papadopulos, I.S. and H.H. Cooper, 1967. Drawdown in a well of large diameter, Water Resources Research, vol.
3, no. 1, pp. 241-244.

GHD | Data Gap Study Report | 11152783 (02) | Page 7
AQTESOLV program to estimate the transmissivity of the alluvial aquifer at PW-9 using the aquifer analytical methods of Theis (19355), Copper and Jacob (19466), and Hantush and Jacob (19557).
GHD calculated transmissivity results ranging from 4.13 ft2/min to 7.35 ft2/min, with an average value of 5.67 ft2/min. In addition, a distance-drawdown graph was prepared that incorporates the drawdown data from the other monitoring wells at a specific time during the pumping test. The distance drawdown analysis is a variation of the Copper and Jacob (1946) method and produced a transmissivity result of 4.14 ft2/min. The transmissivity results are summarized on Table 3.2. Aquifer analysis plots are provided in Appendix D.
Table 3.2 PW-9 Aquifer Testing Results
Well
Cooper-Jacob Hantush - Jacob Theis Recovery Transmissivity Average
PW-9 6.25 - 5.32 5.79 PSW-19B 5.08 5.08 4.13 4.76 PW-8 7.35 6.56 5.61 6.51 5.67 (Overall) All results in ft2/min
3.2 Soil Sampling Analytical Results
GHD collected 142 soil samples from above the perched water table at the identified data gap areas. Soil sample results are summarized in Table 4. Soil sample results from each DGS study area are discussed below. Only soil samples collected from the identifiable unsaturated vadose zone were subjected to field and laboratory analysis.
3.2.1 Bag Warehouse Area
Soil sample results from the Bag Warehouse Area are shown on Figure 3. Ammonia soil concentrations in the Bag Warehouse Area ranged from non-detect (ND), which is below the laboratory method detection limit (MDL), to 787J (“J” is the laboratory’s qualifier indicating a result has been estimated between the laboratory Reporting Limit and the MDL) milligrams per kilogram (mg/kg). Nitrite/nitrate concentrations in the Bag Warehouse Area range from ND to 55.4J mg/kg, with the majority (65%) of the sample intervals being ND.
Soil samples collected from borehole locations north of PW-9 (SB-12, SB-13, SB-14, SB-48, and SB-49) had no ammonia detections and less than 5 mg/kg to non-detect nitrate concentrations. Only four of the 17 boring locations (SB-16, SB-21, SB-22, and SB-24) contained estimated ammonia concentrations above 100 mg/kg. Whereas, only two out of 17 locations (SB-16 and SB-22) reported soil samples with nitrite/nitrate concentrations above 10 mg/kg. Soil boring SB-16 is located approximately 200 feet south of the Bag Warehouse Area. Soil boring SB-22 is located along the
5 Theis, C.V., 1935. The relation between the lowering of the piezometric surface and the rate and duration of
discharge of a well using groundwater storage, Am. Geophys. Union Trans., vol. 16, pp. 519-524. 6 Cooper, H.H. and C.E. Jacob, 1946. A generalized graphical method for evaluating formation constants and
summarizing well field history, Am. Geophys. Union Trans., vol. 27, pp. 526-534. 7 Hantush, M.S. and C.E. Jacob, 1955. Non-steady radial flow in an infinite leaky aquifer, Am. Geophys. Union
Trans., vol. 36, pp. 95-100.

GHD | Data Gap Study Report | 11152783 (02) | Page 8
north end of the Bag Warehouse building. Overall, the soil concentrations in the Bag Warehouse Area, are relatively low and do not indicate substantial soil impacts at or near the ground surface. The soil results do not indicate the Bag Warehouse are being a potentially significant contributor to groundwater impacts
3.2.2 Western Ponds Area
Soil sample results from the West Extension Pond in the Western Ponds Area are shown on Figure 4. The ammonia concentrations in soil samples collected in the West Extension Pond Area ranged from 3.7J mg/kg to 8,520J mg/kg with 10 out of 12 locations having ammonia above 100 mg/kg. Nitrite/nitrate soil concentrations ranged from 1.1 mg/kg to 5,120 mg/kg with every location having nitrite/nitrate above 10 mg/kg. The majority of high ammonia and nitrite/nitrate concentrations are located within soil borings around the West Extension Pond (i.e., SB-25, SB-27, and SB-36) and to the north of the West Extension Pond (SB-26 and SB-28). A total of 6 out of 12 borehole locations reported soil samples that contained concentrations of both ammonia and nitrite/nitrate that exceeded 1,000 mg/kg; these include SB-25, SB-26, SB-27, SB-28, SB-31, and SB-36. The West Extension Pond Area represents a potentially significant source for ongoing impacts to groundwater and contains a higher amount of nitrogen mass compared to Bag Warehouse and East and West Lime Pond Areas. Certain boring locations, such as SB-25, SB-27, SB-28, and SB-36, show high concentrations throughout most of the vertical soil profile to depths of 20 feet or more bgs.
3.2.3 Eastern Ponds Area
Soil sample results from the East Lime Pond, West Lime Pond, and Rundown Pond in the Eastern Ponds Area are shown on Figure 5. Ammonia concentrations in soil samples collected within the East and West Lime Ponds Area ranged from non-detect (ND) to 5,860 mg/kg with 9 out of 10 borehole locations reporting ammonia above 100 mg/kg. Nitrite/Nitrate concentrations in soil samples ranged from ND to 3,390 mg/kg with every borehole location reporting nitrite/nitrate concentrations above 10 mg/kg. The boreholes from which soil samples contained ammonia and nitrite/nitrate concentrations greater than 1,000 mg/kg include SB-4, SB-42, SB-43, SB-44, and SB-46. In particular the soil samples from the boreholes located within the Rundown Pond showed elevated nitrate and ammonia concentrations starting around 10 feet bgs. The East and West Lime Pond Area shows variable soil impacts with SB-41, SB-42, and SB-43 showing the higher overall nitrogen concentrations compared to other borings in this area with SB-42 and SB-43 exhibiting higher nitrogen concentrations at depths greater than 10 feet bgs.
3.3 Groundwater Sampling Analytical Results
GHD collected 133 groundwater samples within the identified data gap areas to update previous assessment data regarding the horizontal and vertical extent of ammonia and nitrite/nitrate concentrations at the Site. Groundwater sample results are summarized in Table 5. Groundwater sample results for each DGS study area are discussed below.
3.3.1 Bag Warehouse Area
Groundwater sample results from the Bag Warehouse Area are shown on Figure 6. Ammonia concentrations in groundwater samples collected from the Bag Warehouse Area ranged from ND to

GHD | Data Gap Study Report | 11152783 (02) | Page 9
121 milligrams per liter (mg/L). Locations from which groundwater samples contained ammonia concentrations greater than 100 mg/L include SB-14 and SB-23. Nitrite/Nitrate groundwater concentrations within the Bag Warehouse Area ranged from 1.5 mg/L to 344 mg/L. All borehole locations contained at least one sample interval from which groundwater samples contained nitrite/nitrate concentrations greater than 10 mg/L, with the exception of SB-20 and SB-47. In addition, several locations showed increasing nitrate concentrations with depth, including SB-11, SB-12, SB-14, SB-23, and SB-24. Elevated nitrate concentrations were typically found to depths of 40 to 50 feet bgs.
3.3.2 Western Ponds Area
Groundwater sample results from the West Extension Pond in the Western Ponds Area are shown on Figure 7. Ammonia concentrations in groundwater samples collected from within the West Extension Pond Area ranged from 14.6 mg/L to 20,400 mg/L. All sample locations reported elevated ammonia. Nitrite/Nitrate concentrations in groundwater samples collected within the West Extension Pond Area ranged from 1.36 mg/L to 23,200 mg/L. All locations had exceedances nitrite/nitrate greater than 10 mg/L, with the exception of SB-31 and SB-34. The SB-36 location had the highest ammonia and nitrite/nitrate concentrations of 20,400 mg/L and 23,200 mg/L, respectively at 31 to 35 feet bgs. The West Extension Pond Area reported the highest dissolved nitrogen concentrations under the DGS with several locations showing elevated nitrate concentrations (> 500 mg/L) at depths greater than 50 feet bgs.
3.3.3 Eastern Ponds Area
Groundwater sample results from the East Lime Pond, West Lime Pond, and Rundown Pond in the Eastern Ponds Area are shown on Figure 8. Ammonia concentrations in groundwater within the East and West Lime Ponds Area range from 2.13 mg/L to 8,960 mg/L, with only one location (SB-41) reporting an elevated (>50 mg/L) ammonia concentration. The nitrite/nitrate concentrations ranged from 0.50 mg/L to 10,900 mg/L, with only two locations (SB-41 and SB-45) reporting nitrate above 10 mg/L. The highest nitrate concentrations were reported within the terrace deposits at depths less than 30 feet bgs.
3.3.4 PSW-5B2 Area
Groundwater sample results from the PSW-5B2 Area are shown on Figure 9. Ammonia concentrations from groundwater samples collected from within the PSW-5A Area ranged from 5.16 mg/L to 288 mg/L, where three locations (SB-4, SB-5, and SB-6) showed ammonia concentrations lower than 100 mg/L. Nitrite/Nitrate concentrations ranged from ND to 5.97 mg/L. No groundwater samples from this area contained a nitrite/nitrate concentration exceeding 10 mg/L.
4. Data Evaluation
This section provides an evaluation of the extraction well efficiency, soil quality, and groundwater quality at the Site. The purpose of this data evaluation is to update the current conditions of soil and groundwater quality across the Site; to update the Site’s alluvial aquifer characteristics; and to

GHD | Data Gap Study Report | 11152783 (02) | Page 10
update the CSM necessary to form the basis for the Cost-Benefit Analysis of alternative remedial strategies to the current non-viable strategies in use at the Site.
4.1 Aquifer Testing Analysis
The two aquifer testing events provided the data necessary to estimate the hydraulic parameters for the alluvial aquifer system, particularly at PW-9 (north of the Bag Warehouse) area. The alluvial aquifer at PW-9 has a transmissivity (T) of approximately 5.7 ft2/min. This transmissivity value corresponds to a hydraulic conductivity (K) value of 0.19 ft/min, based on an alluvial aquifer thickness of 30 ft. These T and K values indicate that the alluvial aquifer is permeable and is capable of transmitting large quantities (> 70 gpm) of groundwater from a single extraction well.
At PSW-3B3, PSW-6B4, and PSW-7B2, north of the eastern ponds, the alluvial aquifer average transmissivity results were approximately 40% less than the PW-9 area with an average value of 3.5 ft2/min. The aquifer analysis for PSW-3B3 is significantly lower and is considered anomalous due to a history of mineral or biological fouling of the well at this location. Overall, the results from PSW-6B4 and PSW-7B2 show the aquifer is permeable with a corresponding K value of 0.12 ft/min. The aquifer testing results indicate a higher sustainable constant flow rate is attainable than their current design of 25 gpm, with the exception of PSW-3B3. The aquifer testing suggests PSW-3B3 is in need of significant maintenance or replacement if needed for future remediation,
4.1.1 Groundwater Flow Velocity Analysis
The pumping test data determined the hydraulic parameters of the alluvial aquifer. By applying those parameters, the groundwater flow velocity (v) with the alluvial aquifer can be calculated using the following formula:
𝑣𝑣 =𝐾𝐾𝐾𝐾𝑛𝑛𝑛𝑛
where:
K = hydraulic conductivity (ft/min)
i = hydraulic gradient (ft/ft)
ne = effective porosity
The hydraulic gradient across the Site is relatively flat. Using the groundwater elevation data from the 2019 Performance Evaluation Report (PER 85), a hydraulic gradient of 0.0009 ft/ft is estimated. The effective porosity is an assumed value of 0.25. Using the range of K values (0.19 to 0.12 ft/min) from the aquifer tests, the groundwater flow velocity ranges from 6.8 x 10⁻⁴ ft/min to 4.3 x 10⁻⁴ ft/min or 0.98 ft/day to 0.63 ft/day, respectively.

GHD | Data Gap Study Report | 11152783 (02) | Page 11
4.1.2 Groundwater Capture Analysis
Based on the results of the aquifer tests, the zone of capture for each pumping well can be calculated. According to the USEPA8, the hydraulic capture zone (d), at the extraction well, is defined by the following equation:
𝑑𝑑 = 𝑄𝑄/2𝑇𝑇𝐾𝐾
where:
Q = extraction rate (ft3/min)
T = transmissivity (ft2/min)
i = hydraulic gradient (ft/ft)
Table 4.1 Capture Width Calculation
Well Extraction Rate (ft3/min)
Transmissivity (ft2/min)
Hydraulic gradient
Capture Width (ft)
PW-9 1.74 (13 gpm) 5.67 0.0009 171 PSW-3B3 2.00 (15 gpm) 3.5* 0.0009 318 PSW-6B4 3.21 (24 gpm) 3.5 0.0009 510 PSW-7B2 2.27 (17 gpm) 3.5 0.0009 360 * Assumes the transmissivity at PSW-3B3 is comparable to the other nearby extraction wells.
As noted in Table 4.1, the capture width generated by the four extraction wells ranged from 170 to 510 feet. PSW-3B3 and PSW-6B4 are approximately 300 feet apart. While PSW-7B2 is approximately 850 feet east from PSW-6B4 (see Figure 2), These capture widths indicate that PSW-3B3 and PSW-6B4 would interact with each other as a single well type system to create a large capture zone. However, there is very likely a flow gap between PSW-7B2 and the other two extraction wells because of the distance between them is greater than the combined predicted capture widths. This flow gap may be a moot point, however, because these wells do not capture elevated levels of nitrate or ammonia.
4.2 Analytical Results Analysis
4.2.1 Soil
Soil sampling was conducted in the unsaturated zone within the unconsolidated overburden. The overburden includes organic topsoil, Newman Terrace Deposits, and Kansas Alluvial Deposits.
In the Bag Warehouse Area, the soil samples showed comparatively lower ammonia and nitrite/nitrate concentrations than the other areas within the DGS. At the Bag Warehouse Area, concentrations of ammonia over 100 mg/kg and nitrite/nitrate over 10 mg/kg are found at SB-16 at a depth between 20 and 28 feet bgs and at various intervals at SB-21 and SB-22. None of the soil samples identified a possible source area due to surface releases.
8 U. S. Environmental Protection Agency. 2008. A Systematic Approach for Evaluation of Capture Zones at Pump
and Treat Systems. EPA 600/R-08/003

GHD | Data Gap Study Report | 11152783 (02) | Page 12
Within the West Extension Pond Area, ammonia and nitrite/nitrate concentrations greater than 1,000 mg/kg are present between 0 to 30 feet bgs. Soil samples collected directly around the West Extension Pond (SB-25, SB-27, and SB-36) had ammonia and nitrite/nitrate concentrations greater than 1,000 mg/kg from the surface to 30 feet bgs, while at boreholes to the north (SB-26 and SB-28) concentrations exceeding 1,000 mg/L were found between the surface and 20 feet bgs (groundwater was encountered during sampling at a depth of approximately 30 feet bgs). Elevated levels of both ammonia and nitrate are found across the unsaturated soil profile down to the water table encountered during sampling at a depth of ranging from approximately 5 bgs to 30 feet bgs. This area has been subject to surface runoff and surface water collection from neighboring ponds and past operations.
Within the Eastern Pond Area, Rundown Pond and East Lime Pond sample locations SB-41, SB-42, SB-43, and SB-46 had ammonia and nitrite/nitrate concentrations greater than 1,000 mg/kg. Sample locations SB-41 and SB-42 are located within the Rundown Pond and had concentrations greater than 1,000 mg/kg between 10 to 33 feet bgs. The SB-43 and SB-46 sample locations are located within the East Lime Pond and had concentrations greater than 1,000 mg/kg between 0.5 to 9 feet bgs. The elevated samples were found within or near these former pond bottoms. For the East Lime Pond, concentrations decrease with depth. Whereas, at the Rundown Pond the highest concentrations are found near the pond bottom. At the West Lime Pond, the overall ammonia and nitrate concentrations tend to be less compared to the Rundown Pond and East Lime Pond.
4.2.2 Groundwater
The groundwater data were collected across the saturated interval from both the Newman Terrace Deposits and the Kansas Alluvial Deposits down to the top of the bedrock surface.
Groundwater samples indicate that the Bag Warehouse Area has minor ammonia impacts, with only two locations immediately surrounding the Bag Warehouse (SB-15 and SB-23) having ammonia concentrations exceeding 100 mg/L from 43 to 50 feet bgs. Nitrite/Nitrate in groundwater in the Bag Warehouse Area is far more prominent and concentrations exceeding 10 mg/L were found in a majority of the samples at depths between 15 to 59 feet bgs. At several locations, there is an increasing downward concentration (e.g., SB-14, SB-23, and SB-24). This information in conjunction with the soil sampling results (see Figure 3) indicate that the elevated levels may be coming from upgradient of the Bag Warehouse building and migrating underneath the building. The concentrations found near the northern property boundary, along N 1500 road, suggests a plume migrating off-site with an approximate width 1,100 feet from SB-14 to SB-24 (see Figure 6).
The West Extension Pond Area has overall substantially higher ammonia and nitrite/nitrate concentrations compared to the other DGS areas, with concentrations approximately one to two orders of magnitude greater than the Bag Warehouse and Rundown Pond, East Lime Pond, and West Lime Pond Areas. Highest concentrations of both contaminants are found directly next to or north of the West Extension Pond. Borehole SB-34 shows the southern extent of the ammonia and nitrite/nitrate plumes. In this area, the groundwater is found primarily in the low permeability Newman Terrace Deposits, which consists of silty clay, as noted at borings SB-26 and SB-28 (see Appendix B).
The PSW-5B2 Area is north of the West Extension Pond Area. The groundwater samples in this area show significantly lower concentrations than is reported in the West Extension Pond Area.

GHD | Data Gap Study Report | 11152783 (02) | Page 13
According to the City’s interpretations of historic groundwater elevation data as presented in their Performance Evaluation Reports (PERs), groundwater flows in a generally northerly direction towards the Kansas River. The low ammonia and nitrate concentrations in the PSW-5B2 Area suggest that the affected groundwater from the West Extension Pond, in particular the North Sump Area, may not be moving off-site. However, off-site groundwater further east of PSW-5B2 and downgradient of the Regional Detention Basin is not being monitored.
The Rundown Pond, East Lime Pond and West Extension Pond Areas have a maximum ammonia concentration in groundwater of 8,980 mg/L. However, this result is within the fine-grained silty clay terrace deposits and at a depth comparable to the base of the Rundown Pond. Nitrate is below the drinking water standard in all the samples collected from the alluvial aquifer in this area at SB-38, SB-42, and SB-45. In comparing the soil data to the groundwater data, the data indicate that the low permeable Newman Terrace Deposits successfully mitigate downward migration to the alluvial aquifer.
4.3 Updated Conceptual Site Model
The DGS program provided additional data to update the CSM for the Site. The DGS further characterized certain areas as potential contributing sources of nitrogen for off-site groundwater migration. The DGS evaluated the alluvial aquifer hydraulic characteristics as it relates to hydraulic containment and evaluation of the existing groundwater extraction system.
The various investigations conducted at the Site have identified the primary sources of nitrogen contamination based on past Site operations:
• Sandstone Hill
• Central Ponds Area
• Western Ponds Area
• Eastern Ponds Area
Other areas may be contributing such as the Bag Warehouse and Plant A, but their contributions are relatively minor.
4.3.1 Sandstone Hill Area
The Sandstone Hill Area has identified nitrate and ammonia impacts attributed to the UAN ponds formerly located on top of the Sandstone Hill (see Figure 2 for location of Sandstone Hill). Nitrate and ammonia leached downward into the fractured shale and sandstone. The nitrogen impacts were further mobilized by surface infiltration of precipitation and groundwater flowing underneath the hill from the southwest.
The surface soils on Sandstone Hill are comprised primarily of clay and weathered shale and sandstone. Nitrogen impacted surface runoff from precipitation events flows via sheet flow to the west, south and east. Seeps of groundwater have been observed in rock outcrops and exterior sides on the west, south, east and north sides of the bluff. Groundwater that successfully percolates to the interior base of the hill via fractures within the interbedded layers of sandstone, shale, and siltstone

GHD | Data Gap Study Report | 11152783 (02) | Page 14
eventually transport dissolved nitrogen and minerals to the perched groundwater within the terrace deposits and eventually into the underlying regional Kansas River alluvial aquifer.
4.3.2 Central Ponds Area
The Central Ponds Area is located on the southeastern part of Sandstone Hill. In 2006, 1,300 cubic yards of nitrogen impacted soil were removed and relocated to the East Lime Pond. The area was restored using approximately 2,700 cubic yards of imported fill soil. Due to ongoing seepage of nitrogen-impacted groundwater from the south side of Sandstone Hill which re-impacted the Central Ponds Area, additional remedial work was approved by the KDHE. In 2014, a shallow groundwater interception french drain system was installed on the north and south sides of the access road that traces along the north edge of the Central Ponds Area. The trench is connected to a subgrade sump (CP sump). Under previous remedial operations, groundwater gathered by the CP sump was pumped to the ASTs for reuse in irrigation and fertilizer of crops north of the river. The Central Ponds continue to show elevated nitrate and ammonia concentrations as groundwater form the Sandstone Hill continues to seep into this area.
4.3.3 Western Ponds Area
The Western Ponds – including the Krehbiel, Old West and West Extension ponds – were once a key part of the manufacturing process. Historical practices resulted in releases of nitrogen to soil and groundwater in and beneath the ponds. The DGS confirms that substantial nitrogen mass remains in this area both in the unsaturated soil and groundwater. This area may also be affected by groundwater seepage from the Sandstone Hill into the unconsolidated sols that abut against the bedrock. These nitrogen impacts appear to be affecting the perched and alluvial groundwater quality downgradient to the northwest, north and northeast.
4.3.4 Eastern Ponds Area
The Eastern Ponds – including East Lime Pond, Overflow Pond, Rundown Pond and West Lime Pond - were used to store and manage the facility’s waste and cooling waters. The DGS indicates that the pond bottoms are constructed of a native very low permeability clay and within the Newman Terrace Deposits. These low permeability materials have effectively inhibited downward migration of nitrogen compounds into the alluvial aquifer, as evidenced by the relatively low to non-detectable nitrogen compound concentrations measured in alluvial aquifer groundwater samples collected with direct-push probes below the ponds and in downgradient extraction well system.
4.3.5 Bag Warehouse Area
The DGS data indicates that minor nitrate and ammonia impacts to surface and subsurface soil in this area is a result of former operations and releases to the environment which occurred during the transfer of final product to truck and rail. However, the area is effectively covered with an impermeable cap (the warehouse and supplemental paving). The groundwater data show that groundwater from Sandstone Hill is carrying dissolved nitrogen north beneath the warehouse.

GHD | Data Gap Study Report | 11152783 (02) | Page 15
4.3.6 Plant A
Historical operation and waste management practices impacted the soil and groundwater throughout this area. Due to the network of former utilities, some of which were cleaned and abandoned in place, useful access to the soil and groundwater in this area for the purpose of active remediation is extremely limited. However, the area was networked with a labyrinth of subsurface process and process sewer piping for the duration of the manufacturing use at the Site. The area is currently mostly paved, which limits the potential for leaching nitrogen from impacted soils to the groundwater units below.
4.3.7 Site Groundwater
The Site groundwater has been impacted by past Site operations. In particular, Sandstone Hill represents a significant source to groundwater impacts. Given its topographic location, Sandstone Hill is a groundwater recharge source that discharges radially into the adjoining unconsolidated sediments. If the water discharges into the sandy alluvial sediments it can readily migrate off-site, unless captured by the existing groundwater extraction system. In some instances, the groundwater discharges to the ground surface as seeps and then migrates as surface water down-slope to the west, and the south to the former Central Ponds Area and to the north and east toward the Western Ponds Areas.
The Newman Terrace Deposits are low permeability sediments that appear to effectively inhibit nitrogen migration, particularly in the East Ponds Area where minimal impact to the alluvial aquifer is observed. In the West Ponds Area, the unsaturated terrace deposits are relatively thick (>20 feet, approximately) and is capable of retaining significant nitrogen mass. While downgradient nitrogen impacts are observed off-site in groundwater at monitoring well PSW-5B2, the relative concentrations are orders of magnitude lower compared to what is measured on-site.
The Kansas Alluvial Deposits are permeable sand deposits that are capable of transmitting substantial quantities of water. The hydraulic testing shows the alluvial aquifer to be transmissive with a groundwater flow velocity between 0.5 to 1.0 ft/day (180 to 365 ft/yr). The high alluvial aquifer transmissivity is inversely proportional to hydraulic containment. Hence, PW-9 only effectively captures a portion of the nitrogen plume migrating underneath the Bag Warehouse Area and a potentially significant portion of the plume is allowed to migrate off-site. By rearranging the groundwater capture equation in Section 4.1.2, the minimum pumping rate can be determined, where
𝑄𝑄 = 2𝑇𝑇𝐾𝐾𝑑𝑑
Assuming a 1,000-foot capture width, PW-9 (if continuing to operate alone) would need to pump a minimum of 75 gpm to effect a capture consistent with the requirements of the current CAD. However, the USEPA (2008), recommends a safety factor of 1.5 to 2.0 to account for heterogeneities and unknown boundary conditions.
With respect to the other three groundwater extraction wells (PSW-3B3, PSW-6B4, and PSW-7B2), based on their groundwater effluent data of low to non-detect nitrogen data, these wells appear to provide no useful remedial benefit.

GHD | Data Gap Study Report | 11152783 (02) | Page 16
5. Conclusions
The DGS has evaluated the extent and magnitude of other potential source areas and their impact to off-site migration and site remediation.
The Bag Warehouse Area does not appear to represent a significant source area. However, impacted groundwater from the upgradient Sandstone Hill appears to be migrating underneath the Bag Warehouse Area into the alluvial aquifer and off-site. PW-9 captures a portion of the nitrogen affected groundwater. The updated aquifer analysis indicates higher extraction flow rates than the current pumping rate of 13 gpm are achievable and may be needed to improve capture of nitrogen affected groundwater at the location.
The Western Ponds Area contains significant nitrogen mass that occur mostly within the low permeability silt clay near surface terrace deposits. These low permeability deposits appear to inhibit off-site migration as evidenced by the low nitrogen detections found off-site in soil and groundwater near PSW-5B2.
The Eastern Ponds Area also shows high relative nitrogen concentrations within the low permeable deposits. However, the underlying sandy alluvial aquifer deposits do not show elevated nitrogen levels and indicate the terrace deposits are an effective aquitard that limits downward migration of nitrogen compounds, especially in the absence of hydraulic loading when the ponds are empty.
The current groundwater extraction system needs to be modified to more effectively capture migrating impacted groundwater in the areas of PW-9 and PSW-5B2. The groundwater system downgradient of the East Ponds Areas provides no apparent remedial benefit based on the DGS data.
The data, findings, and conclusions will be used to develop the Cost-Benefit Analysis comparing and evaluating potential corrective action alternatives for the Site.
GHD | Data Gap Study Report | 11152783 (02)
Figures

0 2000ft1000
Coordinate System:
STATE PLANE -
KANSAS SOUTH
Site Coordinates
Lat/Long 38.952Á, -95.196Á
Source: USGS 7.5 MINUTE QUAD "LAWRENCE EAST, KANSAS"
CAD File: I:\CAD\Files\Eight Digit Job Numbers\1115----\11152783-Lawrence_Farmland\Reports\11152783-02(002)Farmland Data Gap\11152783-02(002)GN-DL002_Topo.dwg
Sep 3, 2019
11152783-02
FIGURE 1
2018 DATA GAP STUDY REPORT
1608 N 1400 RPAD, LAWRENCE, KANSAS
SITE LOCATION MAP
KANSAS
Douglas County
NITROGEN PLANT AREA

5
3
2
1
DAM POND SUMP
SOUTH SUMP
NORTHWEST SUMP
SOUTHEAST SUMP
CENTRAL PONDS INTERCEPTOR TRENCH SUMP
NORTH SUMP
001A1
001B1
NORTHEAST SUMP
SB47
SB46
SB45
SB44
SB43
SB42
SB41
SB40
SB39
SB38
SB37
SB36
SB35
SB34
SB33
SB32
SB31
SB30
SB29
SB28
SB27
SB26
SB25
SB24
SB23
SB22
SB21
SB20
SB19
SB18
SB17
SB16
SB15
SB14
SB13
SB12
SB11
CPMW-1S
CPMW-1D
PSW-19B
PSW-19A
PSW-13B
PSW-13A
SW-10
PSW-18
PSW-17
PSW-15
PSW-9B
PSW-9A
PSW-6A
PSW-5B2
PSW-5A
PSW-4
PSW-3A
PSW-2B
PSW-1B
PSW-1A
OW-26
SW-1A
PW-4A
PW-3A
N-2
N-1
PW-8
PW-6
PW-2
PSW-7B2
PW-9
PW-5
OLD WEST POND SUMP
CPMW-2SR
CPMW-2S
CPMW-2D
SB49
SB48
PSW-20B
PSW-3B3
PSW-7B1
PSW-7A
PSW-2A
PSW-6B4
EASTERN PONDS AREAEASTERN PONDS AREAEASTERN PONDS AREAEASTERN PONDS AREAEASTERN PONDS AREAEASTERN PONDS AREA
EASTERN PONDS AREA
0 400ft200
Source: GOOGLE AERIAL IMAGE DATED SEPTEMBER 21, 2018
CAD File: I:\CAD\Files\Eight Digit Job Numbers\1115----\11152783-Lawrence_Farmland\Reports\11152783-02(002)Farmland Data Gap\11152783-02(002)GN-DL001.dwg
Feb 11, 2020
11152783-02
FIGURE 2
FORMER FARMLAND INDUSTRIES NITROGEN PLANT
2018 DATA GAP STUDY REPORT
1608 N 1400 ROAD, LAWRENCE, KANSAS
SITE LAYOUT - DGS SOIL BORING LOCATIONS
Groundwater Recovery WellMonitoring Well Location
Interceptor Trench Sump
Private Domestic Well
A: Perched
B: Alluvial
West
Extension
Pond
Khehbiel Pond
Old West Pond
Pond
Former
West
Effluent
Former
East
Effluent
Pond
Regional
Detention
Basin
West
Lime
Pond
Rundown
Pond
Overflow
Pond
East
Lime
Pond
Lime
Sludge
Landfill
Central Pond
Interceptor
Trenches
AST
#6
AST
#5
Plugged Monitoring Well
Permitted NPDES Outfall
Soil Boring Location
0 100ft50
SB5
SB6
SB1
SB2
SB3
SB7
SB8
SB9
PSW-5A
PSW-5B2
SB4
SB10
EASTERN PONDS AREA
CENTRAL PONDS AREACENTRAL PONDS AREACENTRAL PONDS AREACENTRAL PONDS AREACENTRAL PONDS AREACENTRAL PONDS AREA
CENTRAL PONDS AREACENTRAL PONDS AREA
PLANT APLANT APLANT APLANT APLANT APLANT A
PLANT APLANT A
SANDSTONE HILLSANDSTONE HILLSANDSTONE HILLSANDSTONE HILLSANDSTONE HILLSANDSTONE HILL
SANDSTONE HILLSANDSTONE HILL
WESTERN PONDS AREAWESTERN PONDS AREAWESTERN PONDS AREAWESTERN PONDS AREAWESTERN PONDS AREAWESTERN PONDS AREA
WESTERN PONDS AREAWESTERN PONDS AREA
B
A
G
W
A
R
E
H
O
U
S
E
B
A
G
W
A
R
E
H
O
U
S
E
B
A
G
W
A
R
E
H
O
U
S
E
B
A
G
W
A
R
E
H
O
U
S
E
B
A
G
W
A
R
E
H
O
U
S
E
B
A
G
W
A
R
E
H
O
U
S
E
B
A
G
W
A
R
E
H
O
U
S
E
B
A
G
W
A
R
E
H
O
U
S
E
Property Boundary

0 100ft50
Source: GOOGLE AERIAL IMAGE DATED SEPTEMBER 21, 2018
CAD File: I:\CAD\Files\Eight Digit Job Numbers\1115----\11152783-Lawrence_Farmland\Reports\11152783-02(002)Farmland Data Gap\11152783-02(002)GN-DL001.dwg
Sep 3, 2019
11152783-02
FIGURE 3
FORMER FARMLAND INDUSTRIES NITROGEN PLANT
2018 DATA GAP STUDY REPORT
1608 N 1400 ROAD, LAWRENCE, KANSAS
SOIL SAMPLING RESULTS - BAG WAREHOUSE
B
a
g
W
a
r
e
h
o
u
s
e
Groundwater Recovery WellMonitoring Well Location
A: Perched
B: Alluvial
Plugged Monitoring Well
Permitted NPDES Outfall
Soil Boring Location
Not DetectedND
J Indicates Estimated Concentration
PW-9
SW-10
PSW-19A
PSW-19B
PSW-20B
SB11
SB12
SB13
SB14
SB15
SB16
SB17
SB18
SB19
SB20
SB21
SB22
SB23
SB24
SB47
SB48
SB49
001A1
PW-5
PW-6
PW-8
Property Boundary
GEOLOGY DESCRIPTION LEGEND
Qtn - NEWMAN DEPOSITS
Qal - KANSAS ALLUVIAL DEPOSITS

0 40 120ft
Source: GOOGLE AERIAL IMAGE DATED SEPTEMBER 21, 2018
CAD File: I:\CAD\Files\Eight Digit Job Numbers\1115----\11152783-Lawrence_Farmland\Reports\11152783-02(002)Farmland Data Gap\11152783-02(002)GN-DL001.dwg
Sep 3, 2019
11152783-02
FIGURE 4
FORMER FARMLAND INDUSTRIES NITROGEN PLANT
2018 DATA GAP STUDY REPORT
1608 N 1400 ROAD, LAWRENCE, KANSAS
SOIL SAMPLING RESULTS - WEST EXTENSION POND
Monitoring Well Location Interceptor Trench Sump
A: Perched
B: Alluvial
Khehbiel Pond
Old West Pond
AST
#5
Plugged Monitoring Well
Permitted NPDES Outfall
West
Extension
Pond
Regional
Detention
Basin
Soil Boring Location
J Indicates Estimated Concentration
PW-2
PW-3A
PW-4A
OW-26
PSW-5A
PSW-5B2
PSW-18
SB1
SB10
SB2
SB25
SB26
SB27
SB28
SB29
SB3
SB30
SB31
SB32
SB33
SB34
SB35
SB36
SB4
SB5
SB6
SB7
SB8
SB9
001B1
NORTH SUMP
SOUTH SUMP
DAM POND SUMP
OLD WEST POND SUMP
Property Boundary
GEOLOGY DESCRIPTION LEGEND
Qtn - NEWMAN DEPOSITS
Qal - KANSAS ALLUVIAL DEPOSITS

0 400ft200
Source: GOOGLE AERIAL IMAGE DATED SEPTEMBER 21, 2018
CAD File: I:\CAD\Files\Eight Digit Job Numbers\1115----\11152783-Lawrence_Farmland\Reports\11152783-02(002)Farmland Data Gap\11152783-02(002)GN-DL001.dwg
Sep 3, 2019
11152783-02
FIGURE 5
FORMER FARMLAND INDUSTRIES NITROGEN PLANT
2018 DATA GAP STUDY REPORT
1608 N 1400 ROAD, LAWRENCE, KANSAS
SOIL SAMPLING RESULTS - EAST AND WEST LIME PONDS
Groundwater Recovery Well
Monitoring Well Location Interceptor Trench Sump
A: Perched
B: Alluvial
Plugged Monitoring Well
Former
East
Effluent
Pond
West
Lime
Pond
Rundown
Pond
Overflow
Pond
East
Lime
Pond
Lime
Sludge
Landfill
Soil Boring Location
Not DetectedND
J Indicates Estimated Concentration
PSW-7A
PSW-7B2
PSW-7B1
SB37
SB38
SB39
SB40
SB41
SB42
SB43
SB44
SB45
SB46
NORTHEAST SUMP
SOUTHEAST SUMP
Property Boundary
GEOLOGY DESCRIPTION LEGEND
Qtn - NEWMAN DEPOSITS
Qal - KANSAS ALLUVIAL DEPOSITS

0 100ft50
Source: GOOGLE AERIAL IMAGE DATED SEPTEMBER 21, 2018
CAD File: I:\CAD\Files\Eight Digit Job Numbers\1115----\11152783-Lawrence_Farmland\Reports\11152783-02(002)Farmland Data Gap\11152783-02(002)GN-DL001.dwg
Sep 3, 2019
11152783-02
FIGURE 6
FORMER FARMLAND INDUSTRIES NITROGEN PLANT
2018 DATA GAP STUDY REPORT
1608 N 1400 ROAD, LAWRENCE, KANSAS
GROUNDWATER SAMPLING RESULTS - BAG WAREHOUSE
B
a
g
W
a
r
e
h
o
u
s
e
Groundwater Recovery WellMonitoring Well Location
A: Perched
B: Alluvial
Plugged Monitoring Well
Permitted NPDES Outfall
Soil Boring Location
Not DetectedND
J Indicates Estimated Concentration
PW-5
PW-9
PW-6
PW-8
SW-10
PSW-19A
PSW-19B
PSW-20B
SB11
SB12
SB13
SB14
SB15
SB16
SB17
SB18
SB19
SB20
SB21
SB22
SB23
SB24
SB47
SB48
SB49
001A1
Property Boundary

0 40 120ft
Source: GOOGLE AERIAL IMAGE DATED SEPTEMBER 21, 2018
CAD File: I:\CAD\Files\Eight Digit Job Numbers\1115----\11152783-Lawrence_Farmland\Reports\11152783-02(002)Farmland Data Gap\11152783-02(002)GN-DL001.dwg
Sep 3, 2019
11152783-02
FIGURE 7
FORMER FARMLAND INDUSTRIES NITROGEN PLANT
2018 DATA GAP STUDY REPORT
1608 N 1400 ROAD, LAWRENCE, KANSAS
Monitoring Well Location Interceptor Trench Sump
A: Perched
B: Alluvial
Khehbiel Pond
Old West Pond
AST
#5
Plugged Monitoring Well
Permitted NPDES Outfall
West
Extension
Pond
Regional
Detention
Basin
Soil Boring Location
PW-2
PW-3A
PW-4A
OW-26
PSW-5A
PSW-5B2
PSW-18
SB1
SB10
SB2
SB25
SB26
SB27
SB28
SB29
SB3
SB30
SB31
SB32
SB33
SB34
SB35
SB36
SB4
SB5
SB6
SB7
SB8
SB9
001B1
NORTH SUMP
SOUTH SUMP
DAM POND SUMP
OLD WEST POND SUMP
Property Boundary
J Indicates Estimated Concentration

0 400ft200
Source: GOOGLE AERIAL IMAGE DATED SEPTEMBER 21, 2018
CAD File: I:\CAD\Files\Eight Digit Job Numbers\1115----\11152783-Lawrence_Farmland\Reports\11152783-02(002)Farmland Data Gap\11152783-02(002)GN-DL001.dwg
Sep 3, 2019
11152783-02
FIGURE 8
FORMER FARMLAND INDUSTRIES NITROGEN PLANT
2018 DATA GAP STUDY REPORT
1608 N 1400 ROAD, LAWRENCE, KANSAS
Groundwater Recovery Well
Monitoring Well Location Interceptor Trench Sump
A: Perched
B: Alluvial
Plugged Monitoring Well
Former
East
Effluent
Pond
West
Lime
Pond
Rundown
Pond
Overflow
Pond
East
Lime
Pond
Lime
Sludge
Landfill
Soil Boring Location
PSW-7A
PSW-7B2
PSW-7B1
SB37
SB38
SB39
SB40
SB41
SB42
SB43
SB44
SB45
SB46
NORTHEAST SUMP
SOUTHEAST SUMP
Property Boundary

0 20 50ft
Source: GOOGLE AERIAL IMAGE DATED SEPTEMBER 21, 2018
CAD File: I:\CAD\Files\Eight Digit Job Numbers\1115----\11152783-Lawrence_Farmland\Reports\11152783-02(002)Farmland Data Gap\11152783-02(002)GN-DL001.dwg
Sep 3, 2019
11152783-02
FIGURE 9
FORMER FARMLAND INDUSTRIES NITROGEN PLANT
2018 DATA GAP STUDY REPORT
1608 N 1400 ROAD, LAWRENCE, KANSAS
GROUNDWATER SAMPLING RESULTS - PSW-5A
Monitoring Well Location
A: Perched
B: Alluvial
Soil Boring Location
Not DetectedND
J Indicates Estimated Concentration
Property Boundary
Interceptor Trench Sump
Permitted NPDES Outfall
PW-2
PW-3A
PSW-5A
PSW-5B2
SB1
SB10
SB2
SB26
SB27
SB28
SB29
SB3
SB32
SB4
SB5
SB6
SB7
SB8
SB9
001B1
NORTH SUMP

GHD | Data Gap Study Report | 11152783 (02)
Tables

Table 1
Aquifer Testing SummaryFormer Farmland Industries Nitrogen Plant
Lawrence, Kansas
Page 1 of 1
PW-9 40-50 PW-19A, PW-19B, PW-20B, SW-10 13 10/8/2018 10/9/2018 +0.56 -0.35
PSW-3B3 47-57 PSW-5B2, PSW-6B4, PSW-7B2, PSW-6A 15 10/10/2018 10/11/2019 +9.65 -7.49
PSW-6B4 50-60 PSW-5B2, PSW-3B3, PSW-7B2, PSW-6A 24 10/10/2018 10/11/2019 +9.55 -8.38
PSW-7B2 42-57 PSW-5B2, PSW-3B3, PSW-6B4, PSW-6A 17 10/10/2018 10/12/2018 +10.58 -9.64
September 2019
Well Screen Interval (ft bgs) Initial Water Level Pumping Rate (gpm) Start Pumping End Pumping Total Drawdown
PW-9 40-50 19.64 63 9/4/2019, 11:00 am
9/5/2019, 11:25 am -2.04
PW-8 40-50 (est.) 17.43 -- -- -- -0.69
PSW-19A 5-15 17.50 -- -- -- -0.14 (dry)
PSW-19B 22-52 18.87 -- -- -- -0.92
PSW-20B 22-52 16.88 -- -- -- -0.38
SW-10 50-60 26.85 -- -- -- -0.23
Notes:
ft bgs - feet below ground surface
Drawdown (feet)Pumping Rate (gpm)
October 2018
Pumping Well ID
Date Pump Turned off Recovery (feet)
Date Pump Turned Back
OnObservation Well IDWell Screen
Interval (ft bgs)
GHD | Data Gap Study Report | 11152783 (02)

Table 2
Soil Sample SummaryFormer Farmland Industries Nitrogen Plant
Lawrence, Kansas
Page 1 of 4
SB-11 0.5-5 5/2/2019 14:50 SO-050219-NL-001SB-11 5-10 5/2/2019 14:55 SO-050219-NL-002SB-11 10-15 5/2/2019 15:05 SO-050219-NL-003
SB-12 0.5-5 5/3/2019 11:00 SO-050319-NL-008SB-12 5-10 5/3/2019 11:05 SO-050319-NL-009SB-12 10-15 5/3/2019 11:10 SO-050319-NL-010SB-12 15-20 5/3/2019 11:20 SO-050319-NL-011SB-12 20-24 5/3/2019 11:40 SO-050319-NL-012
SB-13 0.5-5 5/3/2019 9:05 SO-050319-NL-004SB-13 5-10 5/3/2019 9:15 SO-050319-NL-005SB-13 10-15 5/3/2019 9:25 SO-050319-NL-006SB-13 15-20 5/3/2019 9:30 SO-050319-NL-007
SB-14 0.5-5 5/3/2019 13:55 SO-050319-NL-013SB-14 15-20 5/3/2019 14:15 SO-050319-NL-016SB-14 20-24 5/3/2019 14:25 SO-050319-NL-017
SB-15 0.5-5 5/6/2019 9:00 SO-050619-NL-019SB-15 15-20 5/6/2019 9:25 SO-050619-NL-022SB-15 20-25 5/6/2019 9:50 SO-050619-NL-023
SB-16 0.5-5 5/6/2019 12:20 SO-050619-NL-029SB-16 20-25 5/6/2019 13:00 SO-050619-NL-033SB-16 25-28 5/6/2019 13:10 SO-050619-NL-034
SB-17 0.5-5 5/6/2019 14:10 SO-050619-NL-035SB-17 5-8 5/6/2019 14:20 SO-050619-NL-036
SB-18 0.5-4 5/6/2019 14:50 SO-050619-NL-037
SB-19 0.5-5 5/6/2019 15:10 SO-050619-NL-038SB-19 5-10 5/6/2019 15:20 SO-050619-NL-039SB-19 10-15 5/6/2019 15:30 SO-050619-NL-040
SB-20 5-10 5/6/2019 17:00 SO-050619-NL-044SB-20 15-20 5/6/2019 17:20 SO-050619-NL-046SB-20 20-25 5/6/2019 17:30 SO-050619-NL-047
SB-21 1-5 5/7/2019 10:10 SO-050719-NL-048SB-21 30-35 5/7/2019 10:55 SO-050719-NL-054SB-21 35-39.5 5/7/2019 11:00 SO-050719-NL-055
SB-22 1-5 5/7/2019 12:20 SO-050719-NL-056SB-22 20-25 5/7/2019 12:45 SO-050719-NL-060SB-22 30-35 5/7/2019 13:00 SO-050719-NL-062
Bag Warehouse Area
Location Interval (feet) Date Time Sample Number
GHD | Data Gap Study Report | 11152783 (02)

Table 2
Soil Sample SummaryFormer Farmland Industries Nitrogen Plant
Lawrence, Kansas
Page 2 of 4
Location Interval (feet) Date Time Sample Number
SB-23 1-5 5/7/2019 15:00 SO-050719-NL-063SB-23 5-10 5/7/2019 15:05 SO-050719-NL-064SB-23 20-25 5/7/2019 15:30 SO-050719-NL-067
SB-24 1-5 5/8/2019 11:20 SO-050819-NL-068SB-24 25-30 5/8/2019 12:10 SO-050819-NL-073SB-24 35-39 5/8/2019 12:35 SO-050819-NL-075
SB-47 0.5-5 5/17/2019 15:50 SO-051719-NL-191SB-47 20-25 5/17/2019 16:20 SO-051719-NL-195SB-47 30-35 5/17/2019 16:35 SO-051719-NL-197
SB-48 0.5-5 5/20/2019 11:50 SO-052019-NL-198SB-48 10-15 5/20/2019 12:00 SO-052019-NL-200SB-48 15-17 5/20/2019 12:05 SO-052019-NL-201
SB-49 0.5-5 5/20/2019 12:45 SO-052019-NL-202SB-49 10-15 5/20/2019 13:05 SO-052019-NL-204SB-49 15-15.5 5/20/2019 13:10 SO-052019-NL-205
SB-25 3-5 5/8/2019 15:00 SO-050819-NL-076SB-25 10-15 5/8/2019 15:10 SO-050819-NL-078SB-25 15-20 5/8/2019 15:25 SO-050819-NL-079SB-25 20-21 5/8/2019 15:30 SO-050819-NL-080
SB-26 10-15 5/8/2019 17:35 SO-050819-NL-083SB-26 20-25 5/8/2019 17:50 SO-050819-NL-085SB-26 25-30 5/8/2019 17:55 SO-050819-NL-086SB-26 30-35 5/8/2019 18:05 SO-050819-NL-087
SB-27 0.5-5 5/9/2019 10:30 SO-050919-NL-088SB-27 5-10 5/9/2019 10:35 SO-050919-NL-089SB-27 10-15 5/9/2019 10:45 SO-050919-NL-090SB-27 20-25 5/9/2019 11:05 SO-050919-NL-092SB-27 25-30 5/9/2019 11:15 SO-050919-NL-093
SB-28 5-10 5/9/2019 14:15 SO-050919-NL-095SB-28 10-15 5/9/2019 14:15 SO-050919-NL-097SB-28 15-20 5/9/2019 14:25 SO-050919-NL-098SB-28 25-30 5/9/2019 14:45 SO-050919-NL-100
SB-29 5-10 5/9/2019 16:05 SO-050919-NL-102SB-29 15-20 5/9/2019 16:25 SO-050919-NL-104SB-29 20-22 5/9/2019 16:35 SO-050919-NL-105
West Extension Pond Area
GHD | Data Gap Study Report | 11152783 (02)

Table 2
Soil Sample SummaryFormer Farmland Industries Nitrogen Plant
Lawrence, Kansas
Page 3 of 4
Location Interval (feet) Date Time Sample Number
SB-30 0.5-5 5/10/2019 9:05 SO-051019-NL-106SB-30 5-10 5/10/2019 9:10 SO-051019-NL-107SB-30 10-15 5/10/2019 9:20 SO-051019-NL-108SB-30 10-15 5/10/2019 9:20 SO-051019-NL-109SB-31 0.5-5 5/10/2019 11:30 SO-051019-NL-110SB-31 5-10 5/10/2019 11:35 SO-051019-NL-111
SB-32 5-10 5/10/2019 14:00 SO-051019-NL-113SB-32 10-15 5/10/2019 14:10 SO-051019-NL-114SB-32 10-15 5/10/2019 14:10 SO-051019-NL-115SB-32 15-19.5 5/10/2019 14:20 SO-051019-NL-116
SB-33 1-5 5/13/2019 9:50 SO-051319-NL-117SB-33 5-10 5/13/2019 10:00 SO-051319-NL-118SB-33 10-11 5/13/2019 10:10 SO-051319-NL-120
SB-34 0.5-5 5/13/2019 12:20 SO-051319-NL-121
SB-35 5-10 5/13/2019 14:35 SO-051319-NL-123SB-35 10-15 5/13/2019 14:45 SO-051319-NL-124SB-35 20-22 5/13/2019 15:05 SO-051319-NL-126
SB-36 1-5 5/13/2019 16:45 SO-051319-NL-127SB-36 5-10 5/13/2019 16:50 SO-051319-NL-128SB-36 10-15 5/13/2019 16:55 SO-051319-NL-129SB-36 15-17 5/13/2019 17:00 SO-051319-NL-130
SB-37 2-5 5/14/2019 9:40 SO-051419-NL-131SB-37 5-8 5/14/2019 9:45 SO-051419-NL-132SB-37 10-13 5/14/2019 9:50 SO-051419-NL-133SB-37 13-15 5/14/2019 9:55 SO-051419-NL-134
SB-38 5-9 5/14/2019 11:40 SO-051419-NL-136SB-38 10-14 5/14/2019 11:45 SO-051419-NL-137SB-38 16-20 5/14/2019 11:50 SO-051419-NL-138SB-38 23.5-25 5/14/2019 12:20 SO-051419-NL-139SB-38 33-35 5/14/2019 12:40 SO-051419-NL-140SB-38 40-41 5/14/2019 13:00 SO-051419-NL-142
SB-39 0.5-5 5/15/2019 9:10 SO-051519-NL-143SB-39 5-7 5/15/2019 9:15 SO-051519-NL-144SB-39 15-20 5/15/2019 9:20 SO-051519-NL-145SB-39 20-24 5/15/2019 9:40 SO-051519-NL-146SB-39 24-25 5/15/2019 9:45 SO-051519-NL-147
East and West Lime Ponds Area
GHD | Data Gap Study Report | 11152783 (02)

Table 2
Soil Sample SummaryFormer Farmland Industries Nitrogen Plant
Lawrence, Kansas
Page 4 of 4
Location Interval (feet) Date Time Sample Number
SB-40 5-8 5/15/2019 10:25 SO-051519-NL-149SB-40 14-15 5/15/2019 10:30 SO-051519-NL-150SB-40 17-20 5/15/2019 10:40 SO-051519-NL-151SB-40 20-25 5/15/2019 10:45 SO-051519-NL-152SB-40 25-26 5/15/2019 10:50 SO-051519-NL-153SB-40 26-28 5/15/2019 10:55 SO-051519-NL-154
SB-41 0-5 5/15/2019 12:40 SO-051519-NL-156SB-41 5-10 5/15/2019 12:50 SO-051519-NL-157SB-41 10-15 5/15/2019 12:55 SO-051519-NL-158SB-41 17-20 5/15/2019 13:15 SO-051519-NL-160
SB-42 0-5 5/15/2019 14:05 SO-051519-NL-161SB-42 5-10 5/15/2019 14:10 SO-051519-NL-162SB-42 10-15 5/15/2019 14:20 SO-051519-NL-163SB-42 20-25 5/15/2019 14:25 SO-051519-NL-164SB-42 25-30 5/15/2019 14:35 SO-051519-NL-165SB-42 31-33 5/15/2019 14:50 SO-051519-NL-167
SB-43 0.5-5 5/15/2019 16:25 SO-051519-NL-169SB-43 5-9 5/15/2019 16:30 SO-051519-NL-170SB-43 16.5-20 5/15/2019 16:40 SO-051519-NL-171SB-43 35-40 5/15/2019 17:20 SO-051519-NL-173
SB-44 0.5-5 5/17/2019 9:00 SO-051719-NL-174SB-44 5-10 5/17/2019 9:05 SO-051719-NL-175SB-44 20-25 5/17/2019 0:00 SO-051719-NL-176SB-44 26-27 5/17/2019 9:25 SO-051719-NL-178
SB-45 0.5-5 5/17/2019 10:40 SO-051719-NL-180SB-45 5-10 5/17/2019 10:45 SO-051719-NL-181SB-45 17.5-20 5/17/2019 10:55 SO-051719-NL-182SB-45 20-25 5/17/2019 11:00 SO-051719-NL-183SB-45 28-29 5/17/2019 11:05 SO-051719-NL-184
SB-46 0.5-5 5/17/2019 13:35 SO-051719-NL-186SB-46 5-6 5/17/2019 13:40 SO-051719-NL-187SB-46 15-19 5/17/2019 14:00 SO-051719-NL-LIMESB-46 19-20 5/17/2019 13:55 SO-051719-NL-188SB-46 20-25 5/17/2019 14:00 SO-051719-NL-189SB-46 38-40 5/17/2019 14:20 SO-051719-NL-190
GHD | Data Gap Study Report | 11152783 (02)

Table 3
Groundwater Sample SummaryFormer Farmland Industries Nitrogen Plant
Lawrence, Kansas
Page 1 of 4
SB-2 40-44 4/29/2019 17:05 6.44 13.83 0.788 WG-042919-NL-003SB-2 48-44 4/29/2019 16:55 6.33 14.16 1.458 WG-042919-NL-002SB-2 52-56 4/29/2019 16:45 5.98 15.46 3.409 WG-042919-NL-001
SB-3 40-44 5/1/2019 10:35 6.61 14.22 1.987 WG-050119-NL-006SB-3 44-48 5/1/2019 10:25 6.64 13.71 0.763 WG-050119-NL-005SB-3 44-48 5/1/2019 10:25 6.64 13.71 0.763 WG-050119-NL-005ASB-3 54-58 5/1/2019 10:05 6.32 13.34 3.286 WG-050119-NL-004
SB-4 40-44 5/1/2019 11:55 7.06 13.59 0.621 WG-050119-NL-009SB-4 44-48 5/1/2019 11:40 6.82 15.39 1.262 WG-050119-NL-008SB-4 56-60 5/1/2019 11:25 6.89 14.47 0.864 WG-050119-NL-007
SB-5 40-44 5/1/2019 13:15 6.93 14.8 1.576 WG-050119-NL-012SB-5 48-47 5/1/2019 13:05 7.04 13.77 0.998 WG-050119-NL-011SB-5 52-56 5/1/2019 12:50 6.96 13.86 2.771 WG-050119-NL-010SB-5 52-56 5/1/2019 12:50 6.96 13.86 2.771 WG-050119-NL-010A
SB-6 40-44 5/1/2019 14:35 6.73 13.73 0.638 WG-050119-NL-015SB-6 40-44 5/1/2019 14:35 6.73 13.73 0.638 WG-050119-NL-015ASB-6 44-48 5/1/2019 14:20 6.8 14.13 0.929 WG-050119-NL-014SB-6 52-56 5/1/2019 14:10 6.93 15.34 2.394 WG-050119-NL-013
SB-7 40-44 5/1/2019 15:35 7.07 14.44 1.258 WG-050119-NL-018SB-7 44-48 5/1/2019 15:25 6.85 14.7 1.684 WG-050119-NL-017SB-7 52-56 5/1/2019 15:15 6.83 15.03 3.044 WG-050119-NL-016
SB-8 40-44 5/1/2019 16:40 6.73 15.48 1.849 WG-050119-NL-021SB-8 44-48 5/1/2019 16:30 6.77 15.63 1.868 WG-050119-NL-020SB-8 44-48 5/1/2019 16:30 6.77 15.63 1.868 WG-050119-NL-020ASB-8 52-56 5/1/2019 16:15 7.05 15.14 3.288 WG-050119-NL-019
SB-9 40-44 5/2/2019 10:45 6.73 14.11 1.33 WG-050219-NL-024SB-9 44-48 5/2/2019 10:35 6.59 13.87 1.221 WG-050219-NL-023SB-9 52-57 5/2/2019 10:25 6.58 14.16 3.228 WG-050219-NL-022
SB-10 40-44 5/2/2019 12:00 6.87 13.68 0.516 WG-050219-NL-027SB-10 44-48 5/2/2019 11:50 6.51 13.39 1.012 WG-050219-NL-026SB-10 52-56 5/2/2019 11:40 6.61 13.96 2.913 WG-050219-NL-025SB-10 52-56 5/2/2019 11:40 6.61 13.96 2.913 WG-050219-NL-025A
SB-11 21-25 5/2/2019 15:55 6.98 12.6 0.486 WG-050219-NL-031SB-11 31-35 5/2/2019 15:40 7.14 14.01 0.653 WG-050219-NL-030SB-11 31-35 5/2/2019 15:40 7.14 14.01 0.653 WG-050219-NL-030A
PSW-5A Area
Bag Warehouse Area
Sample NumberTemperature (°C)
Conductivity (mS/cm)Location Interval
(feet bgs) Date Time pH
GHD | Data Gap Study Report | 11152783 (02)

Table 3
Groundwater Sample SummaryFormer Farmland Industries Nitrogen Plant
Lawrence, Kansas
Page 2 of 4
Sample NumberTemperature (°C)
Conductivity (mS/cm)Location Interval
(feet bgs) Date Time pH
SB-11 41-45 5/2/2019 15:35 6.65 13.19 1.148 WG-050219-NL-029SB-11 48-52 5/2/2019 15:30 6.64 14.1 1.221 WG-050219-NL-028
SB-12 24-25 5/3/2019 12:10 6.45 12.74 0.609 WG-050319-NL-039SB-12 31-35 5/3/2019 12:00 6.53 13.09 0.762 WG-050319-NL-038SB-12 41-45 5/3/2019 11:55 6.45 14.08 1.294 WG-050319-NL-037SB-12 48-52 5/3/2019 11:50 6.57 14.05 1.373 WG-050319-NL-036SB-12 48-52 5/3/2019 11:50 6.57 14.05 1.373 WG-050319-NL-036A
SB-13 15-19 5/3/2019 10:30 6.76 12.14 0.291 WG-050319-NL-035SB-13 21-25 5/3/2019 10:30 6.64 12.67 0.503 WG-050319-NL-034SB-13 31-35 5/3/2019 10:10 6.68 13.13 0.561 WG-050319-NL-033SB-13 43-47 5/3/2019 10:05 6.55 13.37 1.469 WG-050319-NL-032
SB-14 23-27 5/3/2019 15:05 6.91 13.51 0.941 WG-050319-NL-043SB-14 25-31 5/3/2019 14:55 6.95 13.25 0.525 WG-050319-NL-042SB-14 45-51 5/3/2019 14:45 7.00 13.24 0.763 WG-050319-NL-041SB-14 48-52 5/3/2019 14:35 6.87 13.39 1.401 WG-050319-NL-040SB-14 48-52 5/3/2019 14:35 6.87 13.39 1.401 WG-050319-NL-040A
SB-15 22-26 5/6/2019 11:30 6.95 15.95 1.754 WG-050619-NL-046SB-15 43-49 5/6/2019 11:15 7.35 14.93 2.155 WG-050619-NL-045SB-15 43-49 5/6/2019 11:15 7.35 14.93 2.155 WG-050619-NL-045ASB-15 53-57 5/6/2019 11:10 7.28 14.15 1.418 WG-050619-NL-044
SB-19 9-13 5/6/2019 16:15 7.96 16.85 0.49 WG-050619-NL-049SB-19 14-18 5/6/2019 16:10 7.92 14.96 0.338 WG-050619-NL-048SB-19 27-31 5/6/2019 16:00 7.41 19.14 0.4 WG-050619-NL-047
SB-20 25-29 5/6/2019 17:45 6.74 16.6 0.22 WG-050619-NL-052SB-20 41-45 5/6/2019 17:40 6.64 16.77 0.771 WG-050619-NL-051SB-20 53.5-57.5 5/6/2019 17:35 7.53 18.01 0.7 WG-050619-NL-050SB-20 53.5-57.5 5/6/2019 17:35 7.53 18.01 0.7 WG-050619-NL-050A
SB-21 41-45 5/7/2019 11:35 6.76 13.17 0.788 WG-050719-NL-054SB-21 54.5-58.5 5/7/2019 11:25 5.86 13.49 0.803 WG-050719-NL-053
SB-22 31-35 5/7/2019 14:25 6.9 1.333 15.52 WG-050719-NL-057SB-22 41-45 5/7/2019 14:15 6.76 1.149 14.38 WG-050719-NL-056SB-22 55-59 5/7/2019 14:05 7.22 0.862 14.76 WG-050719-NL-055SB-22 55-59 5/7/2019 14:05 7.22 0.862 14.76 WG-050719-NL-055A
SB-23 34-38 5/8/2019 10:10 6.53 14.14 1.568 WG-050819-NL-060SB-23 34-38 5/8/2019 10:10 6.53 14.14 1.568 WG-050819-NL-060ASB-23 41-45 5/8/2019 9:55 6.5 14.13 1.676 WG-050819-NL-059SB-23 46-50 5/8/2019 9:35 6.83 14.32 2.332 WG-050819-NL-058
GHD | Data Gap Study Report | 11152783 (02)

Table 3
Groundwater Sample SummaryFormer Farmland Industries Nitrogen Plant
Lawrence, Kansas
Page 3 of 4
Sample NumberTemperature (°C)
Conductivity (mS/cm)Location Interval
(feet bgs) Date Time pH
SB-24 40-44 5/8/2019 13:35 6.89 15.79 1.579 WG-050819-NL-062SB-24 52-56 5/8/2019 13:25 6.93 17.51 1.738 WG-050819-NL-061
SB-47 31-35 5/20/2019 10:20 7.55 15.04 1.136 WG-052019-NL-105SB-47 31-35 5/20/2019 10:20 7.55 15.04 1.136 WG-052019-NL-105ASB-47 41-45 5/20/2019 10:10 7.69 14.53 0.987 WG-052019-NL-104SB-47 52-56 5/20/2019 9:55 7.43 13.9 1.142 WG-052019-NL-103
SB-48 16-20 5/20/2019 12:20 7.12 0.368 12.31 WG-052019-NL-108SB-48 31-35 5/20/2019 12:15 6.47 0.653 12.77 WG-052019-NL-107SB-48 44-48 5/20/2019 12:10 6.87 0.888 12.68 WG-052019-NL-106
SB-49 15-19 5/20/2019 13:35 7.13 0.66 12.3 WG-052019-NL-111SB-49 31-35 5/20/2019 13:25 7.03 0.779 12.77 WG-052019-NL-110SB-49 31-35 5/20/2019 13:25 7.03 0.779 12.77 WG-052019-NL-110ASB-49 42-46 5/20/2019 13:15 6.98 1.113 12.49 WG-052019-NL-109
SB-25 41-45 5/8/2019 13:35 6.51 18.32 6.004 WG-050819-NL-064SB-25 61-65 5/8/2019 13:25 7.13 16.82 6.181 WG-050819-NL-063
SB-26 35-39 5/9/2019 10:05 7.62 12.11 7.053 WG-050919-NL-067SB-26 41-45 5/9/2019 9:55 7.39 12.31 5.648 WG-050919-NL-066SB-26 52-56 5/9/2019 9:45 7.19 12.6 5.297 WG-050919-NL-065SB-26 52-56 5/9/2019 9:45 7.19 12.6 5.297 WG-050919-NL-065A
SB-27 31-35 5/9/2019 12:10 6.99 12.31 3.929 WG-050919-NL-070SB-27 31-35 5/9/2019 12:10 6.99 12.31 3.929 WG-050919-NL-070ASB-27 41-45 5/9/2019 12:05 6.9 12.43 5.992 WG-050919-NL-069SB-27 52-56 5/9/2019 12:00 6.84 12.87 6.395 WG-050919-NL-068
SB-28 20-24 5/9/2019 15:30 6.9 2.738 13.29 WG-050919-NL-074SB-28 31-35 5/9/2019 15:25 6.92 3.157 13.02 WG-050919-NL-073SB-28 41-45 5/9/2019 15:15 7.04 4.5 13.55 WG-050919-NL-072SB-28 52-56 5/9/2019 15:10 6.8 5.449 13.63 WG-050919-NL-071
SB-29 21-25 5/9/2019 17:15 7.19 3.128 10.88 WG-050919-NL-078SB-29 31-35 5/9/2019 17:00 7.19 3.128 10.88 WG-050919-NL-077SB-29 41-45 5/9/2019 16:50 6.89 4.053 12.91 WG-050919-NL-076SB-29 51-55 5/9/2019 16:45 6.45 5.577 11.94 WG-050919-NL-075SB-29 51-55 5/9/2019 16:45 6.45 5.577 11.94 WG-050919-NL-075A
SB-30 31-35 5/10/2019 10:30 6.82 1.33 13.78 WG-051019-NL-081SB-30 41-45 5/10/2019 10:10 6.92 4.716 15.23 WG-051019-NL-080SB-30 41-45 5/10/2019 10:10 6.92 4.716 15.23 WG-051019-NL-080A
West Extension Pond Area
GHD | Data Gap Study Report | 11152783 (02)

Table 3
Groundwater Sample SummaryFormer Farmland Industries Nitrogen Plant
Lawrence, Kansas
Page 4 of 4
Sample NumberTemperature (°C)
Conductivity (mS/cm)Location Interval
(feet bgs) Date Time pH
SB-30 50-54 5/10/2019 10:05 6.59 4.93 15.01 WG-051019-NL-079
SB-31 15-19 5/10/2019 12:50 6.94 2.102 12.89 WG-051019-NL-079B
SB-32 10-14 5/10/2019 15:15 7.05 2.91 16.35 WG-051019-NL-085SB-32 31-35 5/10/2019 15:05 7.05 2.91 16.35 WG-051019-NL-084SB-32 41-45 5/10/2019 14:55 6.95 1.829 14.91 WG-051019-NL-083SB-32 52-56 5/10/2019 14:50 6.74 4.103 16.29 WG-051019-NL-082SB-32 52-56 5/10/2019 14:50 6.74 4.103 16.29 WG-051019-NL-082ASB-33 11-15 5/13/2019 11:20 8.07 13.19 3.759 WG-051319-NL-088SB-33 41-45 5/13/2019 11:10 6.84 18.5 6.71 WG-051319-NL-087SB-33 66-70 5/13/2019 11:00 6.64 16.13 8.41 WG-051319-NL-086SB-33 66-70 5/13/2019 11:00 6.64 16.13 8.41 WG-051319-NL-086A
SB-34 51-55 5/13/2019 13:00 6.46 0.585 18.64 WG-051319-NL-089
SB-36 15-19 5/13/2019 18:20 9.48 22.12 12.18 WG-051319-NL-094SB-36 31-35 5/13/2019 18:10 6.94 115.3 14.37 WG-051319-NL-093SB-36 51-55 5/13/2019 17:50 7.39 4.262 17.63 WG-051319-NL-091SB-36 51-55 5/13/2019 17:50 7.39 4.262 17.63 WG-051319-NL-091ASB-36 63-67 5/13/2019 17:40 7.97 4.446 19.97 WG-051319-NL-090
SB-37 11-15 5/14/2019 10:50 8.03 3858 14.29 WG-051419-NL-095
SB-38 41-45 5/14/2019 14:00 7.89 0.612 19.93 WG-051419-NL-097SB-38 64-68 5/14/2019 13:50 7.58 0.528 19.36 WG-051419-NL-096
SB-40 24-28 5/15/2019 11:15 7.35 5.597 17.92 WG-051519-NL-098
SB-41 15-19 5/15/2019 13:30 8.59 45.23 15.83 WG-051519-NL-099
SB-42 62-66 5/15/2019 15:25 8.69 0.671 19.31 WG-051519-NL-100SB-42 62-66 5/15/2019 15:25 8.69 0.671 19.31 WG-051519-NL-100A
SB-45 29-33 5/17/2019 11:10 6.9 1.833 18.4 WG-051719-NL-102SB-45 62-66 5/17/2019 11:40 7.82 0.652 18.6 WG-051719-NL-101
Notes:
bgs - below ground surface°C - degrees celsiusmS/cm - milli-siemens per centimeter
East and West Lime Ponds Area
GHD | Data Gap Study Report | 11152783 (02)

Table 4
Soil Analytical Results SummaryFormer Farmland Industries Nitrogen Plant
Lawrence, Kansas
Page 1 of 5
Am
mon
ia
Nitr
ite/N
itrat
e
Perc
ent M
oist
ure
Units mg/kg mg/kg %Lab PACE PACE PACE
Location Sample Number Date Depth
SB-11 SO-050219-NL-001 5/2/2019 (0.5-5) ft ND(1.5) ND(1.4) 30.8 SB-11 SO-050219-NL-002 5/2/2019 (5-10) ft ND(1.4) ND(1.5) 31.9 SB-11 SO-050219-NL-003 5/2/2019 (10-15) ft ND(1.2) 2.9 J 19.7
SB-12 SO-050319-NL-008 5/3/2019 (0.5-5) ft ND(1.3) ND(1.3) 25.9 SB-12 SO-050319-NL-009 5/3/2019 (5-10) ft ND(1.1) ND(1.2) 14.6 SB-12 SO-050319-NL-010 5/3/2019 (10-15) ft ND(1.2) ND(1.2) 17.5 SB-12 SO-050319-NL-011 5/3/2019 (15-20) ft ND(1.2) ND(1.1) 15.5 SB-12 SO-050319-NL-012 5/3/2019 (20-24) ft ND(1.0) ND(1.0) 3.8
SB-13 SO-050319-NL-004 5/3/2019 (0.5-5) ft ND(1.3) ND(1.3) 23.9 SB-13 SO-050319-NL-005 5/3/2019 (5-10) ft ND(1.2) ND(1.3) 21.3 SB-13 SO-050319-NL-006 5/3/2019 (10-15) ft ND(1.2) ND(1.2) 18.2 SB-13 SO-050319-NL-007 5/3/2019 (15-20) ft ND(1.2) ND(1.2) 17.6
SB-14 SO-050319-NL-013 5/3/2019 (0.5-5) ft ND(1.3) J ND(1.3) 27.8 SB-14 SO-050319-NL-015 5/3/2019 (5-10) ft ND(1.1) J ND(1.1) 17.2 SB-14 SO-050319-NL-017 5/3/2019 (20-24) ft ND(1.0) J ND(1.0) 8.1
SB-15 SO-050619-NL-019 5/6/2019 (0.5-5) ft ND(1.2) J ND(1.2) 19.0 SB-15 SO-050619-NL-022 5/6/2019 (15-20) ft 13.9 J ND(1.2) 17.0 SB-15 SO-050619-NL-023 5/6/2019 (20-25) ft ND(1.2) J ND(1.2) 20.3
SB-16 SO-050619-NL-029 5/6/2019 (0.5-5) ft ND(1.2) J 4.3 16.0 SB-16 SO-050619-NL-033 5/6/2019 (20-25) ft 787 J 50.3 J 17.9 SB-16 SO-050619-NL-034 5/6/2019 (25-28) ft 440 J 55.4 J 17.5
SB-17 SO-050619-NL-035 5/6/2019 (0.5-5) ft ND(1.1) J ND(1.1) 16.8 SB-17 SO-050619-NL-036 5/6/2019 (5-8) ft ND(1.1) J ND(1.1) 12.0
SB-18 SO-050619-NL-037 5/6/2019 (0.5-4) ft ND(1.1) J 2.4 J 14.8
SB-19 SO-050619-NL-038 5/6/2019 (0.5-5) ft ND(1.2) J ND(1.2) 20.3 SB-19 SO-050619-NL-039 5/6/2019 (5-10) ft ND(1.2) J 3.5 J 18.9 SB-19 SO-050619-NL-040 5/6/2019 (10-15) ft 17.9 J 3.4 J 21.6
SB-20 SO-050619-NL-043 5/6/2019 (0.5-5) ft 68.2 J ND(1.2) 20.1 SB-20 SO-050619-NL-046 5/6/2019 (15-20) ft 7.4 J 2.1 J 23.0 SB-20 SO-050619-NL-047 5/6/2019 (20-25) ft 58.5 J ND(1.3) 26.1
Bag Warehouse Area
GHD | Data Gap Study Report | 11152783 (02)

Table 4
Soil Analytical Results SummaryFormer Farmland Industries Nitrogen Plant
Lawrence, Kansas
Page 2 of 5
Am
mon
ia
Nitr
ite/N
itrat
e
Perc
ent M
oist
ure
Units mg/kg mg/kg %Lab PACE PACE PACE
Location Sample Number Date DepthSB-21 SO-050719-NL-048 5/7/2019 (1-5) ft 260 J ND(1.2) 21.3 SB-21 SO-050719-NL-054 5/7/2019 (30-35) ft 195 J ND(1.4) 33.0 SB-21 SO-050719-NL-055 5/7/2019 (35-39.5) ft 10.2 J 6.5 J 23.6
SB-22 SO-050719-NL-056 5/7/2019 (1-5) ft 117 J 16.7 19.5 SB-22 SO-050719-NL-060 5/7/2019 (20-25) ft 2.2 J 36.1 22.7 SB-22 SO-050719-NL-062 5/7/2019 (30-35) ft 11.3 J 17.1 24.4
SB-23 SO-050719-NL-063 5/7/2019 (1-5) ft 94.1 J ND(1.3) 26.2 SB-23 SO-050719-NL-064 5/7/2019 (5-10) ft 58.3 J ND(1.2) 19.9 SB-23 SO-050719-NL-067 5/7/2019 (20-25) ft ND(1.3) J ND(1.3) 21.3
SB-24 SO-050819-NL-068 5/8/2019 (1-5) ft ND(1.2) J ND(1.2) 20.6 SB-24 SO-050819-NL-073 5/8/2019 (25-30) ft 44.7 J 4.7 24.4 SB-24 SO-050819-NL-075 5/8/2019 (35-39) ft 112 J ND(1.2) 24.8
SB-47 SO-051719-NL-191 5/17/2019 (0.5-5) ft ND(1.1) ND(1.2) J 16.7 SB-47 SO-051719-NL-195 5/17/2019 (20-25) ft ND(1.2) ND(1.2) J 18.4 SB-47 SO-051719-NL-197 5/17/2019 (30-35) ft 25.1 ND(1.2) J 17.7
SB-48 SO-052019-NL-198 5/20/2019 (0.5-5) ft ND(1.1) 2.5 J 12.1 SB-48 SO-052019-NL-200 5/20/2019 (10-15) ft ND(1.1) 4.3 J 10.2 SB-48 SO-052019-NL-201 5/20/2019 (15-17) ft ND(1.1) 1.8 J 10.1
SB-49 SO-052019-NL-202 5/20/2019 (0.5-5) ft ND(1.1) ND(1.1) J 12.6 SB-49 SO-052019-NL-204 5/20/2019 (10-15) ft ND(1.2) 2.6 18.1 SB-49 SO-052019-NL-205 5/20/2019 (15-15.5) ft ND(1.1) 1.6 13.2
SB-25 SO-050819-NL-076 5/8/2019 (3-5) ft 37.5 J 162 17.4 SB-25 SO-050819-NL-078 5/8/2019 (10-15) ft 3260 J 736 18.9 SB-25 SO-050819-NL-079 5/8/2019 (15-20) ft 6260 J 1710 22.9 SB-25 SO-050819-NL-080 5/8/2019 (20-21) ft 4820 J 1800 23.1
SB-26 SO-050819-NL-083 5/8/2019 (10-15) ft 1220 J 1290 20.8 SB-26 SO-050819-NL-085 5/8/2019 (20-25) ft 18.3 J 351 24.0 SB-26 SO-050819-NL-086 5/8/2019 (25-30) ft 245 J 145 33.0 SB-26 SO-050819-NL-087 5/8/2019 (30-35) ft 200 J 153 28.1
SB-27 SO-050919-NL-088 5/9/2019 (0.5-5) ft 4650 J 1740 18.6 SB-27 SO-050919-NL-089 5/9/2019 (5-10) ft 5850 J 3100 22.3 SB-27 SO-050919-NL-090 5/9/2019 (10-15) ft 8520 J 5120 22.7
West Extension Pond Area
GHD | Data Gap Study Report | 11152783 (02)
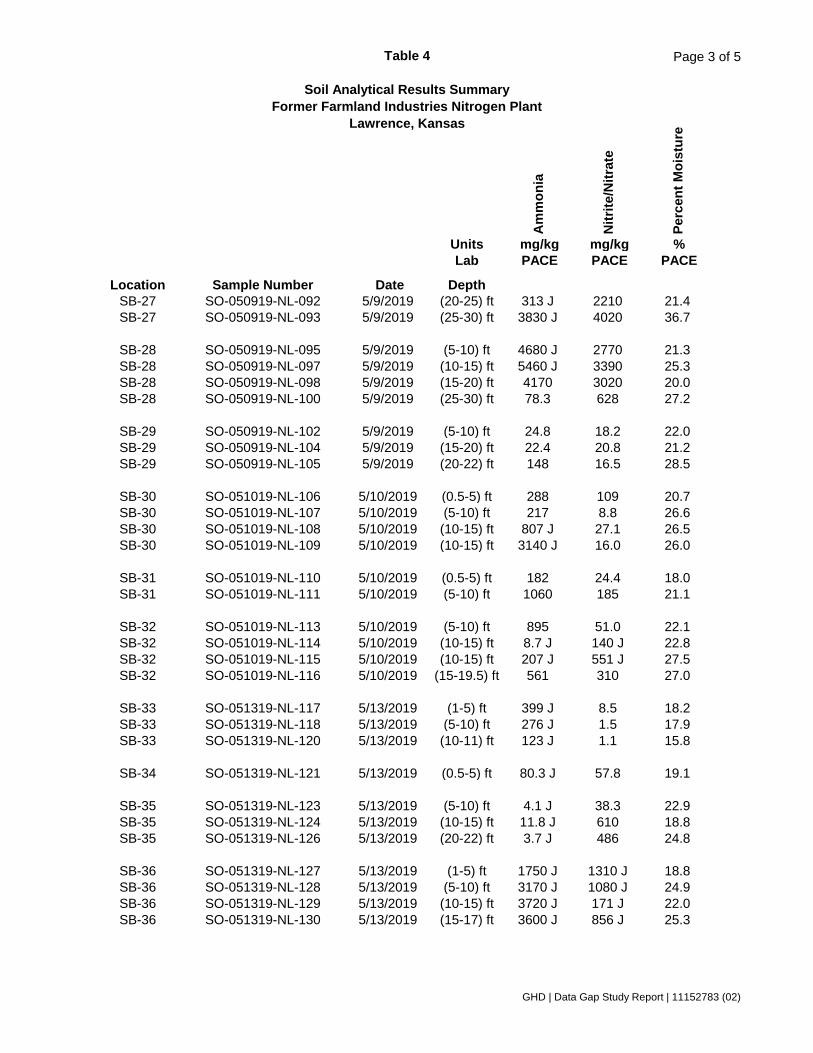
Table 4
Soil Analytical Results SummaryFormer Farmland Industries Nitrogen Plant
Lawrence, Kansas
Page 3 of 5
Am
mon
ia
Nitr
ite/N
itrat
e
Perc
ent M
oist
ure
Units mg/kg mg/kg %Lab PACE PACE PACE
Location Sample Number Date DepthSB-27 SO-050919-NL-092 5/9/2019 (20-25) ft 313 J 2210 21.4 SB-27 SO-050919-NL-093 5/9/2019 (25-30) ft 3830 J 4020 36.7
SB-28 SO-050919-NL-095 5/9/2019 (5-10) ft 4680 J 2770 21.3 SB-28 SO-050919-NL-097 5/9/2019 (10-15) ft 5460 J 3390 25.3 SB-28 SO-050919-NL-098 5/9/2019 (15-20) ft 4170 3020 20.0 SB-28 SO-050919-NL-100 5/9/2019 (25-30) ft 78.3 628 27.2
SB-29 SO-050919-NL-102 5/9/2019 (5-10) ft 24.8 18.2 22.0 SB-29 SO-050919-NL-104 5/9/2019 (15-20) ft 22.4 20.8 21.2 SB-29 SO-050919-NL-105 5/9/2019 (20-22) ft 148 16.5 28.5
SB-30 SO-051019-NL-106 5/10/2019 (0.5-5) ft 288 109 20.7 SB-30 SO-051019-NL-107 5/10/2019 (5-10) ft 217 8.8 26.6 SB-30 SO-051019-NL-108 5/10/2019 (10-15) ft 807 J 27.1 26.5 SB-30 SO-051019-NL-109 5/10/2019 (10-15) ft 3140 J 16.0 26.0
SB-31 SO-051019-NL-110 5/10/2019 (0.5-5) ft 182 24.4 18.0 SB-31 SO-051019-NL-111 5/10/2019 (5-10) ft 1060 185 21.1
SB-32 SO-051019-NL-113 5/10/2019 (5-10) ft 895 51.0 22.1 SB-32 SO-051019-NL-114 5/10/2019 (10-15) ft 8.7 J 140 J 22.8 SB-32 SO-051019-NL-115 5/10/2019 (10-15) ft 207 J 551 J 27.5 SB-32 SO-051019-NL-116 5/10/2019 (15-19.5) ft 561 310 27.0
SB-33 SO-051319-NL-117 5/13/2019 (1-5) ft 399 J 8.5 18.2 SB-33 SO-051319-NL-118 5/13/2019 (5-10) ft 276 J 1.5 17.9 SB-33 SO-051319-NL-120 5/13/2019 (10-11) ft 123 J 1.1 15.8
SB-34 SO-051319-NL-121 5/13/2019 (0.5-5) ft 80.3 J 57.8 19.1
SB-35 SO-051319-NL-123 5/13/2019 (5-10) ft 4.1 J 38.3 22.9 SB-35 SO-051319-NL-124 5/13/2019 (10-15) ft 11.8 J 610 18.8 SB-35 SO-051319-NL-126 5/13/2019 (20-22) ft 3.7 J 486 24.8
SB-36 SO-051319-NL-127 5/13/2019 (1-5) ft 1750 J 1310 J 18.8 SB-36 SO-051319-NL-128 5/13/2019 (5-10) ft 3170 J 1080 J 24.9 SB-36 SO-051319-NL-129 5/13/2019 (10-15) ft 3720 J 171 J 22.0 SB-36 SO-051319-NL-130 5/13/2019 (15-17) ft 3600 J 856 J 25.3
GHD | Data Gap Study Report | 11152783 (02)

Table 4
Soil Analytical Results SummaryFormer Farmland Industries Nitrogen Plant
Lawrence, Kansas
Page 4 of 5
Am
mon
ia
Nitr
ite/N
itrat
e
Perc
ent M
oist
ure
Units mg/kg mg/kg %Lab PACE PACE PACE
Location Sample Number Date Depth
SB-37 SO-051419-NL-131 5/14/2019 (2-5) ft ND(1.2) 3.0 J 18.0 SB-37 SO-051419-NL-132 5/14/2019 (5-8) ft 4.1 J 2.0 J 19.8 SB-37 SO-051419-NL-133 5/14/2019 (10-13) ft 20.1 J ND(1.3) J 22.8 SB-37 SO-051419-NL-134 5/14/2019 (13-15) ft 147 J 11.8 J 18.8
SB-38 SO-051419-NL-136 5/14/2019 (5-9) ft ND(1.5) J 20.2 J 31.8 SB-38 SO-051419-NL-137 5/14/2019 (10-14) ft 766 J 768 J 40.2 SB-38 SO-051419-NL-138 5/14/2019 (16-20) ft 141 J 351 J 19.5 SB-38 SO-051419-NL-139 5/14/2019 (23.5-25) ft ND(1.3) J 505 J 21.4 SB-38 SO-051419-NL-140 5/14/2019 (33-35) ft 58.3 J 1.5 J 22.2 SB-38 SO-051419-NL-142 5/14/2019 (40-41) ft 151 J 16.7 J 26.5
SB-39 SO-051519-NL-143 5/15/2019 (0.5-5) ft ND(1.2) J 1.8 J 17.5 SB-39 SO-051519-NL-144 5/15/2019 (5-7) ft 2.9 J ND(1.5) J 32.6 SB-39 SO-051519-NL-145 5/15/2019 (15-20) ft 411 J 376 J 35.6 SB-39 SO-051519-NL-146 5/15/2019 (20-24) ft 896 J 280 J 20.4 SB-39 SO-051519-NL-147 5/15/2019 (24-25) ft 680 J 240 J 22.5
SB-40 SO-051519-NL-149 5/15/2019 (5-8) ft 7.0 J 2.0 J 26.7 SB-40 SO-051519-NL-150 5/15/2019 (14-15) ft 158 170 40.1 SB-40 SO-051519-NL-151 5/15/2019 (17-20) ft 563 J 3.8 18.3 SB-40 SO-051519-NL-152 5/15/2019 (20-25) ft 232 J 36.2 18.2 SB-40 SO-051519-NL-153 5/15/2019 (25-26) ft 218 J 34.3 21.4 SB-40 SO-051519-NL-154 5/15/2019 (26-28) ft 193 J 124 31.0
SB-41 SO-051519-NL-156 5/15/2019 (0-5) ft ND(1.3) J 4.5 27.9 SB-41 SO-051519-NL-157 5/15/2019 (5-10) ft 77.8 J 805 22.3 SB-41 SO-051519-NL-158 5/15/2019 (10-15) ft 1650 J 931 25.6 SB-41 SO-051519-NL-160 5/15/2019 (17-20) ft 3130 J 1030 19.1
SB-42 SO-051519-NL-161 5/15/2019 (0-5) ft ND(1.3) 10.9 27.8 SB-42 SO-051519-NL-162 5/15/2019 (5-10) ft 24.9 J 282 21.2 SB-42 SO-051519-NL-163 5/15/2019 (10-15) ft 475 J 885 26.6 SB-42 SO-051519-NL-164 5/15/2019 (20-25) ft 3650 J 1450 23.5 SB-42 SO-051519-NL-165 5/15/2019 (25-30) ft 5860 J 2600 21.7 SB-42 SO-051519-NL-167 5/15/2019 (31-33) ft 3390 J 1890 29.2
SB-43 SO-051519-NL-169 5/15/2019 (0.5-5) ft 2030 J 1390 23.7 SB-43 SO-051519-NL-170 5/15/2019 (5-9) ft 1570 J 822 22.6 SB-43 SO-051519-NL-171 5/15/2019 (16.5-20) ft 56.3 J 38.7 20.6 SB-43 SO-051519-NL-173 5/15/2019 (35-40) ft 19.9 J 54.1 22.3
East and West Lime Ponds Area
GHD | Data Gap Study Report | 11152783 (02)

Table 4
Soil Analytical Results SummaryFormer Farmland Industries Nitrogen Plant
Lawrence, Kansas
Page 5 of 5
Am
mon
ia
Nitr
ite/N
itrat
e
Perc
ent M
oist
ure
Units mg/kg mg/kg %Lab PACE PACE PACE
Location Sample Number Date Depth
SB-44 SO-051719-NL-174 5/17/2019 (0.5-5) ft 38.3 J 107 21.7 SB-44 SO-051719-NL-175 5/17/2019 (5-10) ft 475 J 2640 20.6 SB-44 SO-051719-NL-176 5/17/2019 (20-25) ft 193 J 102 J 15.7 SB-44 SO-051719-NL-178 5/17/2019 (26-27) ft 37.1 J 85.9 J 26.7
SB-45 SO-051719-NL-180 5/17/2019 (0.5-5) ft 5.4 J 3.0 J 15.8 SB-45 SO-051719-NL-181 5/17/2019 (5-10) ft 2.9 J 59.2 J 19.0 SB-45 SO-051719-NL-182 5/17/2019 (17.5-20) ft 33.7 J ND(1.2) J 18.9 SB-45 SO-051719-NL-183 5/17/2019 (20-25) ft 43.3 21.3 J 18.3 SB-45 SO-051719-NL-184 5/17/2019 (28-29) ft 6.7 37.5 J 16.1
SB-46 SO-051719-NL-186 5/17/2019 (0.5-5) ft 1150 519 J 21.1 SB-46 SO-051719-NL-187 5/17/2019 (5-6) ft 346 335 J 19.1 SB-46 SO-051719-NL-188 5/17/2019 (19-20) ft 36.2 4.8 J 16.2 SB-46 SO-051719-NL-189 5/17/2019 (20-25) ft ND(1.1) 72.8 J 15.9 SB-46 SO-051719-NL-190 5/17/2019 (38-40) ft 10.5 34.6 J 17.1 SB-46 SO-051719-NL-SB-46 (LIME) 5/17/2019 (15-19) ft 9.9 35.6 J 45.9
Notes:
mg/kg - milligram per kilogramPACE Pace Analytical Laboratories, Lenexa, Kansasft - feetND - not detected at the associated reporting limitJ - estimated concentration
GHD | Data Gap Study Report | 11152783 (02)

Table 5
Groundwater Analytical Results SummaryFormer Farmland Industries Nitrogen Plant
Lawrence, Kansas
Page 1 of 4
Am
mon
ia
Am
mon
ia -
N
Nitr
ite /
Nitr
ate
Nitr
ite /
Nitr
ate
Units mg/L mg/L mg/L mg/LLab PACE CLMSLA PACE CLMSLA
MCL 1 NS 2 NS 1 / 10 1 / 10
Location Sample Number Date Depth
SB-2 WG-042919-NL-003 4/29/2019 (40-44) ft -- 26.9 -- 0.316SB-2 WG-042919-NL-002 4/29/2019 (48-44) ft -- 47.5 -- 0.32SB-2 WG-042919-NL-001 4/29/2019 (52-56) ft -- 288 -- 0.256SB-3 WG-050119-NL-006 5/1/2019 (40-44) ft -- 105 -- 0.358SB-3 WG-050119-NL-005 5/1/2019 (44-48) ft -- 9.04 -- 0.465SB-3 WG-050119-NL-005A 5/1/2019 (44-48) ft 9.9 -- 0.10U J --SB-3 WG-050119-NL-004 5/1/2019 (54-58) ft -- 235 -- 0.284SB-4 WG-050119-NL-008 5/1/2019 (44-48) ft -- 15 -- 0.583SB-4 WG-050119-NL-009 5/1/2019 (44-40) ft -- 5.16 -- 0.421SB-4 WG-050119-NL-007 5/1/2019 (56-60) ft -- 6.42 -- 0.321SB-5 WG-050119-NL-012 5/1/2019 (40-44) ft -- 16.6 -- 0.355SB-5 WG-050119-NL-011 5/1/2019 (48-47) ft -- 7.22 -- 0.417SB-5 WG-050119-NL-010 5/1/2019 (52-56) ft -- 56.1 -- 0.428SB-5 WG-050119-NL-010A 5/1/2019 (52-56) ft 57.4 -- 0.10U J --SB-6 WG-050119-NL-015 5/1/2019 (40-44) ft -- 6.26 -- 0.362SB-6 WG-050119-NL-015A 5/1/2019 (40-44) ft 7.7 J -- 0.10U J --SB-6 WG-050119-NL-014 5/1/2019 (44-48) ft -- 12.8 -- 0.379SB-6 WG-050119-NL-013 5/1/2019 (52-56) ft -- 42.3 -- 0.366SB-7 WG-050119-NL-018 5/1/2019 (40-44) ft -- 49.8 -- 0.302SB-7 WG-050119-NL-017 5/1/2019 (44-48) ft -- 42.9 -- 0.409SB-7 WG-050119-NL-016 5/1/2019 (52-56) ft -- 184 -- 0.416SB-8 WG-050119-NL-021 5/1/2019 (40-44) ft -- 83.6 -- ND(0.250) SB-8 WG-050119-NL-020 5/1/2019 (44-48) ft -- 43.3 -- 0.412SB-8 WG-050119-NL-020A 5/1/2019 (44-48) ft 73.3 J -- 0.10U J --SB-8 WG-050119-NL-019 5/1/2019 (52-56) ft -- 252 -- 0.437SB-9 WG-050219-NL-024 5/2/2019 (40-44) ft -- 90.1 -- 2.31SB-9 WG-050219-NL-023 5/2/2019 (44-48) ft -- 96.6 -- 1.76SB-9 WG-050219-NL-022 5/2/2019 (53-57) ft -- 259 -- 5.97SB-10 WG-050219-NL-027 5/2/2019 (40-44) ft -- 7.84 -- 0.667SB-10 WG-050219-NL-026 5/2/2019 (44-48) ft -- 45.8 -- 1.73SB-10 WG-050219-NL-025 5/2/2019 (52-56) ft -- 218 -- 3.89SB-10 WG-050219-NL-025A 5/2/2019 (52-56) ft 284 J -- 3.0 J --
SB-11 WG-050219-NL-031 5/2/2019 (21-25) ft -- ND(0.300) -- 3.31 SB-11 WG-050219-NL-030 5/2/2019 (31-35) ft -- 1.07 -- 24.9 SB-11 WG-050219-NL-030A 5/2/2019 (31-35) ft 3.0 J -- 8.7 J --SB-11 WG-050219-NL-029 5/2/2019 (41-45) ft -- 0.977 -- 42.9 SB-11 WG-050219-NL-028 5/2/2019 (48-52) ft -- 3.08 -- 84.9
PSW-5B2 Area
Bag Warehouse Area
GHD 11152783 (02)

Table 5
Groundwater Analytical Results SummaryFormer Farmland Industries Nitrogen Plant
Lawrence, Kansas
Page 2 of 4
Am
mon
ia
Am
mon
ia -
N
Nitr
ite /
Nitr
ate
Nitr
ite /
Nitr
ate
Units mg/L mg/L mg/L mg/LLab PACE CLMSLA PACE CLMSLA
MCL 1 NS 2 NS 1 / 10 1 / 10
Location Sample Number Date DepthSB-12 WG-050219-NL-039 5/3/2019 (24-28) ft -- ND(0.300) -- 14.5 SB-12 WG-050219-NL-038 5/3/2019 (31-35) ft -- 1.51 -- 29.9 SB-12 WG-050219-NL-037 5/3/2019 (41-45) ft -- 2.29 -- 60.0 SB-12 WG-050219-NL-036 5/3/2019 (48-52) ft -- 2.04 -- 82.4 SB-12 WG-050319-NL-036A 5/3/2019 (48-52) ft 8.1 J -- 51.9 J --SB-13 WG-050219-NL-035 5/3/2019 (15-19) ft -- ND(0.300) -- 3.92 SB-13 WG-050219-NL-034 5/3/2019 (21-25) ft -- ND(0.300) -- 10.7 SB-13 WG-050219-NL-033 5/3/2019 (31-35) ft -- ND(0.300) -- 9.10 SB-13 WG-050219-NL-032 5/3/2019 (43-47) ft -- ND(0.300) -- 11.7 SB-14 WG-050219-NL-043 5/3/2019 (23-27) ft -- 3.12 -- 16.0 SB-14 WG-050219-NL-042 5/3/2019 (25-31) ft -- 18.5 -- 26.2 SB-14 WG-050219-NL-041 5/3/2019 (45-51) ft -- 52.0 -- 54.3 SB-14 WG-050219-NL-040 5/3/2019 (48-52) ft -- 21.3 -- 108 SB-14 WG-050319-NL-040A 5/3/2019 (48-52) ft 19.4 -- 95.1 --SB-15 WG-050619-NL-046 5/6/2019 (22-26) ft -- 99.0 -- 224 SB-15 WG-050619-NL-045 5/6/2019 (43-49) ft -- 118 -- 293 SB-15 WG-050619-NL-045A 5/6/2019 (43-49) ft 114 -- 304 --SB-15 WG-050619-NL-044 5/6/2019 (53-57) ft -- 21.0 -- 128 SB-19 WG-050619-NL-049 5/6/2019 (9-13) ft -- 1.95 -- 17.3 SB-19 WG-050619-NL-048 5/6/2019 (14-18) ft -- 1.59 -- 23.7 SB-19 WG-050619-NL-047 5/6/2019 (27-31) ft -- 2.67 -- 9.98 SB-20 WG-050619-NL-052 5/6/2019 (25-29) ft -- 6.53 -- 3.04 SB-20 WG-050619-NL-051 5/6/2019 (41-45) ft -- 4.70 -- 2.04 SB-20 WG-050619-NL-050 5/6/2019 (53.5-57.5) ft -- 7.24 -- 4.79 SB-20 WG-050619-NL-050A 5/6/2019 (53.5-57.5) ft 9.5 -- 3.1 --SB-21 WG-050719-NL-054 5/7/2019 (41-45) ft -- 16.0 -- 13.7 SB-21 WG-050719-NL-053 5/7/2019 (54.5-58.5) ft -- 1.07 -- 25.5 SB-22 WG-050719-NL-057 5/7/2019 (31-35) ft -- 14.0 -- 31.5 SB-22 WG-050719-NL-056 5/7/2019 (41-45) ft -- 8.20 -- 72.5 SB-22 WG-050719-NL-055 5/7/2019 (55-59) ft -- ND(0.300) -- 50.3 SB-22 WG-050619-NL-055A 5/7/2019 (55-59) ft 0.75 -- 55.6 --SB-23 WG-050819-NL-060 5/8/2019 (34-38) ft -- 64.8 -- 194 SB-23 WG-050819-NL-060A 5/8/2019 (34-38) ft 70.2 -- 183 J --SB-23 WG-050819-NL-059 5/8/2019 (41-45) ft -- 95.6 -- 267 SB-23 WG-050819-NL-058 5/8/2019 (46-50) ft -- 121 -- 344 SB-24 WG-050819-NL-062 5/8/2019 (40-44) ft -- 23.0 -- 39.3 SB-24 WG-050819-NL-061 5/8/2019 (52-56) ft -- 4.35 -- 173 SB-47 WG-051319-NL-105 5/20/2019 (31-35) ft -- 4.52 -- 3.10 SB-47 WG-052019-NL-105A 5/20/2019 (31-35) ft 6.0 J -- 2.6 --SB-47 WG-051319-NL-104 5/20/2019 (41-45) ft -- 5.82 -- 2.21 SB-47 WG-051319-NL-103 5/20/2019 (52-56) ft -- 0.418 -- 8.04
GHD 11152783 (02)

Table 5
Groundwater Analytical Results SummaryFormer Farmland Industries Nitrogen Plant
Lawrence, Kansas
Page 3 of 4
Am
mon
ia
Am
mon
ia -
N
Nitr
ite /
Nitr
ate
Nitr
ite /
Nitr
ate
Units mg/L mg/L mg/L mg/LLab PACE CLMSLA PACE CLMSLA
MCL 1 NS 2 NS 1 / 10 1 / 10
Location Sample Number Date DepthSB-48 WG-051319-NL-108 5/20/2019 (16-20) ft -- 1.10 -- 22.2 SB-48 WG-051319-NL-107 5/20/2019 (31-35) ft -- 1.86 -- 2.62 SB-48 WG-051319-NL-106 5/20/2019 (44-48) ft -- 0.545 -- 3.64 SB-49 WG-051319-NL-111 5/20/2019 (15-19) ft -- 4.51 -- 9.48 SB-49 WG-051319-NL-110 5/20/2019 (31-35) ft -- 0.780 -- 2.29 SB-49 WG-052019-NL-110A 5/20/2019 (31-35) ft 1.7 -- 1.5 --SB-49 WG-051319-NL-109 5/20/2019 (42-46) ft -- 4.02 -- 16.2
SB-25 WG-050819-NL-064 5/8/2019 (41-45) ft -- 442 -- 734SB-25 WG-050819-NL-063 5/8/2019 (61-65) ft -- 501 -- 924SB-26 WG-050919-NL-067 5/9/2019 (35-39) ft -- 1090 -- 1340SB-26 WG-050919-NL-066 5/9/2019 (41-45) ft -- 871 -- 1070SB-26 WG-050919-NL-065 5/9/2019 (52-56) ft -- 427 -- 843SB-26 WG-050919-NL-065A 5/9/2019 (52-56) ft 392 -- 776 --SB-27 WG-050919-NL-070 5/9/2019 (31-35) ft -- 406 -- 604SB-27 WG-050919-NL-070A 5/9/2019 (31-35) ft 343 -- 453 --SB-27 WG-050919-NL-069 5/9/2019 (41-45) ft -- 528 -- 850SB-27 WG-050919-NL-068 5/9/2019 (52-56) ft -- 657 -- 1170SB-28 WG-050919-NL-074 5/9/2019 (20-24) ft -- 256 -- 381SB-28 WG-050919-NL-073 5/9/2019 (31-35) ft -- 291 -- 336SB-28 WG-050919-NL-072 5/9/2019 (41-45) ft -- 423 -- 527SB-28 WG-050919-NL-071 5/9/2019 (52-56) ft -- 574 -- 779SB-29 WG-050919-NL-078 5/9/2019 (21-25) ft -- 100 -- 123SB-29 WG-050919-NL-077 5/9/2019 (31-35) ft -- 283 -- 289SB-29 WG-050919-NL-076 5/9/2019 (41-45) ft -- 234 -- 273SB-29 WG-050919-NL-075 5/9/2019 (51-55) ft -- 745 -- 809SB-29 WG-050919-NL-075A 5/9/2019 (51-55) ft 707 -- 266 --SB-30 WG-051019-NL-081 5/10/2019 (31-35) ft -- 71.7 -- 68.4SB-30 WG-051019-NL-080 5/10/2019 (41-45) ft -- 397 -- 527SB-30 WG-051019-NL-080A 5/10/2019 (41-45) ft 314 -- 448 --SB-30 WG-051019-NL-079 5/10/2019 (50-54) ft -- 531 -- 823SB-31 WG-051019-NL-079B 5/10/2019 (15-19) ft -- 21 -- 431SB-32 WG-051019-NL-085 5/10/2019 (10-14) ft -- 30 -- 2050SB-32 WG-051019-NL-084 5/10/2019 (31-35) ft -- 15.6 -- 193SB-32 WG-051019-NL-083 5/10/2019 (41-45) ft -- 51.7 -- 53.6SB-32 WG-051019-NL-082 5/10/2019 (52-56) ft -- 31.7 -- 602SB-32 WG-051019-NL-082A 5/10/2019 (52-56) ft 309 -- 595 --SB-33 WG-051319-NL-088 5/13/2019 (11-15) ft -- 647 -- 113SB-33 WG-051319-NL-087 5/13/2019 (41-45) ft -- 649 -- 961SB-33 WG-051319-NL-086 5/13/2019 (66-70) ft -- 944 -- 1230
West Extension Pond Area
GHD 11152783 (02)

Table 5
Groundwater Analytical Results SummaryFormer Farmland Industries Nitrogen Plant
Lawrence, Kansas
Page 4 of 4
Am
mon
ia
Am
mon
ia -
N
Nitr
ite /
Nitr
ate
Nitr
ite /
Nitr
ate
Units mg/L mg/L mg/L mg/LLab PACE CLMSLA PACE CLMSLA
MCL 1 NS 2 NS 1 / 10 1 / 10
Location Sample Number Date DepthSB-33 WG-051319-NL-086A 5/13/2019 (66-70) ft 914 J -- 1170 --SB-34 WG-051319-NL-089 5/13/2019 (51-55) ft -- 14.6 -- 1.36SB-36 WG-051319-NL-094 5/13/2019 (15-19) ft -- 5710 -- 2770SB-36 WG-051319-NL-093 5/13/2019 (31-35) ft -- 20400 -- 23200SB-36 WG-051319-NL-091 5/13/2019 (51-55) ft -- 737 -- 396SB-36 WG-051319-NL-091A 5/13/2019 (51-55) ft 544 J -- 413 --SB-36 WG-051319-NL-090 5/13/2019 (63-67) ft -- 208 -- 146
SB-37 WG-051319-NL-095 5/14/2019 (11-15) ft -- 3.2 -- 2.19SB-38 WG-051319-NL-097 5/14/2019 (41-45) ft -- 13.2 -- 1.58SB-38 WG-051319-NL-096 5/14/2019 (64-68) ft -- 3.48 -- 0.755SB-40 WG-051319-NL-098 5/15/2019 (24-28) ft -- 25.7 -- 1460SB-41 WG-051319-NL-099 5/15/2019 (15-19) ft -- 8980 -- 10900SB-42 WG-051319-NL-100 5/15/2019 (62-66) ft -- 17.4 -- 7.62SB-42 WG-051519-NL-100A 5/15/2019 (62-66) ft 6.2 -- 0.5 --SB-45 WG-051319-NL-102 5/17/2019 (29-33) ft -- 2.13 -- 324SB-45 WG-051319-NL-101 5/17/2019 (62-66) ft -- 2.28 -- 0.634
Notes:1 US EPA Maximum Contaminant Level for drinking water2 no US EPA standard is availablemg/L - milligrams per literPACE Pace Analytical Laboratories, Lenexa, KansasCLMSLA - City of Lawrence, Kansas, Municipal Services Laboratory Analysisft - feetND - not detected at the assoicated reporting limitJ - estimated concentration
East and West Lime Ponds Area
GHD 11152783 (02)
GHD | Data Gap Study Report | 11152783 (02)
Appendices

GHD | Data Gap Study Report | 11152783 (02)
Appendix A Stratigraphic Logs for Extraction Wells PSW-3B3,
PSW-6B4, and PSW-7B2

GHD | Data Gap Study Report | 11152783 (02)
Appendix B Stratigraphic Logs for
Data Gap Study Soil Borings

GHD | Data Gap Study Report | 11152783 (02)
Appendix C Field Documentation
AQTESOLVTM Analyzes
Appendix C Field Documentation

GHD | Data Gap Study Report | 11152783 (02)
Appendix D AQTESOLVTM Analyses

GHD | Data Gap Study Report | 11152783 (02)
Appendix E Data Validation Memo and
Pace Analytical Laboratory Reports

GHD | Data Gap Study Report | 11152783 (02)
Appendix F City of Lawrence Laboratory Reports