Data from Theodolite Measurements of Creep Rates on … · Data from Theodolite Measurements of...
14
Data from Theodolite Measurements of Creep Rates on San Francisco Bay Region Faults, California: 1979-2007 By Forrest S. McFarland 1 , James J. Lienkaemper 2 , S. John Caskey 3 and Karen Grove 3 Open-File Report 2007-1367 2007 U.S. DEPARTMENT OF THE INTERIOR U.S. GEOLOGICAL SURVEY 1 ENSR/AECOM, 300 Lakeside Drive, Ste. 220, Oakland, CA 94621 2 U.S. Geological Survey, MS 977, 345 Middlefield Rd., Menlo Park, CA 94025 3 Department of Geosciences, San Francisco State University, San Francisco, CA 94132
Transcript of Data from Theodolite Measurements of Creep Rates on … · Data from Theodolite Measurements of...
Data from Theodolite Measurements of Creep Rates on San Francisco Bay Region Faults, California: 1979-2007 By Forrest S. McFarland1, James J. Lienkaemper2, S. John Caskey3 and Karen Grove3 Open-File Report 2007-1367 2007 U.S. DEPARTMENT OF THE INTERIOR U.S. GEOLOGICAL SURVEY 1 ENSR/AECOM, 300 Lakeside Drive, Ste. 220, Oakland, CA 94621 2 U.S. Geological Survey, MS 977, 345 Middlefield Rd., Menlo Park, CA 94025 3 Department of Geosciences, San Francisco State University, San Francisco, CA 94132
Introduction
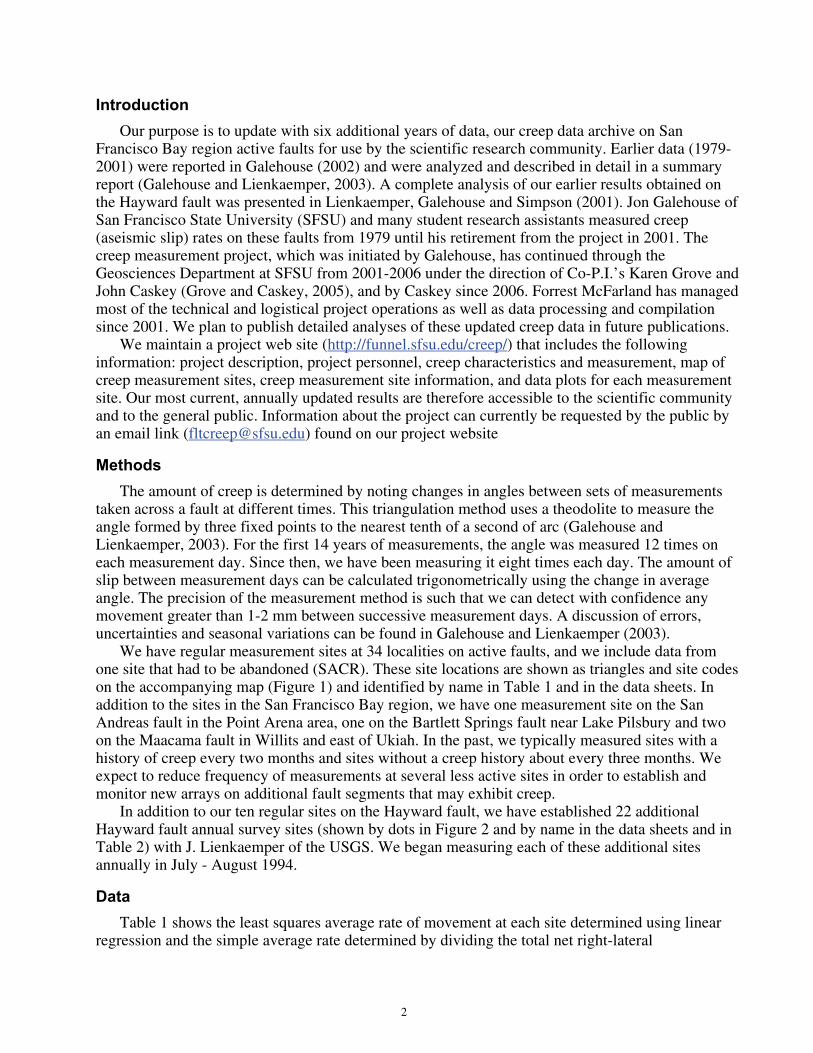
Our purpose is to update with six additional years of data, our creep data archive on San Francisco Bay region active faults for use by the scientific research community. Earlier data (1979-2001) were reported in Galehouse (2002) and were analyzed and described in detail in a summary report (Galehouse and Lienkaemper, 2003). A complete analysis of our earlier results obtained on the Hayward fault was presented in Lienkaemper, Galehouse and Simpson (2001). Jon Galehouse of San Francisco State University (SFSU) and many student research assistants measured creep (aseismic slip) rates on these faults from 1979 until his retirement from the project in 2001. The creep measurement project, which was initiated by Galehouse, has continued through the Geosciences Department at SFSU from 2001-2006 under the direction of Co-P.I.’s Karen Grove and John Caskey (Grove and Caskey, 2005), and by Caskey since 2006. Forrest McFarland has managed most of the technical and logistical project operations as well as data processing and compilation since 2001. We plan to publish detailed analyses of these updated creep data in future publications.
We maintain a project web site (http://funnel.sfsu.edu/creep/) that includes the following information: project description, project personnel, creep characteristics and measurement, map of creep measurement sites, creep measurement site information, and data plots for each measurement site. Our most current, annually updated results are therefore accessible to the scientific community and to the general public. Information about the project can currently be requested by the public by an email link ([email protected]) found on our project website
Methods
The amount of creep is determined by noting changes in angles between sets of measurements taken across a fault at different times. This triangulation method uses a theodolite to measure the angle formed by three fixed points to the nearest tenth of a second of arc (Galehouse and Lienkaemper, 2003). For the first 14 years of measurements, the angle was measured 12 times on each measurement day. Since then, we have been measuring it eight times each day. The amount of slip between measurement days can be calculated trigonometrically using the change in average angle. The precision of the measurement method is such that we can detect with confidence any movement greater than 1-2 mm between successive measurement days. A discussion of errors, uncertainties and seasonal variations can be found in Galehouse and Lienkaemper (2003).
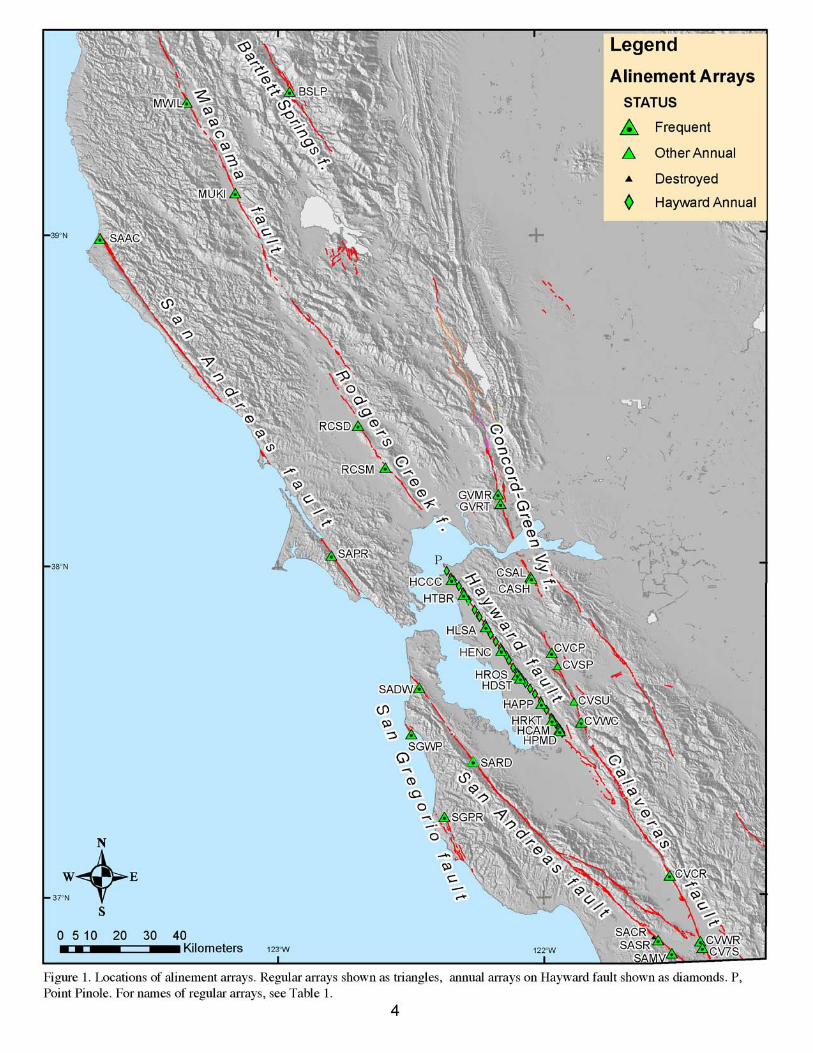
We have regular measurement sites at 34 localities on active faults, and we include data from one site that had to be abandoned (SACR). These site locations are shown as triangles and site codes on the accompanying map (Figure 1) and identified by name in Table 1 and in the data sheets. In addition to the sites in the San Francisco Bay region, we have one measurement site on the San Andreas fault in the Point Arena area, one on the Bartlett Springs fault near Lake Pilsbury and two on the Maacama fault in Willits and east of Ukiah. In the past, we typically measured sites with a history of creep every two months and sites without a creep history about every three months. We expect to reduce frequency of measurements at several less active sites in order to establish and monitor new arrays on additional fault segments that may exhibit creep.
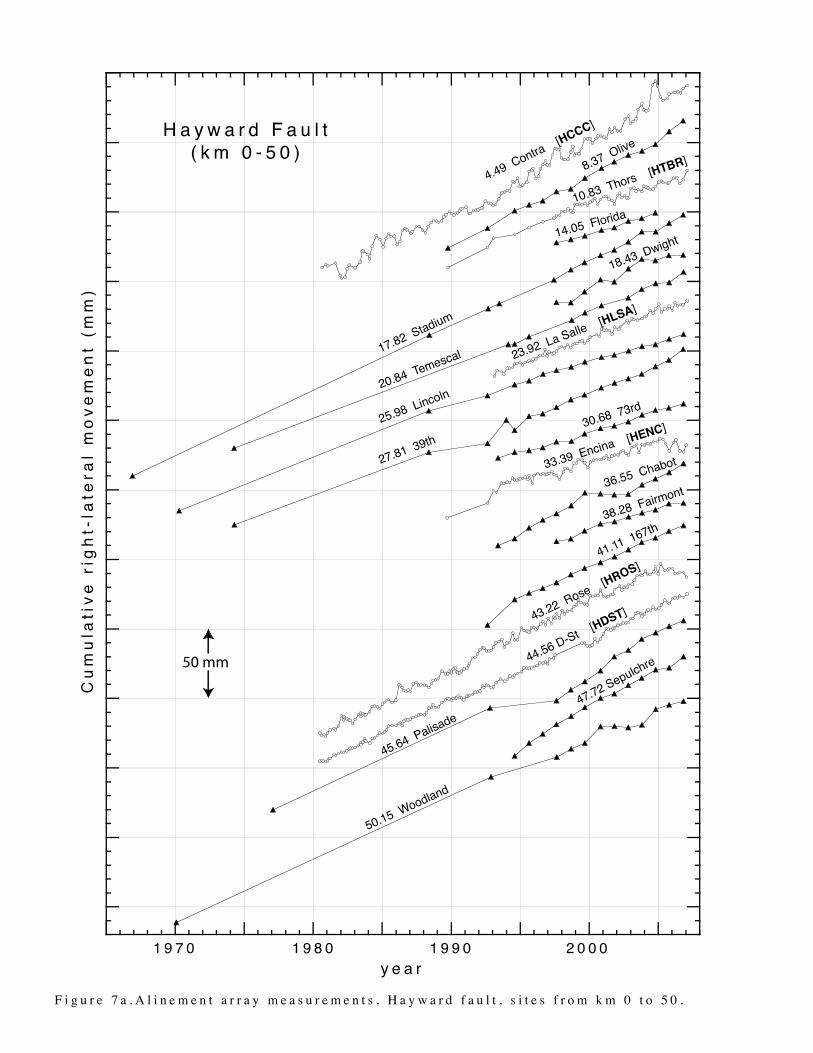
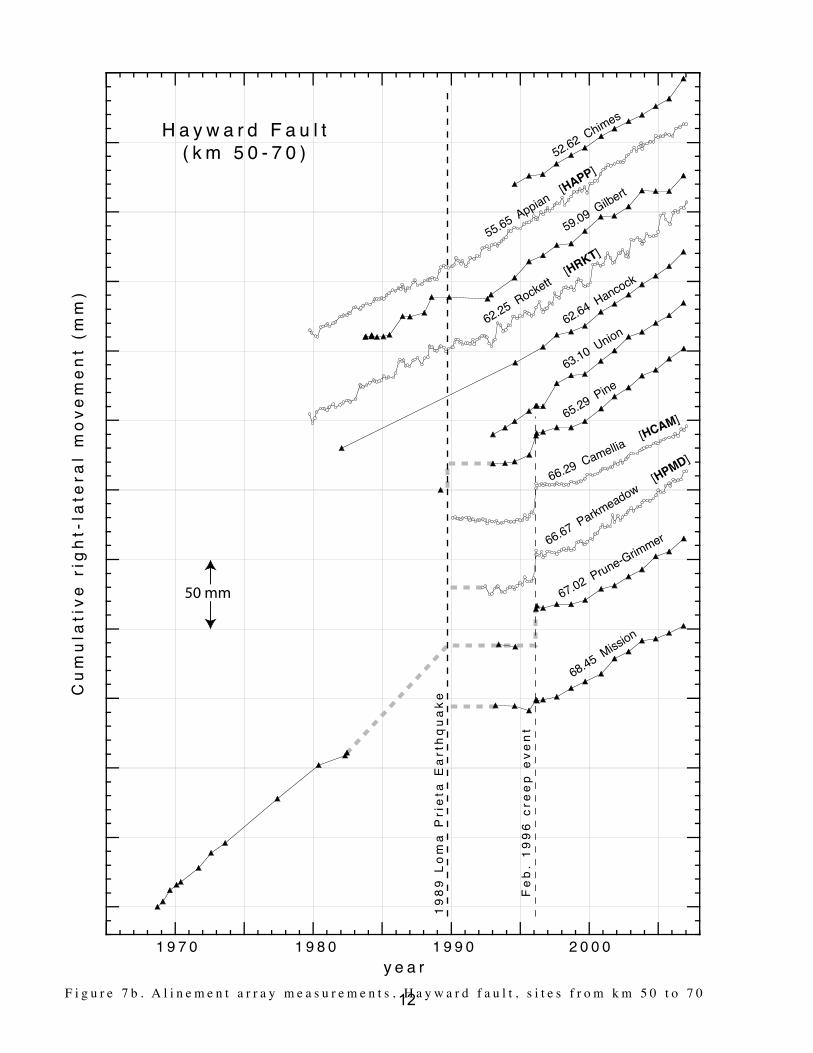
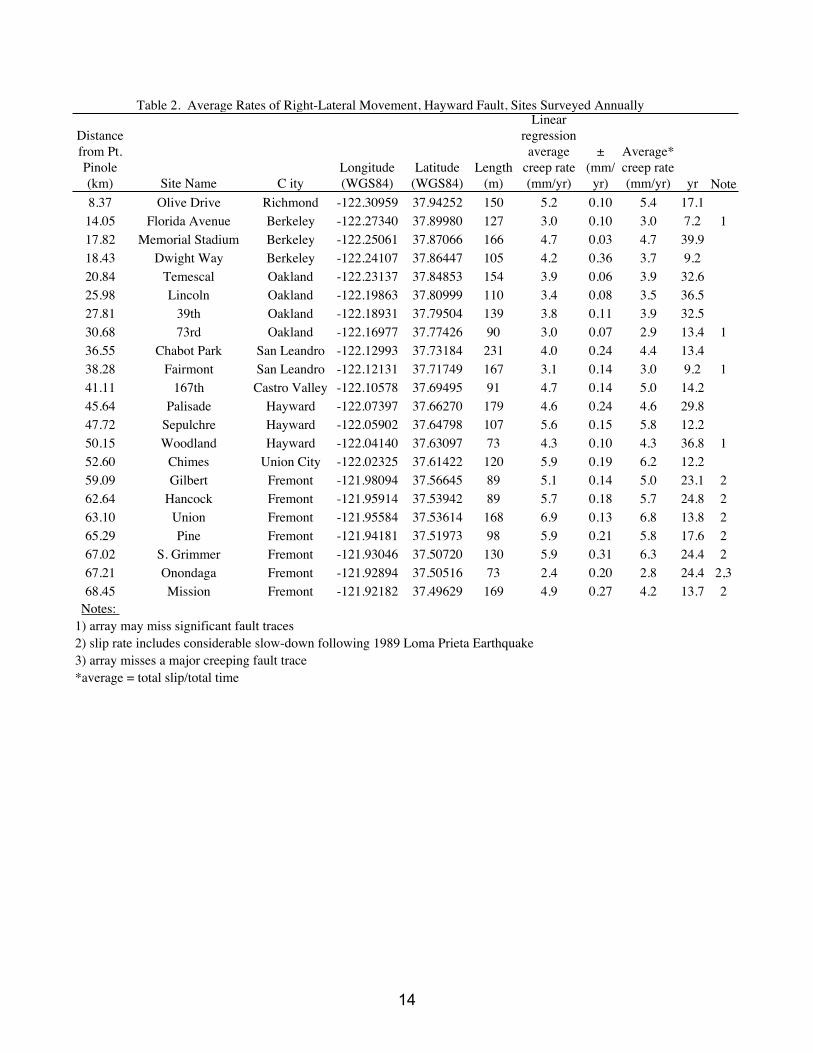
In addition to our ten regular sites on the Hayward fault, we have established 22 additional Hayward fault annual survey sites (shown by dots in Figure 2 and by name in the data sheets and in Table 2) with J. Lienkaemper of the USGS. We began measuring each of these additional sites annually in July - August 1994.
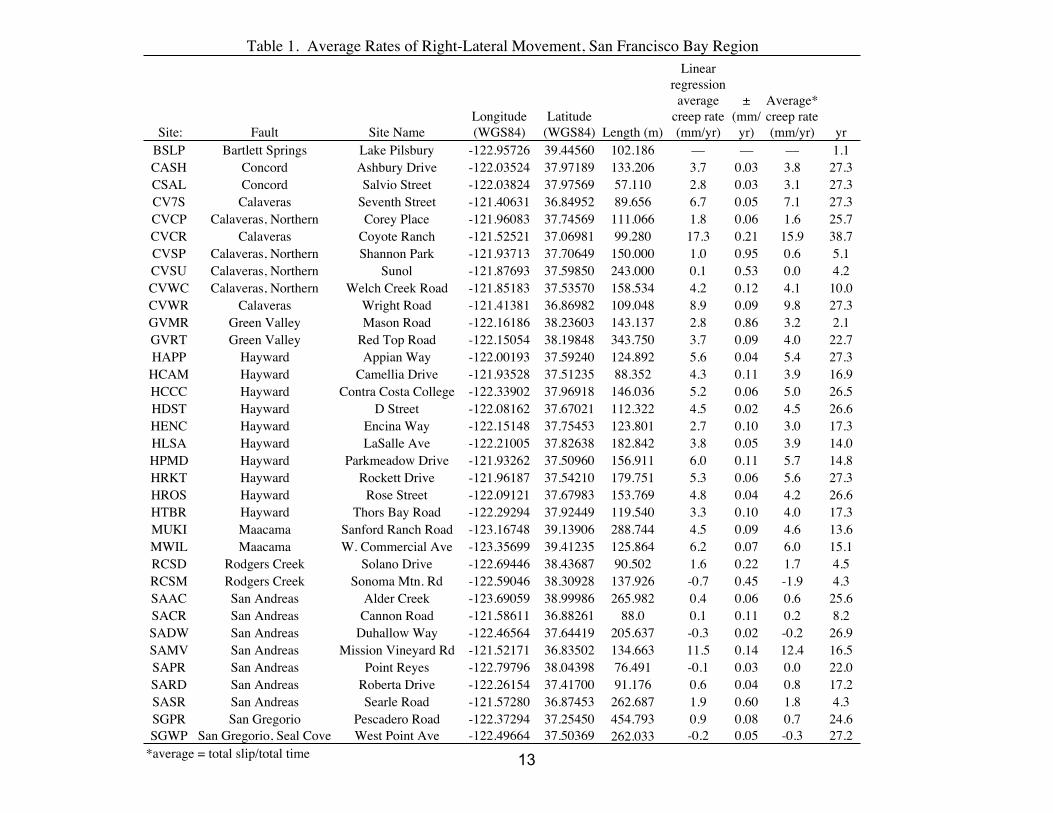
Data Table 1 shows the least squares average rate of movement at each site determined using linear
regression and the simple average rate determined by dividing the total net right-lateral
2
3
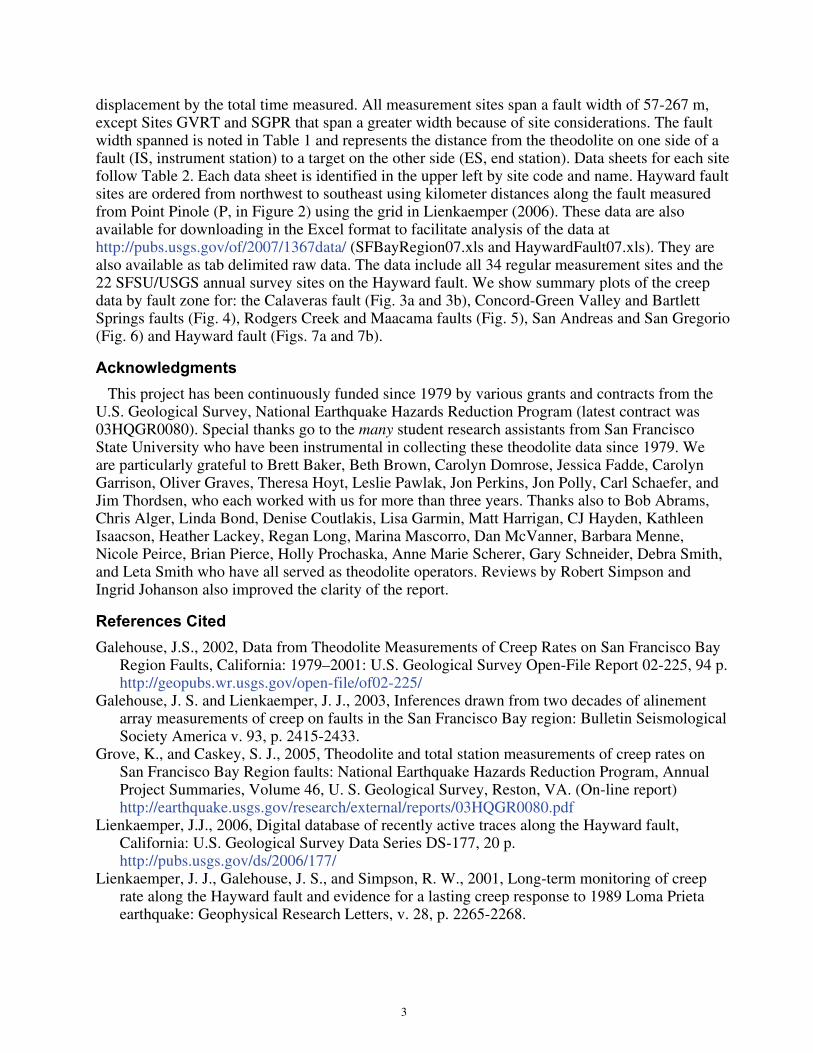
displacement by the total time measured. All measurement sites span a fault width of 57-267 m, except Sites GVRT and SGPR that span a greater width because of site considerations. The fault width spanned is noted in Table 1 and represents the distance from the theodolite on one side of a fault (IS, instrument station) to a target on the other side (ES, end station). Data sheets for each site follow Table 2. Each data sheet is identified in the upper left by site code and name. Hayward fault sites are ordered from northwest to southeast using kilometer distances along the fault measured from Point Pinole (P, in Figure 2) using the grid in Lienkaemper (2006). These data are also available for downloading in the Excel format to facilitate analysis of the data at http://pubs.usgs.gov/of/2007/1367data/ (SFBayRegion07.xls and HaywardFault07.xls). They are also available as tab delimited raw data. The data include all 34 regular measurement sites and the 22 SFSU/USGS annual survey sites on the Hayward fault. We show summary plots of the creep data by fault zone for: the Calaveras fault (Fig. 3a and 3b), Concord-Green Valley and Bartlett Springs faults (Fig. 4), Rodgers Creek and Maacama faults (Fig. 5), San Andreas and San Gregorio (Fig. 6) and Hayward fault (Figs. 7a and 7b).
Acknowledgments
This project has been continuously funded since 1979 by various grants and contracts from the U.S. Geological Survey, National Earthquake Hazards Reduction Program (latest contract was 03HQGR0080). Special thanks go to the many student research assistants from San Francisco State University who have been instrumental in collecting these theodolite data since 1979. We are particularly grateful to Brett Baker, Beth Brown, Carolyn Domrose, Jessica Fadde, Carolyn Garrison, Oliver Graves, Theresa Hoyt, Leslie Pawlak, Jon Perkins, Jon Polly, Carl Schaefer, and Jim Thordsen, who each worked with us for more than three years. Thanks also to Bob Abrams, Chris Alger, Linda Bond, Denise Coutlakis, Lisa Garmin, Matt Harrigan, CJ Hayden, Kathleen Isaacson, Heather Lackey, Regan Long, Marina Mascorro, Dan McVanner, Barbara Menne, Nicole Peirce, Brian Pierce, Holly Prochaska, Anne Marie Scherer, Gary Schneider, Debra Smith, and Leta Smith who have all served as theodolite operators. Reviews by Robert Simpson and Ingrid Johanson also improved the clarity of the report.
References Cited
Galehouse, J.S., 2002, Data from Theodolite Measurements of Creep Rates on San Francisco Bay Region Faults, California: 1979–2001: U.S. Geological Survey Open-File Report 02-225, 94 p. http://geopubs.wr.usgs.gov/open-file/of02-225/
Galehouse, J. S. and Lienkaemper, J. J., 2003, Inferences drawn from two decades of alinement array measurements of creep on faults in the San Francisco Bay region: Bulletin Seismological Society America v. 93, p. 2415-2433.
Grove, K., and Caskey, S. J., 2005, Theodolite and total station measurements of creep rates on San Francisco Bay Region faults: National Earthquake Hazards Reduction Program, Annual Project Summaries, Volume 46, U. S. Geological Survey, Reston, VA. (On-line report) http://earthquake.usgs.gov/research/external/reports/03HQGR0080.pdf
Lienkaemper, J.J., 2006, Digital database of recently active traces along the Hayward fault, California: U.S. Geological Survey Data Series DS-177, 20 p. http://pubs.usgs.gov/ds/2006/177/
Lienkaemper, J. J., Galehouse, J. S., and Simpson, R. W., 2001, Long-term monitoring of creep rate along the Hayward fault and evidence for a lasting creep response to 1989 Loma Prieta earthquake: Geophysical Research Letters, v. 28, p. 2265-2268.

0
100
200
1970 1975 1980 1985 1990 1995 2000 2005
y = -13327 + 6.7331x R= 0.99524
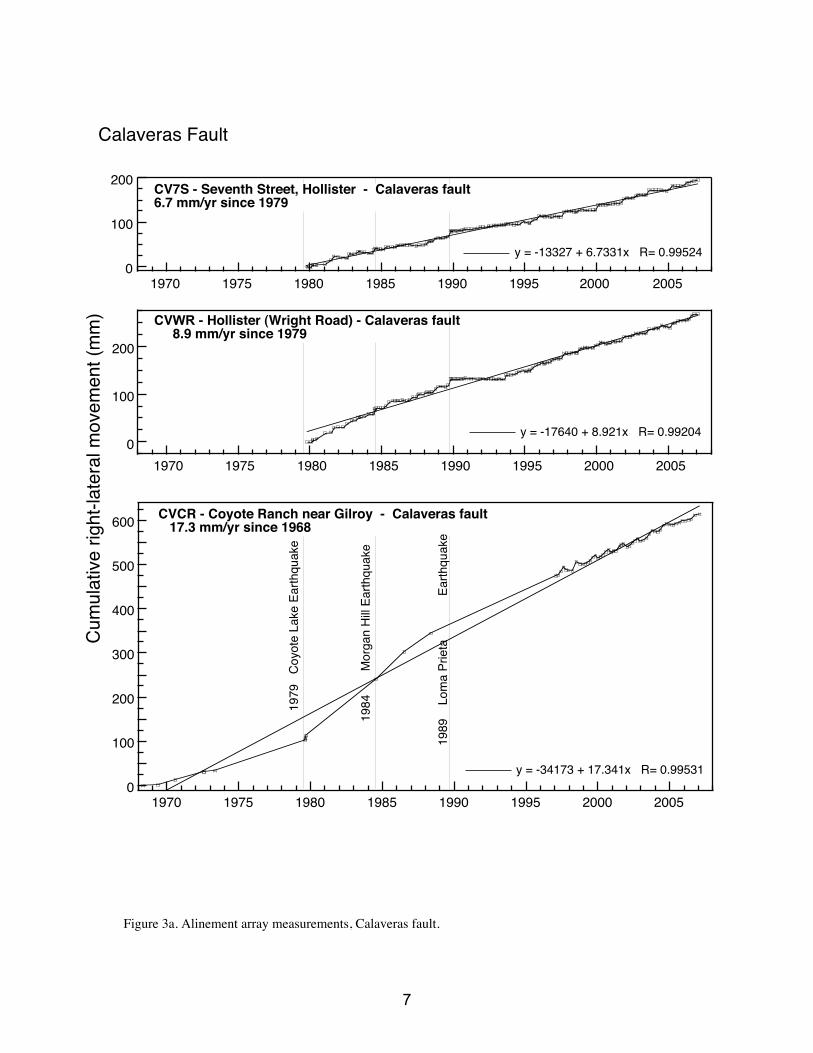
CV7S - Seventh Street, Hollister - Calaveras fault6.7 mm/yr since 1979
Calaveras Fault
0
100
200
1970 1975 1980 1985 1990 1995 2000 2005
y = -17640 + 8.921x R= 0.99204
CVWR - Hollister (Wright Road) - Calaveras fault 8.9 mm/yr since 1979
0
100
200
300
400
500
600
1970 1975 1980 1985 1990 1995 2000 2005
y = -34173 + 17.341x R= 0.99531
CVCR - Coyote Ranch near Gilroy - Calaveras fault 17.3 mm/yr since 1968
Cum
ulat
ive ri
ght-l
ater
al m
ovem
ent (
mm
)
Figure 3a. Alinement array measurements, Calaveras fault.
1979
Co
yote
Lak
e Ea
rthqu
ake
1984
Mor
gan
Hill E
arth
quak
e
1989
L
oma
Prie
ta
E
arth
quak
e
7

050
100
1980 1984 1988 1992 1996 2000 2004 2008
y = -2008.8 + 1.0019x R= 0.46695
CVSP - Shannon Park, Dublin - Calaveras fault 1.0 mm/yr since 2002
-100-50
050
100150200
1980 1984 1988 1992 1996 2000 2004 2008
y = -228.35 + 0.1163x R= 0.27671 y = -7017.2 + 3.5244x R= 0.98477 y = -3611.5 + 1.8195x R= 0.93897
CVCP - Corey Place, San Ramon - Calaveras fault
1.8 mm/yr since 1980 [0.1 mm/yr 1980-1992; 3.5 mm/yr 1992-2001; 1.2 mm/yr 2001-2006]
Northern Calaveras Fault
050
100
1980 1984 1988 1992 1996 2000 2004 2008
y = -8430.9 + 4.2212x R= 0.98019
CVWC -Welch Creek Road - Calaveras fault 4.2 mm/yr since 1997
050
100
1980 1984 1988 1992 1996 2000 2004 2008
y = -268.53 + 0.13463x R= 0.14388
CVSU - Sunol - Calaveras fault 0.1 mm/yr since 2002
Cum
ulat
ive ri
ght-l
ater
al m
ovem
ent (
mm
)
Figure 3b. Alinement array measurements, Northern Calaveras fault.
6
-20
0
20
40
60
80
100
1980 1984 1988 1992 1996 2000 2004 2008
y = -7257 + 3.6673x R= 0.99482
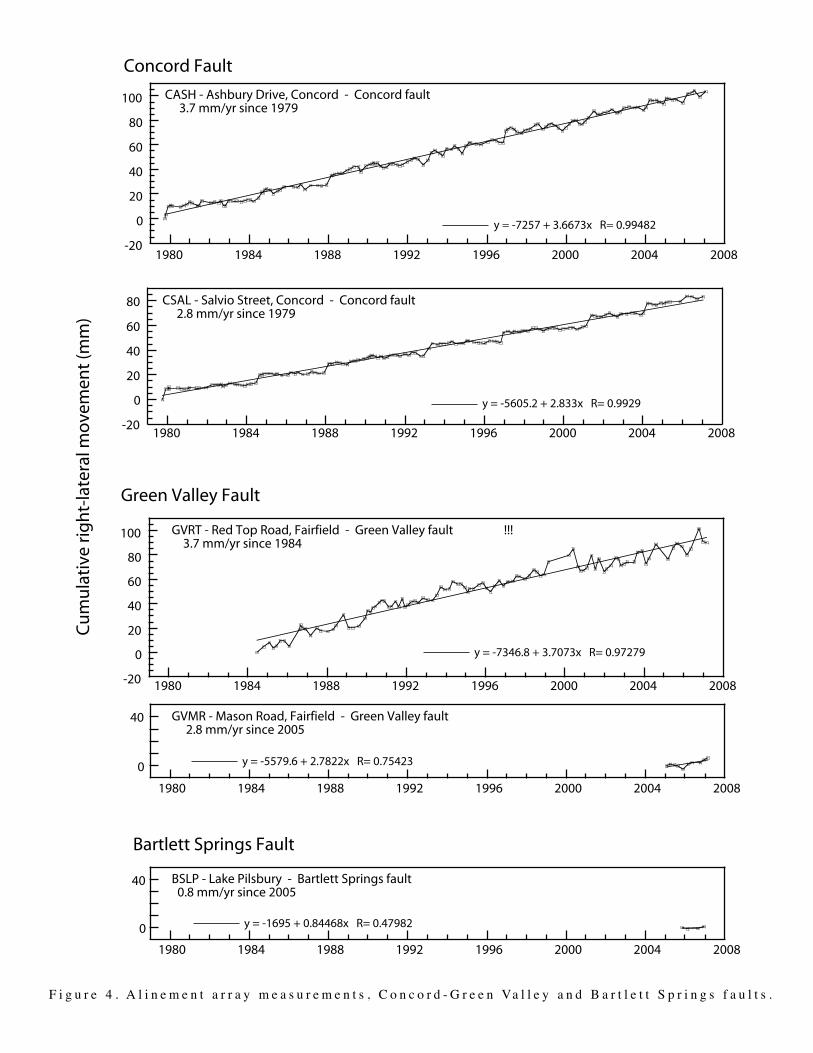
CASH - Ashbury Drive, Concord - Concord fault 3.7 mm/yr since 1979
-20
0
20
40
60
80
1980 1984 1988 1992 1996 2000 2004 2008
y = -5605.2 + 2.833x R= 0.9929
CSAL - Salvio Street, Concord - Concord fault 2.8 mm/yr since 1979
0
40
1980 1984 1988 1992 1996 2000 2004 2008
y = -5579.6 + 2.7822x R= 0.75423
GVMR - Mason Road, Fairfield - Green Valley fault 2.8 mm/yr since 2005
Concord Fault
Green Valley Fault
-20
0
20
40
60
80
100
1980 1984 1988 1992 1996 2000 2004 2008
y = -7346.8 + 3.7073x R= 0.97279
GVRT - Red Top Road, Fairfield - Green Valley fault !!! 3.7 mm/yr since 1984
Cu
mu
lati
ve ri
gh
t-la
tera
l mo
vem
ent
(mm
)
F i g u r e 4 . A l i n e m e n t a r r a y m e a s u r e m e n t s , C o n c o r d - G r e e n Va l l e y a n d B a r t l e t t S p r i n g s f a u l t s .
0
40
1980 1984 1988 1992 1996 2000 2004 2008
y = -5579.6 + 2.7822x R= 0.75423
GVMR - Mason Road, Fairfield - Green Valley fault 2.8 mm/yr since 2005
Bartlett Springs Fault
0
40
1980 1984 1988 1992 1996 2000 2004 2008
y = -1695 + 0.84468x R= 0.47982
BSLP - Lake Pilsbury - Bartlett Springs fault 0.8 mm/yr since 2005

Rodgers Creek Fault
0
50
1980 1984 1988 1992 1996 2000 2004 2008
y = 1395.4 - 0.69791x R= 0.34028
RCSM - Sonoma Mountain Rd. - Rodgers Creek fault -0.7 mm/yr since 2004
0
50
1980 1984 1988 1992 1996 2000 2004 2008
y = -3261.5 + 1.6292x R= 0.86304
RCSD - Solano Drive, Santa Rosa - Rodgers Creek fault 1.6 mm/yr since 2002
0
100
1980 1984 1988 1992 1996 2000 2004 2008
y = -12419 + 6.2359x R= 0.99492
MWIL - W. Commercial Ave., Willits - Maacama fault 6.2 mm/yr since 1992
0
100
1980 1984 1988 1992 1996 2000 2004 2008
y = -8988.4 + 4.5089x R= 0.98532
MUKI - Sanford Ranch Road, Ukiah - Maacama fault 4.5 mm/yr since 1993
Cu
mu
lati
ve ri
gh
t-la
tera
l mo
vem
ent
(mm
)
Maacama Fault
F i g u r e 5 . A l i n e m e n t a r r a y m e a s u r e m e n t s , R o d g e r s C r e e k a n d M a a c a m a f a u l t s .
9
San Andreas Fault
0
50
100
150
200
1980 1984 1988 1992 1996 2000 2004 2008
y = -22857 + 11.485x R= 0.99326
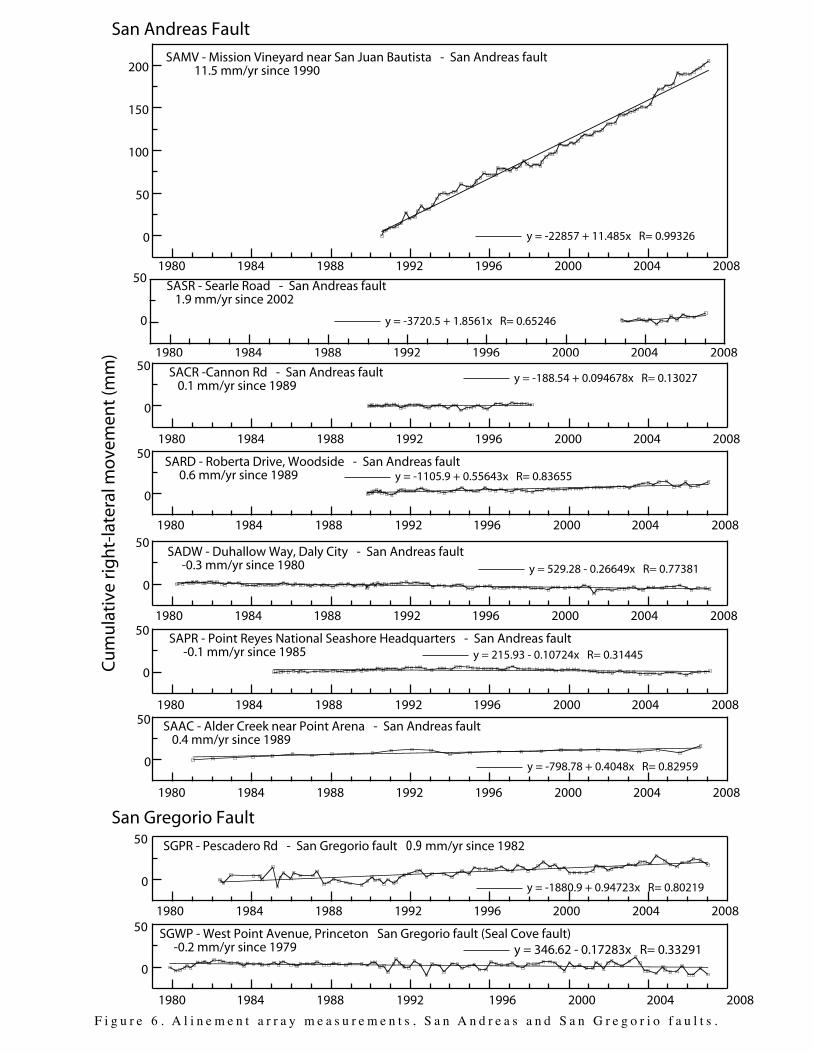
SAMV - Mission Vineyard near San Juan Bautista - San Andreas fault 11.5 mm/yr since 1990
0
50
1980 1984 1988 1992 1996 2000 2004 2008
y = -3720.5 + 1.8561x R= 0.65246
SASR - Searle Road - San Andreas fault 1.9 mm/yr since 2002
0
50
1980 1984 1988 1992 1996 2000 2004 2008
y = 346.62 - 0.17283x R= 0.33291 SGWP - West Point Avenue, Princeton San Gregorio fault (Seal Cove fault) -0.2 mm/yr since 1979
0
50
1980 1984 1988 1992 1996 2000 2004 2008
y = -1880.9 + 0.94723x R= 0.80219
SGPR - Pescadero Rd - San Gregorio fault 0.9 mm/yr since 1982
San Gregorio Fault
0
50
1980 1984 1988 1992 1996 2000 2004 2008
y = -188.54 + 0.094678x R= 0.13027 SACR -Cannon Rd - San Andreas fault 0.1 mm/yr since 1989
0
50
1980 1984 1988 1992 1996 2000 2004 2008
y = -1105.9 + 0.55643x R= 0.83655 SARD - Roberta Drive, Woodside - San Andreas fault 0.6 mm/yr since 1989
0
50
1980 1984 1988 1992 1996 2000 2004 2008
y = 529.28 - 0.26649x R= 0.77381
SADW - Duhallow Way, Daly City - San Andreas fault -0.3 mm/yr since 1980
0
50
1980 1984 1988 1992 1996 2000 2004 2008
y = 215.93 - 0.10724x R= 0.31445 SAPR - Point Reyes National Seashore Headquarters - San Andreas fault -0.1 mm/yr since 1985
0
50
1980 1984 1988 1992 1996 2000 2004 2008
y = -798.78 + 0.4048x R= 0.82959
SAAC - Alder Creek near Point Arena - San Andreas fault 0.4 mm/yr since 1989
Cu
mu
lati
ve ri
gh
t-la
tera
l mo
vem
ent
(mm
)
F i g u r e 6 . A l i n e m e n t a r r a y m e a s u r e m e n t s , S a n A n d r e a s a n d S a n G r e g o r i o f a u l t s .
4.49 Contra [HCCC]
8.37 Olive
17.82 Stadium
20.84 Temescal
25.98 Lincoln
27.81 39th30.68 73rd
33.39 Encina [HENC]
36.55 Chabot
38.28 Fairmont
41.11 167th
43.22 Rose [HROS]
44.56 D-St [HDST]
45.64 Palisade
50.15 Woodland
47.72 Sepulchre
10.83 Thors [HTBR]
14.05 Florida
23.92 La Salle [HLSA]
18.43 Dwight
50 mm
Cu
mu
lati
ve r
igh
t-la
tera
l m
ove
me
nt
(mm
)
y e a r1 9 7 0 1 9 8 0 1 9 9 0 2 0 0 0
H a y w a r d F a u l t( k m 0 - 5 0 )
F i g u r e 7 a . A l i n e m e n t a r r a y m e a s u r e m e n t s , H a y w a r d f a u l t , s i t e s f r o m k m 0 t o 5 0 .
19
89
Lo
ma
Pri
eta
Ea
rth
qu
ake
Fe
b.
19
96
cre
ep
eve
nt
55.65 Appian [HAPP]
52.62 Chimes
59.09 Gilbert
62.64 Hancock
63.10 Union
65.29 Pine
67.02 Prune-Grimmer
68.45 Mission
62.25 Rockett [HRKT]
66.29 Camellia [HCAM]
66.67 Parkmeadow [HPMD]
Cu
mu
lati
ve r
igh
t-la
tera
l m
ove
me
nt
(mm
)
50 mm
y e a r1 9 7 0 1 9 8 0 1 9 9 0 2 0 0 0
H a y w a r d F a u l t( k m 5 0 - 7 0 )
F i g u r e 7 b . A l i n e m e n t a r r a y m e a s u r e m e n t s , H a y w a r d f a u l t , s i t e s f r o m k m 5 0 t o 7 012
Administrator
Text Box
F i g u r e 4
Site: Fault Site NameLongitude (WGS84)
Latitude (WGS84) Length (m)
Linear regression
average creep rate (mm/yr)
± (mm/
yr)
Average* creep rate (mm/yr) yr
BSLP Bartlett Springs Lake Pilsbury -122.95726 39.44560 102.186 –– –– –– 1.1CASH Concord Ashbury Drive -122.03524 37.97189 133.206 3.7 0.03 3.8 27.3CSAL Concord Salvio Street -122.03824 37.97569 57.110 2.8 0.03 3.1 27.3CV7S Calaveras Seventh Street -121.40631 36.84952 89.656 6.7 0.05 7.1 27.3CVCP Calaveras, Northern Corey Place -121.96083 37.74569 111.066 1.8 0.06 1.6 25.7CVCR Calaveras Coyote Ranch -121.52521 37.06981 99.280 17.3 0.21 15.9 38.7CVSP Calaveras, Northern Shannon Park -121.93713 37.70649 150.000 1.0 0.95 0.6 5.1CVSU Calaveras, Northern Sunol -121.87693 37.59850 243.000 0.1 0.53 0.0 4.2CVWC Calaveras, Northern Welch Creek Road -121.85183 37.53570 158.534 4.2 0.12 4.1 10.0CVWR Calaveras Wright Road -121.41381 36.86982 109.048 8.9 0.09 9.8 27.3GVMR Green Valley Mason Road -122.16186 38.23603 143.137 2.8 0.86 3.2 2.1GVRT Green Valley Red Top Road -122.15054 38.19848 343.750 3.7 0.09 4.0 22.7HAPP Hayward Appian Way -122.00193 37.59240 124.892 5.6 0.04 5.4 27.3HCAM Hayward Camellia Drive -121.93528 37.51235 88.352 4.3 0.11 3.9 16.9HCCC Hayward Contra Costa College -122.33902 37.96918 146.036 5.2 0.06 5.0 26.5HDST Hayward D Street -122.08162 37.67021 112.322 4.5 0.02 4.5 26.6HENC Hayward Encina Way -122.15148 37.75453 123.801 2.7 0.10 3.0 17.3HLSA Hayward LaSalle Ave -122.21005 37.82638 182.842 3.8 0.05 3.9 14.0HPMD Hayward Parkmeadow Drive -121.93262 37.50960 156.911 6.0 0.11 5.7 14.8HRKT Hayward Rockett Drive -121.96187 37.54210 179.751 5.3 0.06 5.6 27.3HROS Hayward Rose Street -122.09121 37.67983 153.769 4.8 0.04 4.2 26.6HTBR Hayward Thors Bay Road -122.29294 37.92449 119.540 3.3 0.10 4.0 17.3MUKI Maacama Sanford Ranch Road -123.16748 39.13906 288.744 4.5 0.09 4.6 13.6MWIL Maacama W. Commercial Ave -123.35699 39.41235 125.864 6.2 0.07 6.0 15.1RCSD Rodgers Creek Solano Drive -122.69446 38.43687 90.502 1.6 0.22 1.7 4.5RCSM Rodgers Creek Sonoma Mtn. Rd -122.59046 38.30928 137.926 -0.7 0.45 -1.9 4.3SAAC San Andreas Alder Creek -123.69059 38.99986 265.982 0.4 0.06 0.6 25.6SACR San Andreas Cannon Road -121.58611 36.88261 88.0 0.1 0.11 0.2 8.2SADW San Andreas Duhallow Way -122.46564 37.64419 205.637 -0.3 0.02 -0.2 26.9SAMV San Andreas Mission Vineyard Rd -121.52171 36.83502 134.663 11.5 0.14 12.4 16.5SAPR San Andreas Point Reyes -122.79796 38.04398 76.491 -0.1 0.03 0.0 22.0SARD San Andreas Roberta Drive -122.26154 37.41700 91.176 0.6 0.04 0.8 17.2SASR San Andreas Searle Road -121.57280 36.87453 262.687 1.9 0.60 1.8 4.3SGPR San Gregorio Pescadero Road -122.37294 37.25450 454.793 0.9 0.08 0.7 24.6SGWP San Gregorio, Seal Cove West Point Ave -122.49664 37.50369 262.033 -0.2 0.05 -0.3 27.2
*average = total slip/total time
Table 1. Average Rates of Right-Lateral Movement, San Francisco Bay Region
13
Distance from Pt. Pinole (km) Site Name C ity
Longitude (WGS84)
Latitude (WGS84)
Length (m)
Linear regression
average creep rate (mm/yr)
± (mm/
yr)
Average* creep rate (mm/yr) yr Note
8.37 Olive Drive Richmond -122.30959 37.94252 150 5.2 0.10 5.4 17.114.05 Florida Avenue Berkeley -122.27340 37.89980 127 3.0 0.10 3.0 7.2 117.82 Memorial Stadium Berkeley -122.25061 37.87066 166 4.7 0.03 4.7 39.918.43 Dwight Way Berkeley -122.24107 37.86447 105 4.2 0.36 3.7 9.220.84 Temescal Oakland -122.23137 37.84853 154 3.9 0.06 3.9 32.625.98 Lincoln Oakland -122.19863 37.80999 110 3.4 0.08 3.5 36.527.81 39th Oakland -122.18931 37.79504 139 3.8 0.11 3.9 32.530.68 73rd Oakland -122.16977 37.77426 90 3.0 0.07 2.9 13.4 136.55 Chabot Park San Leandro -122.12993 37.73184 231 4.0 0.24 4.4 13.438.28 Fairmont San Leandro -122.12131 37.71749 167 3.1 0.14 3.0 9.2 141.11 167th Castro Valley -122.10578 37.69495 91 4.7 0.14 5.0 14.245.64 Palisade Hayward -122.07397 37.66270 179 4.6 0.24 4.6 29.847.72 Sepulchre Hayward -122.05902 37.64798 107 5.6 0.15 5.8 12.250.15 Woodland Hayward -122.04140 37.63097 73 4.3 0.10 4.3 36.8 152.60 Chimes Union City -122.02325 37.61422 120 5.9 0.19 6.2 12.259.09 Gilbert Fremont -121.98094 37.56645 89 5.1 0.14 5.0 23.1 262.64 Hancock Fremont -121.95914 37.53942 89 5.7 0.18 5.7 24.8 263.10 Union Fremont -121.95584 37.53614 168 6.9 0.13 6.8 13.8 265.29 Pine Fremont -121.94181 37.51973 98 5.9 0.21 5.8 17.6 267.02 S. Grimmer Fremont -121.93046 37.50720 130 5.9 0.31 6.3 24.4 267.21 Onondaga Fremont -121.92894 37.50516 73 2.4 0.20 2.8 24.4 2,368.45 Mission Fremont -121.92182 37.49629 169 4.9 0.27 4.2 13.7 2
Notes: 1) array may miss significant fault traces2) slip rate includes considerable slow-down following 1989 Loma Prieta Earthquake3) array misses a major creeping fault trace*average = total slip/total time
Table 2. Average Rates of Right-Lateral Movement, Hayward Fault, Sites Surveyed Annually
14