Data Evaluation Report on Response of Xenopus laevis to ... - · PDF fileOne frog from each...
49
Transcript of Data Evaluation Report on Response of Xenopus laevis to ... - · PDF fileOne frog from each...


Data Evaluation Report on Response of Xenopus laevis to Atrazine Exposure: Assessment of the Mechanism of Action of Atrazine.
EPA MRID Number 458677-04
Data Requirement:: EPA DP Barcode D288775 Abcdef8
EPA MRID 458677-04 EPA Guideline 70-1(Special Study)
Test material: Purity: 97.1% Common name Atrazine chemical name: IUPAC
CAS name 6-chloro-N-ethyl-N’-(1-methylethyl)-1,3,5-triazine-2,4-diamineCAS No. 1912-24-9synonymsEPA PC Code: 80803
Primary Reviewer: Thomas M. Steeger, Ph.D., Senior Biologist Date: March 27, 2003Environmental Fate and Effects Division, ERB 4, U. S. Environmental Protection Agency
Secondary Reviewer(s): Joseph E. Tietge, M.S., Research Aquatic Biologist Date:Mid-Continent Ecology Division, National Health and Environmental Effects Research Laboratory (Duluth),U. S. Environmental Protection Agency
Stephanie Irene, Ph.D., Senior Advisor Date: Environmental Fate and Effects Division, ERB 3, U. S. Environmental Protection Agency
Mary J. Frankenberry, Senior Statistician Date: Environmental Fate and Effects Division, ERB 3, U. S. Environmental Protection Agency
EPA PC Code 080803
Date Evaluation Completed: 05/31/2003
CITATION: Hecker, M., K. K. Coady, D. L. Villeneuve, M. B. Murphy, P. D. Jones and J. P. Giesy. 2003. Response of Xenopus laevis to Atrazine Exposure: Assessment of the Mechanism of Action of Atrazine. Aquatic Toxicology Laboratory, Michigan State University, National Food Safety and Toxicology Center, E. Lansing, MI. Sponsor: Syngenta Crop Protection, Inc., Laboratory Study ID ECORISK Number MSU-04.
Data Evaluation Report on Response of Xenopus laevis to Atrazine Exposure: Assessment of the Mechanism of Action of Atrazine.
EPA MRID Number 458677-04
Page 2 of 48

Data Evaluation Report on Response of Xenopus laevis to Atrazine Exposure: Assessment of the Mechanism of Action of Atrazine.
EPA MRID Number 458677-04
EXECUTIVE SUMMARY:
African clawed frogs (Xenopus laevis) were exposed (approximately 30 tadpoles/replicate with 8 replicates/treatment) to atrazine at 0.1, 1.0, 10, and 25 µg/L in FETAX media in a static renewal system where 50% of the exposure solutions were changed every 72 hours.. Exposures were also conducted using negative and positive (17-$ estradiol and dihydrotestosterone) and a solvent (0.005% ethanol) control. Larvae were exposed from 72-hours post- hatch through metamorphosis (fore-limb emergence and tail resorption; NF stage 66). At metamorphosis, a subset (number not recorded) was euthanized; gonads were examined for gross morphology and gonad/larynx prepared for histology. The remaining animals were exposed until 2- 3 months post-metamorphosis. Afterwards, half the frogs were used for gross morphology and histology of the gonads. All frogs were examined for gross morphology, and 50 frogs per treatment were serially sectioned for gonad histology. One frog from each replicate tank (64 frogs total) was randomly selected, and blood (drawn by cardiac puncture), brain and gonads were collected for sex steroid hormone and aromatase activity assays. Plasma concentrations of testosterone and estradiol were measured by ELISA, while tritium-labeled water release assay was used to measure aromatase in brain and gonad tissue.
The study authors concluded that atrazine treatment did not affect mortality, time to metamorphosis, sex ratio, gonadal development, aromatase activity or steroid hormone plasma concentrations in a dose-dependent fashion. Also, estradiol (positive control) treatment only appeared to increase estradiol plasma concentrations. Dihyrotestosterone (positive control) increased larynx dilator muscle area in females, and neither positive control influenced sex ratios.
Although the most frequent gonadal abnormality based on gross morphology was discontinuous gonads, histology indicated that mixed sex/intersex (ovarian and testicular tissue in the same frog) was much more common than indicated by gross morphology. Since histology is still being conducted, it is premature to conclude that gonadal abnormalities were not treatment-related.
Poor water quality (elevated ammonia and nitrite with low dissolved oxygen) resulting from relatively high loading rates (30 tadpoles/4 liters of exposure solution) under static conditions may have compromised the growth and development of the test animals. On average, it took 73 days for frogs to complete metamorphosis and 17 (<2%) frogs in the study never underwent metamorphosis. Furthermore, the negative controls were contaminated with atrazine at levels comparable to those in the 0.1 µg/L atrazine treatment. High variability (coefficients of variability ranging as high as 524%) associated with gonadal aromatase activity and with plasma steroid hormone levels made it difficult to differentiate treatment effects. Also, it is unclear why estradiol treatment failed to skew sex ratios significantly in favor of females when other studies have demonstrated this effect. In summary, a combination of tank effects, contaminated controls, high variability and an apparent lack of responsiveness to estradiol made it difficult for the study authors to test their hypothesis and to differentiate treatment effects.
Page 3 of 48
Data Evaluation Report on Response of Xenopus laevis to Atrazine Exposure: Assessment of the Mechanism of Action of Atrazine.
EPA MRID Number 458677-04
I. MATERIALS AND METHODS
GUIDELINE FOLLOWED: Nonguideline Study COMPLIANCE: Not conducted under full GLP; however, most practices as defined
by 40 CFR Part 160, August 19, 1989 were established for this study, including but not limited to:
• Written, authorized protocol • Written, authorized Standard Operating Procedures for all key procedures. • Organization and Personnel were sufficient in terms of number, education, training and experience. • Facilities were of suitable size and construction • Equipment used was of appropriate design and adequate capacity. • Independent QA Inspections were conducted. • Final Report was written • Raw data, documentation, records, protocols, and final report were archieved.
A. MATERIALS:
1. Test Material Atrazine
Description: Not reported
Lot No./Batch No. : Not reported
Purity: 97.1% Stability of compound
undertest conditions: Not reported
Storage conditions of test chemicals: Not reported
2. Test organism:
Species: African clawed frog (Xenopus laevis).Age at test initiation:Larvae (72-hours post-hatch) Weight at study initiation: (mean and range) Not reported Length at study initiation: (mean and range) Not reported
Source: Sexually mature X. laevis obtained from Xenopus Express® (Homossa, FL) induced with human chorionic gonadotropin; fertilized eggs dejellied in 2% L-cysteine in FETAX medium checked for viability, divided into groups of 35 fertilized eggs, then distributed into exposure solutions at 72-hours post-hatch.
Page 4 of 48

Data Evaluation Report on Response of Xenopus laevis to Atrazine Exposure: Assessment of the Mechanism of Action of Atrazine.
EPA MRID Number 458677-04
B. STUDY DESIGN:
Objective: 1. To determine the effects of atrazine on metamorphosis and reproductive indices of larval,Xenopus laevis were exposed from72 hours after hatching until the completion of metamorphosis. Indices evaluated at the time of metamorphic completion included % initiation of metamorphosis, % completion of metamorphosis, time to metamorphosis, fresh body weight, snout-vent length, size of the laryngeal dilator muscle and gonad development.
2. To determine the concentration of circulating hormones, including testosterone and estradiol in control and atrazine-treated X. laevis
3. To investigate aromatase activity in the gonads and brain tissue of control and atrazine-exposed X. laevis.
1. Experimental Conditions
a) Range-finding Study: Exposure concentrations based on previous work
b. Definitive Study
Table 1 . Experimental Parameters
Parameter Details
Acclimation: period:
Conditions: (same as test or not) Feeding: Health: (any mortality observed)
72 hours FETAX solution not reported not reported
Duration of the test 185-day study
Test condition
static/flow- through
Type of dilution system for flow-through method.
Renewal rate for static renewal
static renewal
NA
50% test solution change every 72 hours
Aeration, if any not reported
Page 5 of 48
Data Evaluation Report on Response of Xenopus laevis to Atrazine Exposure: Assessment of the Mechanism of Action of Atrazine.
EPA MRID Number 458677-04
Parameter Details
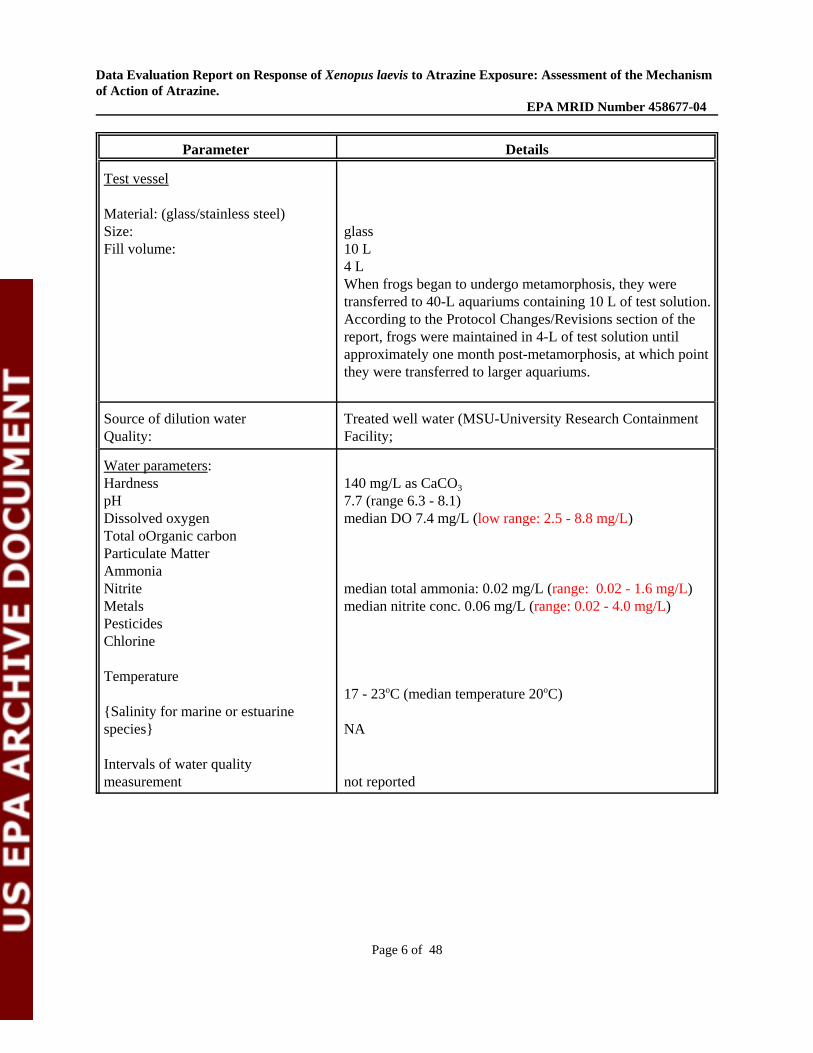
Test vessel
Material: (glass/stainless steel) Size: Fill volume:
glass 10 L 4 L When frogs began to undergo metamorphosis, they were transferred to 40-L aquariums containing 10 L of test solution. According to the Protocol Changes/Revisions section of the report, frogs were maintained in 4-L of test solution until approximately one month post-metamorphosis, at which point they were transferred to larger aquariums.
Source of dilution water Quality:
Treated well water (MSU-University Research Containment Facility;
Water parameters: Hardness pH Dissolved oxygen Total oOrganic carbon Particulate Matter Ammonia Nitrite Metals Pesticides Chlorine
Temperature
{Salinity for marine or estuarine species}
Intervals of water quality measurement
140 mg/L as CaCO3
7.7 (range 6.3 - 8.1) median DO 7.4 mg/L (low range: 2.5 - 8.8 mg/L)
median total ammonia: 0.02 mg/L (range: g/L) median nitrite conc. 0.06 mg/L (range: 0.02 - 4.0 mg/L)
17 - 23oC (median temperature 20oC)
NA
not reported
0.02 - 1.6 m
Page 6 of 48

Data Evaluation Report on Response of Xenopus laevis to Atrazine Exposure: Assessment of the Mechanism of Action of Atrazine.
EPA MRID Number 458677-04
Parameter Details
Number of replicates/groups: negative control: FETAX media solvent control: 0.005% ethanol treated ones: atrazine at 0.1, 1.0, 10 and 25 µg/L in FETAX positive controls: dihydrotestosterone and estradiol in 0.005% EtOH.
8 8
8
8
Number of organisms per replicate /groups: control: solvent control: treated ones:
(30 tadpoles /rep) x 8 reps = 240 tadpoles 30 tadpoles /rep) x 8 reps = 240 tadpoles 30 tadpoles /rep) x 8 reps = 240 tadpoles
Biomass loading rate 30 tadpoles/4 L
Test concentrations: nominal: measured:
0.1, 1.0, 10 and 25 µg/L 0.2, 1.0, 16, and 29 µg a.i./L
Solvent (type, percentage, if used) FETAX for atrazine; 0.005% ethanol/FETAX for positive hormone controls FETAX: 0.625 g/L NaCl; 0.030 g/L KCl; 0.015 g/L CaCl2; 0.096 g/L NaHCO3; 0.06 g/L CaSO4 *2H2O; and 0.075 g/L MgSO4)
Lighting not reported
Feeding Appendix reports that frog brittle was previously analyzed (TTU-10/Syngenta Number 1833-01) by immunoassay yielding inconclusive results. Feeding regime is not reported
Recovery of chemical
Level of Quantitation Level of Detection
ELISA (Envirogard Triazine®; Strategic Diagnostics Newark, DE)/Beacon Analytical triazine plate (Beacon Analytical Systems, Portland, ME)
LOD 0.025 µg/L (Envirogard); 0.05 µg/L (Beacon)
Positive control {if used, indicate the chemical and concentrations}
dihydrotestosterone 0.1 µg/L 17-$ estradiol 0.1 µg/L both hormones in 0.005% ethanol
Other parameters, if any NA
2. Observations:
Page 7 of 48

Data Evaluation Report on Response of Xenopus laevis to Atrazine Exposure: Assessment of the Mechanism of Action of Atrazine.
EPA MRID Number 458677-04
Table 2: Observations
Criteria Details
Parameters measured including the sublethal effects/toxicity symptoms
mortality; time to metamorphosis, number completing metamorphosis, age (days) at metamorphosis, length, weight, gonadal abnormalities, sex
Observation intervals daily
Were raw data included? Yes
Other observations, if any
Animals not reaching metamorphosis by 506 days were sacrificed.
All frogs completing metamorphosis were analyzed for gross morphology and histology of the gonads (no mention of kidneys).
At metamorphosis, a subset (number not recorded) was euthanized at metamorphic completion. Gonads were examined for gross morphology, and gonad/larynx was prepared for histology. Remaining tadpoles/metamorphs were transferred to 40-L aquariums containing 10 L of test solution where frogs were exposed until 2- 3 months post-metamorphosis. Afterwards, half the frogs were fixed in Bouin’s solution and set aside for gross morphology and histology of the gonads. All frogs were examined for gross morphology, and 50 frogs per treatment were serially sectioned for gonad histology. The remaining half of the “grow-out” frogs were killed and necropsied from June 11 to June 24, 2002. One frog from each replicate tank (64 frogs total) was randomly selected and blood (drawn by cardiac puncture), brain and gonads were collected for sex steroid hormone and aromatase activity assays. Plasma concentrations of testosterone and estradiol were measured by ELISA. Tritium-labeled androstenedione water release assay was used to measure aromatase in brain and gonad tissue.
II. RESULTS and DISCUSSION:
Water Quality
No ammonia or nitrite levels are reported for February 6 through 21, 2002. Total ammonia nitrogen (range 0.02 - 1.6 mg/L) and nitrite (range: 0.02 - 3.0 mg/L) appeared to be highest during the January 10 through April 1 , 2002. This period corresponds to roughly exposure days 21 through 80 and suggests that water quality may have influenced this study. Also, pH during the first week of the study (December 21 - 27, 2001) was unusually low (pH range: 6.3 - 6.9). The lower range of dissolved oxygen was consistently low from February 21 through March 20, 2002, averaging 4.9 mg/L and dropped as low as 2.5 mg/L.
Mean-measured concentrations of atrazine (Table 3) in the 0.1, 10, and 25 µg/L treatments ranged from 1.2 to 2.0 times higher than nominal concentrations, while the 1.0 µg/L group measured values were consistent with nominal. Atrazine was however detected at measurable levels in the dilution water control. Atrazine concentrations in the dilution water control ranged as high as those detected in the lowest (0.1µg/L) atrazine
Page 8 of 48
Data Evaluation Report on Response of Xenopus laevis to Atrazine Exposure: Assessment of the Mechanism of Action of Atrazine.
EPA MRID Number 458677-04 treatment. While atrazine was detected in positive controls and the solvent control, the levels reported are at and/or below the detection limit of the ELISA assay used for analysis.
Mortality
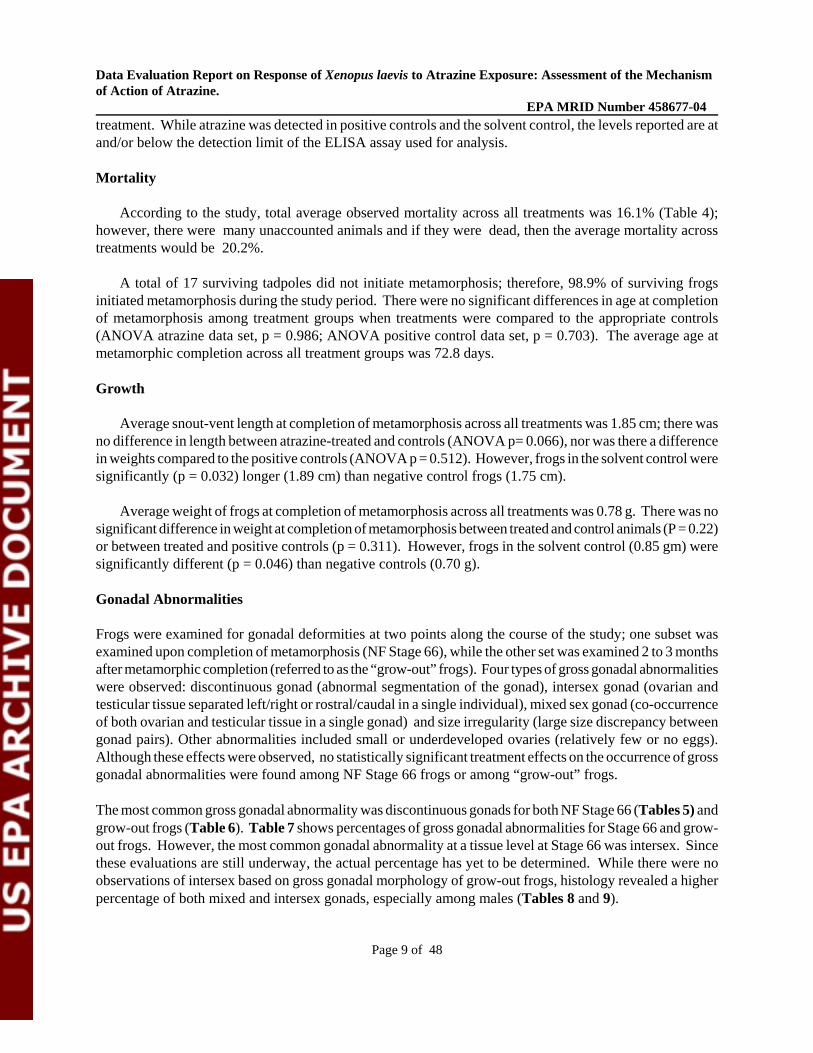
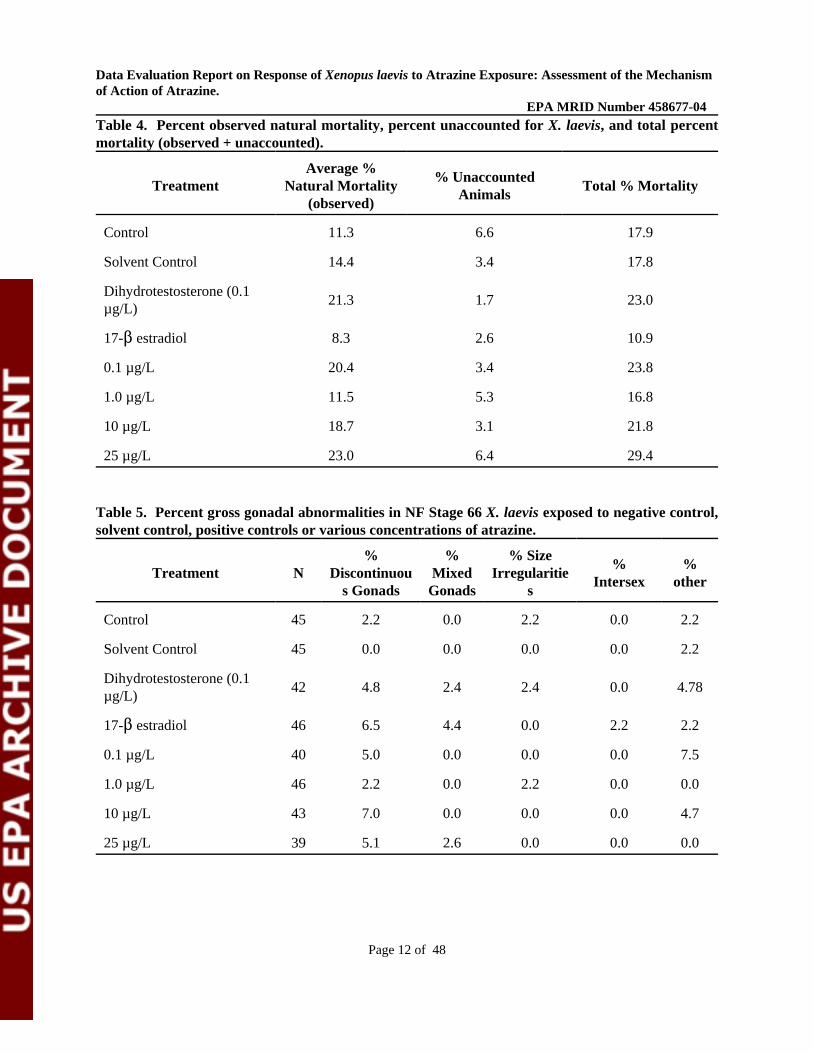
According to the study, total average observed mortality across all treatments was 16.1% (Table 4); however, there were many unaccounted animals and if they were dead, then the average mortality across treatments would be 20.2%.
A total of 17 surviving tadpoles did not initiate metamorphosis; therefore, 98.9% of surviving frogs initiated metamorphosis during the study period. There were no significant differences in age at completion of metamorphosis among treatment groups when treatments were compared to the appropriate controls (ANOVA atrazine data set, p = 0.986; ANOVA positive control data set, p = 0.703). The average age at metamorphic completion across all treatment groups was 72.8 days.
Growth
Average snout-vent length at completion of metamorphosis across all treatments was 1.85 cm; there was no difference in length between atrazine-treated and controls (ANOVA p= 0.066), nor was there a difference in weights compared to the positive controls (ANOVA p = 0.512). However, frogs in the solvent control were significantly (p = 0.032) longer (1.89 cm) than negative control frogs (1.75 cm).
Average weight of frogs at completion of metamorphosis across all treatments was 0.78 g. There was no significant difference in weight at completion of metamorphosis between treated and control animals (P = 0.22) or between treated and positive controls (p = 0.311). However, frogs in the solvent control (0.85 gm) were significantly different (p = 0.046) than negative controls (0.70 g).
Gonadal Abnormalities
Frogs were examined for gonadal deformities at two points along the course of the study; one subset was examined upon completion of metamorphosis (NF Stage 66), while the other set was examined 2 to 3 months after metamorphic completion (referred to as the “grow-out” frogs). Four types of gross gonadal abnormalities were observed: discontinuous gonad (abnormal segmentation of the gonad), intersex gonad (ovarian and testicular tissue separated left/right or rostral/caudal in a single individual), mixed sex gonad (co-occurrence of both ovarian and testicular tissue in a single gonad) and size irregularity (large size discrepancy between gonad pairs). Other abnormalities included small or underdeveloped ovaries (relatively few or no eggs). Although these effects were observed, no statistically significant treatment effects on the occurrence of gross gonadal abnormalities were found among NF Stage 66 frogs or among “grow-out” frogs.
The most common gross gonadal abnormality was discontinuous gonads for both NF Stage 66 (Tables 5) and grow-out frogs (Table 6). Table 7 shows percentages of gross gonadal abnormalities for Stage 66 and grow-out frogs. However, the most common gonadal abnormality at a tissue level at Stage 66 was intersex. Since these evaluations are still underway, the actual percentage has yet to be determined. While there were no observations of intersex based on gross gonadal morphology of grow-out frogs, histology revealed a higher percentage of both mixed and intersex gonads, especially among males (Tables 8 and 9).
Page 9 of 48
Data Evaluation Report on Response of Xenopus laevis to Atrazine Exposure: Assessment of the Mechanism of Action of Atrazine.
EPA MRID Number 458677-04
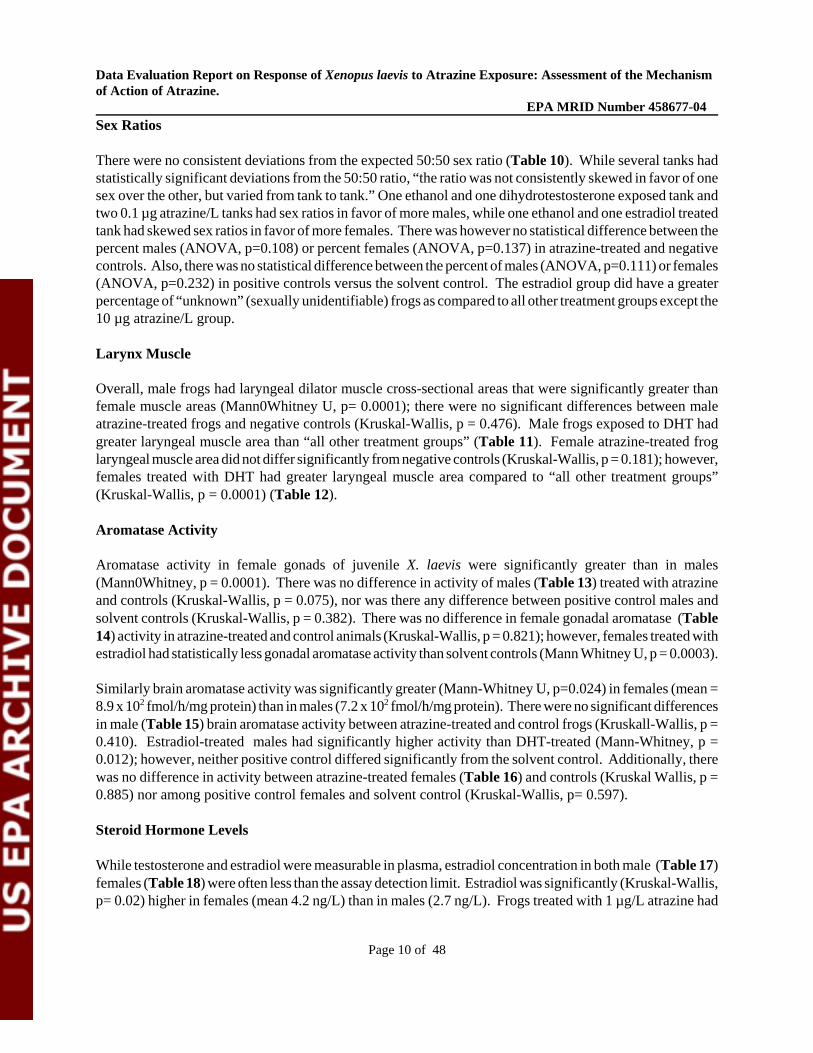
Sex Ratios
There were no consistent deviations from the expected 50:50 sex ratio (Table 10). While several tanks had statistically significant deviations from the 50:50 ratio, “the ratio was not consistently skewed in favor of one sex over the other, but varied from tank to tank.” One ethanol and one dihydrotestosterone exposed tank and two 0.1 µg atrazine/L tanks had sex ratios in favor of more males, while one ethanol and one estradiol treated tank had skewed sex ratios in favor of more females. There was however no statistical difference between the percent males (ANOVA, p=0.108) or percent females (ANOVA, p=0.137) in atrazine-treated and negative controls. Also, there was no statistical difference between the percent of males (ANOVA, p=0.111) or females (ANOVA, p=0.232) in positive controls versus the solvent control. The estradiol group did have a greater percentage of “unknown” (sexually unidentifiable) frogs as compared to all other treatment groups except the 10 µg atrazine/L group.
Larynx Muscle
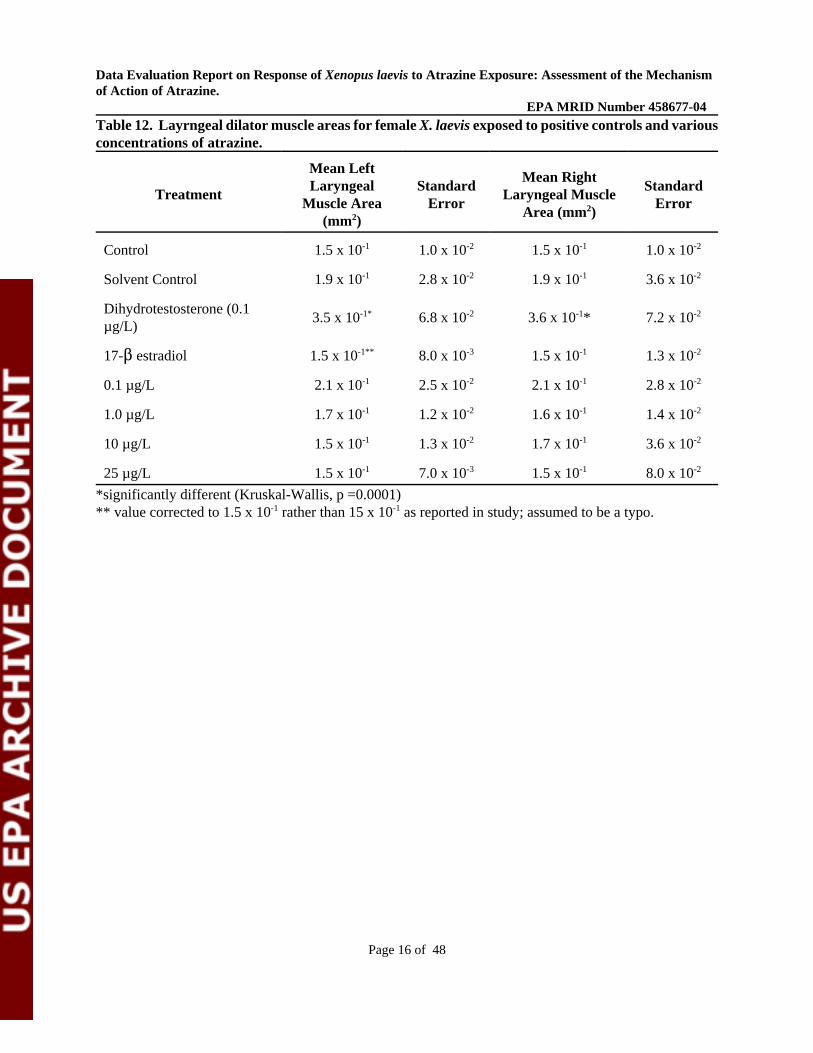
Overall, male frogs had laryngeal dilator muscle cross-sectional areas that were significantly greater than female muscle areas (Mann0Whitney U, p= 0.0001); there were no significant differences between male atrazine-treated frogs and negative controls (Kruskal-Wallis, p = 0.476). Male frogs exposed to DHT had greater laryngeal muscle area than “all other treatment groups” (Table 11). Female atrazine-treated frog laryngeal muscle area did not differ significantly from negative controls (Kruskal-Wallis, p = 0.181); however, females treated with DHT had greater laryngeal muscle area compared to “all other treatment groups” (Kruskal-Wallis, p = 0.0001) (Table 12).
Aromatase Activity
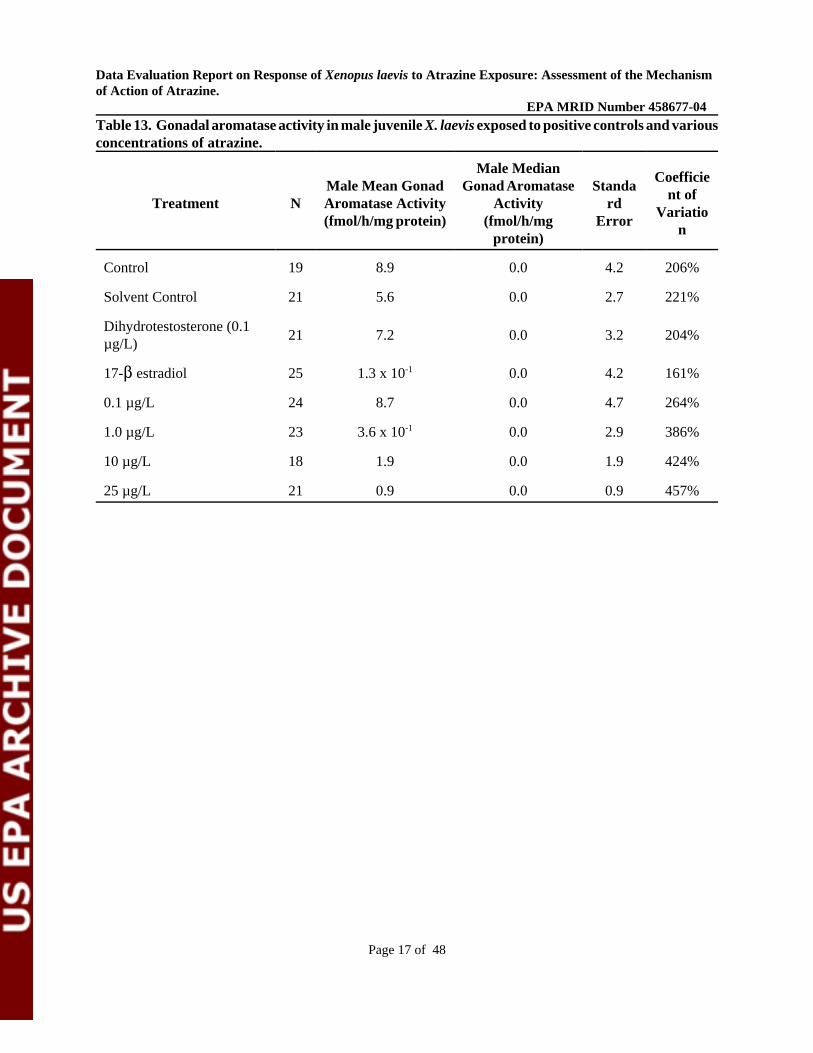
Aromatase activity in female gonads of juvenile X. laevis were significantly greater than in males (Mann0Whitney, p = 0.0001). There was no difference in activity of males (Table 13) treated with atrazine and controls (Kruskal-Wallis, p = 0.075), nor was there any difference between positive control males and solvent controls (Kruskal-Wallis, p = 0.382). There was no difference in female gonadal aromatase (Table 14) activity in atrazine-treated and control animals (Kruskal-Wallis, p = 0.821); however, females treated with estradiol had statistically less gonadal aromatase activity than solvent controls (Mann Whitney U, p = 0.0003).
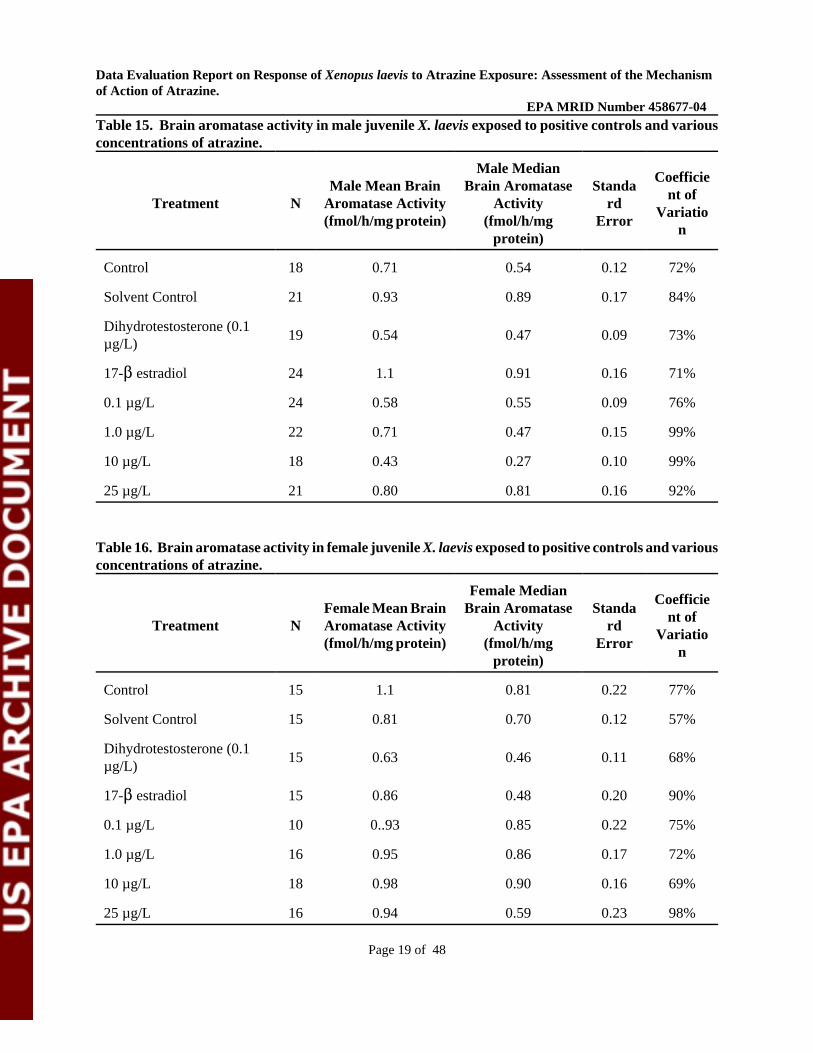
Similarly brain aromatase activity was significantly greater (Mann-Whitney U, p=0.024) in females (mean = 8.9 x 10² fmol/h/mg protein) than in males (7.2 x 10² fmol/h/mg protein). There were no significant differences in male (Table 15) brain aromatase activity between atrazine-treated and control frogs (Kruskall-Wallis, p = 0.410). Estradiol-treated males had significantly higher activity than DHT-treated (Mann-Whitney, p = 0.012); however, neither positive control differed significantly from the solvent control. Additionally, there was no difference in activity between atrazine-treated females (Table 16) and controls (Kruskal Wallis, p = 0.885) nor among positive control females and solvent control (Kruskal-Wallis, p= 0.597).
Steroid Hormone Levels
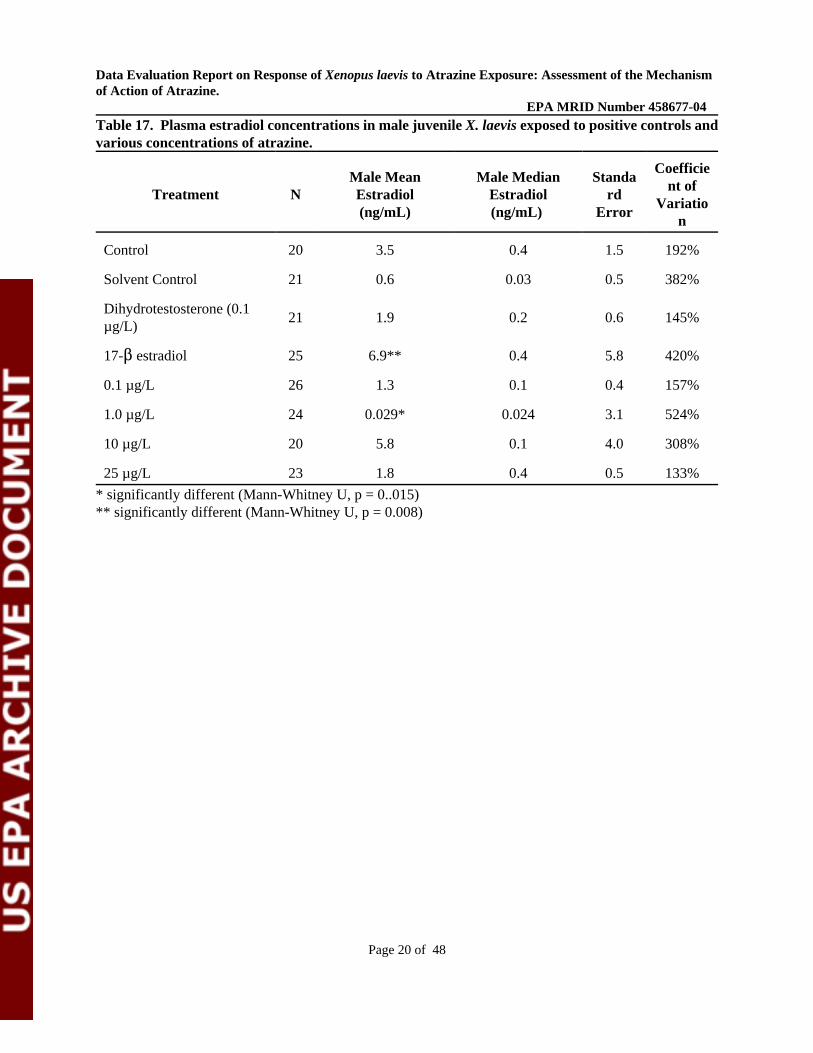
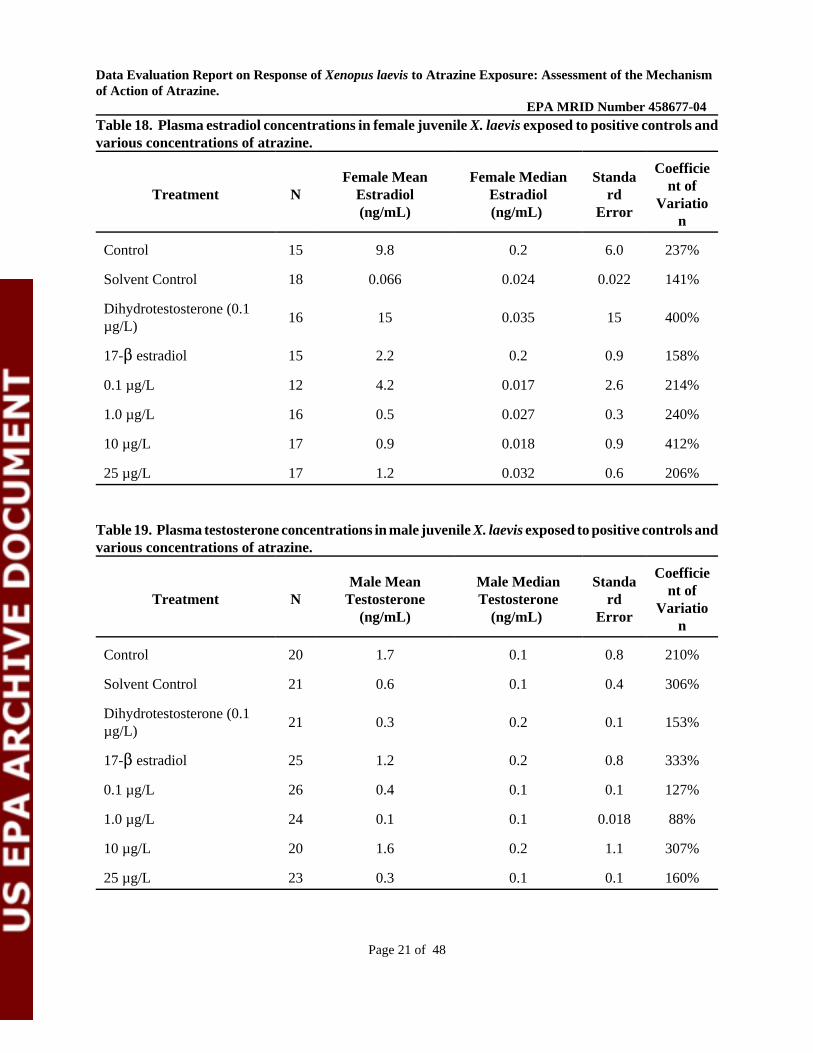
While testosterone and estradiol were measurable in plasma, estradiol concentration in both male (Table 17) females (Table 18) were often less than the assay detection limit. Estradiol was significantly (Kruskal-Wallis, p= 0.02) higher in females (mean 4.2 ng/L) than in males (2.7 ng/L). Frogs treated with 1 µg/L atrazine had
Page 10 of 48

Data Evaluation Report on Response of Xenopus laevis to Atrazine Exposure: Assessment of the Mechanism of Action of Atrazine.
EPA MRID Number 458677-04 significantly less estradiol than controls, 0.1 and 25µg/L-treated frogs (Mann-Whitney, p < 0.015); however, males exposed to 0.1, 10 and 25 µg/L were not different than untreated controls. Plasma estradiol in males treated with estradiol were higher than those in the solvent control (Mann-Whitney U, p = 0.008)
Among female there was no difference in atrazine-treated and control frogs nor between positive control and solvent controls.
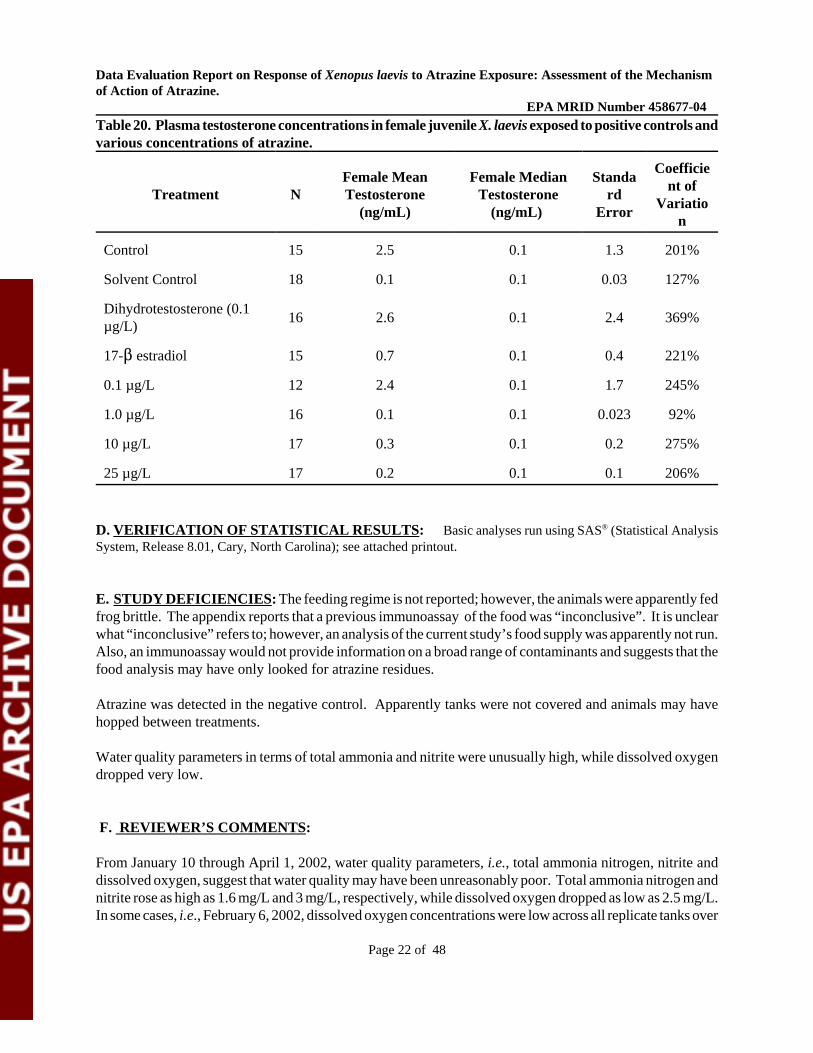
There were no differences between male and female testosterone levels (Kruskal-Wallis, p= 0.170); there was no significant difference between atrazine-treated males (Table 19) and untreated control males (Kruskal-Wallis, p = 0,270) nor between positive controls and solvent control (Kruskal-Wallis, p = 0.187). Likewise, there was no difference in plasma testosterone levels in atrazine-treated females (Table 20) and controls (Kruskal-Wallis, p = 0.179) or between positive controls and solvent controls (Kruskal-Wallis, p= 0.363).
C. REPORTED STATISTICS:Table 3. Nominal versus mean-measured atrazine concentrations.
Atrazine Syngenta MSU Treatment (nominal) mean-measured mean-measured
µg/L µg/L µg/L
Control -- 0.16 (0.11 - 0.20) 0.11 (0.07 - 0.15)
Solvent Control -- 0.010 (0.01 - 0.01) < 0.05
Dihydrotestosterone (0.1 µg/L)
-- 0.020 (0.01 - 0.01) < 0.05
17-$ estradiol -- 0.04 (0.03 - 0.05) < 0.05
0.1 µg/L 0.1 0.22 (0.17 - 0.26) 0.23 (0.16 - 0.31)
1.0 µg/L 1.0 1.0 (0.93) 1.4 (1.2 - 1.7)
10 µg/L 10 16 (14 - 19) 11 (9.7 - 13)
25 µg/L 25 29(24 - 35) 25 (22 - 28)
Page 11 of 48
Data Evaluation Report on Response of Xenopus laevis to Atrazine Exposure: Assessment of the Mechanism of Action of Atrazine.
EPA MRID Number 458677-04
Table 4. Percent observed natural mortality, percent unaccounted for X. laevis, and total percent mortality (observed + unaccounted).
Average % % Unaccounted
Treatment Natural Mortality Animals
Total % Mortality (observed)
Control
Solvent Control
Dihydrotestosterone (0.1 µg/L)
17-$ estradiol
0.1 µg/L
1.0 µg/L
10 µg/L
25 µg/L
11.3 6.6 17.9
14.4 3.4 17.8
21.3 1.7 23.0
8.3 2.6 10.9
20.4 3.4 23.8
11.5 5.3 16.8
18.7 3.1 21.8
23.0 6.4 29.4
Table 5. Percent gross gonadal abnormalities in NF Stage 66 X. laevis exposed to negative control, solvent control, positive controls or various concentrations of atrazine.
Treatment N %
Discontinuou s Gonads
% Mixed
Gonads
% Size Irregularitie
s
% Intersex
% other
Control 45 2.2 0.0 2.2 0.0 2.2
Solvent Control 45 0.0 0.0 0.0 0.0 2.2
Dihydrotestosterone (0.1 42 4.8 2.4 2.4 0.0 4.78
µg/L)
17-$ estradiol
0.1 µg/L
1.0 µg/L
10 µg/L
25 µg/L
46 6.5 4.4 0.0 2.2 2.2
40 5.0 0.0 0.0 0.0 7.5
46 2.2 0.0 2.2 0.0 0.0
43 7.0 0.0 0.0 0.0 4.7
39 5.1 2.6 0.0 0.0 0.0
Page 12 of 48

Data Evaluation Report on Response of Xenopus laevis to Atrazine Exposure: Assessment of the Mechanism of Action of Atrazine.
EPA MRID Number 458677-04
Table 6. Percent gross gonadal abnormalities in male and female grow-out X. laevis exposed to negative control, solvent control, positive controls or various concentrations of atrazine.
% Discontinuous % Mixed % SizeTreatment N
Gonads Gonads Irregularities
Control 75 1.4 0.0 2.7
Solvent Control 75 2.7 0.0 1.3
Dihydrotestosterone (0.1 µg/L) 72 1.4 0.0 0.0
17-$ estradiol
0.1 µg/L
1.0 µg/L
10 µg/L
25 µg/L
77 2.6 0.0 0.0
71 4.2 0.0 0.0
79 1.3 0.0 2.5
73 4.1 2.7 0.0
67 3.0 0.0 0.0
Table 7. Percent gross gonadal abnormalities in Stage 66 and male and female grow-out X. laevis exposed to negative control, solvent control, positive controls or various concentrations of atrazine.
% % % Size
Treatment N Discontinuous Mixed Gonads Gonads
Irregularities
Control 120 3.6 0.0 4.9
Solvent Control 120 2.7 0.0 1.3
Dihydrotestosterone (0.1 µg/L) 114 6.2 2.4 2.4
17-$ estradiol
0.1 µg/L
1.0 µg/L
10 µg/L
25 µg/L
123 9.1 6.6 0.0
111 9.2 0.0 0.0
125 3.5 0.0 4.7
116 11.1 2.7 0.0
106 8.1 2.6 0.0
Page 13 of 48

Data Evaluation Report on Response of Xenopus laevis to Atrazine Exposure: Assessment of the Mechanism of Action of Atrazine.
EPA MRID Number 458677-04
Table 8. Percent gonadal abnormalities at the tissue level (based on histology) in grow-out male X. laevis exposed to negative control, solvent control, positive controls or various concentrations of atrazine.
% % OtherTreatment N % Mixed Sex
Intersex Abnormalities
Control 25 8.0 16.0 0.0
Solvent Control 25 20.0 4.0 0.0
Dihydrotestosterone (0.1 µg/L) 25 4.0 0.0 0.0
17-$ estradiol
0.1 µg/L
1.0 µg/L
10 µg/L
25 µg/L
25 32.0 0.0 0.0
25 16.0 0.0 0.0
25 8.0 4.0 0.0
25 12.0 0.0 0.0
25 8.0 0.0 0.0
Table 9. Percent gonadal abnormalities at the tissue level (based on histology) in grow-out female X. laevis exposed to negative control, solvent control, positive controls or various concentrations of atrazine.
% % OtherTreatment N % Mixed Sex
Intersex Abnormalities
Control 25 0.0 0.0 0.0
Solvent Control 25 0.0 0.0 4.0
Dihydrotestosterone (0.1 µg/L) 25 0.0 0.0 0.0
17-$ estradiol
0.1 µg/L
1.0 µg/L
10 µg/L
25 µg/L
25 8.0 0.0 0.0
24 0.0 0.0 0.0
25 0.0 0.0 8.0
25 0.0 0.0 0.0
25 0.0 0.0 4.0
Page 14 of 48

Data Evaluation Report on Response of Xenopus laevis to Atrazine Exposure: Assessment of the Mechanism of Action of Atrazine.
EPA MRID Number 458677-04
Table 10. Percent male and female grow-out X.. laevis in each treatment.
Treatment % Males % Females % Unkown
Control
Solvent Control
Dihydrotestosterone (0.1 µg/L)
17-$ estradiol
0.1 µg/L
1.0 µg/L
10 µg/L
25 µg/L
48.2 51.8 0.0
45.2 54.8 0.0
50.5 49.5 0.0
36.2 61.3 2.5
57.9 42.1 0.0
50.7 49.3 0.0
49.2 49.7 1.1
42.5 56.9 0.6
Table 11. Layrngeal dilator muscle areas for male X. laevis exposed to positive controls and various concentrations of atrazine.
Mean Left Mean Right
Treatment Laryngeal Standard
Laryngeal Muscle Standard
Muscle Area Error Area (mm2)
Error (mm2)
Control
Solvent Control
Dihydrotestosterone (0.1 µg/L)
17-$ estradiol
0.1 µg/L
1.0 µg/L
10 µg/L
25 µg/L
2.1 x 10⁻¹ 9.0 x 10⁻³ 2.1 x 10⁻¹ 1.0 x 10⁻²
1.9 x 10⁻¹ 2.0 x 10⁻² 1.7 x 10⁻¹ 1.6 x 10⁻²
3.0 x 10-1* 2.2 x 10-2 3.1 x 10-1* 2.1 x 10-2
2.2 x 10⁻¹ 2.3 x 10⁻² 2.1 x 10⁻¹ 2.0 x 10⁻²
2.1 x 10⁻¹ 2.4 x 10⁻² 2.2 x 10⁻¹ 2.8 x 10⁻²
2.3 x 10⁻¹ 1.1 x 10⁻² 2.2 x 10⁻¹ 8.0 x 10⁻³
2.2 x 10⁻¹ 1.3 x 10⁻² 2.2 x 10⁻¹ 1.8 x 10⁻²
2.0 x 10⁻¹ 1.3 x 10⁻² 1.9 x 10⁻¹ 3.0 x 10⁻²
*significantly different (Kruskal-Wallis, p =0.0001)
Page 15 of 48
Data Evaluation Report on Response of Xenopus laevis to Atrazine Exposure: Assessment of the Mechanism of Action of Atrazine.
EPA MRID Number 458677-04
Table 12. Layrngeal dilator muscle areas for female X. laevis exposed to positive controls and various concentrations of atrazine.
Mean Left Mean Right
Treatment Laryngeal Standard
Laryngeal Muscle Standard
Muscle Area Error Area (mm2)
Error (mm2)
Control
Solvent Control
Dihydrotestosterone (0.1 µg/L)
17-$ estradiol
0.1 µg/L
1.0 µg/L
10 µg/L
25 µg/L
1.5 x 10⁻¹ 1.0 x 10⁻² 1.5 x 10⁻¹ 1.0 x 10⁻²
1.9 x 10⁻¹ 2.8 x 10⁻² 1.9 x 10⁻¹ 3.6 x 10⁻²
3.5 x 10-1* 6.8 x 10-2 3.6 x 10-1* 7.2 x 10-2
1.5 x 10⁻¹** 8.0 x 10⁻³ 1.5 x 10⁻¹ 1.3 x 10⁻²
2.1 x 10⁻¹ 2.5 x 10⁻² 2.1 x 10⁻¹ 2.8 x 10⁻²
1.7 x 10⁻¹ 1.2 x 10⁻² 1.6 x 10⁻¹ 1.4 x 10⁻²
1.5 x 10⁻¹ 1.3 x 10⁻² 1.7 x 10⁻¹ 3.6 x 10⁻²
1.5 x 10⁻¹ 7.0 x 10⁻³ 1.5 x 10⁻¹ 8.0 x 10⁻²
*significantly different (Kruskal-Wallis, p =0.0001) ** value corrected to 1.5 x 10⁻¹ rather than 15 x 10-1 as reported in study; assumed to be a typo.
Page 16 of 48
Data Evaluation Report on Response of Xenopus laevis to Atrazine Exposure: Assessment of the Mechanism of Action of Atrazine.
EPA MRID Number 458677-04
Table 13. Gonadal aromatase activity in male juvenile X. laevis exposed to positive controls and various concentrations of atrazine.
Male Median Coefficie
Male Mean Gonad Gonad Aromatase Standa nt of
Treatment N Aromatase Activity Activity rd Variatio
(fmol/h/mg protein) (fmol/h/mg Error n
protein)
Control
Solvent Control
Dihydrotestosterone (0.1 µg/L)
17-$ estradiol
0.1 µg/L
1.0 µg/L
10 µg/L
25 µg/L
19 8.9 0.0 4.2 206%
21 5.6 0.0 2.7 221%
21 7.2 0.0 3.2 204%
25 1.3 x 10⁻¹ 0.0 4.2 161%
24 8.7 0.0 4.7 264%
23 3.6 x 10⁻¹ 0.0 2.9 386%
18 1.9 0.0 1.9 424%
21 0.9 0.0 0.9 457%
Page 17 of 48

Data Evaluation Report on Response of Xenopus laevis to Atrazine Exposure: Assessment of the Mechanism of Action of Atrazine.
EPA MRID Number 458677-04
Table 14. Gonadal aromatase activity in female juvenile X. laevis exposed to positive controls and various concentrations of atrazine.
Female MedianFemale Mean Coefficie
Gonad Aromatase StandaGonad Aromatase nt of
Treatment N Activity
Activity rd Variatio
(fmol/h/mg protein) (fmol/h/mg Error
nprotein)
Control
Solvent Control
Dihydrotestosterone (0.1 µg/L)
17-$ estradiol
0.1 µg/L
1.0 µg/L
10 µg/L
25 µg/L
16 530 270 160 121%
17 610 400 130 88%
15 200 110 52 101%
15 110* 380 45 158%
10 330 230 120 115%
15 490 210 160 127%
18 510 330 120 100%
16 500 350 110 88%
*significantly different (Kruskal-Wallis, p =0.0003)
Page 18 of 48
Data Evaluation Report on Response of Xenopus laevis to Atrazine Exposure: Assessment of the Mechanism of Action of Atrazine.
EPA MRID Number 458677-04
Table 15. Brain aromatase activity in male juvenile X. laevis exposed to positive controls and various concentrations of atrazine.
Male Median Coefficie
Male Mean Brain Brain Aromatase Standa nt of
Treatment N Aromatase Activity Activity rd Variatio
(fmol/h/mg protein) (fmol/h/mg Error n
protein)
Control
Solvent Control
Dihydrotestosterone (0.1 µg/L)
17-$ estradiol
0.1 µg/L
1.0 µg/L
10 µg/L
25 µg/L
18 0.71 0.54 0.12 72%
21 0.93 0.89 0.17 84%
19 0.54 0.47 0.09 73%
24 1.1 0.91 0.16 71%
24 0.58 0.55 0.09 76%
22 0.71 0.47 0.15 99%
18 0.43 0.27 0.10 99%
21 0.80 0.81 0.16 92%
Table 16. Brain aromatase activity in female juvenile X. laevis exposed to positive controls and various concentrations of atrazine.
Female Median Coefficie
Female Mean Brain Brain Aromatase Standa nt of
Treatment N Aromatase Activity Activity rd Variatio
(fmol/h/mg protein) (fmol/h/mg Error n
protein)
Control
Solvent Control
Dihydrotestosterone (0.1 µg/L)
17-$ estradiol
0.1 µg/L
1.0 µg/L
10 µg/L
25 µg/L
15 1.1 0.81 0.22 77%
15 0.81 0.70 0.12 57%
15 0.63 0.46 0.11 68%
15 0.86 0.48 0.20 90%
10 0..93 0.85 0.22 75%
16 0.95 0.86 0.17 72%
18 0.98 0.90 0.16 69%
16 0.94 0.59 0.23 98%
Page 19 of 48
Data Evaluation Report on Response of Xenopus laevis to Atrazine Exposure: Assessment of the Mechanism of Action of Atrazine.
EPA MRID Number 458677-04
Table 17. Plasma estradiol concentrations in male juvenile X. laevis exposed to positive controls and various concentrations of atrazine.
CoefficieMale Mean Male Median Standa
nt ofTreatment N Estradiol Estradiol rd
Variatio(ng/mL) (ng/mL) Error
n
Control
Solvent Control
Dihydrotestosterone (0.1 µg/L)
17-$ estradiol
0.1 µg/L
1.0 µg/L
10 µg/L
25 µg/L
20 3.5 0.4 1.5 192%
21 0.6 0.03 0.5 382%
21 1.9 0.2 0.6 145%
25 6.9** 0.4 5.8 420%
26 1.3 0.1 0.4 157%
24 0.029* 0.024 3.1 524%
20 5.8 0.1 4.0 308%
23 1.8 0.4 0.5 133%
* significantly different (Mann-Whitney U, p = 0..015) ** significantly different (Mann-Whitney U, p = 0.008)
Page 20 of 48
Data Evaluation Report on Response of Xenopus laevis to Atrazine Exposure: Assessment of the Mechanism of Action of Atrazine.
EPA MRID Number 458677-04
Table 18. Plasma estradiol concentrations in female juvenile X. laevis exposed to positive controls and various concentrations of atrazine.
CoefficieFemale Mean Female Median Standa
nt ofTreatment N Estradiol Estradiol rd
Variatio(ng/mL) (ng/mL) Error
n
Control
Solvent Control
Dihydrotestosterone (0.1 µg/L)
17-$ estradiol
0.1 µg/L
1.0 µg/L
10 µg/L
25 µg/L
15 9.8 0.2 6.0 237%
18 0.066 0.024 0.022 141%
16 15 0.035 15 400%
15 2.2 0.2 0.9 158%
12 4.2 0.017 2.6 214%
16 0.5 0.027 0.3 240%
17 0.9 0.018 0.9 412%
17 1.2 0.032 0.6 206%
Table 19. Plasma testosterone concentrations in male juvenile X. laevis exposed to positive controls and various concentrations of atrazine.
CoefficieMale Mean Male Median Standa
nt ofTreatment N Testosterone Testosterone rd
Variatio(ng/mL) (ng/mL) Error
n
Control
Solvent Control
Dihydrotestosterone (0.1 µg/L)
17-$ estradiol
0.1 µg/L
1.0 µg/L
10 µg/L
25 µg/L
20 1.7 0.1 0.8 210%
21 0.6 0.1 0.4 306%
21 0.3 0.2 0.1 153%
25 1.2 0.2 0.8 333%
26 0.4 0.1 0.1 127%
24 0.1 0.1 0.018 88%
20 1.6 0.2 1.1 307%
23 0.3 0.1 0.1 160%
Page 21 of 48
Data Evaluation Report on Response of Xenopus laevis to Atrazine Exposure: Assessment of the Mechanism of Action of Atrazine.
EPA MRID Number 458677-04
Table 20. Plasma testosterone concentrations in female juvenile X. laevis exposed to positive controls and various concentrations of atrazine.
CoefficieFemale Mean Female Median Standa
nt ofTreatment N Testosterone Testosterone rd
Variatio(ng/mL) (ng/mL) Error
n
Control
Solvent Control
Dihydrotestosterone (0.1 µg/L)
17-$ estradiol
0.1 µg/L
1.0 µg/L
10 µg/L
25 µg/L
15 2.5 0.1 1.3 201%
18 0.1 0.1 0.03 127%
16 2.6 0.1 2.4 369%
15 0.7 0.1 0.4 221%
12 2.4 0.1 1.7 245%
16 0.1 0.1 0.023 92%
17 0.3 0.1 0.2 275%
17 0.2 0.1 0.1 206%
D. VERIFICATION OF STATISTICAL RESULTS: Basic analyses run using SAS® (Statistical Analysis System, Release 8.01, Cary, North Carolina); see attached printout.
E. STUDY DEFICIENCIES: The feeding regime is not reported; however, the animals were apparently fed frog brittle. The appendix reports that a previous immunoassay of the food was “inconclusive”. It is unclear what “inconclusive” refers to; however, an analysis of the current study’s food supply was apparently not run. Also, an immunoassay would not provide information on a broad range of contaminants and suggests that the food analysis may have only looked for atrazine residues.
Atrazine was detected in the negative control. Apparently tanks were not covered and animals may have hopped between treatments.
Water quality parameters in terms of total ammonia and nitrite were unusually high, while dissolved oxygen dropped very low.
F. REVIEWER’S COMMENTS:
From January 10 through April 1, 2002, water quality parameters, i.e., total ammonia nitrogen, nitrite and dissolved oxygen, suggest that water quality may have been unreasonably poor. Total ammonia nitrogen and nitrite rose as high as 1.6 mg/L and 3 mg/L, respectively, while dissolved oxygen dropped as low as 2.5 mg/L. In some cases, i.e., February 6, 2002, dissolved oxygen concentrations were low across all replicate tanks over
Page 22 of 48

Data Evaluation Report on Response of Xenopus laevis to Atrazine Exposure: Assessment of the Mechanism of Action of Atrazine.
EPA MRID Number 458677-04 5 out of the 8 treatments. At a median temperature of 20oC, the solubility of oxygen is 8.84 mg/L (Boyd 1984); thus, at dissolved oxygen concentrations of 2.5 mg/L, the water is roughly 28% of saturation In a study of Rana clamitans initiated in August 2001 (ECORISK Number MSU-03) by the same group of researchers, a similar stocking rate of 30 tadpoles per 4 L of exposure solution resulted in sufficiently poor water quality to impair the survival/development of the tadpoles; the researchers concluded that “to limit mortality and maximize development in future laboratory exposures with R. clamitans, it is recommended that tadpoles be reared at low densities in static tanks (< 1 tadpole/L) or in a continuous flow-through system.” Mortality in the current study averaged 20% across all treatments; however, no data are provided to determine whether mortality was associated with the period of poor water quality. The similar stocking rate for X. laevis is probably responsible for the poor water quality during a considerable portion (80 days) of the developmental/growth period for these tadpoles.
When frogs began to undergo metamorphosis, they were transferred to 40-L aquariums containing 10 L of test solution. According to the Protocol Changes/Revisions section of the report, frogs were maintained in 4-L of test solution until approximately one month post-metamorphosis, at which point they were transferred to larger aquariums. However, when the frogs were in various stages of metamorphosis, the 10-L tanks containing 4 L of test solution was partitioned into three sections. One section housed pre-metamorphic tadpoles, one section held metamorphosing tadpoles and froglets, and the third section contained post-metamorphic frogs. This was done to prevent predation on smaller-sized tadpoles and to facilitate enumeration of individuals in each stage of development. While the tanks may have been larger, the partitioning may have crowded the animals.
Atrazine was apparently present in negative control samples at levels comparable to the 0.1 µg/L atrazine treatment concentration level. Additionally, although mean-measured concentrations indicate that atrazine treatment levels were similar or even higher than nominal, the data represent an average of freshly prepared stock solutions and 72-hour aged exposure solutions. It would have been useful to know atrazine levels in the exposure solutions at 72 hours before the solutions were renewed.
The authors dismissed the apparent atrazine contamination of the controls. However, 21 of 49 measurements exceeded 0.1 ug/L, the nominal concentration of the lowest test concentration tested. And although the actual concentrations in the 0.1 ug/L treatments were on average higher than nominal, 10 of the control concentrations exceeded the concentrations measured on the same day in the 0.1 ug/L treatment. This suggests that these exposures were probably not different. The author notes in the discussion that contaminants in surface waters can give false positives due to cross reactivity with the antibody used in the analysis. However, it should also be noted that they used well water that was treated with reverse osmosis. While it is technically true that the controls are indistinguishable from the low test concentration, it is also evident that the animals did not show any dose dependent effects from atrazine over the concentrations tested.
In terms of exposure, in general the 50% renewal every 72 hours is not optimal, and probably explains the lack of effects in the “positive controls.” Exposure to these compounds may not be efficacious based on mass limitations of the compound and sorption to organic matter and system surfaces. This exposure protocol is probably also responsible for the mortality rates of approximately 20% and may explain the relatively long time to metamorphosis.
The percentage of grow-out frogs with gonadal deformities based on gross morphology was considerably different than estimates based on histology. Since the histological analysis is still being conducted on both
Page 23 of 48
Data Evaluation Report on Response of Xenopus laevis to Atrazine Exposure: Assessment of the Mechanism of Action of Atrazine.
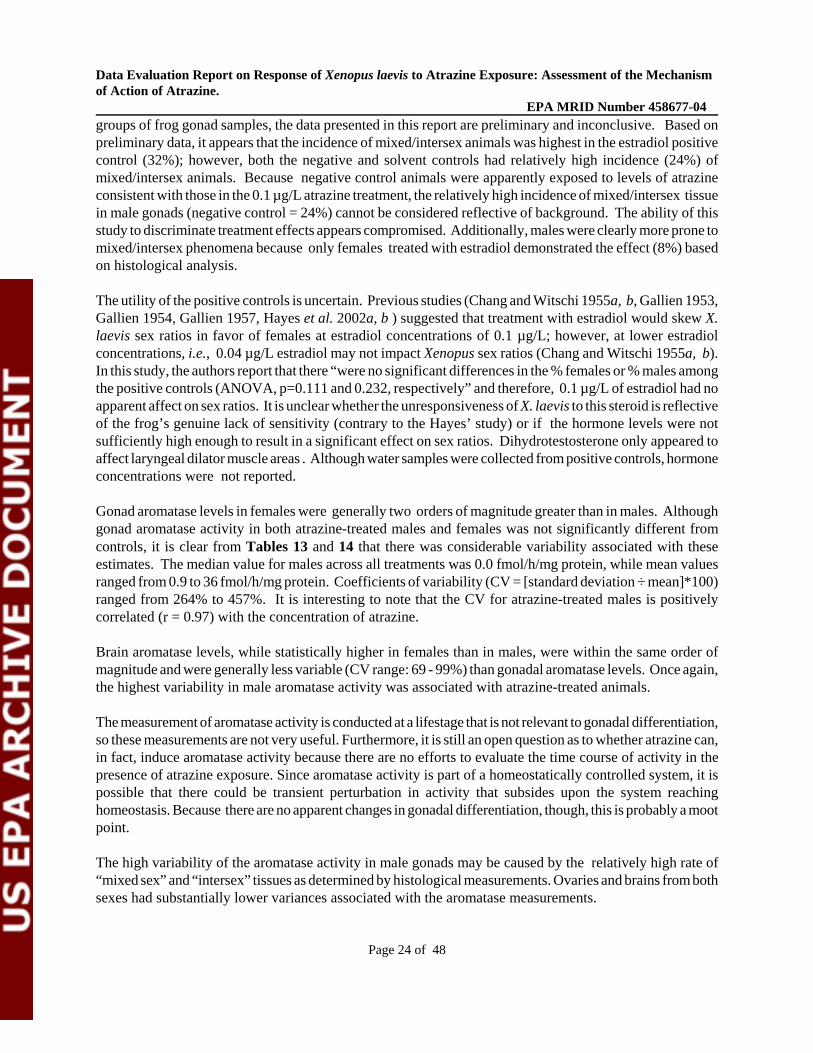
EPA MRID Number 458677-04 groups of frog gonad samples, the data presented in this report are preliminary and inconclusive. Based on preliminary data, it appears that the incidence of mixed/intersex animals was highest in the estradiol positive control (32%); however, both the negative and solvent controls had relatively high incidence (24%) of mixed/intersex animals. Because negative control animals were apparently exposed to levels of atrazine consistent with those in the 0.1 µg/L atrazine treatment, the relatively high incidence of mixed/intersex tissue in male gonads (negative control = 24%) cannot be considered reflective of background. The ability of this study to discriminate treatment effects appears compromised. Additionally, males were clearly more prone to mixed/intersex phenomena because only females treated with estradiol demonstrated the effect (8%) based on histological analysis.
The utility of the positive controls is uncertain. Previous studies (Chang and Witschi 1955a, b, Gallien 1953, Gallien 1954, Gallien 1957, Hayes et al. 2002a, b ) suggested that treatment with estradiol would skew X. laevis sex ratios in favor of females at estradiol concentrations of 0.1 µg/L; however, at lower estradiol concentrations, i.e., 0.04 µg/L estradiol may not impact Xenopus sex ratios (Chang and Witschi 1955a, b). In this study, the authors report that there “were no significant differences in the % females or % males among the positive controls (ANOVA, p=0.111 and 0.232, respectively” and therefore, 0.1 µg/L of estradiol had no apparent affect on sex ratios. It is unclear whether the unresponsiveness of X. laevis to this steroid is reflective of the frog’s genuine lack of sensitivity (contrary to the Hayes’ study) or if the hormone levels were not sufficiently high enough to result in a significant effect on sex ratios. Dihydrotestosterone only appeared to affect laryngeal dilator muscle areas . Although water samples were collected from positive controls, hormone concentrations were not reported.
Gonad aromatase levels in females were generally two orders of magnitude greater than in males. Although gonad aromatase activity in both atrazine-treated males and females was not significantly different from controls, it is clear from Tables 13 and 14 that there was considerable variability associated with these estimates. The median value for males across all treatments was 0.0 fmol/h/mg protein, while mean values ranged from 0.9 to 36 fmol/h/mg protein. Coefficients of variability (CV = [standard deviation ÷ mean]*100) ranged from 264% to 457%. It is interesting to note that the CV for atrazine-treated males is positively correlated (r = 0.97) with the concentration of atrazine.
Brain aromatase levels, while statistically higher in females than in males, were within the same order of magnitude and were generally less variable (CV range: 69 - 99%) than gonadal aromatase levels. Once again, the highest variability in male aromatase activity was associated with atrazine-treated animals.
The measurement of aromatase activity is conducted at a lifestage that is not relevant to gonadal differentiation, so these measurements are not very useful. Furthermore, it is still an open question as to whether atrazine can, in fact, induce aromatase activity because there are no efforts to evaluate the time course of activity in the presence of atrazine exposure. Since aromatase activity is part of a homeostatically controlled system, it is possible that there could be transient perturbation in activity that subsides upon the system reaching homeostasis. Because there are no apparent changes in gonadal differentiation, though, this is probably a moot point.
The high variability of the aromatase activity in male gonads may be caused by the relatively high rate of “mixed sex” and “intersex” tissues as determined by histological measurements. Ovaries and brains from both sexes had substantially lower variances associated with the aromatase measurements.
Page 24 of 48
Data Evaluation Report on Response of Xenopus laevis to Atrazine Exposure: Assessment of the Mechanism of Action of Atrazine.
EPA MRID Number 458677-04 This study does include exposure to the appropriate life stages to evaluate the effects of atrazine on gonadal differentiation, notably stages 44-54, which are apparently the most sensitive to femininization by exogenous estrogenic chemicals.
Plasma steroid hormone levels showed significantly less estradiol in males treated with 1 µg/L atrazine; however, none of the other atrazine treated animals were significantly different than controls. Estradiol treated frogs had significantly higher estradiol than the solvent controls. Similar to the gonad aromatase assay, the variability associated with the plasma estradiol and testosterone were considerable with CVs ranging from 133% to 524% and 88% to 369%, respectively. Given this level of variability and the fact that many of the frogs tested had plasma steroid levels at or near the detection limit of the assay, jevenile frog plasma steroid levels may not be a reliable measure of atrazine-treatment effects. Although an effort was made to draw blood samples within a 3-hour window during the night, the fact that this process continued over a number of days may have confounded the study.
In the entire experiment, 17 surviving tadpoles did not initiate metamorphosis by 506 days and were apparently terminated. It is unclear whether these animals were necropsied or what the status of their gonads was.
G. CONCLUSIONS:
Atrazine contamination of the negative controls and the lack of responsiveness to the positive estradiol control limited the value of this study in differentiatingtreatment effects. In addition, high variability in gonad aromatase activity and plasma activity and plasma estradiol and testosterone concentrations made it difficult to test the hypothesis of this study. Mortality was relatively consistent (mean = 20%) across all exposure groups with approximately 5% of the mortality presumably due to cannabalism. Poor water quality (high ammonia/nitrite and low dissolved oxygen) probably resulted from relatively high stocking rates ( 30 tadpoles in 4 L of static exposure solution) in which only 50% of the exposure solution was changed every 72 hours. More rigorous laboratory testing is needed to characterize the effects of atrazine on amphibian development.
H. REFERENCES:
Boyd, C. E. 1984. Water quality in warmwater fish ponds. Auburn University Agricultural Experiment Station, Auburn, Al.
Chang, D.,-Y and E. Witschi 1955a. Breeding of sex-reversed males of Xenopus laevis. Daudin. Soc. Exp. Biol. 89: 150 - 151.
Chang, D.,-Y and E. Witschi. 1955b. Genic and hormonal reversal of sex differentiation in Xenopus. Proc. Soc. Exp. Biol. Med., 93: 140 -144.
Gallien, L. 1953. Inversion totale du sexe chez Xenopus laevis Daud. à la suite d’un traitment gynoène par le benzoate du oestroadiol, administré pendant la vie larvaire. C. R. Acad. Sci 237: 1565 - 1566.
Hayes, T. B., A. Collins, M. Lee, M. Mendoza, N. Noriega, A. S. Stuart, and A. Vonk. 2002a. Hermaphroditic, demasculinized frogs after exposure to the herbicide atrazine at low ecologically relevant doses. Proceedings of the National Academy of Sciences of the United States of America 99(8): 5476 - 5480.
Page 25 of 48
Data Evaluation Report on Response of Xenopus laevis to Atrazine Exposure: Assessment of the Mechanism of Action of Atrazine.
EPA MRID Number 458677-04 Hayes, T. B., K. Haston, M. Tsui, A. Hoang, C. Haeffele, and A. Vonk. 2002b. Atrazine-induced hermaphroditism at 0.1 ppb in American leopard frogs (Rana pipiens): laboratory and field evidence. Environmental Health Perspectives.
H. REFERENCES:
Boyd, C. E. 1984. Water quality in warmwater fish ponds. Auburn University Agricultural Experiment Station, Auburn, Al.
Chang, D.,-Y and E. Witschi 1955a. Breeding of ses-reversed males of Xenopus laevis. Daudin. Soc. Exp. Biol. 89: 150 - 151.
Chang, D.,-Y and E. Witschi. 1955b. Genic and hormonal reversal of sex differentiation in Xenopus. Proc. Soc. Exp. biol. Med., 93: 140 -144.
Gallien, L. 1953. Inversion totale du sexe chez Xenopus laevis Daud. à la suite d’un traitment gynoène par le benzoate du oestroadiol, administré pendant la vie larvaire. C. R. Acad. Sci 237: 1565 - 1566.
Hayes, T. B., A. Collins, M. Lee, M. Mendoza, N. Noriega, A. S. Stuart, and A. Vonk. 2002a. Hermaphroditic, demasculinized frogs after exposure to the herbicide atrazine at low ecologically relevant doses. Proceedings of the National Academy of Sciences of the United States of America 99(8): 5476 - 5480.
Hayes, T. B., K. Haston, M. Tsui, A. Hoang, C. Haeffele, and A. Vonk. 2002b. Atrazine-induced hermaphroditism at 0.1 ppb in American leopard frogs (Rana pipiens): laboratory and field evidence. Environmental Health Perspectives.
Hecker, M., K. K. Coady, D. L. Villeneuve, M. B. Murphy, P. D. Jones and J. P. Giesy. 2003. A pilot study of response of larval Rana clamitans to atrazine exposure: assessment of metamorphosis and gonadal and laryngeal morphology and selected hormones and enzyme activities. Aquatic Toxicology Laboratory, Michigan State University, National Food Safety and Toxicology Center, E. Lansing, MI. Sponsor: Syngenta Crop Protection, Inc., Laboratory Study ID ECORISK Number MSU-03.
Page 26 of 48
Data Evaluation Report on Response of Xenopus laevis to Atrazine Exposure: Assessment of the Mechanism of Action of Atrazine.
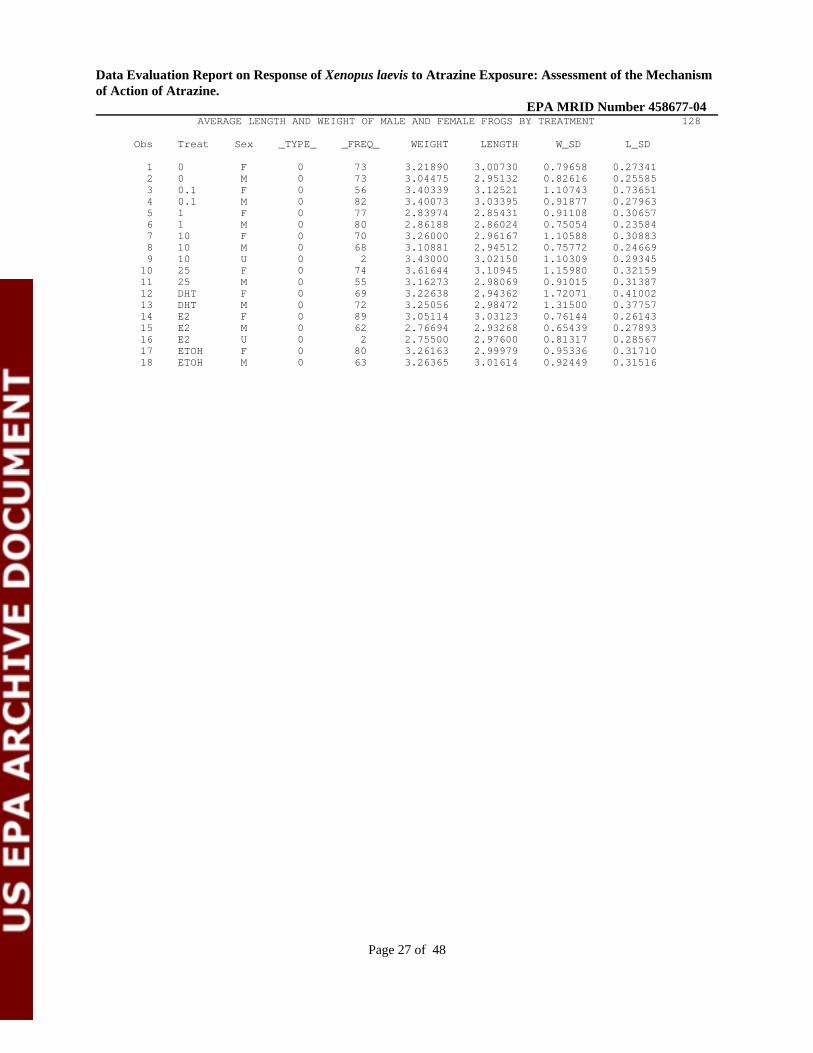
EPA MRID Number 458677-04 AVERAGE LENGTH AND WEIGHT OF MALE AND FEMALE FROGS BY TREATMENT 128
Obs Treat Sex _TYPE_ _FREQ_ WEIGHT LENGTH W_SD L_SD
1 0 F 0 73 3.21890 3.00730 0.79658 0.27341 2 0 M 0 73 3.04475 2.95132 0.82616 0.25585 3 0.1 F 0 56 3.40339 3.12521 1.10743 0.73651 4 0.1 M 0 82 3.40073 3.03395 0.91877 0.27963 5 1 F 0 77 2.83974 2.85431 0.91108 0.30657 6 1 M 0 80 2.86188 2.86024 0.75054 0.23584 7 10 F 0 70 3.26000 2.96167 1.10588 0.30883 8 10 M 0 68 3.10881 2.94512 0.75772 0.24669 9 10 U 0 2 3.43000 3.02150 1.10309 0.29345
10 25 F 0 74 3.61644 3.10945 1.15980 0.32159 11 25 M 0 55 3.16273 2.98069 0.91015 0.31387 12 DHT F 0 69 3.22638 2.94362 1.72071 0.41002 13 DHT M 0 72 3.25056 2.98472 1.31500 0.37757 14 E2 F 0 89 3.05114 3.03123 0.76144 0.26143 15 E2 M 0 62 2.76694 2.93268 0.65439 0.27893 16 E2 U 0 2 2.75500 2.97600 0.81317 0.28567 17 ETOH F 0 80 3.26163 2.99979 0.95336 0.31710 18 ETOH M 0 63 3.26365 3.01614 0.92449 0.31516
Page 27 of 48

Data Evaluation Report on Response of Xenopus laevis to Atrazine Exposure: Assessment of the Mechanism of Action of Atrazine.
EPA MRID Number 458677-04 ANOVA FOR WEIGHT OF FROGS ACROSS TREATMENT BY SEX 129
-------------------------------------------- Sex=F ---------------------------------------------
The ANOVA Procedure
Class Level Information
Class Levels Values
Treat 5 0 0.1 1 10 25
Number of observations 40
Dependent Variable: WEIGHT
Sum of Source DF Squares Mean Square F Value Pr > F Model 4 3.66900699 0.91725175 2.22 0.0863 Error 35 14.43121687 0.41232048 Corrected Total 39 18.10022385
R-Square Coeff Var Root MSE WEIGHT Mean 0.202705 19.12619 0.642122 3.357291
Source DF Anova SS Mean Square F Value Pr > F
Treat 4 3.66900699 0.91725175 2.22 0.0863
Levene's Test for Homogeneity of WEIGHT Variance ANOVA of Squared Deviations from Group Means
Sum of Mean Source DF Squares Square F Value Pr > F
Treat 4 1.7887 0.4472 1.57 0.2033 Error 35 9.9528 0.2844
Bartlett's Test for Homogeneity of WEIGHT Variance
Source DF Chi-Square Pr > ChiSq
Treat 4 6.1708 0.1868
Dunnett's t Tests for WEIGHT
NOTE: This test controls the Type I experimentwise error for comparisons of all treatments against a control.
Alpha 0.05 Error Degrees of Freedom 35 Error Mean Square 0.41232 Critical Value of Dunnett's t 2.55790 Minimum Significant Difference 0.8212
Comparisons significant at the 0.05 level are indicated by ***.
Difference Simultaneous Treat Between 95% Confidence
Comparison Means Limits
25 - 0 0.5080 -0.3133 1.3292 0.1 - 0 0.4326 -0.3886 1.2539 10 - 0 0.0530 -0.7682 0.8743 1 - 0 -0.3188 -1.1401 0.5024
Page 28 of 48

Data Evaluation Report on Response of Xenopus laevis to Atrazine Exposure: Assessment of the Mechanism of Action of Atrazine.
EPA MRID Number 458677-04 ANOVA FOR WEIGHT OF FROGS ACROSS TREATMENT BY SEX
-------------------------------------------- Sex=M ---------------------------------------------
The ANOVA Procedure
133
Class Level Information
Class Levels Values
Treat 5 0 0.1 1 10 25
Number of observations 40
Dependent Variable: WEIGHT
Sum of Source DF Squares Mean Square F Value Pr > F Model 4 1.48024068 0.37006017 1.07 0.3857 Error 35 12.09767780 0.34564794 Corrected Total 39 13.57791848
R-Square Coeff Var Root MSE WEIGHT Mean 0.109018 18.29415 0.587918 3.213696
Source DF Anova SS Mean Square F Value Pr > F
Treat 4 1.48024068 0.37006017 1.07 0.3857
Levene's Test for Homogeneity of WEIGHT Variance ANOVA of Squared Deviations from Group Means
Sum of Mean Source DF Squares Square F Value Pr > F
Treat 4 0.5338 0.1334 0.35 0.8426 Error 35 13.3648 0.3819
Bartlett's Test for Homogeneity of WEIGHT Variance
Source DF Chi-Square Pr > ChiSq
Treat 4 2.9535 0.5656
Dunnett's t Tests for WEIGHT
NOTE: This test controls the Type I experimentwise error for comparisons of all treatments against a control.
Alpha 0.05 Error Degrees of Freedom 35 Error Mean Square 0.345648 Critical Value of Dunnett's t 2.55790 Minimum Significant Difference 0.7519
Comparisons significant at the 0.05 level are indicated by ***.
Difference Simultaneous Treat Between 95% Confidence
Comparison Means Limits
0.1 - 0 0.3171 -0.4348 1.0691 25 - 0 0.1513 -0.6006 0.9033 10 - 0 -0.0259 -0.7779 0.7260 1 - 0 -0.2599 -1.0118 0.4920
Page 29 of 48

Data Evaluation Report on Response of Xenopus laevis to Atrazine Exposure: Assessment of the Mechanism of Action of Atrazine.
EPA MRID Number 458677-04 NONPARAMETRIC COMPARISON OF FROG WEIGHT ACROSS TREATMENTS BY SEX 137
-------------------------------------------- Sex=F ---------------------------------------------
The NPAR1WAY Procedure
Wilcoxon Scores (Rank Sums) for Variable WEIGHT Classified by Variable Treat
Sum of Expected Std Dev Mean Treat N Scores Under H0 Under H0 Score âââââââââââââââââââââââââââââââââââââââââââââââââââââââââââââââââââââ 0 8 157.0 164.0 29.574764 19.6250 0.1 8 196.0 164.0 29.574764 24.5000 1 8 98.0 164.0 29.574764 12.2500 10 8 162.0 164.0 29.574764 20.2500 25 8 207.0 164.0 29.574764 25.8750
Kruskal-Wallis Test
Chi-Square 6.6604 DF 4 Pr > Chi-Square 0.1550
Median Scores (Number of Points Above Median) for Variable WEIGHT Classified by Variable Treat
Sum of Expected Std Dev Mean Treat N Scores Under H0 Under H0 Score âââââââââââââââââââââââââââââââââââââââââââââââââââââââââââââââââââââ 0 8 4.0 4.0 1.281025 0.5000 0.1 8 5.0 4.0 1.281025 0.6250 1 8 2.0 4.0 1.281025 0.2500 10 8 4.0 4.0 1.281025 0.5000 25 8 5.0 4.0 1.281025 0.6250
Median One-Way Analysis
Chi-Square 2.9250 DF 4 Pr > Chi-Square 0.5705
Page 30 of 48

Data Evaluation Report on Response of Xenopus laevis to Atrazine Exposure: Assessment of the Mechanism of Action of Atrazine.
EPA MRID Number 458677-04 NONPARAMETRIC COMPARISON OF FROG WEIGHT ACROSS TREATMENTS BY SEX 139
-------------------------------------------- Sex=M ---------------------------------------------
The NPAR1WAY Procedure
Wilcoxon Scores (Rank Sums) for Variable WEIGHT Classified by Variable Treat
Sum of Expected Std Dev Mean Treat N Scores Under H0 Under H0 Score âââââââââââââââââââââââââââââââââââââââââââââââââââââââââââââââââââââ 0 8 145.0 164.0 29.574764 18.1250 0.1 8 219.0 164.0 29.574764 27.3750 1 8 110.0 164.0 29.574764 13.7500 10 8 170.0 164.0 29.574764 21.2500 25 8 176.0 164.0 29.574764 22.0000
Kruskal-Wallis Test
Chi-Square 5.9287 DF 4 Pr > Chi-Square 0.2045
Median Scores (Number of Points Above Median) for Variable WEIGHT Classified by Variable Treat
Sum of Expected Std Dev Mean Treat N Scores Under H0 Under H0 Score âââââââââââââââââââââââââââââââââââââââââââââââââââââââââââââââââââââ 0 8 2.0 4.0 1.281025 0.2500 0.1 8 6.0 4.0 1.281025 0.7500 1 8 3.0 4.0 1.281025 0.3750 10 8 5.0 4.0 1.281025 0.6250 25 8 4.0 4.0 1.281025 0.5000
Median One-Way Analysis
Chi-Square 4.8750 DF 4 Pr > Chi-Square 0.3004
Page 31 of 48

Data Evaluation Report on Response of Xenopus laevis to Atrazine Exposure: Assessment of the Mechanism of Action of Atrazine.
EPA MRID Number 458677-04 ANOVA FOR LENGTH OF FROGS ACROSS TREATMENT BY SEX 141
-------------------------------------------- Sex=F ---------------------------------------------
The ANOVA Procedure
Class Level Information
Class Levels Values
Treat 5 0 0.1 1 10 25
Number of observations 40
Dependent Variable: LENGTH
Sum of Source DF Squares Mean Square F Value Pr > F Model 4 0.46918445 0.11729611 4.21 0.0069 Error 35 0.97530236 0.02786578 Corrected Total 39 1.44448681
R-Square Coeff Var Root MSE LENGTH Mean 0.324810 5.507625 0.166930 3.030898
Source DF Anova SS Mean Square F Value Pr > F
Treat 4 0.46918445 0.11729611 4.21 0.0069
Levene's Test for Homogeneity of LENGTH Variance ANOVA of Squared Deviations from Group Means
Sum of Mean Source DF Squares Square F Value Pr > F
Treat 4 0.00398 0.000996 1.29 0.2939 Error 35 0.0271 0.000774
Bartlett's Test for Homogeneity of LENGTH Variance
Source DF Chi-Square Pr > ChiSq
Treat 4 2.7074 0.6079
Dunnett's t Tests for LENGTH
NOTE: This test controls the Type I experimentwise error for comparisons of all treatments against a control.
Alpha 0.05 Error Degrees of Freedom 35 Error Mean Square 0.027866 Critical Value of Dunnett's t 2.55790 Minimum Significant Difference 0.2135
Comparisons significant at the 0.05 level are indicated by ***.
Difference Treat Between Simultaneous 95%
Comparison Means Confidence Limits
0.1 - 0 0.14893 -0.06457 0.36242 25 - 0 0.13545 -0.07804 0.34895 10 - 0 -0.04026 -0.25375 0.17324 1 - 0 -0.13709 -0.35058 0.07641
Page 32 of 48

Data Evaluation Report on Response of Xenopus laevis to Atrazine Exposure: Assessment of the Mechanism of Action of Atrazine.
EPA MRID Number 458677-04 ANOVA FOR LENGTH OF FROGS ACROSS TREATMENT BY SEX
-------------------------------------------- Sex=M ---------------------------------------------
The ANOVA Procedure
145
Class Level Information
Class Levels Values
Treat 5 0 0.1 1 10 25
Dependent Variable: LENGTH
Source Model Error Corrected Total
R-Square 0.135875
Source
Treat
Number of observations 40
Sum of DF Squares Mean Square F Value Pr > F 4 0.15470697 0.03867674 1.38 0.2623 35 0.98388783 0.02811108 39 1.13859480
Coeff Var Root MSE LENGTH Mean 5.628738 0.167664 2.978707
DF Anova SS Mean Square F Value Pr > F
4 0.15470697 0.03867674 1.38 0.2623
Levene's Test for Homogeneity of LENGTH Variance ANOVA of Squared Deviations from Group Means
Sum of Mean Source DF Squares Square F Value Pr > F
Treat 4 0.00309 0.000772 0.36 0.8370 Error 35 0.0756 0.00216
Bartlett's Test for Homogeneity of LENGTH Variance
Source DF Chi-Square Pr > ChiSq
Treat 4 2.3528 0.6712
Dunnett's t Tests for LENGTH
NOTE: This test controls the Type I experimentwise error for comparisons of all treatments against a control.
Alpha 0.05 Error Degrees of Freedom 35 Error Mean Square 0.028111 Critical Value of Dunnett's t 2.55790 Minimum Significant Difference 0.2144
Comparisons significant at the 0.05 level are indicated by ***. Difference
Treat Between Comparison Means
0.1 - 0 0.07055 25 - 0 0.03457 10 - 0 -0.03291 1 - 0 -0.11130
Simultaneous 95% Confidence Limits
-0.14388 0.28498 -0.17986 0.24901 -0.24735 0.18152 -0.32573 0.10313
Page 33 of 48
Data Evaluation Report on Response of Xenopus laevis to Atrazine Exposure: Assessment of the Mechanism of Action of Atrazine.
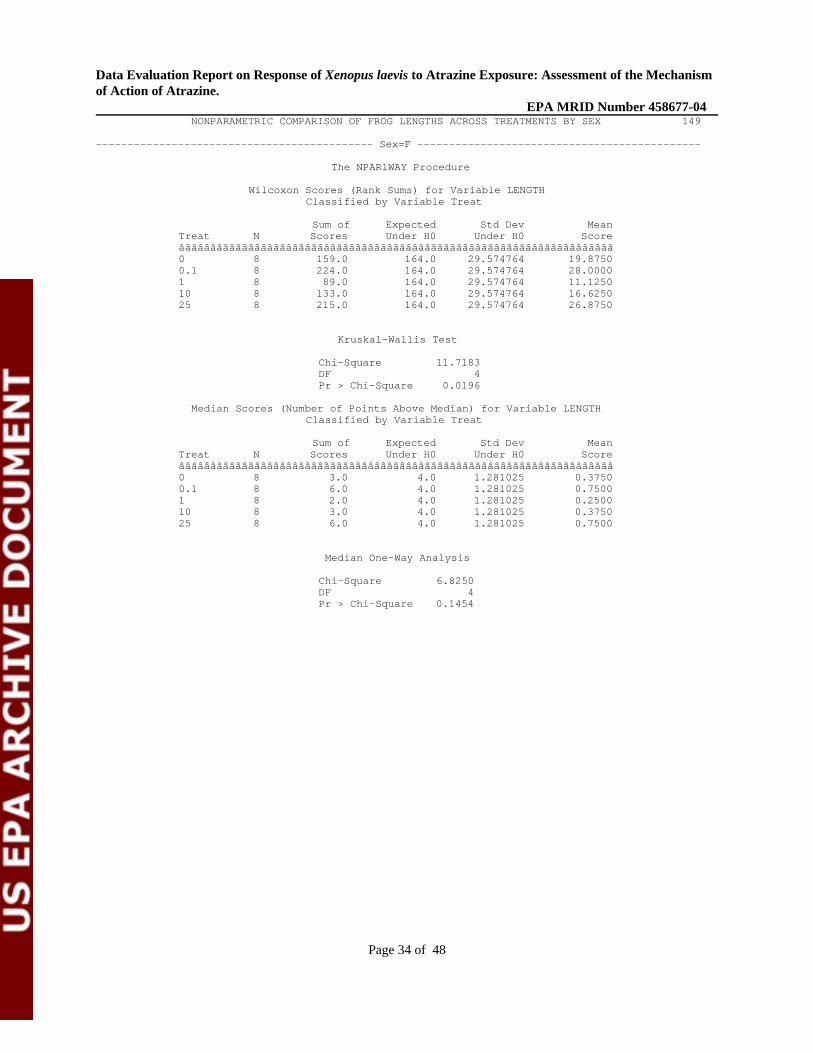
EPA MRID Number 458677-04 NONPARAMETRIC COMPARISON OF FROG LENGTHS ACROSS TREATMENTS BY SEX 149
-------------------------------------------- Sex=F ---------------------------------------------
The NPAR1WAY Procedure
Wilcoxon Scores (Rank Sums) for Variable LENGTH Classified by Variable Treat
Sum of Expected Std Dev Mean Treat N Scores Under H0 Under H0 Score âââââââââââââââââââââââââââââââââââââââââââââââââââââââââââââââââââââ 0 8 159.0 164.0 29.574764 19.8750 0.1 8 224.0 164.0 29.574764 28.0000 1 8 89.0 164.0 29.574764 11.1250 10 8 133.0 164.0 29.574764 16.6250 25 8 215.0 164.0 29.574764 26.8750
Kruskal-Wallis Test
Chi-Square 11.7183 DF 4 Pr > Chi-Square 0.0196
Median Scores (Number of Points Above Median) for Variable LENGTH Classified by Variable Treat
Sum of Expected Std Dev Mean Treat N Scores Under H0 Under H0 Score âââââââââââââââââââââââââââââââââââââââââââââââââââââââââââââââââââââ 0 8 3.0 4.0 1.281025 0.3750 0.1 8 6.0 4.0 1.281025 0.7500 1 8 2.0 4.0 1.281025 0.2500 10 8 3.0 4.0 1.281025 0.3750 25 8 6.0 4.0 1.281025 0.7500
Median One-Way Analysis
Chi-Square 6.8250 DF 4 Pr > Chi-Square 0.1454
Page 34 of 48

Data Evaluation Report on Response of Xenopus laevis to Atrazine Exposure: Assessment of the Mechanism of Action of Atrazine.
EPA MRID Number 458677-04 NONPARAMETRIC COMPARISON OF FROG LENGTHS ACROSS TREATMENTS BY SEX 151
-------------------------------------------- Sex=M ---------------------------------------------
The NPAR1WAY Procedure
Wilcoxon Scores (Rank Sums) for Variable LENGTH Classified by Variable Treat
Sum of Expected Std Dev Mean Treat N Scores Under H0 Under H0 Score âââââââââââââââââââââââââââââââââââââââââââââââââââââââââââââââââââââ 0 8 154.0 164.0 29.574764 19.2500 0.1 8 217.0 164.0 29.574764 27.1250 1 8 106.0 164.0 29.574764 13.2500 10 8 162.0 164.0 29.574764 20.2500 25 8 181.0 164.0 29.574764 22.6250
Kruskal-Wallis Test
Chi-Square 6.0055 DF 4 Pr > Chi-Square 0.1987
The NPAR1WAY Procedure
Median Scores (Number of Points Above Median) for Variable LENGTH Classified by Variable Treat
Sum of Expected Std Dev Mean Treat N Scores Under H0 Under H0 Score âââââââââââââââââââââââââââââââââââââââââââââââââââââââââââââââââââââ 0 8 3.0 4.0 1.281025 0.3750 0.1 8 6.0 4.0 1.281025 0.7500 1 8 3.0 4.0 1.281025 0.3750 10 8 4.0 4.0 1.281025 0.5000 25 8 4.0 4.0 1.281025 0.5000
Median One-Way Analysis
Chi-Square 2.9250 DF 4 Pr > Chi-Square 0.5705
Page 35 of 48
Data Evaluation Report on Response of Xenopus laevis to Atrazine Exposure: Assessment of the Mechanism of Action of Atrazine.
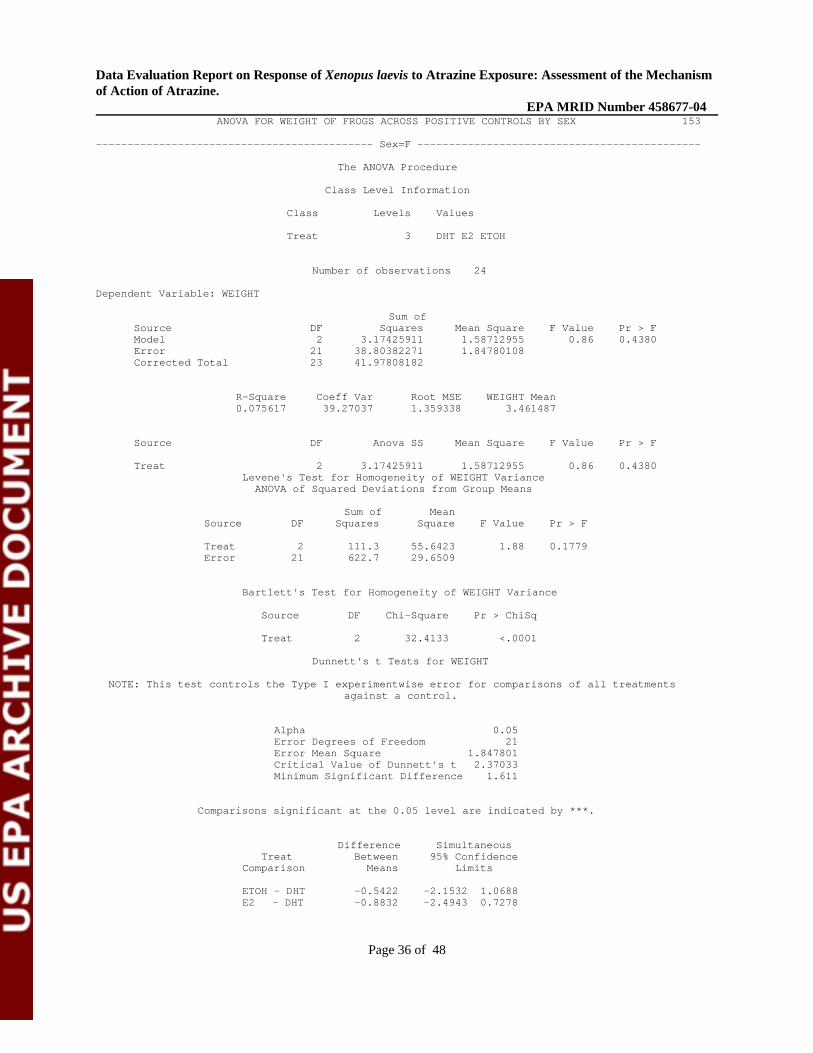
EPA MRID Number 458677-04 ANOVA FOR WEIGHT OF FROGS ACROSS POSITIVE CONTROLS BY SEX 153
-------------------------------------------- Sex=F ---------------------------------------------
The ANOVA Procedure
Class Level Information
Class Levels Values
Treat 3 DHT E2 ETOH
Number of observations 24
Dependent Variable: WEIGHT
Sum of Source DF Squares Mean Square F Value Pr > F Model 2 3.17425911 1.58712955 0.86 0.4380 Error 21 38.80382271 1.84780108 Corrected Total 23 41.97808182
R-Square Coeff Var Root MSE WEIGHT Mean 0.075617 39.27037 1.359338 3.461487
Source DF Anova SS Mean Square F Value Pr > F
Treat 2 3.17425911 1.58712955 0.86 0.4380 Levene's Test for Homogeneity of WEIGHT Variance
ANOVA of Squared Deviations from Group Means
Sum of Mean Source DF Squares Square F Value Pr > F
Treat 2 111.3 55.6423 1.88 0.1779 Error 21 622.7 29.6509
Bartlett's Test for Homogeneity of WEIGHT Variance
Source DF Chi-Square Pr > ChiSq
Treat 2 32.4133 <.0001
Dunnett's t Tests for WEIGHT
NOTE: This test controls the Type I experimentwise error for comparisons of all treatments against a control.
Alpha 0.05 Error Degrees of Freedom 21 Error Mean Square 1.847801 Critical Value of Dunnett's t 2.37033 Minimum Significant Difference 1.611
Comparisons significant at the 0.05 level are indicated by ***.
Difference Simultaneous Treat Between 95% Confidence
Comparison Means Limits
ETOH - DHT -0.5422 -2.1532 1.0688 E2 - DHT -0.8832 -2.4943 0.7278
Page 36 of 48

Data Evaluation Report on Response of Xenopus laevis to Atrazine Exposure: Assessment of the Mechanism of Action of Atrazine.
EPA MRID Number 458677-04 ANOVA FOR WEIGHT OF FROGS ACROSS POSITIVE CONTROLS BY SEX 157
-------------------------------------------- Sex=M ---------------------------------------------
The ANOVA Procedure
Class Level Information
Class Levels Values
Treat 3 DHT E2 ETOH
Number of observations 24 Dependent Variable: WEIGHT
Sum of Source DF Squares Mean Square F Value Pr > F Model 2 4.32184582 2.16092291 1.94 0.1680 Error 21 23.33843834 1.11135421 Corrected Total 23 27.66028416
R-Square Coeff Var Root MSE WEIGHT Mean 0.156247 32.05405 1.054208 3.288845
Source DF Anova SS Mean Square F Value Pr > F
Treat 2 4.32184582 2.16092291 1.94 0.1680
Levene's Test for Homogeneity of WEIGHT Variance ANOVA of Squared Deviations from Group Means
Sum of Mean Source DF Squares Square F Value Pr > F
Treat 2 32.0265 16.0133 4.05 0.0327 Error 21 83.1297 3.9586
Bartlett's Test for Homogeneity of WEIGHT Variance
Source DF Chi-Square Pr > ChiSq
Treat 2 20.9573 <.0001
Dunnett's t Tests for WEIGHT
NOTE: This test controls the Type I experimentwise error for comparisons of all treatments against a control.
Alpha 0.05 Error Degrees of Freedom 21 Error Mean Square 1.111354 Critical Value of Dunnett's t 2.37033 Minimum Significant Difference 1.2494
Comparisons significant at the 0.05 level are indicated by ***.
Difference Treat Between Simultaneous 95%
Comparison Means Confidence Limits
ETOH - DHT -0.6254 -1.8748 0.6240 E2 - DHT -1.0317 -2.2811 0.2177
Page 37 of 48

Data Evaluation Report on Response of Xenopus laevis to Atrazine Exposure: Assessment of the Mechanism of Action of Atrazine.
EPA MRID Number 458677-04 NONPARAMETRIC COMPARISON OF FROG WEIGHT ACROSS POSITIVE CONTROLS 161
-------------------------------------------- Sex=F ---------------------------------------------
The NPAR1WAY Procedure
Wilcoxon Scores (Rank Sums) for Variable WEIGHT Classified by Variable Treat
Sum of Expected Std Dev Mean Treat N Scores Under H0 Under H0 Score âââââââââââââââââââââââââââââââââââââââââââââââââââââââââââââââââââââ DHT 8 91.0 100.0 16.329932 11.3750 E2 8 85.0 100.0 16.329932 10.6250 ETOH 8 124.0 100.0 16.329932 15.5000
Kruskal-Wallis Test
Chi-Square 2.2050 DF 2 Pr > Chi-Square 0.3320
Median Scores (Number of Points Above Median) for Variable WEIGHT Classified by Variable Treat
Sum of Expected Std Dev Mean Treat N Scores Under H0 Under H0 Score âââââââââââââââââââââââââââââââââââââââââââââââââââââââââââââââââââââ DHT 8 4.0 4.0 1.179536 0.5000 E2 8 3.0 4.0 1.179536 0.3750 ETOH 8 5.0 4.0 1.179536 0.6250
Median One-Way Analysis
Chi-Square 0.9583 DF 2 Pr > Chi-Square 0.6193
Page 38 of 48
Data Evaluation Report on Response of Xenopus laevis to Atrazine Exposure: Assessment of the Mechanism of Action of Atrazine.
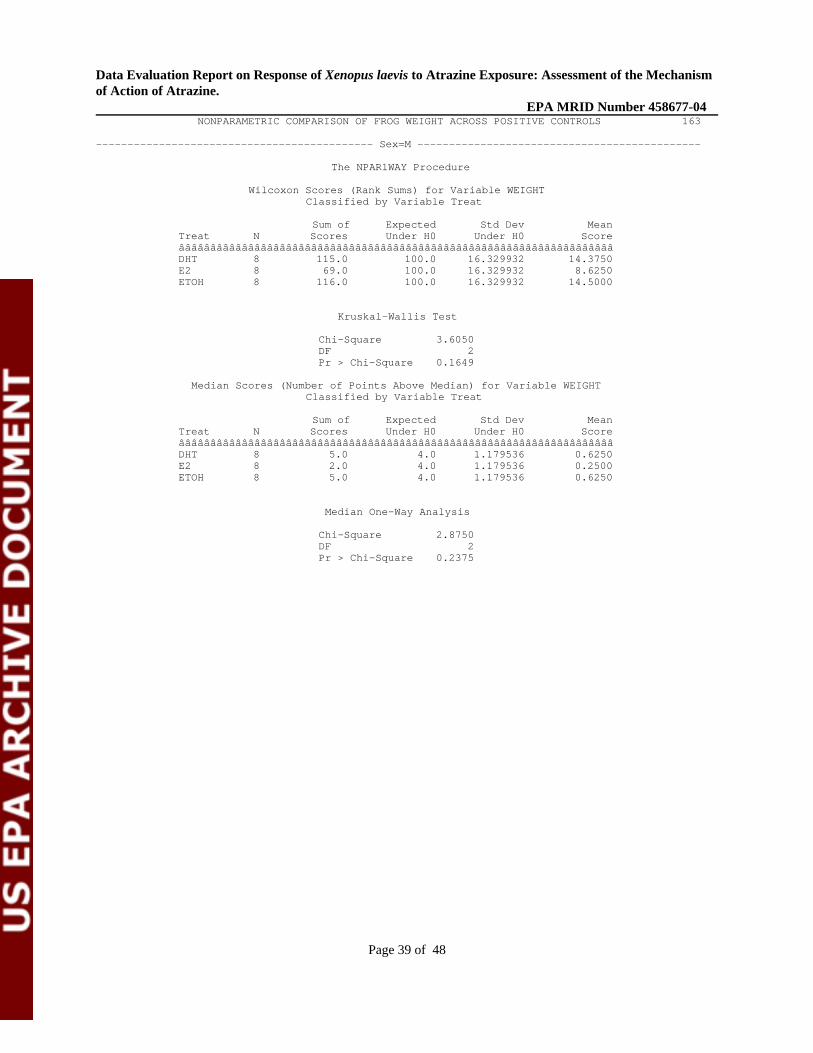
EPA MRID Number 458677-04 NONPARAMETRIC COMPARISON OF FROG WEIGHT ACROSS POSITIVE CONTROLS 163
-------------------------------------------- Sex=M ---------------------------------------------
The NPAR1WAY Procedure
Wilcoxon Scores (Rank Sums) for Variable WEIGHT Classified by Variable Treat
Sum of Expected Std Dev Mean Treat N Scores Under H0 Under H0 Score âââââââââââââââââââââââââââââââââââââââââââââââââââââââââââââââââââââ DHT 8 115.0 100.0 16.329932 14.3750 E2 8 69.0 100.0 16.329932 8.6250 ETOH 8 116.0 100.0 16.329932 14.5000
Kruskal-Wallis Test
Chi-Square 3.6050 DF 2 Pr > Chi-Square 0.1649
Median Scores (Number of Points Above Median) for Variable WEIGHT Classified by Variable Treat
Sum of Expected Std Dev Mean Treat N Scores Under H0 Under H0 Score âââââââââââââââââââââââââââââââââââââââââââââââââââââââââââââââââââââ DHT 8 5.0 4.0 1.179536 0.6250 E2 8 2.0 4.0 1.179536 0.2500 ETOH 8 5.0 4.0 1.179536 0.6250
Median One-Way Analysis
Chi-Square 2.8750 DF 2 Pr > Chi-Square 0.2375
Page 39 of 48

Data Evaluation Report on Response of Xenopus laevis to Atrazine Exposure: Assessment of the Mechanism of Action of Atrazine.
EPA MRID Number 458677-04 ANOVA FOR LENGTH OF FROGS ACROSS POSITIVE CONTROLS BY SEX 165
-------------------------------------------- Sex=F ---------------------------------------------
The ANOVA Procedure
Class Level Information
Class Levels Values
Treat 3 DHT E2 ETOH
Number of observations 24
Dependent Variable: LENGTH
Sum of Source DF Squares Mean Square F Value Pr > F Model 2 0.02901222 0.01450611 0.16 0.8568 Error 21 1.95623777 0.09315418 Corrected Total 23 1.98524999
R-Square Coeff Var Root MSE LENGTH Mean 0.014614 9.974886 0.305212 3.059801
Source DF Anova SS Mean Square F Value Pr > F Treat 2 0.02901222 0.01450611 0.16 0.8568
Levene's Test for Homogeneity of LENGTH Variance ANOVA of Squared Deviations from Group Means
Sum of Mean Source DF Squares Square F Value Pr > F
Treat 2 0.2482 0.1241 2.06 0.1530 Error 21 1.2675 0.0604
Bartlett's Test for Homogeneity of LENGTH Variance
Source DF Chi-Square Pr > ChiSq
Treat 2 21.9346 <.0001
Dunnett's t Tests for LENGTH
NOTE: This test controls the Type I experimentwise error for comparisons of all treatments against a control.
Alpha 0.05 Error Degrees of Freedom 21 Error Mean Square 0.093154 Critical Value of Dunnett's t 2.37033 Minimum Significant Difference 0.3617
Comparisons significant at the 0.05 level are indicated by ***.
Difference Treat Between Simultaneous 95%
Comparison Means Confidence Limits
ETOH - DHT -0.06883 -0.43056 0.29290 E2 - DHT -0.07785 -0.43958 0.28388
Page 40 of 48

Data Evaluation Report on Response of Xenopus laevis to Atrazine Exposure: Assessment of the Mechanism of Action of Atrazine.
EPA MRID Number 458677-04 ANOVA FOR LENGTH OF FROGS ACROSS POSITIVE CONTROLS BY SEX
-------------------------------------------- Sex=M ---------------------------------------------
The ANOVA Procedure
169
Class Level Information
Class Levels Values
Treat 3 DHT E2 ETOH
Number of observations 24
Dependent Variable: LENGTH
Sum of Source DF Squares Mean Square F Value Pr > F Model 2 0.15041338 0.07520669 0.91 0.4167 Error 21 1.72987563 0.08237503 Corrected Total 23 1.88028900
R-Square Coeff Var Root MSE LENGTH Mean
0.079995 9.484117 0.287011 3.026223
Source DF Anova SS Mean Square F Value Pr > F
Treat 2 0.15041338 0.07520669 0.91 0.4167
Levene's Test for Homogeneity of LENGTH Variance ANOVA of Squared Deviations from Group Means
Sum of Mean Source DF Squares Square F Value Pr > F
Treat 2 0.1367 0.0684 3.85 0.0375 Error 21 0.3725 0.0177
Bartlett's Test for Homogeneity of LENGTH Variance
Source DF Chi-Square Pr > ChiSq
Treat 2 13.2247 0.0013
Dunnett's t Tests for LENGTH
NOTE: This test controls the Type I experimentwise error for comparisons of all treatments against a control.
Alpha 0.05 Error Degrees of Freedom 21 Error Mean Square 0.082375 Critical Value of Dunnett's t 2.37033 Minimum Significant Difference 0.3402
Comparisons significant at the 0.05 level are indicated by ***.
Difference Simultaneous Treat Between 95% Confidence
Comparison Means Limits
ETOH - DHT -0.1378 -0.4780 0.2023 E2 - DHT -0.1871 -0.5272 0.1531
Page 41 of 48
Data Evaluation Report on Response of Xenopus laevis to Atrazine Exposure: Assessment of the Mechanism of Action of Atrazine.
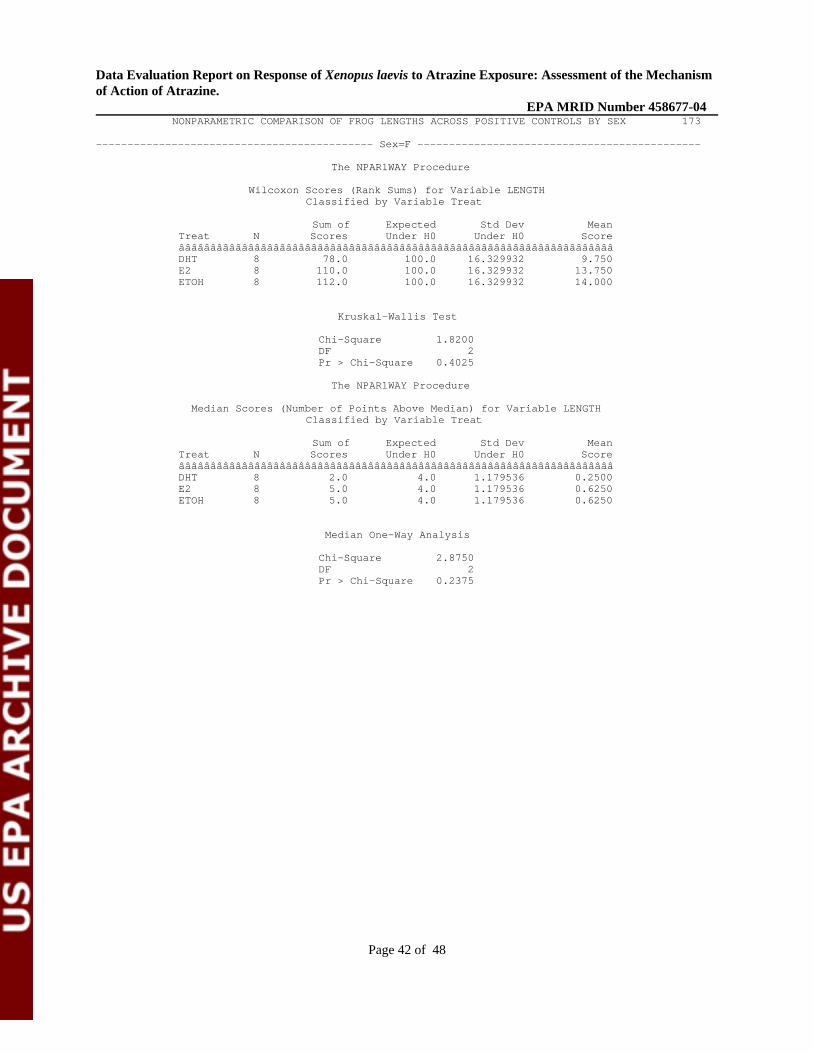
EPA MRID Number 458677-04 NONPARAMETRIC COMPARISON OF FROG LENGTHS ACROSS POSITIVE CONTROLS BY SEX 173
-------------------------------------------- Sex=F ---------------------------------------------
The NPAR1WAY Procedure
Wilcoxon Scores (Rank Sums) for Variable LENGTH Classified by Variable Treat
Sum of Expected Std Dev Mean Treat N Scores Under H0 Under H0 Score âââââââââââââââââââââââââââââââââââââââââââââââââââââââââââââââââââââ DHT 8 78.0 100.0 16.329932 9.750 E2 8 110.0 100.0 16.329932 13.750 ETOH 8 112.0 100.0 16.329932 14.000
Kruskal-Wallis Test
Chi-Square 1.8200 DF 2 Pr > Chi-Square 0.4025
The NPAR1WAY Procedure
Median Scores (Number of Points Above Median) for Variable LENGTH Classified by Variable Treat
Sum of Expected Std Dev Mean Treat N Scores Under H0 Under H0 Score âââââââââââââââââââââââââââââââââââââââââââââââââââââââââââââââââââââ DHT 8 2.0 4.0 1.179536 0.2500 E2 8 5.0 4.0 1.179536 0.6250 ETOH 8 5.0 4.0 1.179536 0.6250
Median One-Way Analysis
Chi-Square 2.8750 DF 2 Pr > Chi-Square 0.2375
Page 42 of 48
Data Evaluation Report on Response of Xenopus laevis to Atrazine Exposure: Assessment of the Mechanism of Action of Atrazine.
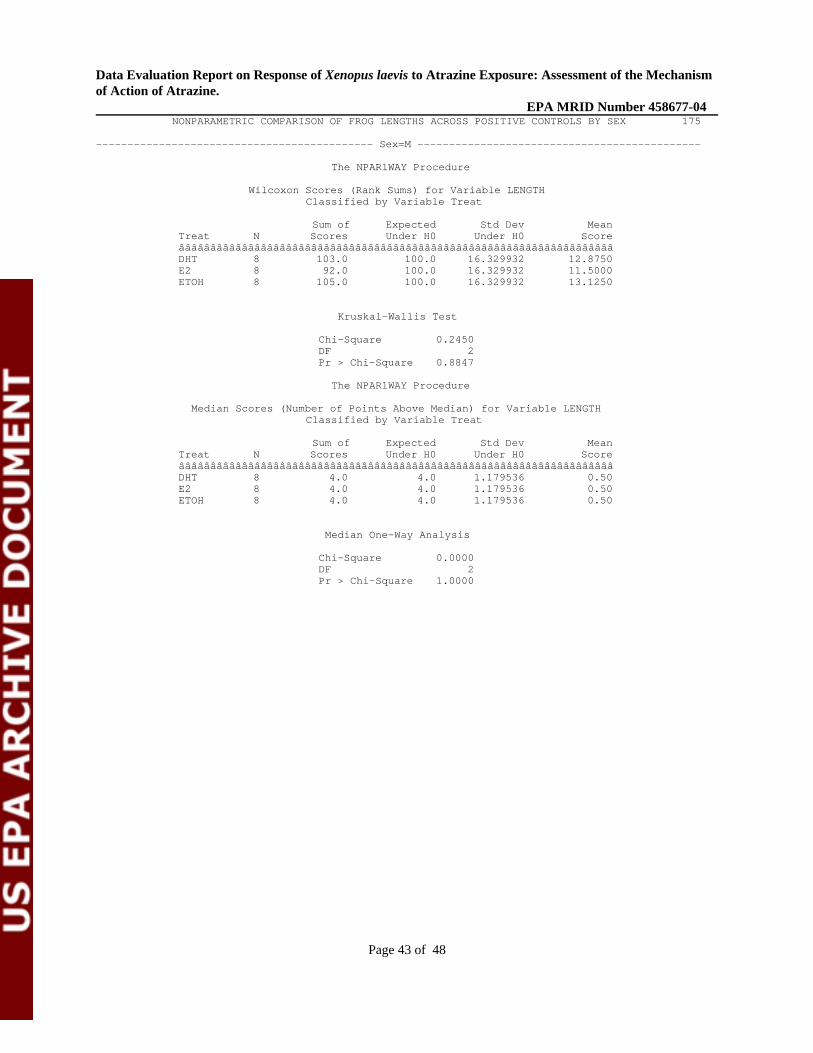
EPA MRID Number 458677-04 NONPARAMETRIC COMPARISON OF FROG LENGTHS ACROSS POSITIVE CONTROLS BY SEX 175
-------------------------------------------- Sex=M ---------------------------------------------
The NPAR1WAY Procedure
Wilcoxon Scores (Rank Sums) for Variable LENGTH Classified by Variable Treat
Sum of Expected Std Dev Mean Treat N Scores Under H0 Under H0 Score âââââââââââââââââââââââââââââââââââââââââââââââââââââââââââââââââââââ DHT 8 103.0 100.0 16.329932 12.8750 E2 8 92.0 100.0 16.329932 11.5000 ETOH 8 105.0 100.0 16.329932 13.1250
Kruskal-Wallis Test
Chi-Square 0.2450 DF 2 Pr > Chi-Square 0.8847
The NPAR1WAY Procedure
Median Scores (Number of Points Above Median) for Variable LENGTH Classified by Variable Treat
Sum of Expected Std Dev Mean Treat N Scores Under H0 Under H0 Score âââââââââââââââââââââââââââââââââââââââââââââââââââââââââââââââââââââ DHT 8 4.0 4.0 1.179536 0.50 E2 8 4.0 4.0 1.179536 0.50 ETOH 8 4.0 4.0 1.179536 0.50
Median One-Way Analysis
Chi-Square 0.0000 DF 2 Pr > Chi-Square 1.0000
Page 43 of 48
Data Evaluation Report on Response of Xenopus laevis to Atrazine Exposure: Assessment of the Mechanism of Action of Atrazine.
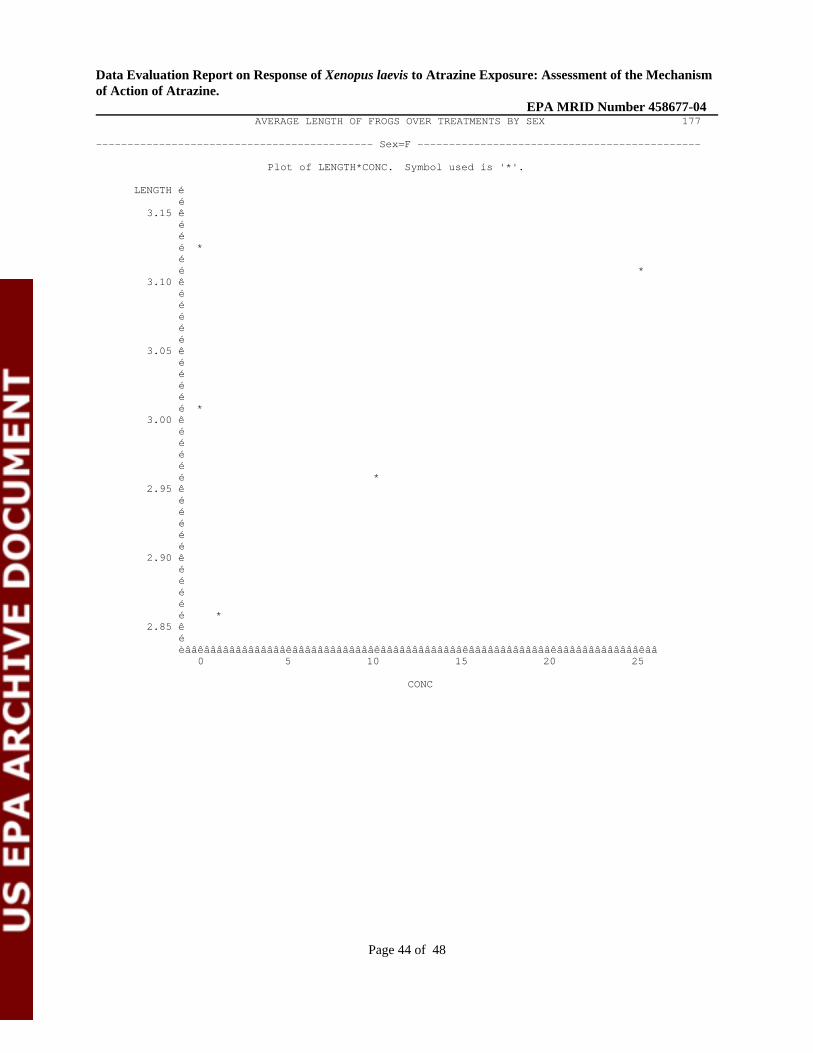
EPA MRID Number 458677-04 AVERAGE LENGTH OF FROGS OVER TREATMENTS BY SEX
-------------------------------------------- Sex=F ---------------------------------------------
Plot of LENGTH*CONC. Symbol used is '*'.
177
LENGTH é é
3.15 ê é é é * é é
3.10 ê é é é é é
3.05 ê é é é é é *
3.00 ê é é é é é
2.95 ê é é é é é
2.90 ê é é é é é *
2.85 ê é
*
*
èââêâââââââââââââêâââââââââââââêâââââââââââââêâââââââââââââêâââââââââââââêââ 0 5 10 15 20 25
CONC
Page 44 of 48

Data Evaluation Report on Response of Xenopus laevis to Atrazine Exposure: Assessment of the Mechanism of Action of Atrazine.
EPA MRID Number 458677-04 AVERAGE LENGTH OF FROGS OVER TREATMENTS BY SEX
-------------------------------------------- Sex=M ---------------------------------------------
Plot of LENGTH*CONC. Symbol used is '*'.
178
LENGTH é 3.050 ê
é é é * é
3.025 ê é é é é
3.000 ê é é é é
2.975 ê é é é é
2.950 ê * é é é é
2.925 ê é é é é
2.900 ê é é é é
2.875 ê é é é * é
2.850 ê
*
*
èââêâââââââââââââêâââââââââââââêâââââââââââââêâââââââââââââêâââââââââââââêââ 0 5 10 15 20 25
CONC
Page 45 of 48

Data Evaluation Report on Response of Xenopus laevis to Atrazine Exposure: Assessment of the Mechanism of Action of Atrazine.
EPA MRID Number 458677-04 AVERAGE WEIGHT OF FROGS OVER TREATMENTS BY SEX 179
-------------------------------------------- Sex=F ---------------------------------------------
Plot of WEIGHT*CONC. Symbol used is '*'.
WEIGHT é é
3.7 ê é é é *
3.6 ê é é é
3.5 ê é é é
3.4 ê * é é é
3.3 ê é é * é *
3.2 ê é é é
3.1 ê é é é
3.0 ê é é é
2.9 ê é é * é
2.8 ê é èââêâââââââââââââêâââââââââââââêâââââââââââââêâââââââââââââêâââââââââââââêââ
0 5 10 15 20 25
CONC
Page 46 of 48

Data Evaluation Report on Response of Xenopus laevis to Atrazine Exposure: Assessment of the Mechanism of Action of Atrazine.
EPA MRID Number 458677-04 AVERAGE WEIGHT OF FROGS OVER TREATMENTS BY SEX 180
-------------------------------------------- Sex=M ---------------------------------------------
Plot of WEIGHT*CONC. Symbol used is '*'.
WEIGHT é é
3.4 ê * é é é é é
3.3 ê é é é é é
3.2 ê é é * é é é *
3.1 ê é é é * é é
3.0 ê é é é é é
2.9 ê é é * é é é
2.8 ê é èââêâââââââââââââêâââââââââââââêâââââââââââââêâââââââââââââêâââââââââââââêââ
0 5 10 15 20 25
CONC
Page 47 of 48

Data Evaluation Report on Response of Xenopus laevis to Atrazine Exposure: Assessment of the Mechanism of Action of Atrazine.
EPA MRID Number 458677-04
Page 48 of 48


![[ 149 ] the growth of the hindlimb bud of xenopus laevis and its ...](https://static.fdocuments.us/doc/165x107/586789b31a28ab44568b868b/-149-the-growth-of-the-hindlimb-bud-of-xenopus-laevis-and-its-.jpg)