DATA EVALUATION RECORD MIDGE 10-DAY … · these guidance documents are listed below: U.S. EPA....
34
DATA EVALUATION RECORD MIDGE 10-DAY TOXICITY STUDY OPPTS 850.1735 1. CHEMICAL : Bifenthrin PC Code No. : 128825 2. TEST MATERIAL : [Phenyl ring- 14 C]bifenthrin Purity : 96.4% (radiochemical purity) 3. CITATION : Author : Arthur E. Putt Title : Bifenthrin - Toxicity to Midge (Chironomus tentans) During a 10-Day Sediment Exposure Study Completion Date : June 29, 2005 Laboratory : Springborn Smithers Laboratories 790 Main Street Wareham, Massachusetts 02571-1037 Sponsor : Pyrethroid Working Group Beveridge & Diamond 1350 I Street NW Washington, DC 20005 Laboratory Report ID : 13656.6106 MRID No. : 465915-02 DP Barcode : D319265 4. REVIEWED BY : Amanda Solliday, Biologist, OPP/EFED/ERB5 Signature: Date: 02/24/11 REVIEWED BY Signature: : Justin Housenger, Biologist, OPP/EFED/ERB5 Date: 02/24/11 REVIEWED BY : Keith Sappington, Senior Advisor, OPP/EFED/ERB5 Signature: Date: 02-24-11
Transcript of DATA EVALUATION RECORD MIDGE 10-DAY … · these guidance documents are listed below: U.S. EPA....

DATA EVALUATION RECORD MIDGE 10-DAY TOXICITY STUDY
OPPTS 850.1735
1. CHEMICAL: Bifenthrin PC Code No.
: 128825
2. TEST MATERIAL: [Phenyl ring-14C]bifenthrin Purity
: 96.4% (radiochemical purity)
3. CITATION : Author
: Arthur E. Putt
Title
: Bifenthrin - Toxicity to Midge (Chironomus tentans)
During a 10-Day Sediment Exposure
Study Completion Date
: June 29, 2005
Laboratory
: Springborn Smithers Laboratories 790 Main Street Wareham, Massachusetts 02571-1037
Sponsor
: Pyrethroid Working Group
Beveridge & Diamond 1350 I Street NW Washington, DC 20005
Laboratory Report ID
: 13656.6106
MRID No.
: 465915-02
DP Barcode
: D319265
4. REVIEWED BY
: Amanda Solliday, Biologist, OPP/EFED/ERB5
Signature: Date: 02/24/11
REVIEWED BY
Signature:
: Justin Housenger, Biologist, OPP/EFED/ERB5
Date: 02/24/11 REVIEWED BY
: Keith Sappington, Senior Advisor, OPP/EFED/ERB5
Signature: Date: 02-24-11

DP Barcode: D319265 MRID No.: 46591502
2
5. STUDY PARAMETERS
:
Age of Test Organism: 2nd-3rd
Definitive Test Duration: 10 days Instar, 10 days old
Study Method: Intermittent flow-through Type of Concentrations: Mean-measured
6. CONCLUSIONS
:
The 10-day acute toxicity of [14
C]bifenthrin to midge larvae, Chironomus tentans, was studied under an intermittent flow-through system in sediment-spiked exposures. Endpoints assessed included survival and growth (ash-free dry weight).
The nominal spiked sediment test concentrations were 0 (negative and solvent controls), 90, 180, 350, 700, 1400, and 2800 µg a.i./kg dry sediment. The majority of radioactive residues remained predominately associated with the sediment during the 10-day study. Mean-measured (Days 0 and 10) sediment concentrations (rounded to two significant digits) were <0.72 and <0.71 (<LOQ, negative and solvent controls), 83, 170, 330, 610, 1200, and 2500 µg/kg dry sediment, equivalent to mean recoveries of 92, 94, 94, 87, 86, and 89% of the nominal concentrations, respectively. All subsequent sediment concentrations in this review are mean-measured, unless otherwise noted. Mean-measured (reviewer-calculated from Days 0 and 10 data) pore water concentrations were <0.19 (<LOQ, negative and solvent controls), 0.17, 0.33, 0.51, 1.68, 2.85, and 5.35 μg a.i./L, respectively, based on total radioactive residues. Mean-measured (reviewer-calculated from Days 0 and 10) overlying water concentrations were <0.076 (<LOQ, negative and solvent controls), <0.076, <0.076, <0.076, 0.11, 0.18, and 0.38 μg a.i./L, respectively. The low overlying water concentrations likely result (at least in part) from the flow-through system employed, which ensured at least two volume replacements per vessel per day.

DP Barcode: D319265 MRID No.: 46591502
3
After 10 days, mortality averaged 9 and 18% in the negative and solvent control groups, respectively, and 8, 3, 10, 21, 13, and 44% in the mean-measured 83, 170, 330, 610, 1200, and 2500 µg a.i./kg dry sediment. Mortality was significantly reduced in the solvent control relative to the negative control but was still within acceptable range for controls (≤ 20%). Notably, the mortality in the lowest three treatment levels was roughly equivalent or less than that observed in the negative control. Because solvent was evaporated on silica sand prior to mixing with sediment and all treatments contained the same amount of initially-added solvent, the statistically significant reduction in survival in the solvent control appears to be a spurious result and is not likely related to the effect of the solvent. Therefore, the biological significance of the higher mortality seen in the solvent control is uncertain. Also, the measured dry weights for the negative control and solvent control did not significantly differ statistically. In accordance with EFED guidance, all endpoints are based on comparisons to the negative control and the solvent is not believed to have interfered with the test (Frankenberry et al., 2008). A statistically significant reduction (p≤0.05) in treatment survival on day 10 compared to the negative control was identified at 2500 µg/kg dry sediment (mean-measured), the highest level tested. The 10-day NOAEC, LOAEC, and LC50 for survival were 1200, 2500, and >2500 µg/kg dry sediment, respectively, based on the mean-measured sediment treatment concentrations. The OC-normalized NOAEC, LOAEC and LC50 were 22,000, 45,000 and >45,000 µg a.i./kg TOC. An LC50
could not be calculated because no treatments resulted in 50 percent mortality or greater.
Dry weight per midge larvae averaged 2.02 and 1.97 mg in the negative and solvent control groups, respectively, and 1.93, 1.53, 1.30, 1.12, 0.742, and 0.345 mg for the negative and solvent controls and mean-measured spiked sediment 83, 170, 330, 610, 1200, and 2500 µg/kg dry sediment concentrations, respectively. Reviewer-calculated percent inhibitions in dry weight compared to the negative control were 2, 4, 24, 36, 45, 63 and 83% for the solvent control and mean-measured spiked sediment 83, 170, 330, 610, 1200, and 2500 µg/kg dry sediment concentrations. The measured dry weights for the negative control and solvent control did not significantly differ statistically. The 10-day NOAEC, LOAEC and EC50 (with 95% C.I.) for dry weight were 83, 170, and 660 (500-880) µg a.i./kg dry sediment, respectively, based on the mean-measured sediment concentrations. The OC-normalized NOAEC, LOAEC and EC50
(with 95% C.I.) for dry weight were 1500, 3100 and 12,000 (9100-16,000) µg a.i./kg TOC, based on 5.5% total organic carbon (TOC) in the test sediment. Changes in dry weight resulted in more sensitive endpoints than mortality.
No other sub-lethal effects or abnormal behavior was reported for surviving midges in the controls or treatment groups during the exposure period. This reviewer notes that HPLC/RAM analysis of bifenthrin concentrations in pore water (conducted only at the highest test concentration) indicate that the parent material was only

DP Barcode: D319265 MRID No.: 46591502
4
a fraction of total radioactive residues measured over the course of this study (35-46% for initial and terminal measurements, respectively). In contrast, the recovery of parent compound from bulk sediment was generally high >98% for initial and terminal measurements. Given that recovery of parent chemical was high based on QA/QC sample spikes, the low concentrations of parent material in the pore water appear to reflect desportion of the degradation products from the sediment particles into the pore water phase. This presumption is consistent with the expected lower hydrophobicity of the degradation products compared to the parent compound. Since the measured pore water concentrations of bifenthrin do not accurately describe the exposure to parent compound, endpoints from this study will not be expressed in terms of measured
pore water concentrations.
Instead, this reviewer has estimated freely dissolved pore water endpoints based on measured concentrations in bulk sediment, the fraction of total organic carbon in bulk sediment (5.5%) and the mean KOC (236,750 L/kg-OC; MRID 00141203) for bifenthrin (see Results Synopsis below). These estimated pore water endpoints, which are based on the freely dissolved test material (i.e., chemical that is not sorbed onto particulate organic carbon [POC] or dissolved organic carbon [DOC]), are consistent with the expression of aquatic estimated environmental concentrations (EECs) from PRZM/EXAMS. It is noted, however, that KOC values for bifenthrin vary considerably (131,000 to 302,000) which likely reflects differences in organic carbon composition and other soil properties used to determine KOC. Therefore, these estimated pore water endpoints are subject to the same uncertainty in determination and application of KOC
for bifenthrin.
This study was designed to fulfill proposed OPPTS Guideline 850.1735. This study is classified as SUPPLEMENTAL, due to the lack of an established LC50
. However, this study still provides useful information on the 10-day toxicity of bifenthrin to sediment-dwelling midges (Chironomus tentans).
Results Synopsis: Based on ESTIMATED1
Survival Pore Water Concentrations
LC50 Probit Slope: NA
: >0.192 µg a.i./L 95% C.I.: NA
LOAEC: 0.092 µg a.i./L NOAEC: 0.192 µg a.i./L
Growth (Ash-Free Dry Weight)
EC50 Slope: 1.52 (Std error of slope=0.161)
: 0.051 µg a.i./L 95% C.I.: 0.038-0.068 µg a.i./L
LOAEC: 0.013 µg a.i./L NOAEC: 0.006 µg a.i./L

DP Barcode: D319265 MRID No.: 46591502
5
Survival Based on Bulk Sediment Concentrations (mean-measured)
LC50 Probit Slope: NA
: >2500 µg a.i./kg dry sediment 95% C.I.: NA
LOAEC: 2500 µg a.i./kg dry sediment NOAEC: 1200 µg a.i./kg dry sediment
Growth (Ash-Free Dry Weight) EC50 Slope: 1.52 (Std error of slope = 0.161)
: 660 µg a.i./kg dry sediment 95% C.I.: 500-880 µg a.i./kg dry sediment
LOAEC: 170 µg a.i./kg dry sediment NOAEC: 83 µg a.i./kg dry sediment
Survival Based on OC-normalized Sediment Concentrations (mean-measured)
LC50 Probit Slope: NA
: >45,500 µg a.i./kg TOC 95% C.I.: NA
LOAEC: 45,500 µg a.i./kg TOC NOAEC: 21,800 µg a.i./kg TOC
Growth (Ash-Free Dry Weight) EC50
Slope: 1.52 (Std error of slope = 0.161) : 12,000 µg a.i./kg TOC 95% C.I.: 9100-16,000 µg a.i./kg TOC
LOAEC: 3090 µg a.i./kg TOC NOAEC: 1510µg a.i./kg TOC 1
Mean measured bulk sediment conc. (ug/kg-dw) / [Fraction TOC (kg OC/kg-dw) * K Freely dissolved pore water endpoints (ug/L) estimated as:
OC
(L/kg-OC)]
Endpoints affected: Survival and Dry Weight Most sensitive endpoint: Dry Weight
7. ADEQUACY OF THE STUDY
:

DP Barcode: D319265 MRID No.: 46591502
6
A. Classification: Supplemental
B. Rationale: This study provides useful information on the effects of bifenthrin to chironomids, but no LC50
was established because sufficient mortality was not achieved in the test concentrations.
C. Reparability: N/A
8. GUIDELINE DEVIATIONS
:
The following sources were used as guidance in evaluating this study, and deviations from these guidance documents are listed below:
U.S. EPA. 1996. Ecological Effects Test Guidelines, OPPTS 850.1735 (Public Draft),
EPA-712-C-96-354. April 1996.
U.S. EPA. 2000. Methods for Measuring the Toxicity and Bioaccumulation of Sediment Associated Contaminants with Freshwater Invertebrates. Office of Research and Development and Office of Water, Washington, DC EPA/600/R-99/064. March 2000.
1. Physical descriptions and water solubilities of the test substances (radio-labeled and
unlabeled) were not reported. The study authors reported that dissolved oxygen (DO) concentrations were >2.5 mg/L throughout the exposure period with the following exceptions: on Day 9, the measured DO level in replicate A of the 180 µg a.i./kg dry sediment treatment was 2.4 mg/L; and on Day 10, the measured DO levels in replicate E of the 90 µg a.i./kg dry sediment treatment, replicate H of the 350 µg a.i./kg dry sediment treatment, and replicate E of the 1400 µg a.i./kg dry sediment treatment groups were 2.5, 1.8, and 2.1 mg/L (nominal concentrations). As explained in the Reviewer’s Comments section, the episodic nature of these DO excursions (only on Day 9 and 10 from selected replicates) combined with the information on DO tolerance of C. tentans suggest that they are not sufficient to invalidate the study results.
9. SUBMISSION PURPOSE
: This study was submitted to provide information on the toxicity of bifenthrin to sediment-dwelling freshwater chironomids.
10. MATERIALS AND METHODS
:
Stability of Compound Under Test Conditions: On days 0 and 10 at the nominal 2,800 µg a.i./kg level (the only level analyzed by HPLC/RAM), 98.8% and 99.8% of the recovered radioactivity from bulk sediment was associated with parent material,

DP Barcode: D319265 MRID No.: 46591502
7
respectively. For pore water concentrations in this treatment, the measured concentrations of total [14
C] residue were 1.30 and 5.95 µg/L as bifenthrin equivalents on days 0 and 10, respectively. HPLC/RAM analysis of these residues indicates that 46% and 35% of the recovered radioactivity was associated with parent material, respectively (Table 7 of the study report). As the QA/QC recoveries on these matrices were both high, this indicates that a substantive portion of the LSC measured residues in pore water was not parent compound (bifenthrin).
A. Test Organisms
Guideline Criteria
Reported Information Species
Acute whole sediment toxicity tests are outlined in 850.1735 specifically for the amphipod Hyalella azteca and the midge Chironomus tentans.
Chironomus tentans
Second to third instar larvae (about 10 days old larvae with at least 50% at third instar)
Life Stage 2nd-3rd instar, 10 days old. Age was confirmed by measuring the head capsule widths of 20 midge larvae from a sub-sample of the test population used to initiate the test. Sizes ranged from 0.25 to 0.45 mm. Ash-free dry weight was also determined at test initiation (sub-population of 20 midge larvae) to be 0.38 mg dry weight per midge larvae.
Supplier Brood stock can be obtained from laboratory, commercial, or government sources. (Sources obtained from the wild should be avoided unless cultured through several generations in the laboratory.)
In-house laboratory cultures.
All organisms from the same source?
Yes.

DP Barcode: D319265 MRID No.: 46591502
8
B. Source/Acclimation
Guideline Criteria
Reported Information Acclimation PeriodBrood stock must be acclimated to culture water gradually from transport water to 100% culture water; water temperature exchange rate not to exceed 2
o
C within 24 hr. Avoid unnecessary stress, crowding and rapid temperature and water quality changes.
Reared under test conditions for 10 days prior to test initiation.
During acclimation, feeding should begin on day 0 and continue through day 9 unless food is not being consumed.
Feeding During acclimation, midges were fed a finely-ground flaked fish food suspension daily based on the number and size of the larvae in each rearing vessel.
A group of organisms should not be used if they appear unhealthy, discolored and there should be <20% mortality 48 h before the beginning of a test.
Pretest Mortality No mortalities 48 hours prior to test initiation.
C. Test System
Guideline Criteria
Reported Information
Soft reconstituted water or water from a natural source, not de-chlorinated tap water.
Source of dilution water (Overlying water) and sediment
Unpolluted well or spring that has been tested for contaminants, or appropriate reconstituted water (see ASTM for details).
Overlying water was from the same source as the culture water (laboratory well water). The water was characterized as having total hardness and total alkalinity ranges as calcium carbonate of 46-52 and 32-35 mg/L, respectively, a specific conductivity range of 190-200 µmhos/cm, and a pH of 7.4. Natural sediment was collected from Glen Charlie Pond, Wareham, MA (sub-batch 13656.6106 from the Pyrethroid Working Group-Freshwater Sediment Batch), wet pressed (2.0-mm sieve) to remove large

DP Barcode: D319265 MRID No.: 46591502
9
Guideline Criteria
Reported Information
particles, and was characterized by Agvise Laboratories (Northwood, ND). Analysis of the sediment pore water determined an ammonia concentration of 1.5 mg/L as nitrogen.
Does water support test animals without observable signs of stress?
Yes
If problems are observed in culturing or testing of organisms, it is desirable to test water quality. Particulate, TOC, COD should be <5 mg/L and residual chlorine <11 µg/L
Quality Of Water No problems were reported. Ammonia concentrations (as nitrogen) were <0.10-1.2 mg/L based on measurements from the overlying water as a composite sample from each treatment and control group. Dissolved organic carbon concentrations were 6.8-13.4 mg/L based on measurements from the pore water as a composite sample from each treatment and control group.
23°C ± 1°C. Daily mean test temperature Must not deviate more than ±1
Water Temperature
o
C and instantaneous temperature must be within ±. Temperature should be monitored at least hourly throughout the test in one test chamber, and near the beginning, middle and end of the test in all test chambers.
Daily measurement range of 23-24°C. Continuous monitoring range of 21-24°C in replicate J of the negative control group.
Not specified, but should be appropriate to the test species and should not deviate more than 0.4 pH units.
pH 6.4-6.8 (overlying water), measured on day 0 and day 10
Should be measured at the beginning and end of short term tests. According to OPPTS Guideline 850.1735, the DO should be between 40% and 100%
Dissolved Oxygen Measured daily. DO was generally >2.5 mg/L. The following exceptions were noted: on Day 9, the measured DO level in replicate A of the 170 µg/kg dry sediment treatment was 2.4 mg/L; and on Day 10,

DP Barcode: D319265 MRID No.: 46591502
10
Guideline Criteria
Reported Information
saturation. During this test, 40% saturation would be approximately 3.4 mg/L assuming 100% oxygen saturation at 23.5ºC is 8.5 mg/L at standard pressure. Note: newer sediment toxicity testing guidelines (USEPA 2000) recommend that DO be maintained > 2.5 mg/L.
the DO levels in replicate E of the 83 µg/kg dry sediment, replicate H of the 330 µg/kg dry sediment, and. replicate E of the 1200 µg/kg dry sediment treatment groups were 2.5, 1.8, and 2.1 mg/L, respectively. The actual percent DO saturation relative to the test temperature was not reported.
Prefer 40 - 200 mg/L as CaCOTotal Hardness
3
. 40-52 mg/L as CaCO
3
Total alkalinity was 26-46 mg/L as CaCO3.
Not specified for chironomids, but should be amenable to the test species.
Conductivity 240-270 µmhos/cm
All sediment must be characterized for: pH, organic carbon content (TOC), total volatile sulfides, particle size distribution (% sand, silt, clay), and percent water content.
Sediment Characterization pH: 4.9 Avg. TOC: 5.5% Total volatile sulfides: Not reported Particle size distribution: 83% sand, 12% silt, and 5.5% clay Water holding capacity: Not reported Moisture content @ 1/3 bar: 31%
BOD, COD, cation exchange capacity, Eh, pE, total inorganic carbon, total volatile solids, acid volatile sulfides, total ammonia, metals, organosilicones, synthetic organic compounds, oil and grease, petroleum hydrocarbons, and interstitial water analysis.
Additional Sediment Analysis The sediment was screened for the presence of pesticides, PCBs and toxic metals by GeoLabs, Inc. (Braintree, MA) and none of these compounds were reported to be at concentrations that would be considered to have an adverse impact on the test results. The actual results of the screening were not reported.

DP Barcode: D319265 MRID No.: 46591502
11
Guideline Criteria
Reported Information
Material should be reagent grade unless prior evaluations dictate formulated materials. Must know the test material's identity, quantity of major ingredients and impurities, water solubility, estimated toxicity, precision and bias of analytical method, handling and disposal procedures.
Laboratory Spiked Sediment Nonradiolabeled test material: Bifenthrin tech. Synonyms: None reported CAS no.: Not listed Batch no.: PL03-0131 Purity: 93.0% Physical description: Not reported Water solubility: Not reported Storage condition: Room temp., dark ventilated cabinet This test material was used to spike the sediments used for the range-finding test only. The test concentrations were adjusted for the purity of the test material. Radiolabeled test material: [Phenyl-ring-labeled 14
Synonyms: None reported C]bifenthrin
Batch no.: Isotope #195; Sigma Lot: 021H9236 Specific activity: 24.4 mCi/mmole (equiv. to 128,208 dpm/µg) Amount received: 1.54mCi in hexane (57.0 MBq) Radiochemical Purity: 96.4% Physical description: Not reported Water solubility: Not reported Storage condition: Freezer (<-4°C) This test material was used to spike the sediments used for the definitive test.
Test material should be dissolved in a solvent prior to mixing into test sediment. If solvent is used, both solvent control
Stock Solutions The primary [14C]bifenthrin stock was prepared by removing the hexane from the test material under a gentle stream of nitrogen and then transferring the entire

DP Barcode: D319265 MRID No.: 46591502
12
Guideline Criteria
Reported Information
and negative control are required. amount of test substance to a 50-mL volumetric flask and bringing to volume with acetone. Triplicate 25.0-µL aliquots of the stock were then assayed via LSC. Based on this analysis and the specific activity of 24.4 mCi/mmole provided by the supplier, the stock solution was determined to have a concentration of 408 mg/L (408 µg/mL). The stock was stored frozen until use. The mean radiopurity of this stock solution was 96.3% as determined by HPLC/RAM based on the results from three repetitive injections. Six individual dosing stock solutions were prepared in acetone for application of the test material to the sediment. See Reviewer’s Comments section of this DER for further details on the exact dosing preparation scheme. Negative and solvent controls were also tested.
For LC
Test Concentrations For Spiked Sediment
50 calculation, test concentrations should bracket the predicted LC50
; Sediment concentrations may be normalized to factors other than dry weight (e.g. organic content, acid volatile sulfides); Sediment may be mixed using rolling mill, feed mixer or hand mixer.
Nominal sediment-spiked treatment concentrations were 90, 180, 350, 700, 1400, and 2800 µg a.i./kg dry sediment (ug a.i/kg sediment).
1. Test Aquaria
Material perfluorocarbon plastics.
: Glass or stainless steel or
2. Size
: 300 ml high-form lipless beakers containing 100 mL of sediment and 175
1. Glass vessels (test chambers) 2. 300 mL; containing a 100-mL layer (~4.0-cm depth) of sediment (equivalent to 100 mL or 122 g wet weight per vessel or

DP Barcode: D319265 MRID No.: 46591502
13
Guideline Criteria
Reported Information
mL of overlying water. 47 g dry weight) and 175 mL of overlying water. Total volume was maintained at 275 mL. The test vessels were all positioned in a water bath to maintain temperature.
Covers Static: Test vessels should be covered with a glass plate. Flow-through
: openings in test compartments should be covered with mesh nylon or stainless steel screen.
Flow-through: Test chambers had two mesh-covered slots on the top edge of the vessel to allow for drainage from the vessels during the cycling.
Must provide reproducible supply of toxicant.
Type of Dilution System N/A. Sediment was spiked with test material, not the overlying water.
Consistent flow rate of 5-10 vol/24 hours, meter systems calibrated before study and checked twice daily during test period.
Flow Rate An intermittent delivery system in combination with a calibrated water-distribution system was used to renew the overlying water during the exposure period. The water delivery system cycled approximately seven times per day (50 mL of water per cycle), providing two volume additions (350 mL) per vessel per day. The renewal rate was visually checked at least two times per day.
Dilution water should be vigorously aerated so that dissolved oxygen in the overlying water remains above 40% saturation. In static systems, overlying water may be gently aerated through a 1-mL pipet located not closer than 2 cm from the sediment surface. Test organisms should not added 12 to 24h. Water quality characteristics should be measured before test organisms are added.
Aeration Not reported
Photoperiod 16 hours light, 8 hours dark. Light
DP Barcode: D319265 MRID No.: 46591502
14
Guideline Criteria
Reported Information
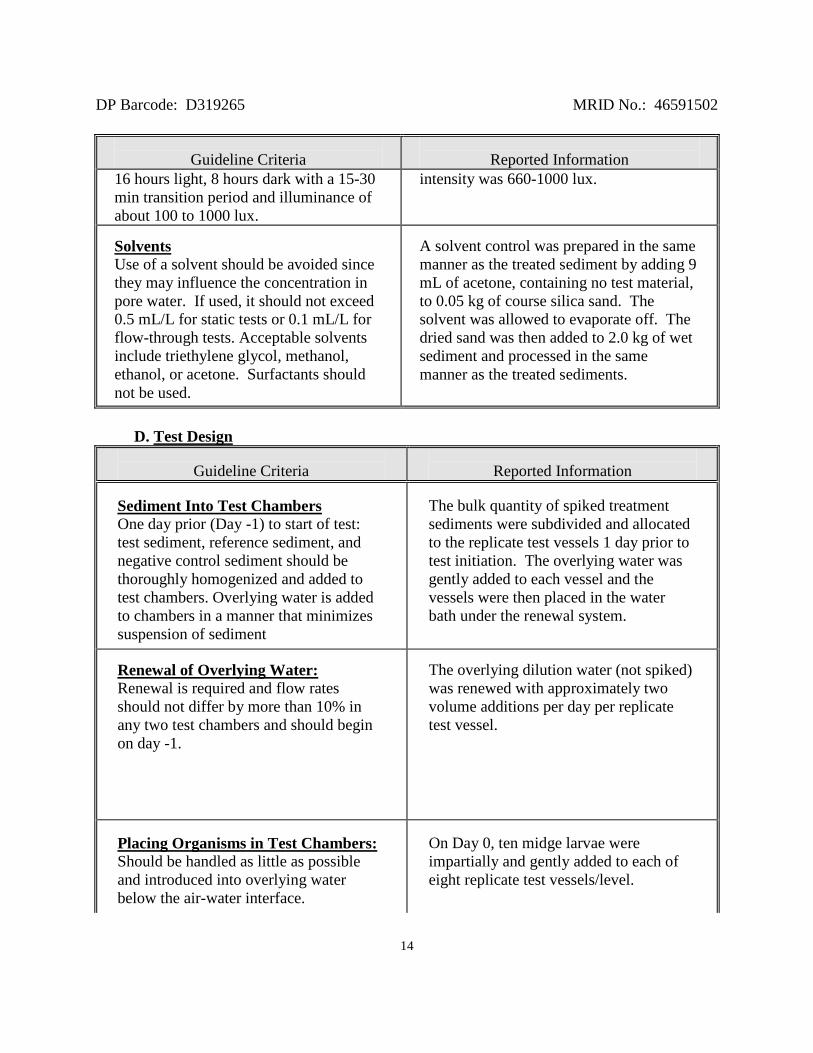
16 hours light, 8 hours dark with a 15-30 min transition period and illuminance of about 100 to 1000 lux.
intensity was 660-1000 lux.
Use of a solvent should be avoided since they may influence the concentration in pore water. If used, it should not exceed 0.5 mL/L for static tests or 0.1 mL/L for flow-through tests. Acceptable solvents include triethylene glycol, methanol, ethanol, or acetone. Surfactants should not be used.
Solvents A solvent control was prepared in the same manner as the treated sediment by adding 9 mL of acetone, containing no test material, to 0.05 kg of course silica sand. The solvent was allowed to evaporate off. The dried sand was then added to 2.0 kg of wet sediment and processed in the same manner as the treated sediments.
D. Test Design
Guideline Criteria
Reported Information
One day prior (Day -1) to start of test: test sediment, reference sediment, and negative control sediment should be thoroughly homogenized and added to test chambers. Overlying water is added to chambers in a manner that minimizes suspension of sediment
Sediment Into Test Chambers The bulk quantity of spiked treatment sediments were subdivided and allocated to the replicate test vessels 1 day prior to test initiation. The overlying water was gently added to each vessel and the vessels were then placed in the water bath under the renewal system.
Renewal is required and flow rates should not differ by more than 10% in any two test chambers and should begin on day -1.
Renewal of Overlying Water: The overlying dilution water (not spiked) was renewed with approximately two volume additions per day per replicate test vessel.
Should be handled as little as possible and introduced into overlying water below the air-water interface.
Placing Organisms in Test Chambers: On Day 0, ten midge larvae were impartially and gently added to each of eight replicate test vessels/level.

DP Barcode: D319265 MRID No.: 46591502
15
Guideline Criteria
Reported Information
Range Finding Test See Reviewer’s Comments section for
method details and results.
All test chambers should be checked daily and observations made to assess organism behavior such as sediment avoidance.
Monitoring the test All replicate test vessels were observed daily for abnormal behavior, number of mortalities and signs of toxicity.
Control(s) and at least 5 test concentrations and dilution factor not greater than 50
Nominal Concentrations of Definitive Test
0 (negative and solvent controls), 90, 180, 350, 700, 1400, and 2800 µg/kg dry weight (ug a.i/kg sediment). Nominal sediment treatment levels were determined based on the results of a range-finding study. Aqueous solubility of the test material was not reported. According to Laskowski (2002) the solubility is low, 0.0000140 mg/L or 0.0140 ug a.i/L.
10 organisms per test chamber are recommended. 8 replicates per treatment should be used.
Number of Test Organisms 10 midge larvae/replicate, with 10 replicates per level. Eight replicates (A-H) were prepared for biological response and water quality measurements, and two additional replicates (I and J) were prepared for chemical analysis of the test material in the overlying water, pore-water, and sediment.
Test organisms randomly or impartially assigned to test vessels?
Yes

DP Barcode: D319265 MRID No.: 46591502
16
Guideline Criteria
Reported Information
Midges in each test chamber are fed 1.5 ml of a 4 g/L Tetrafin® suspension daily. A drop in dissolved oxygen levels below 2.5 mg/L may indicate over-feeding and feeding should be suspended in all treatments until DO levels increase.
Feeding Fed 1.5 mL of a 4-mg/mL suspension of a finely-ground flaked fish food once daily during the definitive test.
Overlying Water Quality should measure conductivity, hardness, pH, alkalinity, and ammonia in all treatments at beginning and end of a test and should not vary by more than 50% within a treatment during the test.
Water Parameter Measurements pH was measured in all biological replicates at test initiation and termination. DO was measured in all biological replicates at test initiation and termination and daily in overlying water in one alternating replicate test vessel of each treatment level and control. Temperature was measured in all biological replicates at test initiation and termination and daily in overlying water in one alternating replicate test vessel of each treatment level and control. Temperature was also measured and recorded continuously in one replicate of the negative control. Hardness, alkalinity, conductivity, ammonia as nitrogen, and DOC were measured at study initiation and termination in a composite sample from the controls and each treatment group. Temperature, pH, total hardness, alkalinity and conductivity remained relatively constant throughout the study. There was a wide range in DO (1.8-8.3 mg/L), and ammonia levels decreased over the course of the study from 0.26-1.2 mg/L to less than 0.10 mg/L.

DP Barcode: D319265 MRID No.: 46591502
17
Guideline Criteria
Reported Information
Needed if solutions were aerated, if chemical was volatile, insoluble, or known to absorb, if precipitate formed, if containers were not steel or glass, or if flow-through system was used.
Chemical Analysis
Concentrations should be measured in bulk sediment, interstitial water, overlying water, and stock solution.
The six treatment levels and both solvent and negative control sediments were sampled and analyzed for total [14C]residue concentrations prior to the allocation of the sediments into the replicate exposure vessels and following the 10-day mixing and equilibration period. During the definitive exposure period, sediment, pore water, and overlying water samples were removed from replicates I and J on test Days 0 and 10, respectively, and analyzed for total [14
C]residue concentrations using liquid scintillation counting (LSC). Overlying water samples were removed from the test vessels by pipetting into a graduated cylinder. The pore water was then removed by removing the entire sediment sample and centrifuging for 30 minutes at 10,000 rpm. The resulting pore water was pipetted from the centrifuge tube.
In addition, three QC sediment samples and three additional aqueous QC samples were prepared and analyzed with each analytical sampling of the test vessels at days 0 and 10.
11. REPORTED RESULTS
:
A. General Results
Guideline Criteria
Reported Information Quality assurance and GLP compliance statements were included in the report?
Yes.

DP Barcode: D319265 MRID No.: 46591502
18
Guideline Criteria
Reported Information
Mean control mortality must be ≤ 20% at end of the test.
Control Mortality Negative control: 9% Solvent control: 18%
Percent Recovery of Chemical: 1) % of nominal; 2) Procedural recovery; 3) Limit of quantitation (LOQ)
1) All recoveries are based on the reported mean-measured treatment concentrations and were determined by LSC analysis. In sediment
: 86-94% of nominal sediment concentrations.
2) Based on QC samples fortified and analyzed concurrently with the sediment and overlying water test samples (on Days 0 and 10). The measured concentrations in the QC samples ranged from 80.9 to 96.1% of the nominal concentrations (63.7 to 3050 µg a.i./kg dry sediment) in five of the samples, and the sixth sample yielded 133% of the nominal concentration. In freshwater matrix spikes at 0.768 to 51.2 µg a.i./L, recoveries were 98.4-114% of nominal. 3) LOQ = 0.076 µg a.i./L for overlying water samples, 0.19 µg a.i./L for pore-water samples and 0.70-0.72 µg a.i./kg dry sediment for sediment samples.

DP Barcode: D319265 MRID No.: 46591502
19
Guideline Criteria
Reported Information
- Survival of Larvae Data Endpoints
- Ash-free dry weight should be determined by pooling all living organisms from a replicate and drying to a constant weight (e.g. 60°C for 24 h)
- Survival of larvae - Ash-free dry weight.
Raw data included?
Mean replicate data provided.

DP Barcode: D319265 MRID No.: 46591502
20
Effects Data (Reviewer-determined)
Toxicant Concentration
Cumulative Number Dead
(and %)
Mean Ash-Free Dry Weight per Midge, mg (and % Inhibition)5
Nominal Sediment (µg a.i./kg dry sediment)
Mean-Measured
(measured on Days 0 and 10) Sediment (µg a.i./kg dry sediment)1
Pore Water (µg a.i./L)2,3
Overlying Water (µg a.i./L)4
Negative control
<0.71
<0.19
<0.076
7/80 (9)
2.02
Solvent control
<0.72
<0.19
<0.076
14/80 (18)
1.97
90
83
0.17
6 <0.076
6/80 (8)
1.93 (4)
180
170
0.33
6 <0.076
2/80 (3)
1.53 (24)*
350
330
0.51
<0.076
8/80 (10)
1.30 (36)*
700
610
1.68
0.11
7 17/80 (21)
1.12 (45)*
1400
1200
2.85
0.18
7 10/80 (13)
0.74 (63)*
2800
2500
5.35
0.38
7 35/80 (44)*
0.35 (83)*
1 The LOQ for sediment samples was 0.70-0.72 µg a.i./kg dry sediment. 2 The LOQ for pore water samples was 0.19 µg a.i./L. 3 Note: Measured concentrations from the study are reported in this DER, but were not used to derive endpoints. See Verification of Statistical Results section for further details. 4 The LOQ for overlying water samples was 0.076 µg a.i./L. 5 Percent inhibition (reviewer-calculated) is relative to the negative control. A negative percent inhibition represents an increase in dry weight relative to the negative control. 6 Since the Day 0 measured concentration was less than the LOQ, ½ LOQ and the Day 10 concentration were averaged by the reviewer. 7
N/A = Not applicable
Reviewer-determined as the average of the Day 0 and Day 10 measured concentrations. Note: The overlying water was renewed at least two times per day to maintain water quality. Concentrations would presumably be higher under static conditions.
* Statistically significant reduction (p≤0.05) compared to the negative control using Steel’s Many-One Rank Test (reviewer-calculated).

DP Barcode: D319265 MRID No.: 46591502
21
B. Statistical Results
Statistical Methods:Endpoints assessed included midge larvae survival and growth (dry weight). Survival treatment response data were compared to the solvent control data since a t-Test indicated a statistically significant difference between the negative and solvent controls. Dry weight negative and solvent control data were pooled based on the lack of a statistically significant difference according to a t-Test. All data were assessed for normality using the Chi-Square test for normality and for homogeneity of variance using Bartlett’s Test (99% level of certainty). Survival and dry weight data met the assumptions for normality, but did not meet the assumption of homogeneity and were assessed for treatment-related reductions non-parametrically using Steel’s Many One-Rank Test and Bonferroni’s Test, respectively. Survival data was transformed (arcsine square-root) prior to analysis. Analyses were performed using the mean replicate organism response rather than individual responses. Endpoints were determined using the mean-measured sediment treatment concentrations via Toxstat v. 3.5. The 10-day LC
50
value based on midge survival was determined to be greater than the highest concentration tested since no treatment level tested elicited a ≥50% reduction in survival by test termination.
LOAEC Study Author’s Statistical Results (Survival)
2500 a.i/kg sediment NOAEC 1200 ug a.i/kg sediment
LC50 >2500 ug a.i/kg sediment
Study Authors’ Statistical Results (Growth) LOAEC 170 ug a.i/kg sediment NOAEC 83 ug a.i/kg sediment
EC50 780 ug a.i/kg sediment (600 – 910) (95% CI) 12. VERIFICATION OF STATISTICAL RESULTS
:
Statistical Method(s): NOAEC and LOAEC values based on percent survival data were determined non-parametrically using Steel’s Many One-Rank Test since the data set failed to meet both assumptions of ANOVA. Percent survival treatment response data were statistically compared to the negative control, and a t-Test indicated a statistically significant difference from the negative control. The 10-day LC50 value was determined visually due to the lack of a ≥50% reduction at any treatment levels tested. The above statistical analyses were performed in terms of the mean-measured sediment concentrations.

DP Barcode: D319265 MRID No.: 46591502
22
After examining normality (passed Chi-squared) and homogeneity of variances (failed Bartlett’s) ash-free dry weight data were compared to the negative control using Steel’s Many One-Rank Test. The results of this analysis were used to determine the NOAEC and LOAEC based on the mean-measured spiked sediment concentrations. The above statistical analyses were performed via TOXSTAT statistical software, with the exception of the LC50 value. An EC50 (with 95% C.I.) was determined by the study reviewer using NUTHATCH statistical software for dry weight, based on the mean-measured sediment and estimated pore water concentrations. The study author reported using the ICp method for EC50
determination which explains the difference in endpoint values for the study author and study reviewer.
The above statistical analyses were performed in terms of the mean-measured sediment and estimated pore water treatment concentrations. Sediment endpoints are also reported on an OC-normalized basis, based on the following equation: mg/kg OC = kg TOC/kg dry weight
mg/kg dry weight
This reviewer notes that HPLC/RAM analysis of bifenthrin concentrations in pore water (conducted only at the highest test concentration) indicate that the parent material was only a small fraction of total radioactive residues measured over the course of this study 35-46% for initial and terminal measurements. In contrast, the recovery of parent compound from bulk sediment was generally high >98% for initial and terminal measurements. Given that recovery of parent chemical was high based on QA/QC samples, the low concentrations of parent material in the pore water appear to reflect desportion of the degradation products from the sediment particles into the pore water phase. This presumption is consistent with the expected lower hydrophobicity of the degradation products compared to the parent compound. Since the measured pore water concentrations of bifenthrin do not accurately describe the exposure to parent compound, endpoints from this study will not be expressed in terms of measured
pore water concentrations.
Instead, this reviewer has estimated freely dissolved pore water endpoints using the aforementioned statistical analyses based on measured concentrations in bulk sediment, the fraction of total organic carbon in bulk sediment (5.5%) and the mean KOC (236,750 L/kg-OC; MRID 00141203) for bifenthrin (see Results Synopsis below). These estimated pore water endpoints, which are based on the freely dissolved test material (i.e., chemical that is not sorbed onto particulate organic carbon [POC] or dissolved organic carbon [DOC]), are consistent with the expression of aquatic estimated environmental concentrations (EECs) from PRZM/EXAMS. It is noted, however, that KOC values for bifenthrin vary considerably (131,000 to 302,000) which likely reflects differences in organic carbon composition and other soil properties used to determine KOC. Therefore, these estimated pore water endpoints are subject to the same uncertainty in determination and application of KOC for

DP Barcode: D319265 MRID No.: 46591502
23
bifenthrin.
Results Synopsis
Based on ESTIMATED1
Survival Pore Water Concentrations
LC50 Probit Slope: NA
: >0.192 µg a.i./L 95% C.I.: NA
LOAEC: 0.092 µg a.i./L NOAEC: 0.192 µg a.i./L
Growth (Ash-Free Dry Weight)
EC50 Slope: 1.52 (Std error of slope=0.161)
: 0.051 µg a.i./L 95% C.I.: 0.038-0.068 µg a.i./L
LOAEC: 0.013 µg a.i./L NOAEC: 0.006 µg a.i./L
1
Mean measured bulk sediment conc. (ug/kg-dw) / [Fraction TOC (kg OC/kg-dw) * K Freely dissolved pore water endpoints (ug/L) estimated as:
OC
(L/kg-OC)]
Survival Based on Bulk Sediment Concentrations (mean-measured)
LC50 95% C.I.: NA
: >2500 µg a.i./kg dry sediment
Probit Slope: NA LOAEC: 2500 µg a.i./kg dry sediment
NOAEC: 1200 µg a.i./kg dry sediment
Growth (Ash-Free Dry Weight) EC50 95% C.I.: 500-880 µg a.i./kg dry sediment
: 660 µg a.i./kg dry sediment
Slope: 1.52 (Std error of slope = 0.161) LOAEC: 170 µg a.i./kg dry sediment
NOAEC: 83 µg a.i./kg dry sediment
Survival Based on OC-normalized Sediment Concentrations (mean-measured)
LC50 Probit Slope: NA
: >45,500 µg a.i./kg TOC 95% C.I.: NA
LOAEC: 45,500 µg a.i./kg TOC NOAEC: 21,800 µg a.i./kg TOC
Growth (Ash-Free Dry Weight)
DP Barcode: D319265 MRID No.: 46591502
24
EC50Slope: 1.52 (Std error of slope = 0.161)
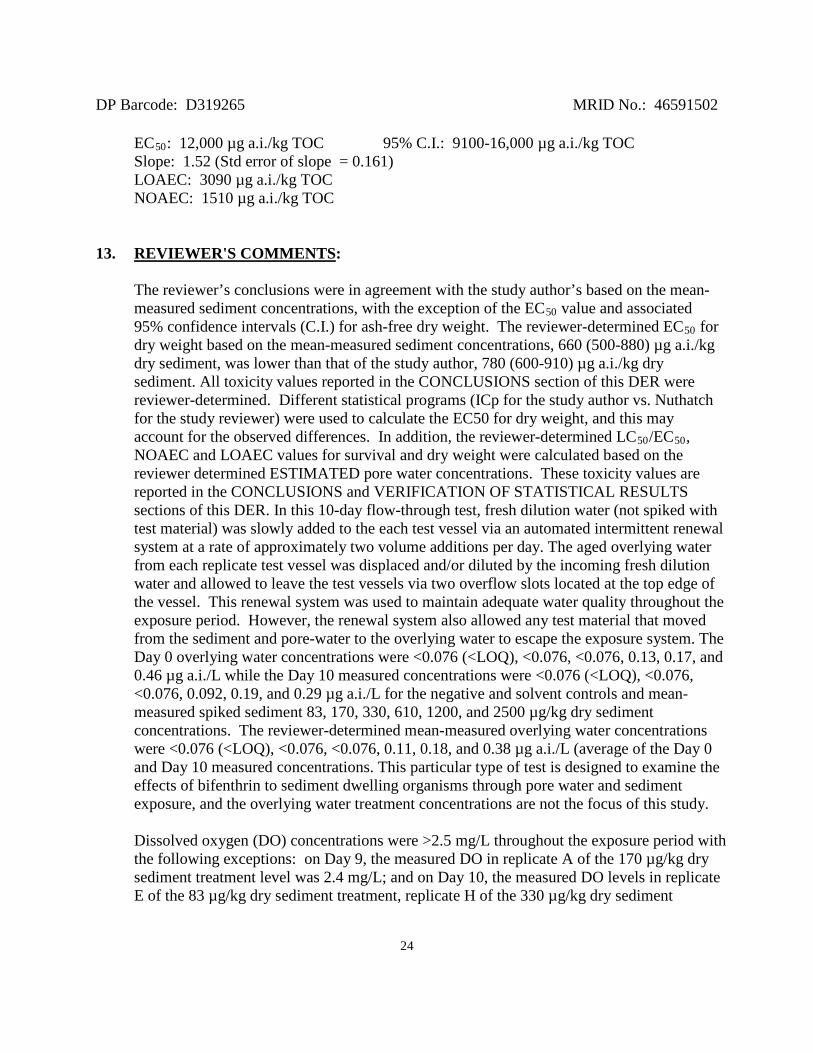
: 12,000 µg a.i./kg TOC 95% C.I.: 9100-16,000 µg a.i./kg TOC
LOAEC: 3090 µg a.i./kg TOC NOAEC: 1510 µg a.i./kg TOC 13. REVIEWER'S COMMENTS
:
The reviewer’s conclusions were in agreement with the study author’s based on the mean-measured sediment concentrations, with the exception of the EC50 value and associated 95% confidence intervals (C.I.) for ash-free dry weight. The reviewer-determined EC50 for dry weight based on the mean-measured sediment concentrations, 660 (500-880) µg a.i./kg dry sediment, was lower than that of the study author, 780 (600-910) µg a.i./kg dry sediment. All toxicity values reported in the CONCLUSIONS section of this DER were reviewer-determined. Different statistical programs (ICp for the study author vs. Nuthatch for the study reviewer) were used to calculate the EC50 for dry weight, and this may account for the observed differences. In addition, the reviewer-determined LC50/EC50
, NOAEC and LOAEC values for survival and dry weight were calculated based on the reviewer determined ESTIMATED pore water concentrations. These toxicity values are reported in the CONCLUSIONS and VERIFICATION OF STATISTICAL RESULTS sections of this DER. In this 10-day flow-through test, fresh dilution water (not spiked with test material) was slowly added to the each test vessel via an automated intermittent renewal system at a rate of approximately two volume additions per day. The aged overlying water from each replicate test vessel was displaced and/or diluted by the incoming fresh dilution water and allowed to leave the test vessels via two overflow slots located at the top edge of the vessel. This renewal system was used to maintain adequate water quality throughout the exposure period. However, the renewal system also allowed any test material that moved from the sediment and pore-water to the overlying water to escape the exposure system. The Day 0 overlying water concentrations were <0.076 (<LOQ), <0.076, <0.076, 0.13, 0.17, and 0.46 µg a.i./L while the Day 10 measured concentrations were <0.076 (<LOQ), <0.076, <0.076, 0.092, 0.19, and 0.29 µg a.i./L for the negative and solvent controls and mean-measured spiked sediment 83, 170, 330, 610, 1200, and 2500 µg/kg dry sediment concentrations. The reviewer-determined mean-measured overlying water concentrations were <0.076 (<LOQ), <0.076, <0.076, 0.11, 0.18, and 0.38 µg a.i./L (average of the Day 0 and Day 10 measured concentrations. This particular type of test is designed to examine the effects of bifenthrin to sediment dwelling organisms through pore water and sediment exposure, and the overlying water treatment concentrations are not the focus of this study.
Dissolved oxygen (DO) concentrations were >2.5 mg/L throughout the exposure period with the following exceptions: on Day 9, the measured DO in replicate A of the 170 µg/kg dry sediment treatment level was 2.4 mg/L; and on Day 10, the measured DO levels in replicate E of the 83 µg/kg dry sediment treatment, replicate H of the 330 µg/kg dry sediment

DP Barcode: D319265 MRID No.: 46591502
25
treatment, and replicate E of the 1200 µg/kg dry sediment treatment groups were 2.5, 1.8, and 2.1 mg/L, respectively. Mortality was not significantly reduced in these treatments relative to the controls, however growth was significantly reduced at 180 µg a.i./kg dw and above. The actual percent DO saturation relative to the test temperature was not reported. Although OPPTS Guideline 850.1735 (1996 public draft), indicate that the DO in overlying water should be between 40% and 100% saturation (which is 3.4 mg/L and above at 23.5 C; Radtke et al, 1998), more recent sediment toxicity testing protocols (USEPA 2000) recommend that DO be maintained > 2.5 mg/L based on measured DO tolerances of C. tentans. Furthermore, USEPA (2000) indicates that 10-d exposures to concentrations as low as 1.5 mg/L did not adversely affect C. tentans survival or development. Although the potential interaction of these low DO events and toxicant exposure on midge growth cannot be discounted with absolute certainty, the episodic nature of these DO excursions (only on Day 9 and 10 from selected replicates) combined with the aforementioned information on DO tolerance of C. tentans suggest that they are not sufficient to invalidate the study results.
For the definitive test (MRID 46591502), six individual dosing stock solutions were prepared in acetone for application to the test material to the sediment. These stock solutions were prepared using radiolabeled test material according to the following preparation scheme:
Conc. of
Radiolabeled Stock Used
(µg/mL)
Volume of
Radiolabeled Stock Used (mL)
Diluted to
Final Volume with Acetone
(mL)
Dosing Stock
Concentration (mg/mL)
Percent
Radiolabeled (%)
408
15.9
25
260
100
260
5.0
10
130
100
260
2.47
10
64
100
260
1.23
10
32
100
260
0.635
10
16.5
100
260
0.32
10
8.3
100
All dosing stocks were clear and colorless with no visible undissolved test material.
An appropriate amount (9 mL) of each individual dosing stock solution (above) was added to 0.0500 kg of course silica sand and placed in glass petri dishes. The solvent was allowed to evaporate for 30 minutes. The dry sand, containing the test material, was then added to the 2.0000 kg of wet sediment (0.7756 kg dry weight based on a percent of solids of 38.78%) in individual 1-gallon jars. The total mass of sediment spiked on a dry weight

DP Barcode: D319265 MRID No.: 46591502
26
basis for each treatment level and control was 0.8256 kg (0.0500 kg sand and 0.7756 kg dry weight sediment). The jars were sealed and rolled horizontally on a rolling mill for 4 hours at room temperature at approx. 15 rpm. Following the 4 hours of rolling, the jars were stored upright at 4°C overnight. The treated sediments were then allowed to equilibrate for 31 days in the refrigerator prior to allocation into the replicate test vessels. During the equilibration period, the treated sediments were rolled on the mill for an additional 2 hours once per week.
On Day 0 and Day 10, sediment and pore water samples from the nominal 2800 µg a.i./kg dry sediment level were analyzed by HLPLC/RAM to determine the percent of [14
C]residues associated with the parent test material (measured concentrations dry sediment as bifenthrin equivalents). Recoveries were 98.8% and 99.8% from the sediment, µg/kg samples on Day 0 and Day 10, respectively. Recoveries were 46.0% and 35.0% from the pore water samples on Day 0 and Day 10, respectively, which indicates that a substantive portion of the LSC measured residues in pore water was not parent compound (bifenthrin).
The study author noted that prior to the initiation of the definitive test, a preliminary 10-day exposure was conducted to determine the relative toxicity of non-radiolabeled bifenthrin to midge larvae (10 days old). The nominal treatment levels tested were 0.0 (negative and solvent controls), 0.070, 0.70, 7.0, 70, and 700 µg a.i./kg dry sediment and were prepared in the same manner as described for the definitive test. Three replicates per treatment and negative and solvent control groups with 10 midge larvae per replicate were tested. By Day 10, midge survival was 100% in both controls and 97, and 97, 100, 100, and 47% survival was observed in the nominal 0.070, 0.70, 7.0, 70, and 700 µg a.i./kg dry sediment treatment groups, respectively. Ash-free dry weight among surviving midge larvae averaged 1.27 and 1.23 in the negative and solvent control, and 1.17, 1.16, 0.96, 1.00, and 0.030 mg per midge larvae in the nominal 0.070, 0.70, 7.0, 70, and 700 µg a.i./kg dry sediment treatment groups, respectively. The definitive nominal sediment test concentrations of 90, 180, 350, 700, 1400, and 2800 µg a.i./kg dry sediment were selected based on the preliminary results.
This study was conducted in compliance with all pertinent US EPA GLP regulations. Signed quality assurance, GLP and no data confidentiality statements were provided.
14. REFERENCES
:
Adams, W.J., R.A. Kimerle and R.G. Mosher. 1985. Aquatic safety assessment of chemicals sorbed to sediments. In: Aquatic Toxicology and Hazard Assessment: Seventh Symposium ASTM STP 854. R.D. Cardwell, R, Purdy and R.C. Bahner, Eds. American Society for Testing Materials. 1985. pp. 429-453.

DP Barcode: D319265 MRID No.: 46591502
27
APHA, AWWA, WPCF. 1995. Standard Methods for the Examination of Water and Wastewater. 19th
Edition, Washington, DC.
ASTM. 2002. Standard practice for conducting acute toxicity tests with fishes, macroinvertebrates, and amphibians. Standard E729-96. American Society for Testing and Materials. 100 Barr Harbor Drive, West Conshohocken, PA.
Ditsworth, G.R., D.W. Schults, and J.K.P. Jones. 1990. Preparation of Benthic Substrates for
Sediment Toxicity Testing. Environmental Toxicology and Chemistry. Vol. 9, pp. 1523-1529.
Frankenberry, M., Hammer, C., and K. Sappington. Guidance for the Use of Dilution-Water
(Negative) and Solvent Controls in Statistical Data Analysis for Guideline Aquatic Toxicology Studies. US EPA. September 25, 2008.
Gulley, D.D., Boetler, A.M. and H.L. Bergman. 1996. Toxstat Release 3.5. University of
Wyoming, Laramie, Wyoming. Laskowski, D.A., 2002. Physical and chemical properties of pyrethroids. Rev. Environ. Contam. Toxicol. 2002; 174:49-170. Norberg-King, Teresa J. 1993. A Linear Interpolation Method for Sublethal Toxicity: The
Inhibition Concentration (ICp) Approach. National Effluent Toxicity Assessment Center, Environmental Research Laboratory - Duluth, U.S. EPA, Duluth, Minnesota. Technical Report 03-93.
Sokal, R.R. and F.J. Rohlf. 1981. Biometry. 2nd
Edition. W.H. Freeman and Company, New York. 859 pp.
U.S. EPA. 10 CFR, Part 160. Federal Insecticide, Fungicide and Rodenticide Act. Good Laboratory Practice Standards; Final Rule. Office of the Federal Register, National Archives and Records Administration. U.S. Government Printing Office, Washington, D.C.
U.S. EPA. 10 CFR, Part 158. U.S. Environmental Protection Agency. Data Requirements for registration. Office of the Federal Register, National Archives and Records Administration. U.S. Government Printing Office, Washington, D.C.
U.S. EPA. 2000. Methods for measuring the Toxicity and Bioaccumulation of Sediment-
associated Contaminants with Freshwater Invertebrates, 2nd
Edition. U.S. EPA. Office of Research Development. EPA/600/R-99/064.
Weber, C.I. et al. 1989. Short-term methods for estimating the chronic toxicity of effluents and

DP Barcode: D319265 MRID No.: 46591502
28
receiving waters to freshwater organisms. 2nd
edition. EPA/600/4-89/001. Environmental Monitoring Systems Laboratory, U.S. Environmental Protection Agency, Cincinnati, OH.
Zumwalt, D.C. et al. 1994. A water-renewal system that accurately delivers small volume of water to exposure chambers. Environmental Toxicology and Chemistry. pgs. 1311-1314.

DP Barcode: D319265 MRID No.: 46591502
29
APPENDIX I: OUTPUT OF REVIEWER’S STATISTICAL VERIFICATION
:
Title: Bifenthrin 10-day sediment mortality control comparison File: CONTMORT.TXT Transform: NO TRANSFORMATION ANOVA Table ---------------------------------------------------------------------------- SOURCE DF SS MS F ---------------------------------------------------------------------------- Between 1 3.0625 3.0625 5.1194 Within (Error) 14 8.3750 0.5982 ---------------------------------------------------------------------------- Total 15 11.4375 ---------------------------------------------------------------------------- (p-value = 0.0401) Critical F = 8.8616 (alpha = 0.01, df = 1,14) = 4.6001 (alpha = 0.05, df = 1,14) Since F > Critical F REJECT Ho: All equal (alpha = 0.05) Title: Bifenthrin 10-day sediment mortality control comparison File: CONTMORT.TXT Transform: NO TRANSFORMATION 2 Sample t-Test - TABLE 1 OF 2 Ho: Control<Treatment ---------------------------------------------------------------------------- TRANSFORMED MEAN CALCULATED IN SIG GROUP IDENTIFICATION MEAN ORIGINAL UNITS t STAT 0.05 ----- -------------------- ----------- ------------------ ------ --- 1 solvent control 8.2500 8.2500 2 negative contro 9.1250 9.1250 -2.2626 ---------------------------------------------------------------------------- Equal Var: t critical value = 1.7613 (1 Tailed, alpha = 0.05, df = 14) (p-value = 0.9800) TRANSFORMED MEAN CALCULATED IN SIG GROUP IDENTIFICATION MEAN ORIGINAL UNITS T STAT 0.05 ----- -------------------- ----------- ------------------ ------ --- 1 solvent control 8.2500 8.2500 2 negative contro 9.1250 9.1250 -2.2626 ---------------------------------------------------------------------------- Unequal Var: t critical value = 1.8331 (1 Tailed, alpha = 0.05, df = 9) (p-value = 0.9750)

DP Barcode: D319265 MRID No.: 46591502
30
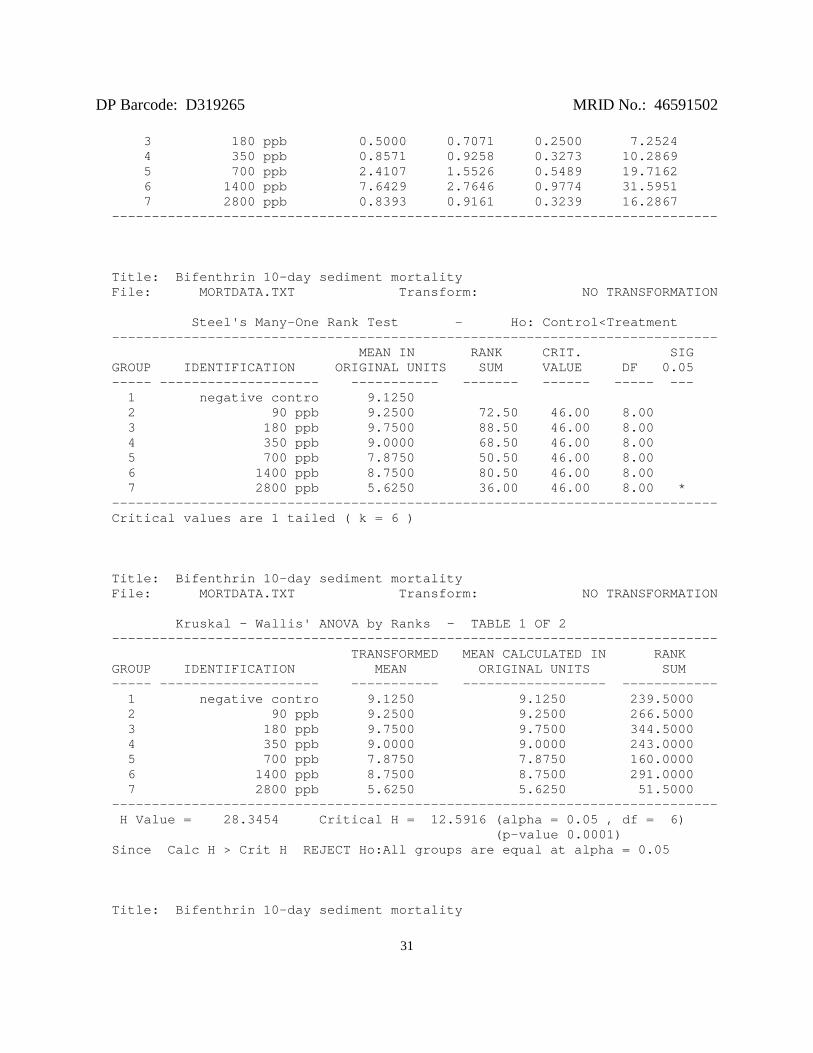
Title: Bifenthrin 10-day sediment mortality control comparison File: CONTMORT.TXT Transform: NO TRANSFORMATION 2 Sample t-Test - TABLE 2 OF 2 Ho: Control<Treatment ---------------------------------------------------------------------------- Equal Variances: ---------------------------------------------------------------------------- NUM OF MIN SIG DIFF % OF DIFFERENCE GROUP IDENTIFICATION REPS (IN ORIG. UNITS) CONTROL FROM CONTROL ----- -------------------- ------- ---------------- ------- ------------ 1 solvent control 8 2 negative contro 8 0.6811 8.3 -0.8750 ---------------------------------------------------------------------------- Unequal Variances: ---------------------------------------------------------------------------- NUM OF MIN SIG DIFF % OF DIFFERENCE GROUP IDENTIFICATION REPS (IN ORIG. UNITS) CONTROL FROM CONTROL ----- -------------------- ------- ---------------- ------- ------------ 1 solvent control 8 2 negative contro 8 0.7089 8.6 -0.8750 ------------------------ Title: Bifenthrin 10-day sediment mortality File: MORTDATA.TXT Transform: NO TRANSFORMATION Summary Statistics on Data TABLE 1 of 2 ---------------------------------------------------------------------------- GRP IDENTIFICATION N MIN MAX MEAN --- ---------------- ---- ---------- ---------- ---------- 1 negative contro 8 9.0000 10.0000 9.1250 2 90 ppb 8 8.0000 10.0000 9.2500 3 180 ppb 8 8.0000 10.0000 9.7500 4 350 ppb 8 7.0000 10.0000 9.0000 5 700 ppb 8 5.0000 10.0000 7.8750 6 1400 ppb 8 2.0000 10.0000 8.7500 7 2800 ppb 8 4.0000 7.0000 5.6250 ---------------------------------------------------------------------------- Title: Bifenthrin 10-day sediment mortality File: MORTDATA.TXT Transform: NO TRANSFORMATION Summary Statistics on Data TABLE 2 of 2 ---------------------------------------------------------------------------- GRP IDENTIFICATION VARIANCE SD SEM C.V. % --- ---------------- -------------- ---------- ---------- ---------- 1 negative contro 0.1250 0.3536 0.1250 3.8746 2 90 ppb 0.5000 0.7071 0.2500 7.6444
DP Barcode: D319265 MRID No.: 46591502
31
3 180 ppb 0.5000 0.7071 0.2500 7.2524 4 350 ppb 0.8571 0.9258 0.3273 10.2869 5 700 ppb 2.4107 1.5526 0.5489 19.7162 6 1400 ppb 7.6429 2.7646 0.9774 31.5951 7 2800 ppb 0.8393 0.9161 0.3239 16.2867 ---------------------------------------------------------------------------- Title: Bifenthrin 10-day sediment mortality File: MORTDATA.TXT Transform: NO TRANSFORMATION Steel's Many-One Rank Test - Ho: Control<Treatment ---------------------------------------------------------------------------- MEAN IN RANK CRIT. SIG GROUP IDENTIFICATION ORIGINAL UNITS SUM VALUE DF 0.05 ----- -------------------- ----------- ------- ------ ----- --- 1 negative contro 9.1250 2 90 ppb 9.2500 72.50 46.00 8.00 3 180 ppb 9.7500 88.50 46.00 8.00 4 350 ppb 9.0000 68.50 46.00 8.00 5 700 ppb 7.8750 50.50 46.00 8.00 6 1400 ppb 8.7500 80.50 46.00 8.00 7 2800 ppb 5.6250 36.00 46.00 8.00 * ---------------------------------------------------------------------------- Critical values are 1 tailed ( k = 6 ) Title: Bifenthrin 10-day sediment mortality File: MORTDATA.TXT Transform: NO TRANSFORMATION Kruskal - Wallis' ANOVA by Ranks - TABLE 1 OF 2 ---------------------------------------------------------------------------- TRANSFORMED MEAN CALCULATED IN RANK GROUP IDENTIFICATION MEAN ORIGINAL UNITS SUM ----- -------------------- ----------- ------------------ ------------ 1 negative contro 9.1250 9.1250 239.5000 2 90 ppb 9.2500 9.2500 266.5000 3 180 ppb 9.7500 9.7500 344.5000 4 350 ppb 9.0000 9.0000 243.0000 5 700 ppb 7.8750 7.8750 160.0000 6 1400 ppb 8.7500 8.7500 291.0000 7 2800 ppb 5.6250 5.6250 51.5000 ---------------------------------------------------------------------------- H Value = 28.3454 Critical H = 12.5916 (alpha = 0.05 , df = 6) (p-value 0.0001) Since Calc H > Crit H REJECT Ho:All groups are equal at alpha = 0.05 Title: Bifenthrin 10-day sediment mortality

DP Barcode: D319265 MRID No.: 46591502
32
File: MORTDATA.TXT Transform: NO TRANSFORMATION Dunn's Multiple Comparison - Kruskal - Wallis - TABLE 2 OF 2 ---------------------------------------------------------------------------- GROUP TRANSFORMED ORIGINAL 0 0 0 0 0 0 0 GROUP IDENTIFICATION MEAN MEAN 7 5 6 4 1 2 3 ----- --------------- ----------- --------- - - - - - - - 7 2800 ppb 5.6250 5.6250 \ 5 700 ppb 7.8750 7.8750 . \ 6 1400 ppb 8.7500 8.7500 * . \ 4 350 ppb 9.0000 9.0000 * . . \ 1 negative contro 9.1250 9.1250 . . . . \ 2 90 ppb 9.2500 9.2500 * . . . . \ 3 180 ppb 9.7500 9.7500 * . . . . . \ ---------------------------------------------------------------------------- * = significant difference (alpha = 0.05) . = no significant difference Table q value = 3.0380 (0.05, 7) SE = 7.7980 ---------------------------------------------------- Title: Bifenthrin 10-day sediment mortality control comparison File: CONTDRYW.TXT Transform: NO TRANSFORMATION ANOVA Table ---------------------------------------------------------------------------- SOURCE DF SS MS F ---------------------------------------------------------------------------- Between 1 0.0077 0.0077 0.0965 Within (Error) 14 1.1105 0.0793 ---------------------------------------------------------------------------- Total 15 1.1182 ---------------------------------------------------------------------------- (p-value = 0.7606) Critical F = 8.8616 (alpha = 0.01, df = 1,14) = 4.6001 (alpha = 0.05, df = 1,14) Since F < Critical F FAIL TO REJECT Ho: All equal (alpha = 0.05) Title: Bifenthrin 10-day sediment mortality control comparison File: CONTDRYW.TXT Transform: NO TRANSFORMATION 2 Sample t-Test - TABLE 1 OF 2 Ho: Control<Treatment ---------------------------------------------------------------------------- TRANSFORMED MEAN CALCULATED IN SIG GROUP IDENTIFICATION MEAN ORIGINAL UNITS t STAT 0.05

DP Barcode: D319265 MRID No.: 46591502
33
----- -------------------- ----------- ------------------ ------ --- 1 solvent control 1.9725 1.9725 2 negative contro 2.0163 2.0163 -0.3107 ---------------------------------------------------------------------------- Equal Var: t critical value = 1.7613 (1 Tailed, alpha = 0.05, df = 14) (p-value = 0.6197) TRANSFORMED MEAN CALCULATED IN SIG GROUP IDENTIFICATION MEAN ORIGINAL UNITS T STAT 0.05 ----- -------------------- ----------- ------------------ ------ --- 1 solvent control 1.9725 1.9725 2 negative contro 2.0163 2.0163 -0.3107 ---------------------------------------------------------------------------- Unequal Var: t critical value = 1.7823 (1 Tailed, alpha = 0.05, df = 12) (p-value = 0.6193) Title: Bifenthrin 10-day sediment mortality control comparison File: CONTDRYW.TXT Transform: NO TRANSFORMATION 2 Sample t-Test - TABLE 2 OF 2 Ho: Control<Treatment ---------------------------------------------------------------------------- Equal Variances: ---------------------------------------------------------------------------- NUM OF MIN SIG DIFF % OF DIFFERENCE GROUP IDENTIFICATION REPS (IN ORIG. UNITS) CONTROL FROM CONTROL ----- -------------------- ------- ---------------- ------- ------------ 1 solvent control 8 2 negative contro 8 0.2480 12.6 -0.0437 ---------------------------------------------------------------------------- Unequal Variances: ---------------------------------------------------------------------------- NUM OF MIN SIG DIFF % OF DIFFERENCE GROUP IDENTIFICATION REPS (IN ORIG. UNITS) CONTROL FROM CONTROL ----- -------------------- ------- ---------------- ------- ------------ 1 solvent control 8 2 negative contro 8 0.2510 12.7 -0.0437 ---------------------------------------------------------------------------- ------------------------------------------------------------------------ Program: Nuthatch Date: 1/19/10 ------------------------------------------------------------------------ Toxicity measurement for continuous endpoints, using weighted nonlinear regression, weighting proportional to predicted means. Reference --------- R.D. Bruce and D.J. Versteeg. 1992. A statistical procedure for modeling continuous toxicity data. Env. Tox. and Chem. 11:1485-1494. ------------------------------------------------------------------------ Input file: DRYWSEDI.TXT

DP Barcode: D319265 MRID No.: 46591502
34
------------------------------------------------------------------------ In c:\NUTHATCH\DRYWSEDI.TXT : `negative control` Interpreted as Dose = 0 DRYWSEDI.TXT : Bifenthrin 10-day sediment dry weight ------------------------------------------------------------------------ Williams Test ------------------------------------------------------------------------ [One-Sided Test for Decrease, alpha = 0.050000 ] Dose Isotone T-bar P-value Significance Means ---------------------------------------------------- 0 2.02 . 83 1.93 0.6633 N.S. 170 1.52 3.671 <0.005 * 330 1.3 5.362 <0.005 * 610 1.12 6.689 <0.005 * 1200 0.742 9.521 <0.005 * 2500 0.345 12.49 <0.005 * "*"=Significant; "N.S."=Not Significant. ------------------------------------------------------------------------ Estimates of EC% ------------------------------------------------------------------------ Parameter Estimate 95% Bounds Std.Err. Lower Bound Lower Upper /Estimate EC5 55. 26. 1.2E+02 0.16 0.47 EC10 95. 50. 1.8E+02 0.14 0.53 EC25 2.4E+02 1.5E+02 3.8E+02 0.099 0.63 EC50 6.6E+02 5.0E+02 8.8E+02 0.062 0.75 Slope = 1.52 Std.Err. = 0.161 Goodness of fit: p = 0.39 based on DF= 4.0 49. ------------------------------------------------------------------------ DRYWSEDI.TXT : Bifenthrin 10-day sediment dry weight ------------------------------------------------------------------------ Observed vs. Predicted Treatment Group Means ------------------------------------------------------------------------ Dose #Reps. Obs. Pred. Obs. Pred. %Change Mean Mean -Pred. %Control 0.00 8.00 2.02 2.01 0.00348 100. 0.00 83.0 8.00 1.93 1.84 0.0871 91.4 8.56 170. 8.00 1.52 1.64 -0.114 81.4 18.6 330. 8.00 1.30 1.36 -0.0617 67.6 32.4 610. 8.00 1.12 1.05 0.0745 52.0 48.0 1.20e+03 8.00 0.742 0.696 0.0462 34.6 65.4 2.50e+03 8.00 0.345 0.380 -0.0356 18.9 81.1