Data Driven Marketing Strategy + Execution
46
Data-Driven Marketing Strategy + Execution Graduate Programs Jesse Trahan
-
Upload
jesse-trahan -
Category
Education
-
view
488 -
download
4
Transcript of Data Driven Marketing Strategy + Execution
Data-Driven Marketing Strategy + Execution
Graduate Programs
Jesse Trahan
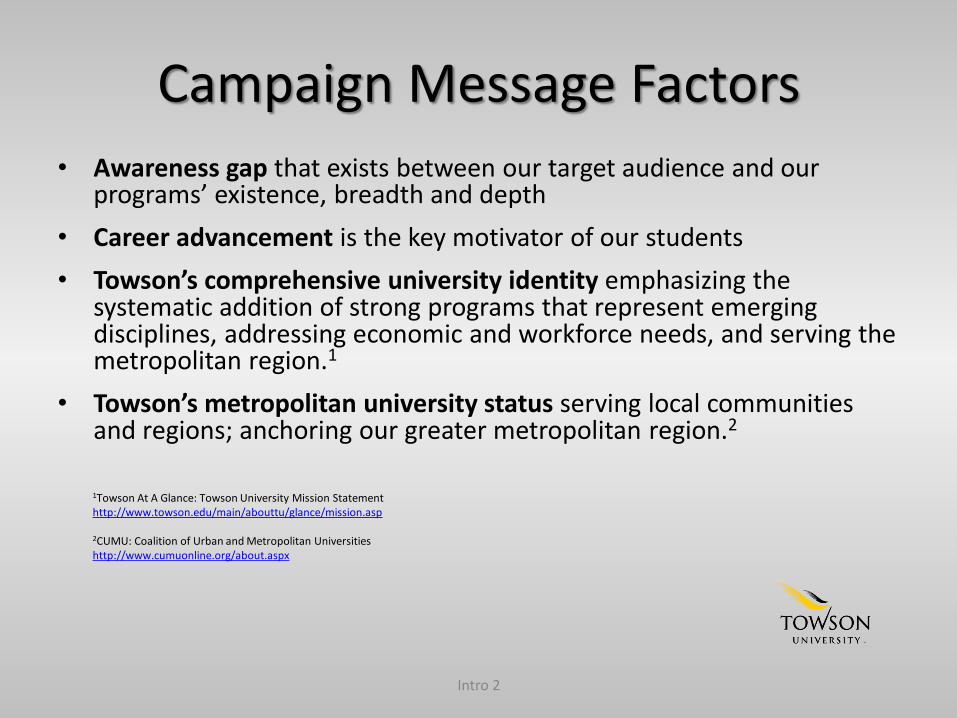
Campaign Message Factors
• Awareness gap that exists between our target audience and our programs’ existence, breadth and depth
• Career advancement is the key motivator of our students
• Towson’s comprehensive university identity emphasizing the systematic addition of strong programs that represent emerging disciplines, addressing economic and workforce needs, and serving the metropolitan region.1
• Towson’s metropolitan university status serving local communities and regions; anchoring our greater metropolitan region.2
1Towson At A Glance: Towson University Mission Statement http://www.towson.edu/main/abouttu/glance/mission.asp 2CUMU: Coalition of Urban and Metropolitan Universities http://www.cumuonline.org/about.aspx
Intro 2
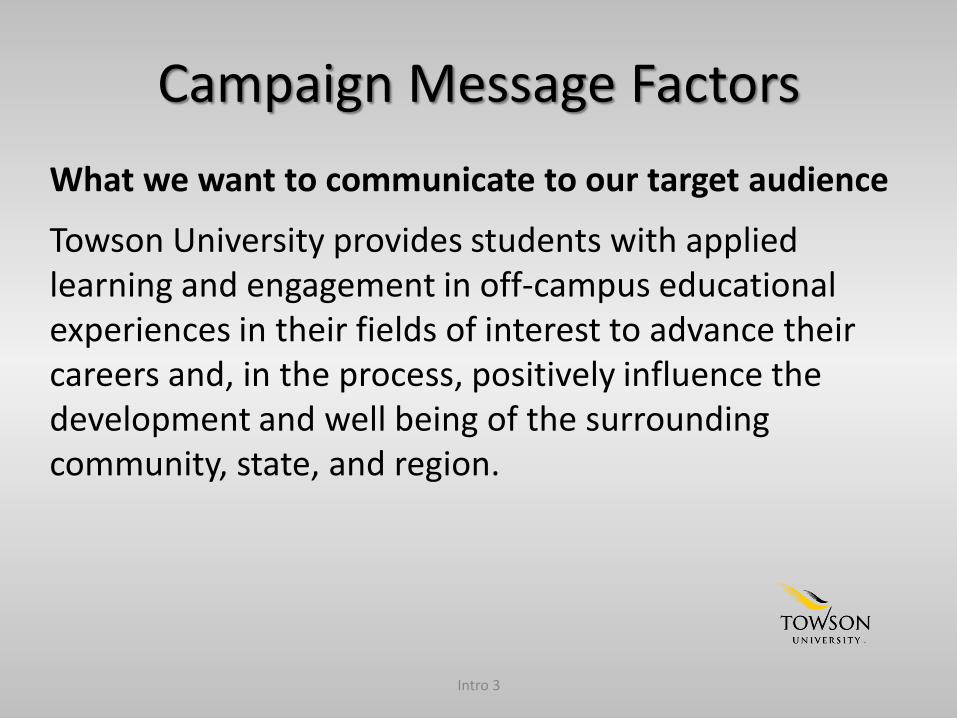
Campaign Message Factors
What we want to communicate to our target audience
Towson University provides students with applied learning and engagement in off-campus educational experiences in their fields of interest to advance their careers and, in the process, positively influence the development and well being of the surrounding community, state, and region.
Intro 3
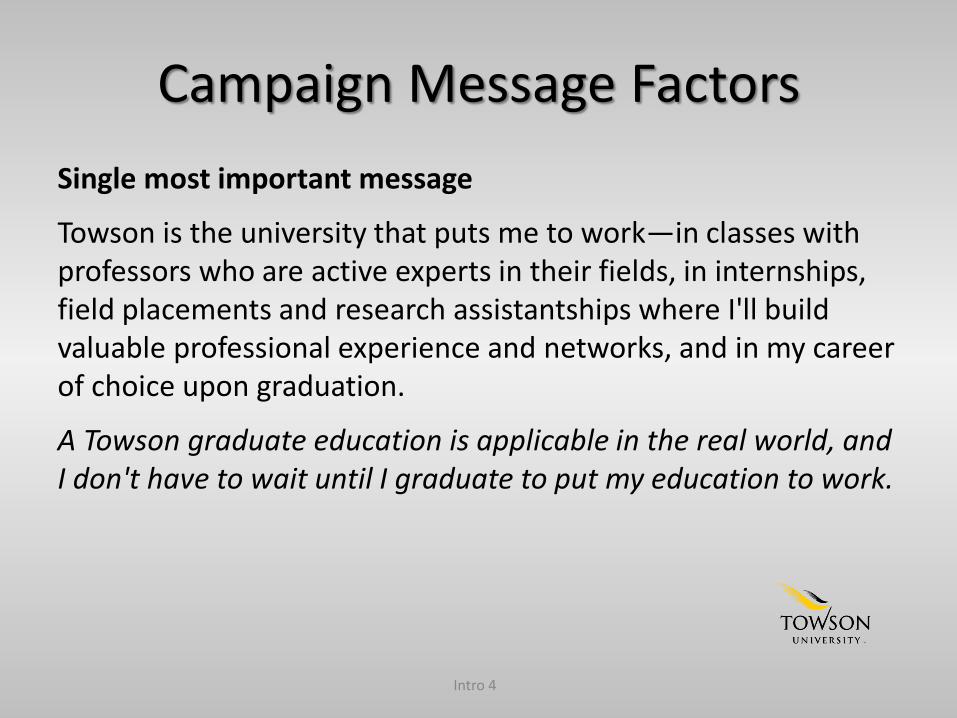
Campaign Message Factors
Single most important message
Towson is the university that puts me to work—in classes with professors who are active experts in their fields, in internships, field placements and research assistantships where I'll build valuable professional experience and networks, and in my career of choice upon graduation.
A Towson graduate education is applicable in the real world, and I don't have to wait until I graduate to put my education to work.
Intro 4
Campaign Media Factors
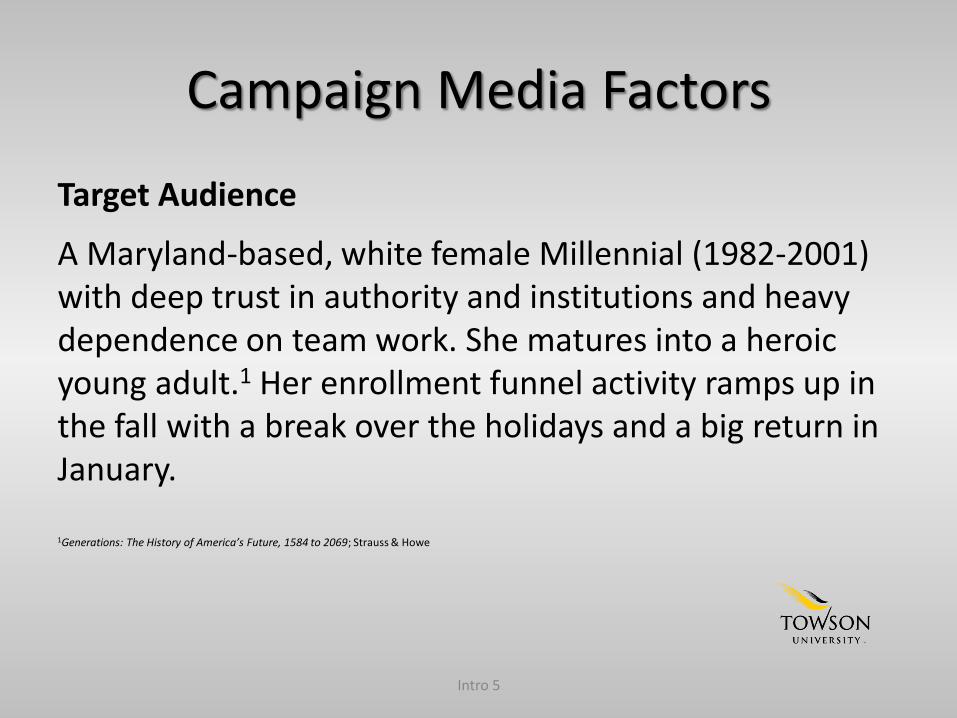
Target Audience
A Maryland-based, white female Millennial (1982-2001) with deep trust in authority and institutions and heavy dependence on team work. She matures into a heroic young adult.1 Her enrollment funnel activity ramps up in the fall with a break over the holidays and a big return in January. 1Generations: The History of America’s Future, 1584 to 2069; Strauss & Howe
Intro 5
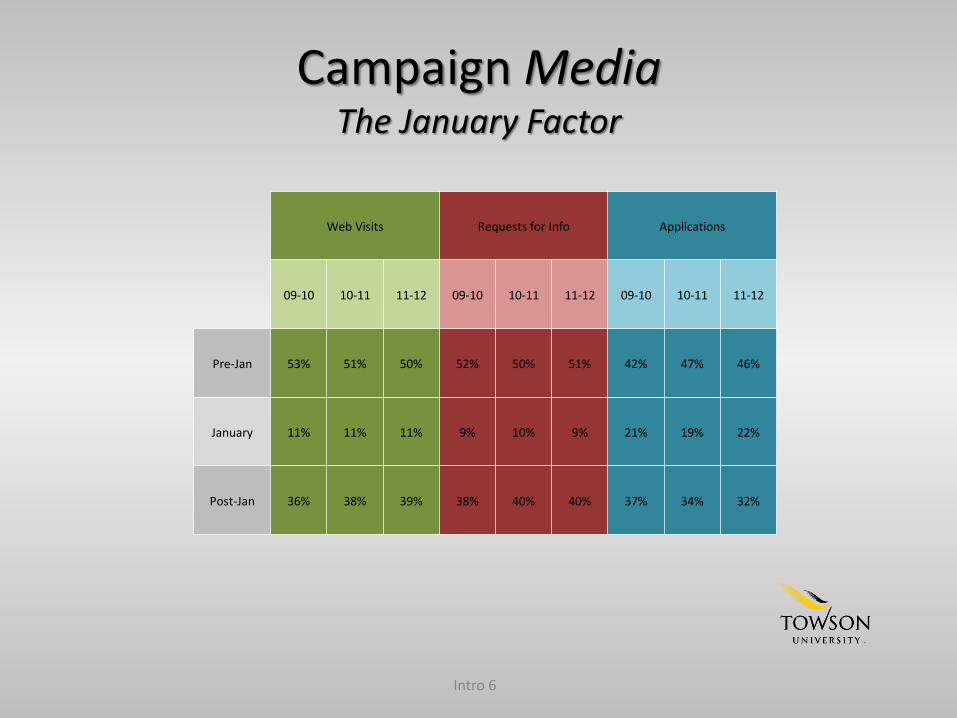
Campaign Media The January Factor
Intro 6
Web Visits Requests for Info Applications
09-10 10-11 11-12 09-10 10-11 11-12 09-10 10-11 11-12
Pre-Jan 53% 51% 50% 52% 50% 51% 42% 47% 46%
January 11% 11% 11% 9% 10% 9% 21% 19% 22%
Post-Jan 36% 38% 39% 38% 40% 40% 37% 34% 32%
Campaign Evolution Fiscal Years 2009-2011
Message and media factors contributed to a campaign strategy of real TU students relating their personal stories of gaining valuable real-world experience, making significant contributions, and becoming
highly desirable in their professional fields, before they even graduate.
Intro 7
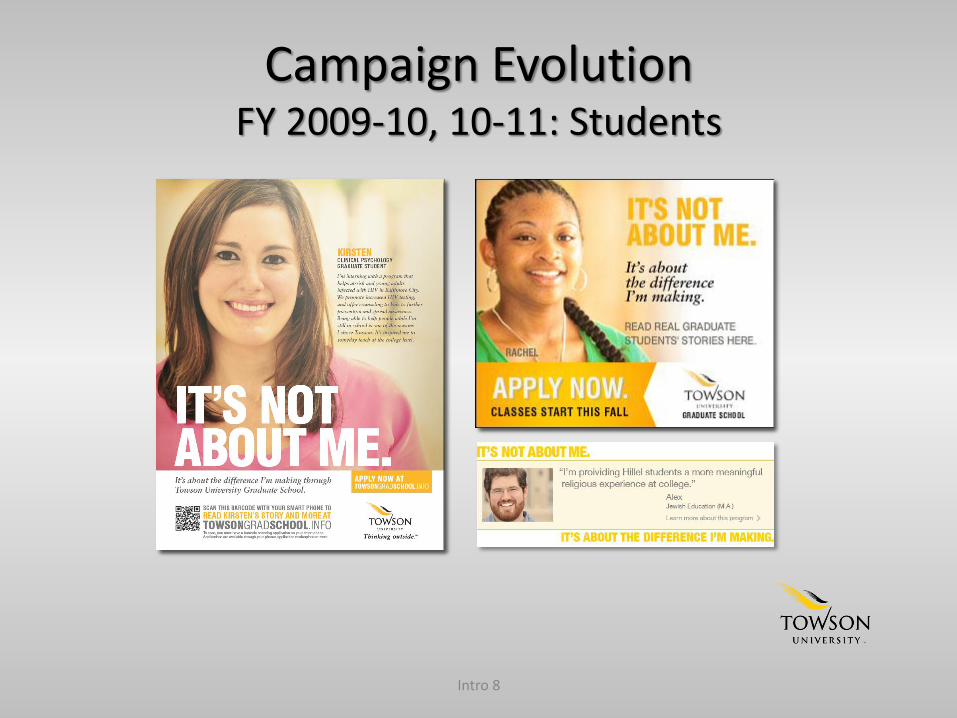
Campaign Evolution FY 2009-10, 10-11: Students
Intro 8
Campaign Evolution Fiscal Years 2011-12
Student voices are now amplified by alumni crediting TU for their success and employers reinforcing our core message of the very real
value of real-world experience.
Intro 9
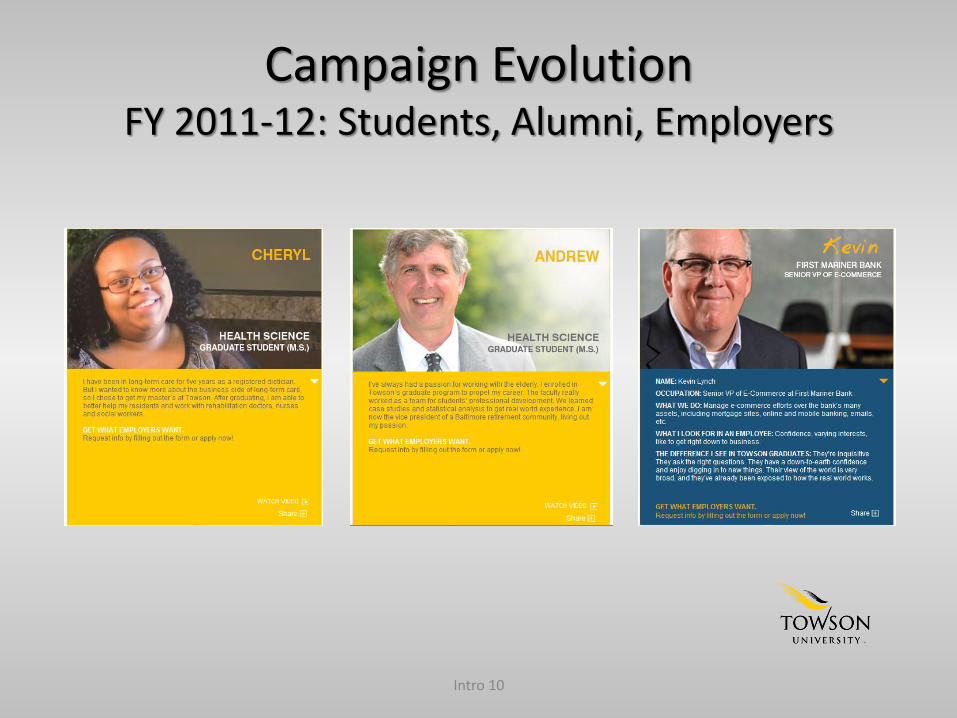
Campaign Evolution FY 2011-12: Students, Alumni, Employers
Intro 10
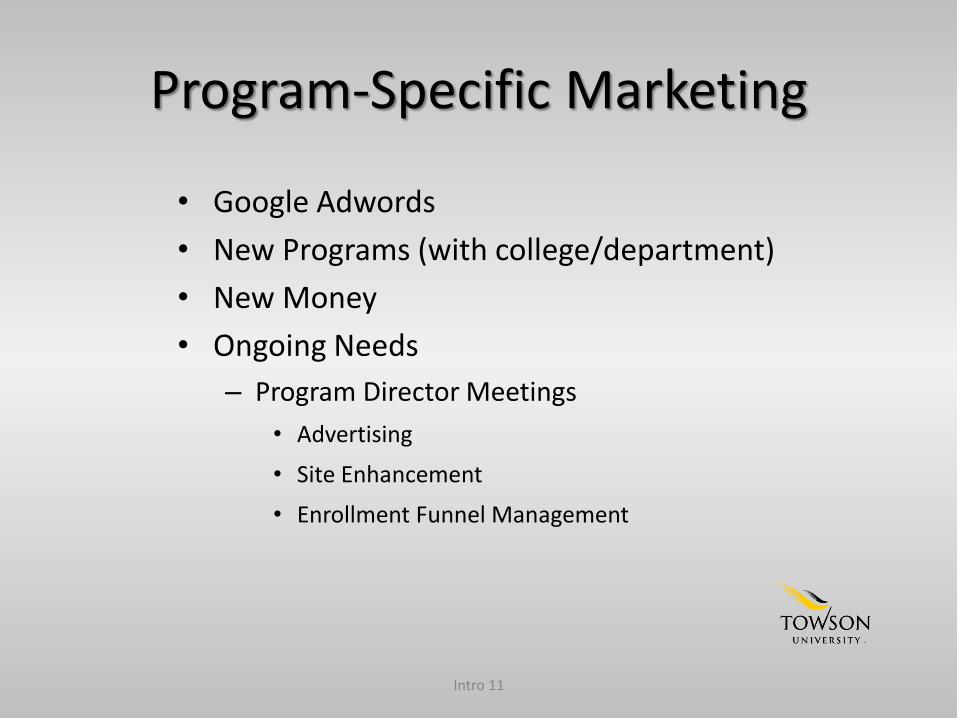
Program-Specific Marketing
• Google Adwords
• New Programs (with college/department)
• New Money
• Ongoing Needs
– Program Director Meetings
• Advertising
• Site Enhancement
• Enrollment Funnel Management
Intro 11
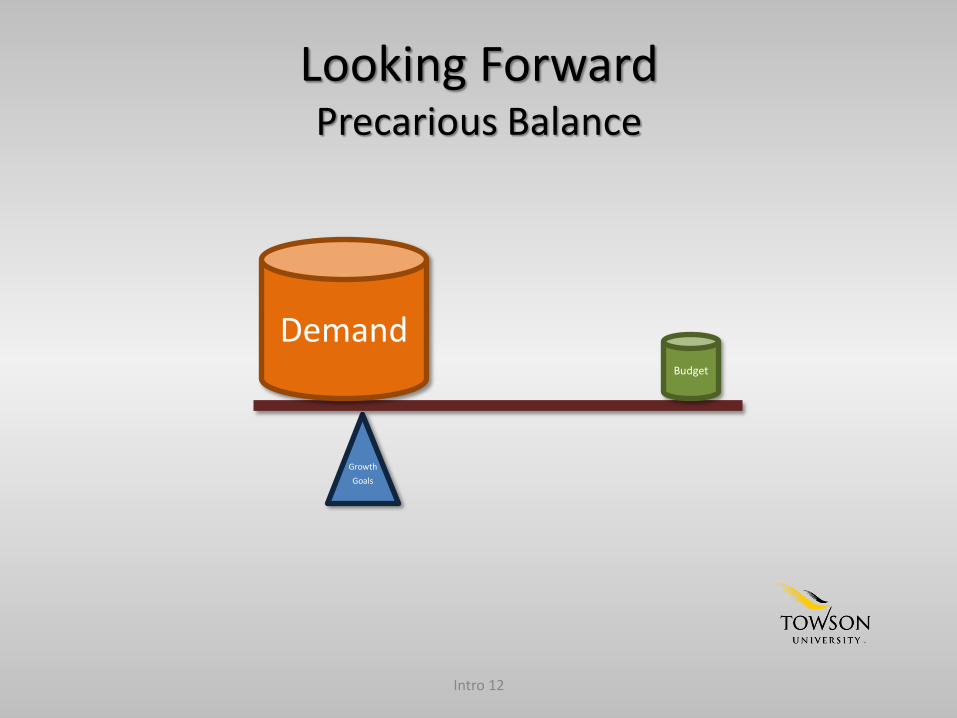
Looking Forward Precarious Balance
Growth
Goals
Demand Budget
Intro 12
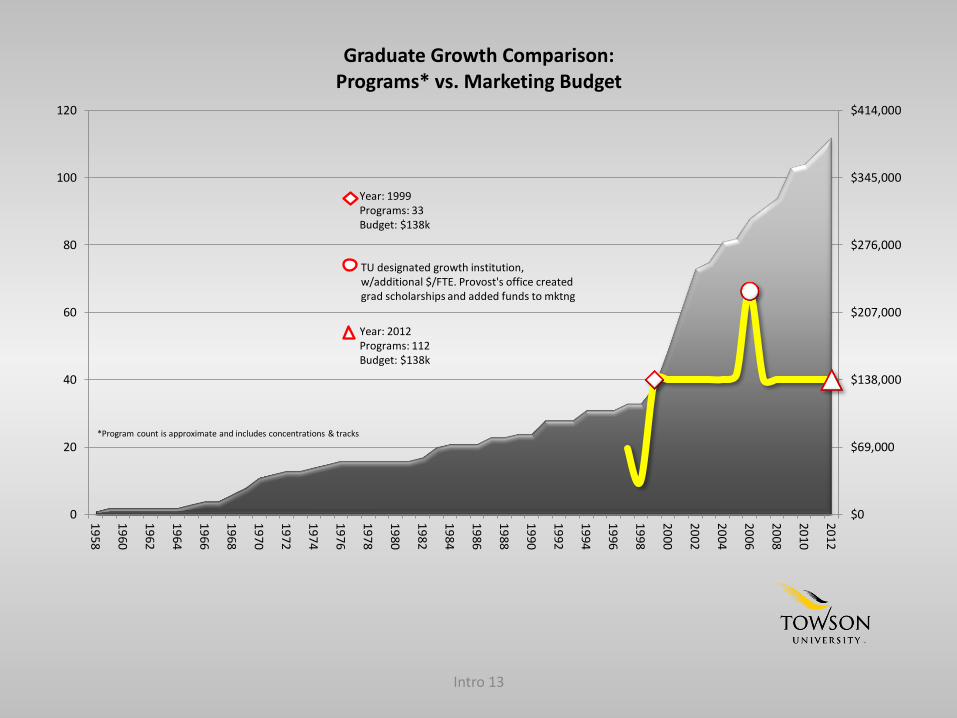
Intro 13
$0
$69,000
$138,000
$207,000
$276,000
$345,000
$414,000
0
20
40
60
80
100
120
1958
1960
1962
1964
1966
1968
1970
1972
1974
1976
1978
1980
1982
1984
1986
1988
1990
1992
1994
1996
1998
2000
2002
2004
2006
2008
2010
2012
Graduate Growth Comparison: Programs* vs. Marketing Budget
TU designated growth institution, w/additional $/FTE. Provost's office created grad scholarships and added funds to mktng
Year: 1999 Programs: 33 Budget: $138k
Year: 2012 Programs: 112 Budget: $138k
*Program count is approximate and includes concentrations & tracks
Page 1 of 33
0
10000
20000
30000
40000
50000
60000
70000
80000
Jul Aug Sep Oct Nov Dec Jan Feb Mar Apr May Jun
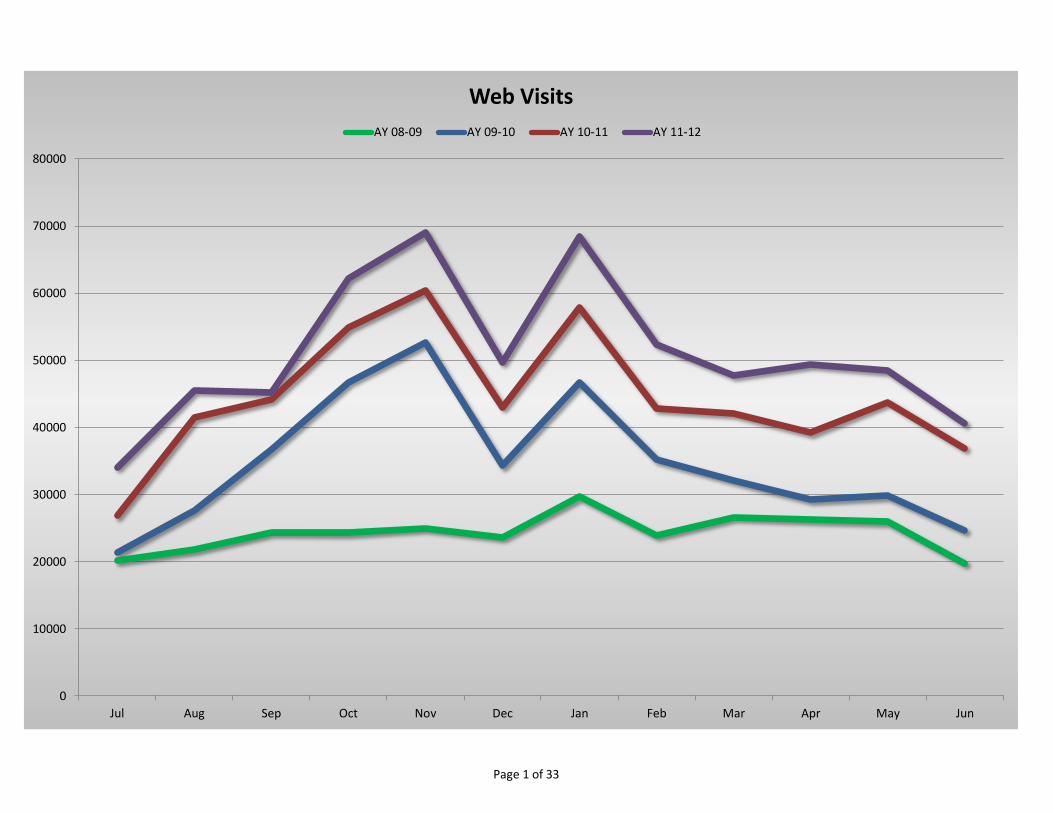
Web Visits
AY 08-09 AY 09-10 AY 10-11 AY 11-12
Page 2 of 33
0
50000
100000
150000
200000
250000
300000
350000
Jul Aug Sep Oct Nov Dec Jan Feb Mar Apr May Jun
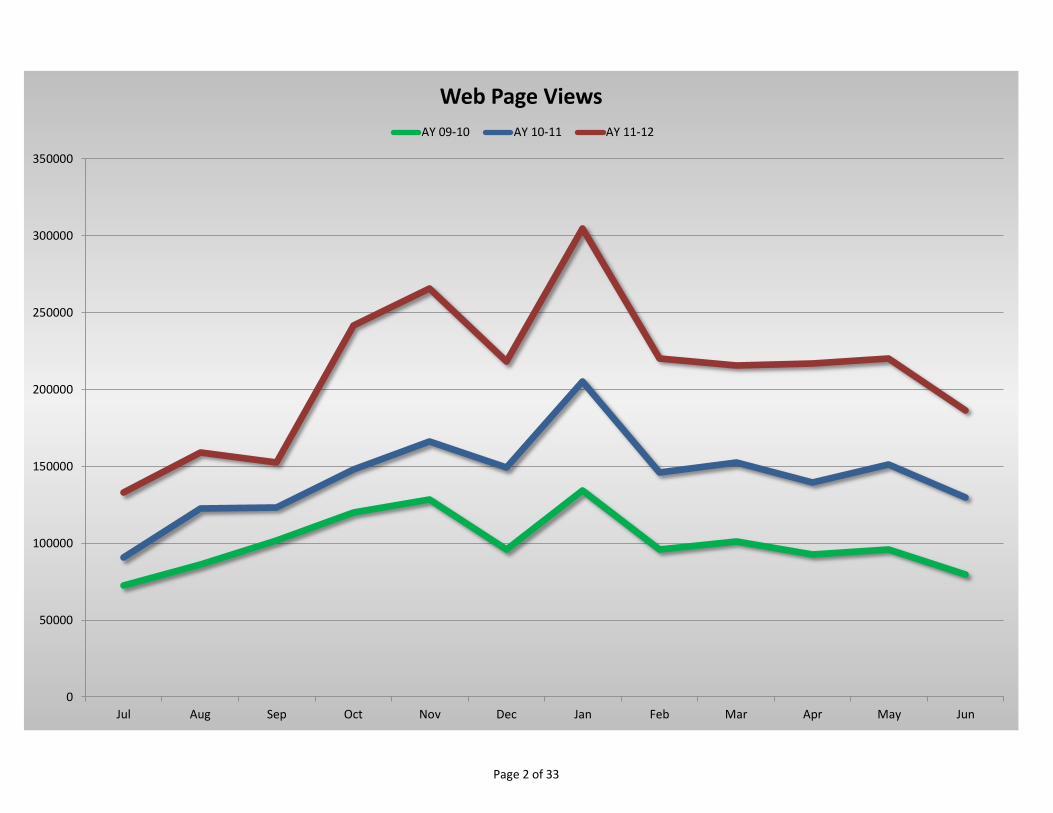
Web Page Views
AY 09-10 AY 10-11 AY 11-12
Page 3 of 33
0
0.5
1
1.5
2
2.5
3
3.5
4
4.5
5
Jul Aug Sep Oct Nov Dec Jan Feb Mar Apr May Jun
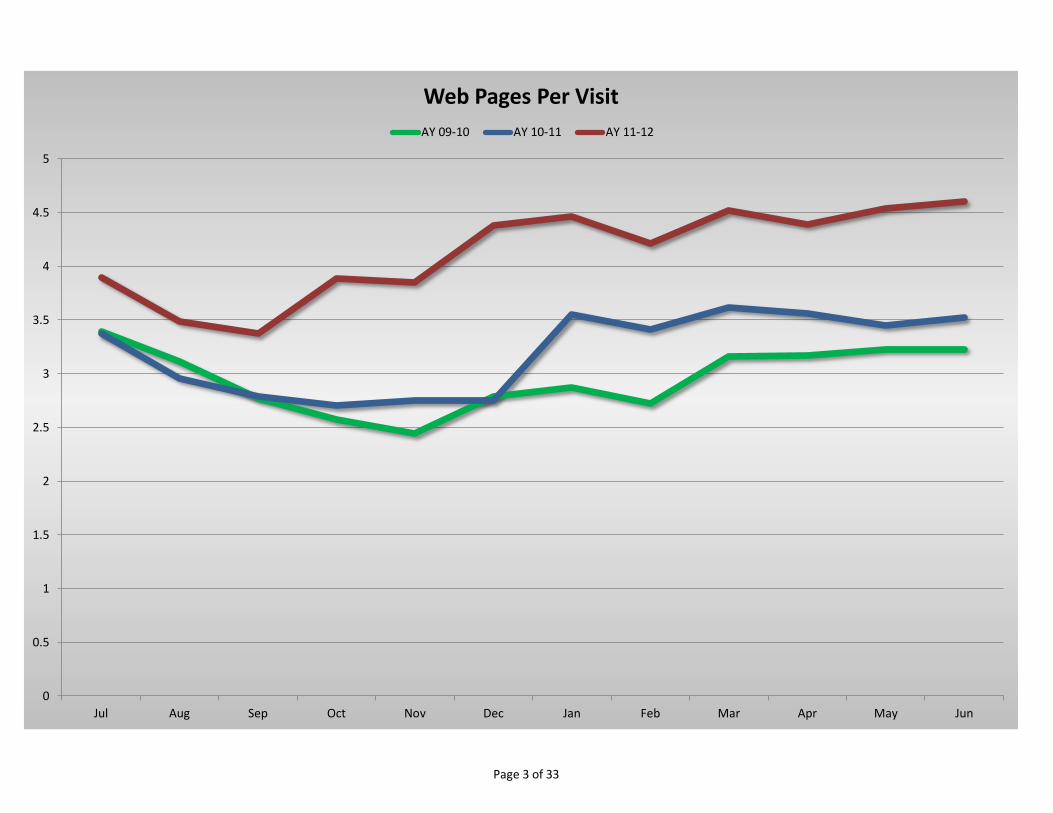
Web Pages Per Visit
AY 09-10 AY 10-11 AY 11-12
Page 4 of 33
0
0.5
1
1.5
2
2.5
3
3.5
4
4.5
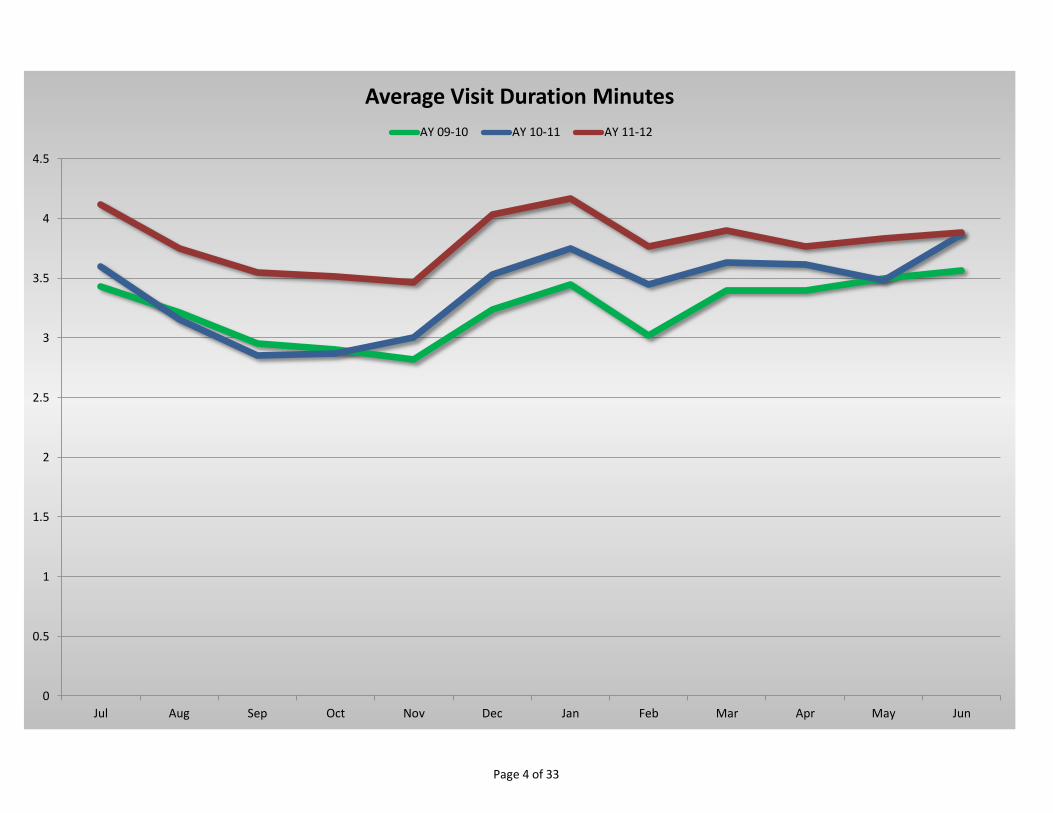
Jul Aug Sep Oct Nov Dec Jan Feb Mar Apr May Jun
Average Visit Duration Minutes
AY 09-10 AY 10-11 AY 11-12
Page 5 of 33
0
100
200
300
400
500
600
700
800
Jul Aug Sep Oct Nov Dec Jan Feb Mar Apr May Jun
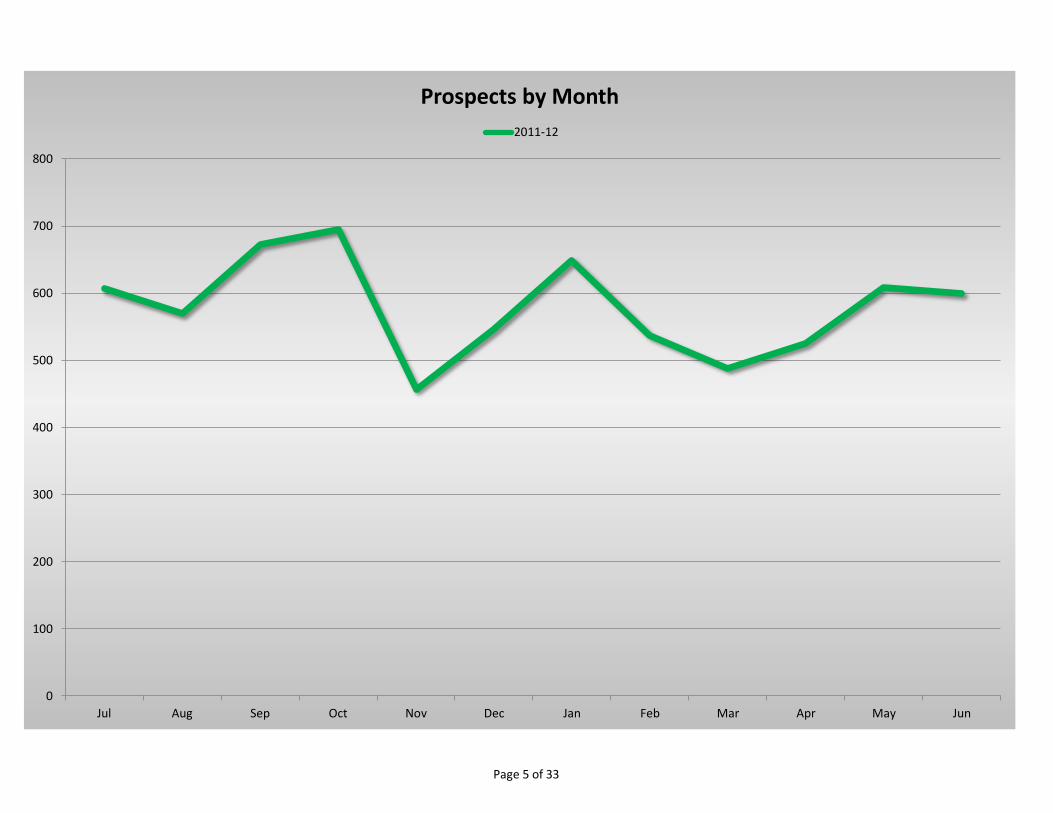
Prospects by Month
2011-12
Page 6 of 33
0
100
200
300
400
500
600
700
800
Jul Aug Sep Oct Nov Dec Jan Feb Mar Apr May Jun
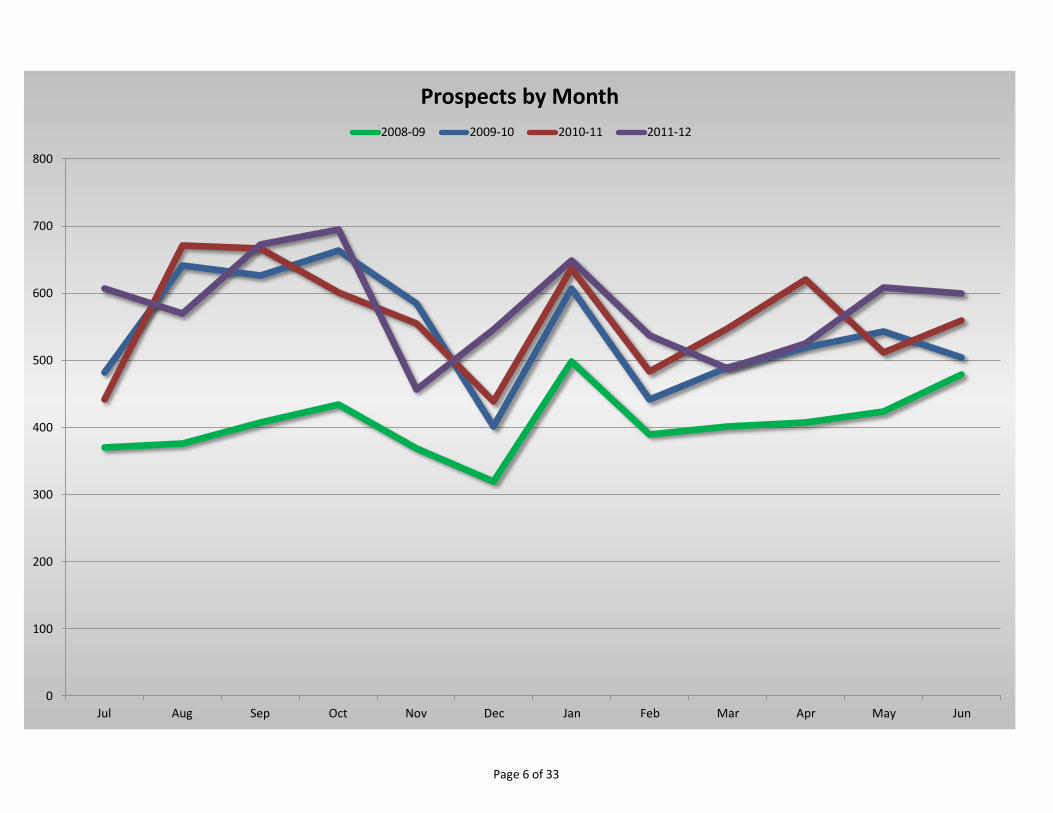
Prospects by Month
2008-09 2009-10 2010-11 2011-12
Page 7 of 33
0
200
400
600
800
1000
1200
Jul Aug Sep Oct Nov Dec Jan Feb Mar Apr May Jun
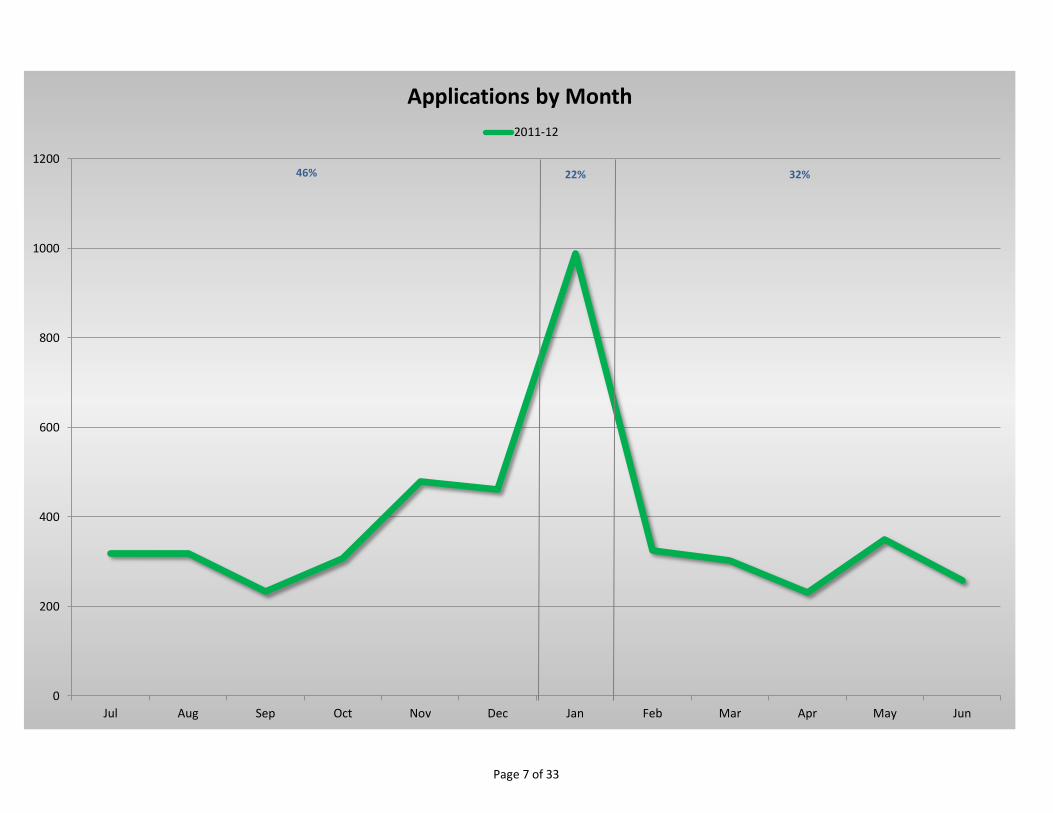
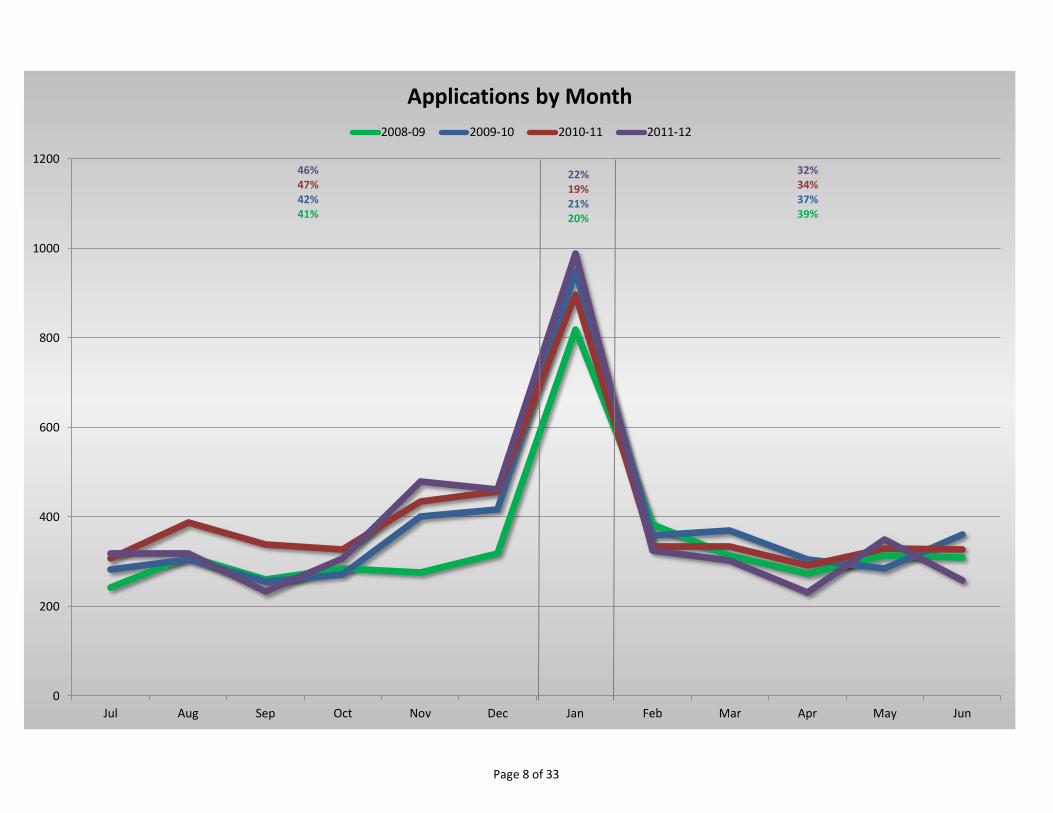
Applications by Month
2011-12
46% 22% 32%
Page 8 of 33
0
200
400
600
800
1000
1200
Jul Aug Sep Oct Nov Dec Jan Feb Mar Apr May Jun
Applications by Month
2008-09 2009-10 2010-11 2011-12
46% 47% 42% 41%
22% 19% 21% 20%
32% 34% 37% 39%
Page 9 of 33
0
500
1000
1500
2000
2500
3000
3500
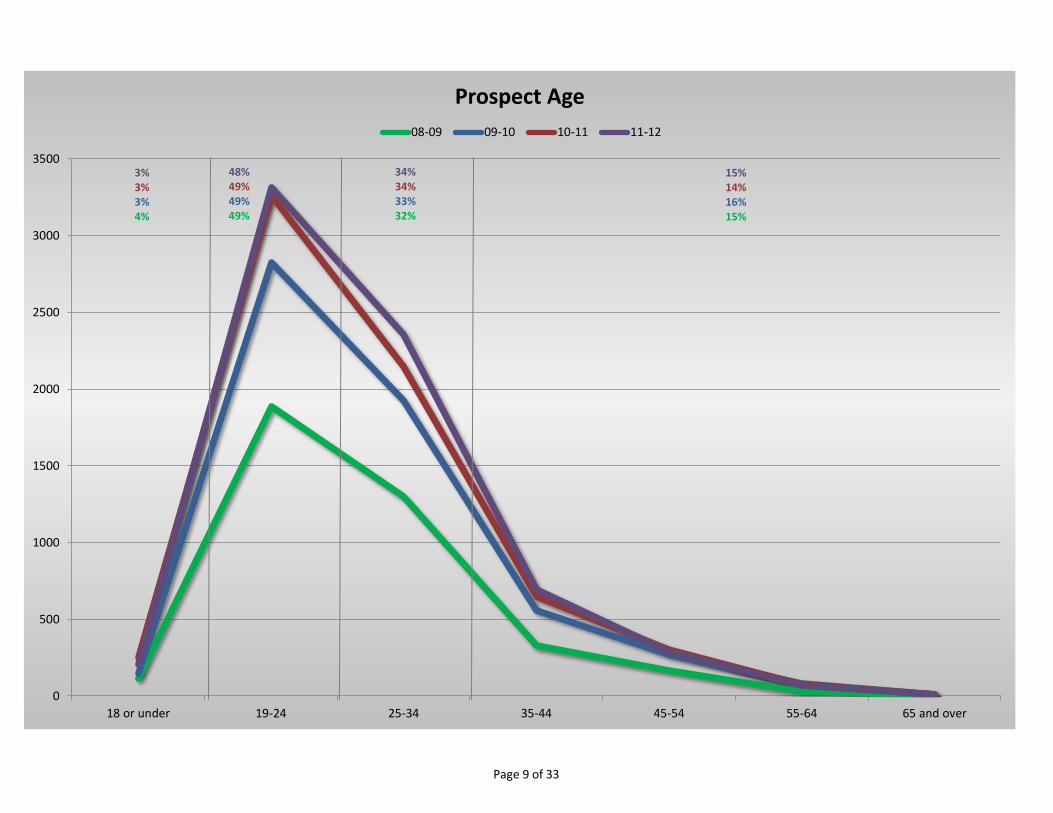
18 or under 19-24 25-34 35-44 45-54 55-64 65 and over
Prospect Age
08-09 09-10 10-11 11-12
3% 3% 3% 4%
48% 49% 49% 49%
34% 34% 33% 32%
15% 14% 16% 15%
Page 10 of 33
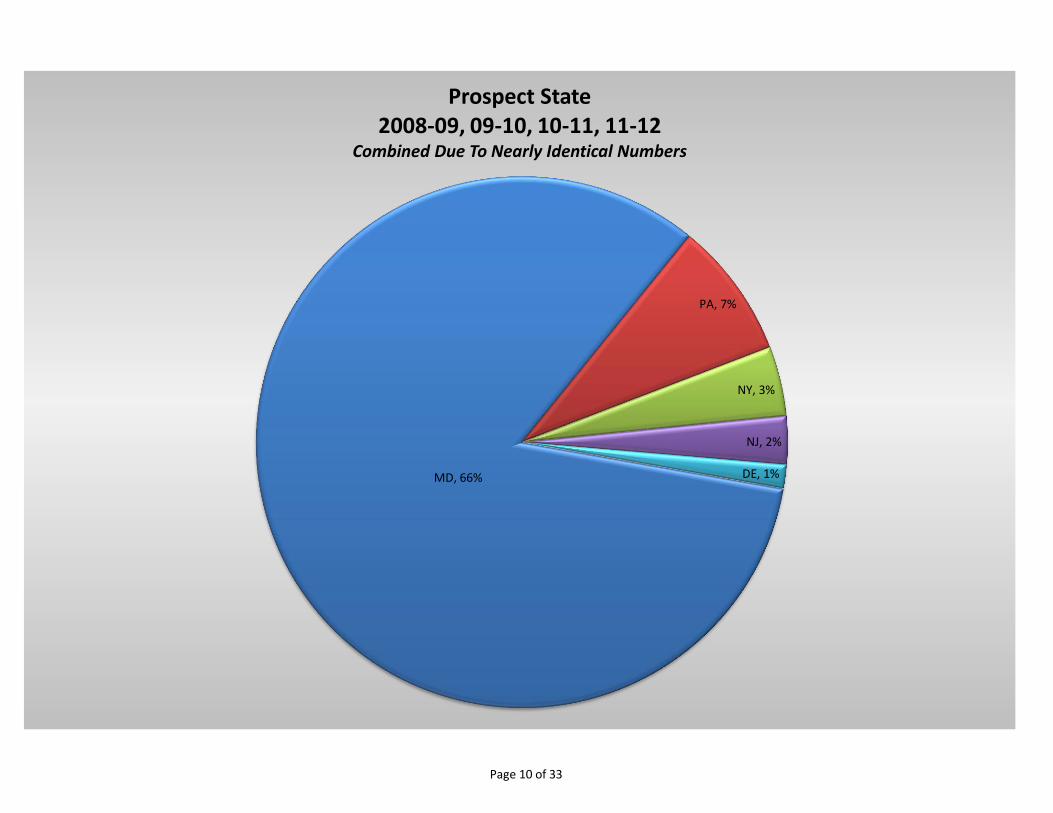
MD, 66%
PA, 7%
NY, 3%
NJ, 2%
DE, 1%
Prospect State 2008-09, 09-10, 10-11, 11-12
Combined Due To Nearly Identical Numbers
Page 11 of 33
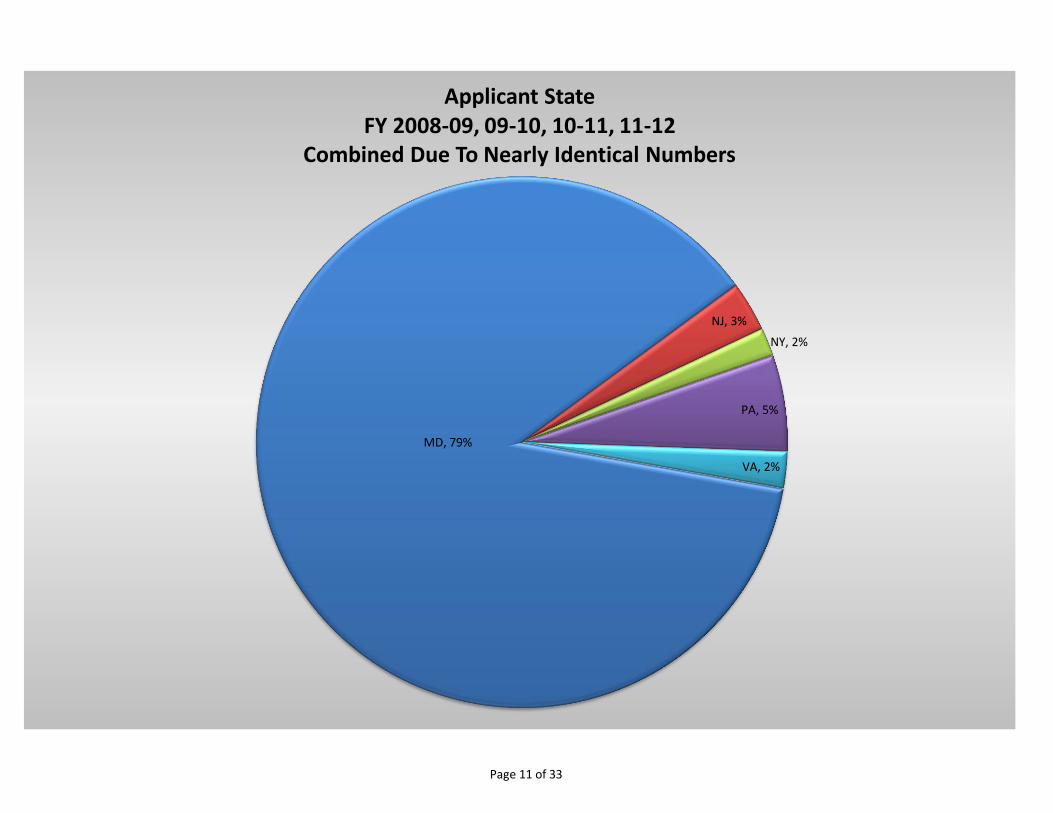
MD, 79%
NJ, 3%
NY, 2%
PA, 5%
VA, 2%
Applicant State FY 2008-09, 09-10, 10-11, 11-12
Combined Due To Nearly Identical Numbers
Page 12 of 33
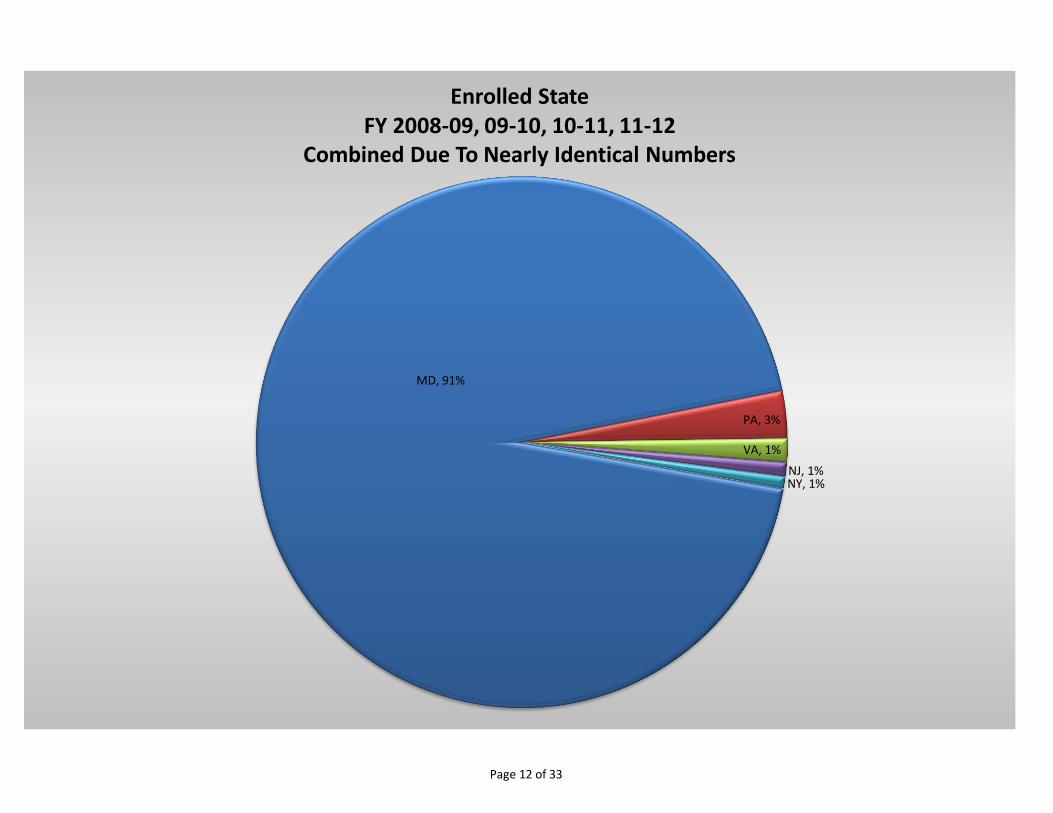
MD, 91%
PA, 3%
VA, 1%
NJ, 1% NY, 1%
Enrolled State FY 2008-09, 09-10, 10-11, 11-12
Combined Due To Nearly Identical Numbers
Page 13 of 33
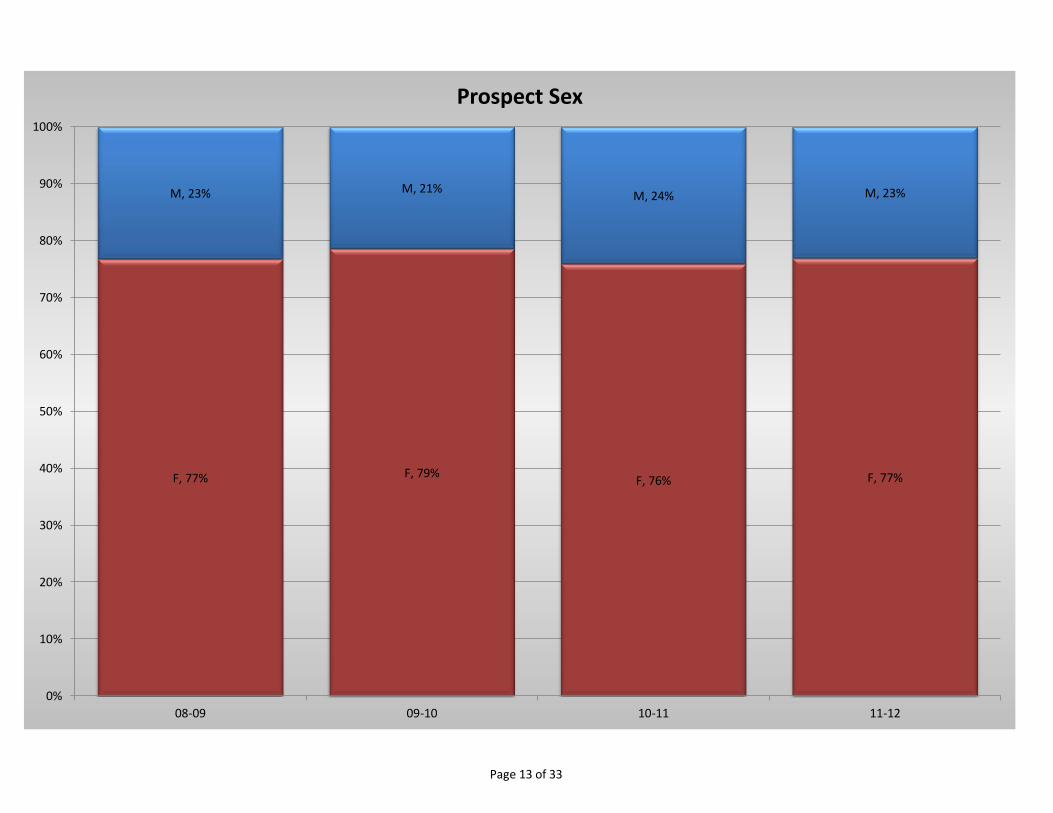
F, 77% F, 79% F, 76% F, 77%
M, 23% M, 21% M, 24% M, 23%
0%
10%
20%
30%
40%
50%
60%
70%
80%
90%
100%
08-09 09-10 10-11 11-12
Prospect Sex
Page 14 of 33
0
500
1000
1500
2000
2500
3000
18 or under 19-24 25-34 35-44 45-54 55-64 65 and over
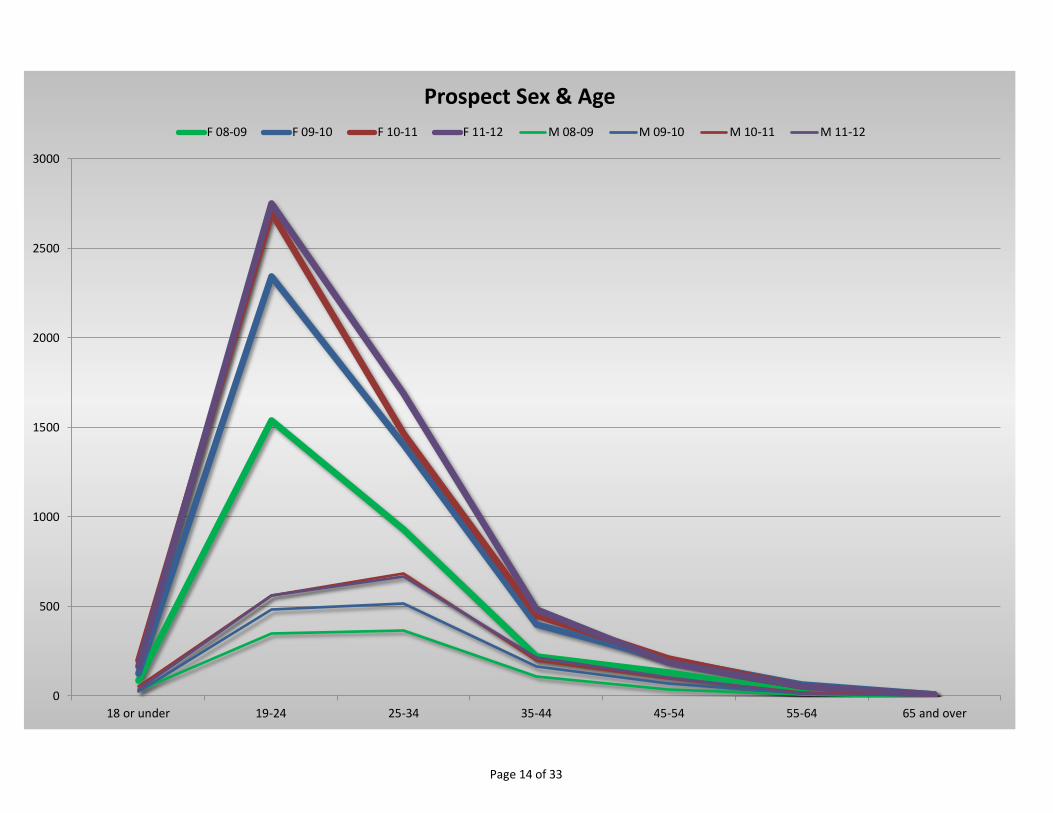
Prospect Sex & Age
F 08-09 F 09-10 F 10-11 F 11-12 M 08-09 M 09-10 M 10-11 M 11-12
Page 15 of 33
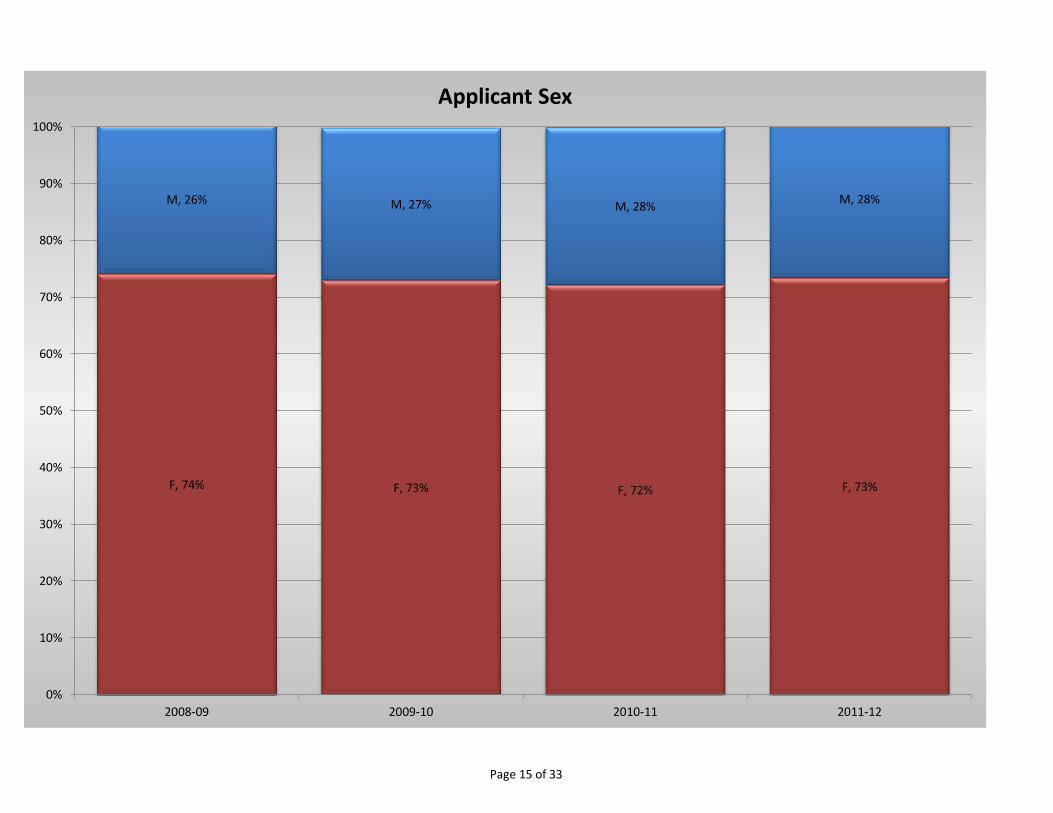
F, 74% F, 73% F, 72% F, 73%
M, 26% M, 27% M, 28% M, 28%
0%
10%
20%
30%
40%
50%
60%
70%
80%
90%
100%
2008-09 2009-10 2010-11 2011-12
Applicant Sex
Page 16 of 33
0
100
200
300
400
500
600
700
17 18 19 20 21 22 23 24 25 26 27 28 29 30 31 32 33 34 35 36 37 38 39 40 41 42 43 44 45 46 47 48 49 50 51 52 53 54 55 56 57 58 59 60 61 62 63 64 65
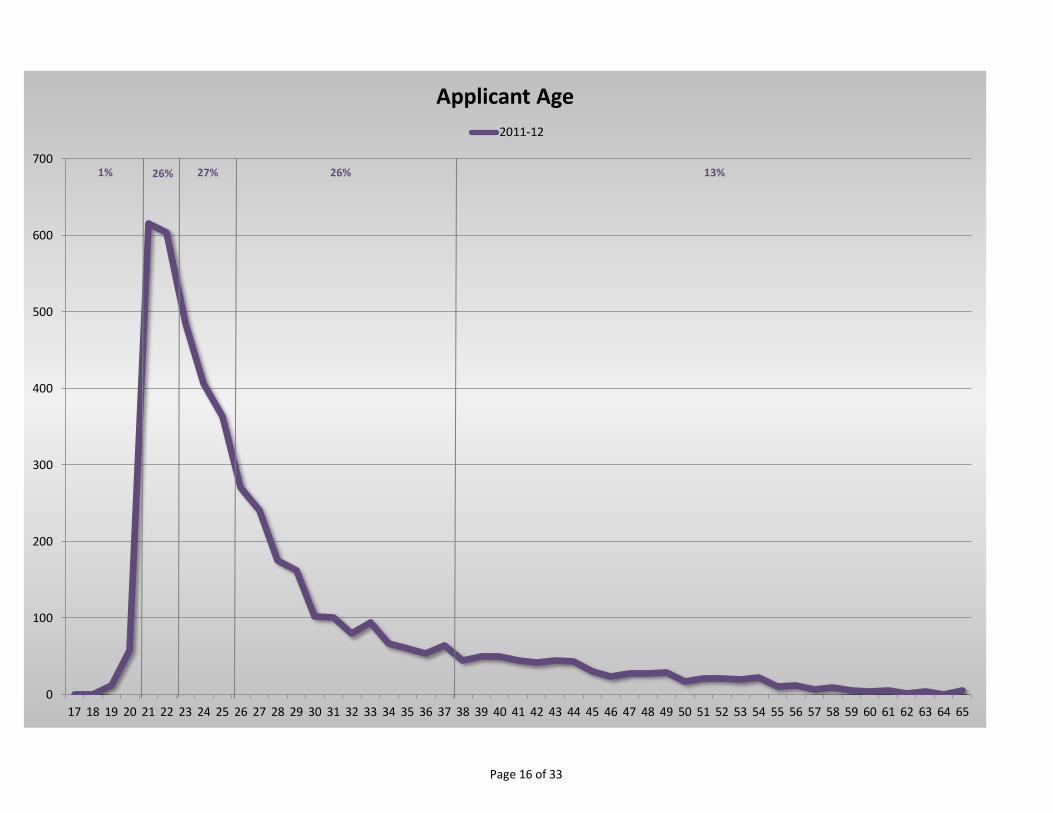
Applicant Age
2011-12
1% 26% 27% 26% 13%
Page 17 of 33
0
100
200
300
400
500
600
700
17 18 19 20 21 22 23 24 25 26 27 28 29 30 31 32 33 34 35 36 37 38 39 40 41 42 43 44 45 46 47 48 49 50 51 52 53 54 55 56 57 58 59 60 61 62 63 64 65
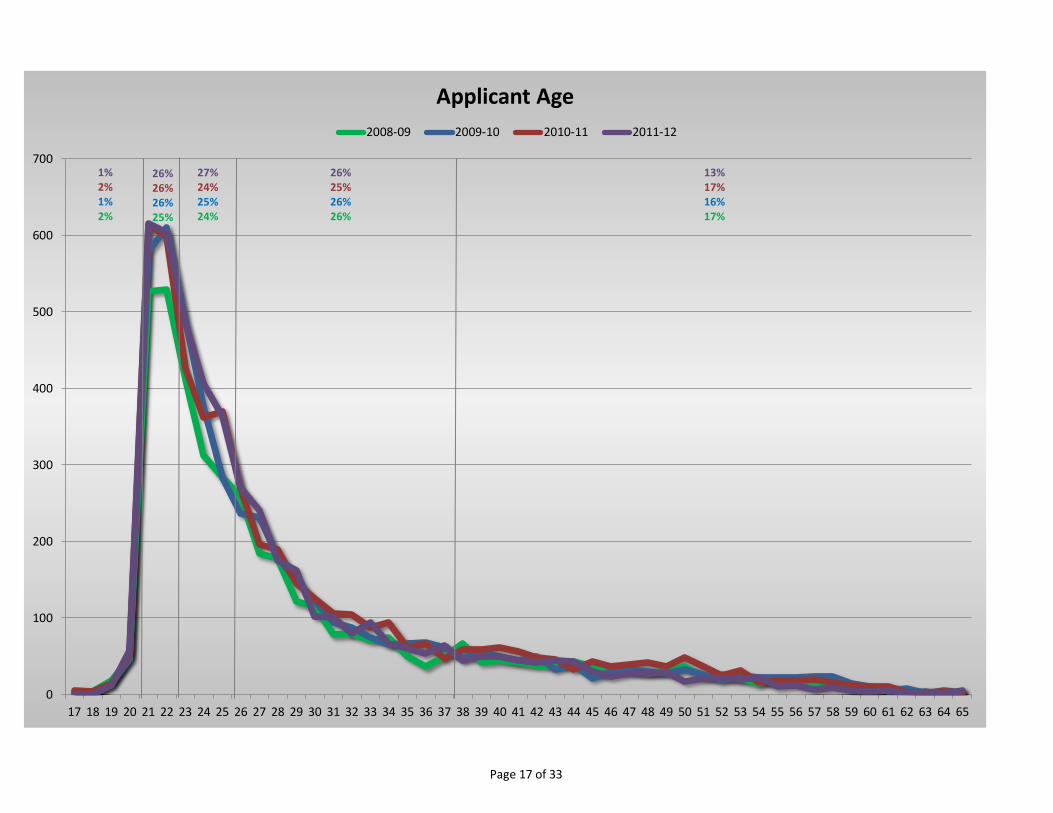
Applicant Age
2008-09 2009-10 2010-11 2011-12
1% 2% 1% 2%
26% 26% 26% 25%
27% 24% 25% 24%
26% 25% 26% 26%
13% 17% 16% 17%
Page 18 of 33
0
100
200
300
400
500
600
17 18 19 20 21 22 23 24 25 26 27 28 29 30 31 32 33 34 35 36 37 38 39 40 41 42 43 44 45 46 47 48 49 50 51 52 53 54 55 56 57 58 59 60 61 62 63 64 65
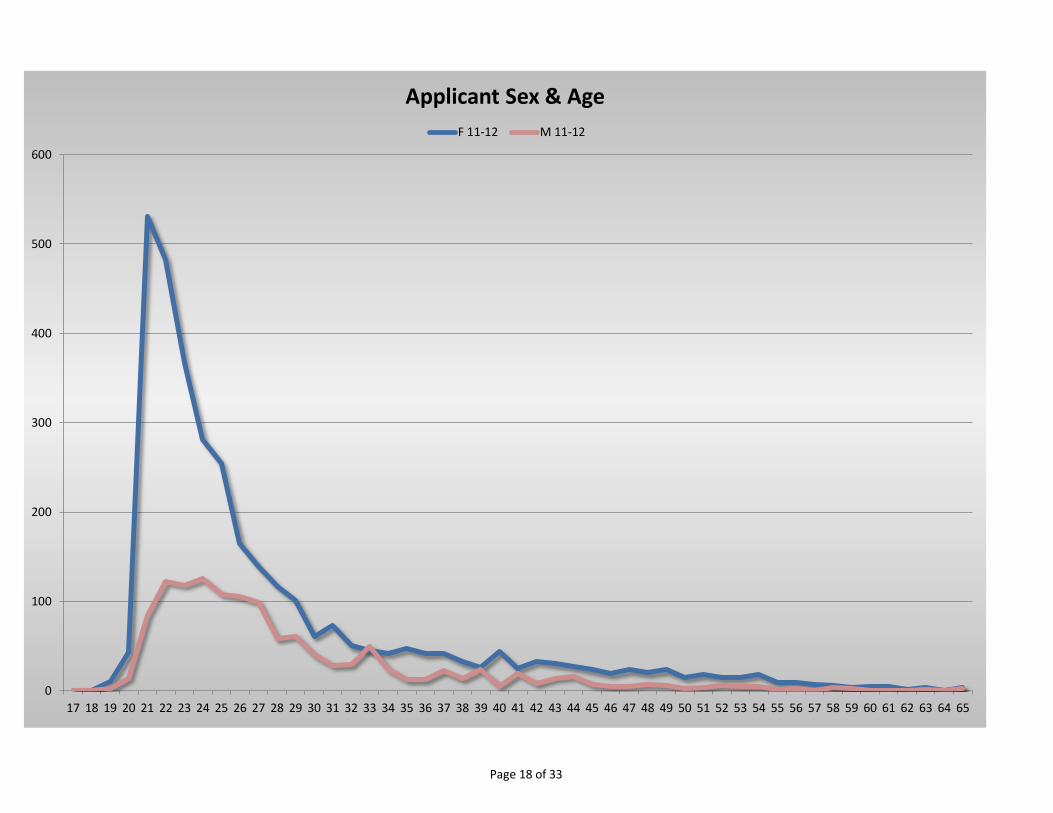
Applicant Sex & Age
F 11-12 M 11-12
Page 19 of 33
0
100
200
300
400
500
600
17 18 19 20 21 22 23 24 25 26 27 28 29 30 31 32 33 34 35 36 37 38 39 40 41 42 43 44 45 46 47 48 49 50 51 52 53 54 55 56 57 58 59 60 61 62 63 64 65
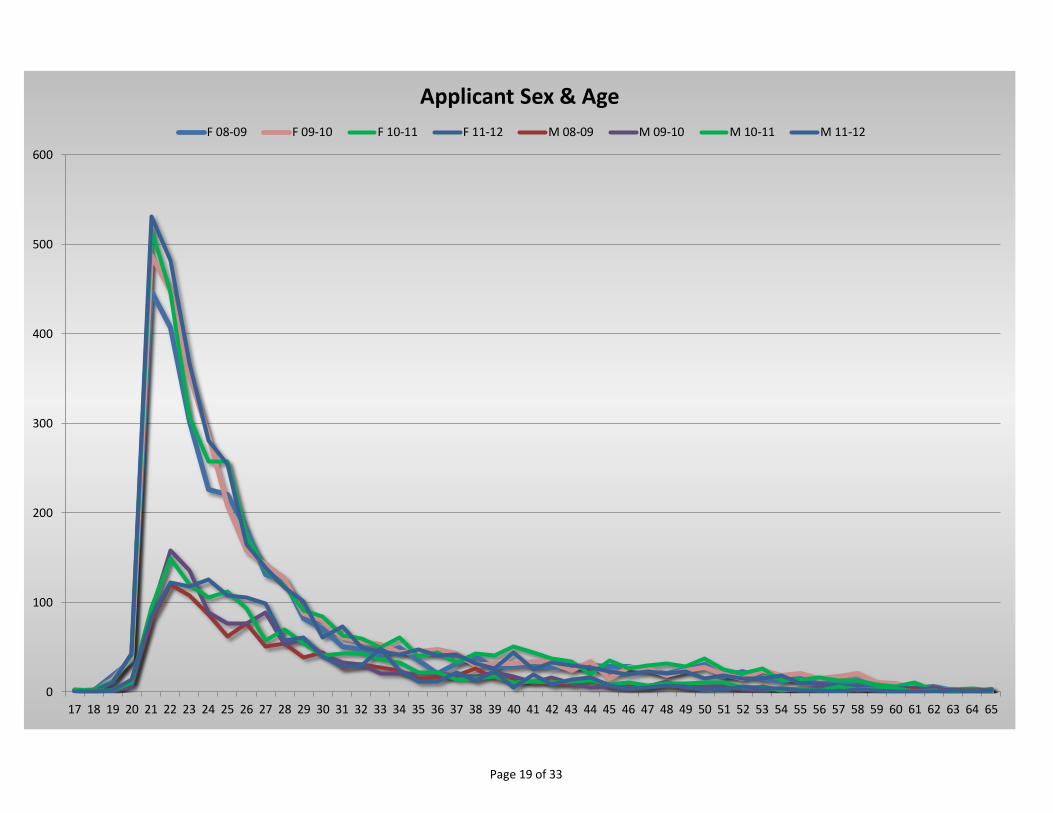
Applicant Sex & Age
F 08-09 F 09-10 F 10-11 F 11-12 M 08-09 M 09-10 M 10-11 M 11-12
Page 20 of 33
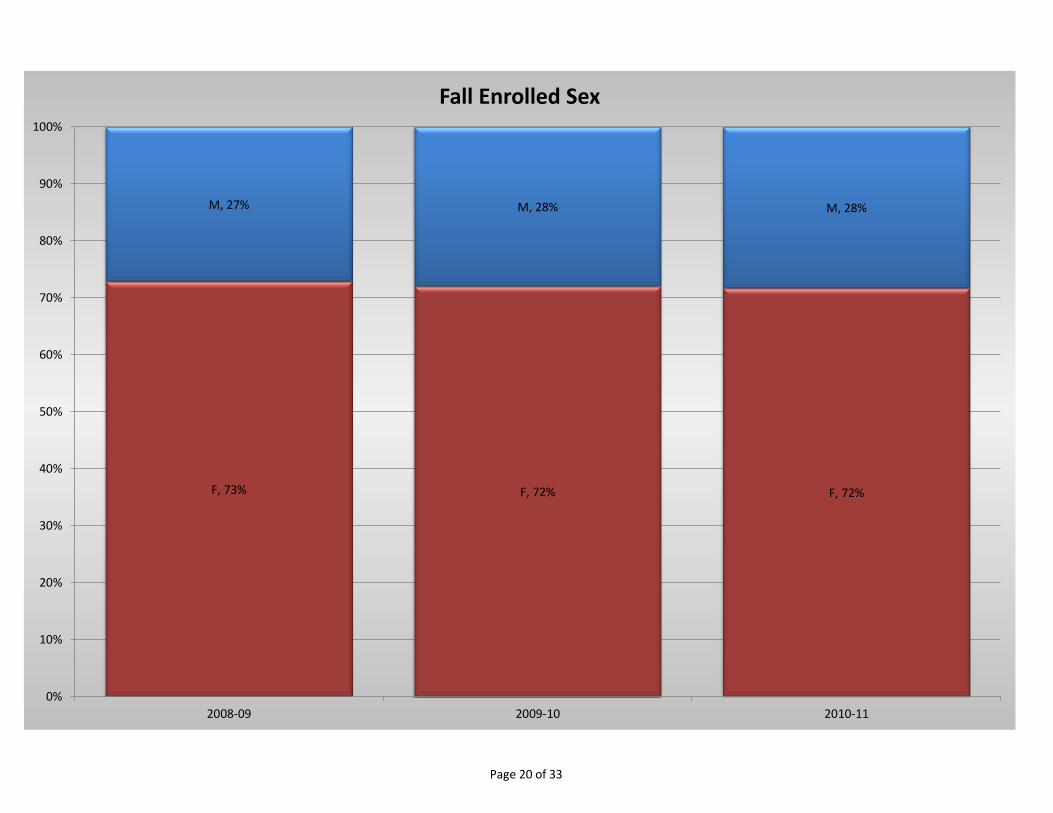
F, 73% F, 72% F, 72%
M, 27% M, 28% M, 28%
0%
10%
20%
30%
40%
50%
60%
70%
80%
90%
100%
2008-09 2009-10 2010-11
Fall Enrolled Sex
Page 21 of 33
0
50
100
150
200
250
300
350
400
450
500
17 18 19 20 21 22 23 24 25 26 27 28 29 30 31 32 33 34 35 36 37 38 39 40 41 42 43 44 45 46 47 48 49 50 51 52 53 54 55 56 57 58 59 60 61 62 63 64 65
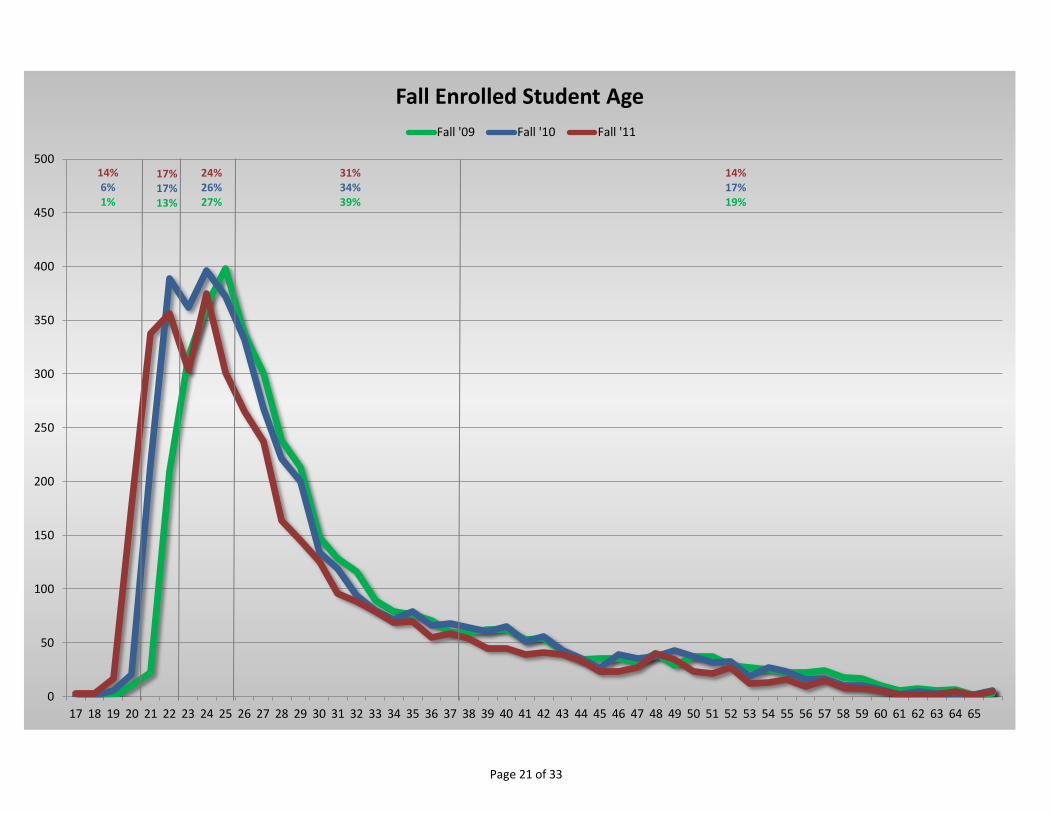
Fall Enrolled Student Age
Fall '09 Fall '10 Fall '11
14% 6% 1%
17% 17% 13%
24% 26% 27%
31% 34% 39%
14% 17% 19%
Page 22 of 33
0
50
100
150
200
250
300
350
16 17 18 19 20 21 22 23 24 25 26 27 28 29 30 31 32 33 34 35 36 37 38 39 40 41 42 43 44 45 46 47 48 49 50 51 52 53 54 55 56 57 58 59 60 61 62 63 64 65
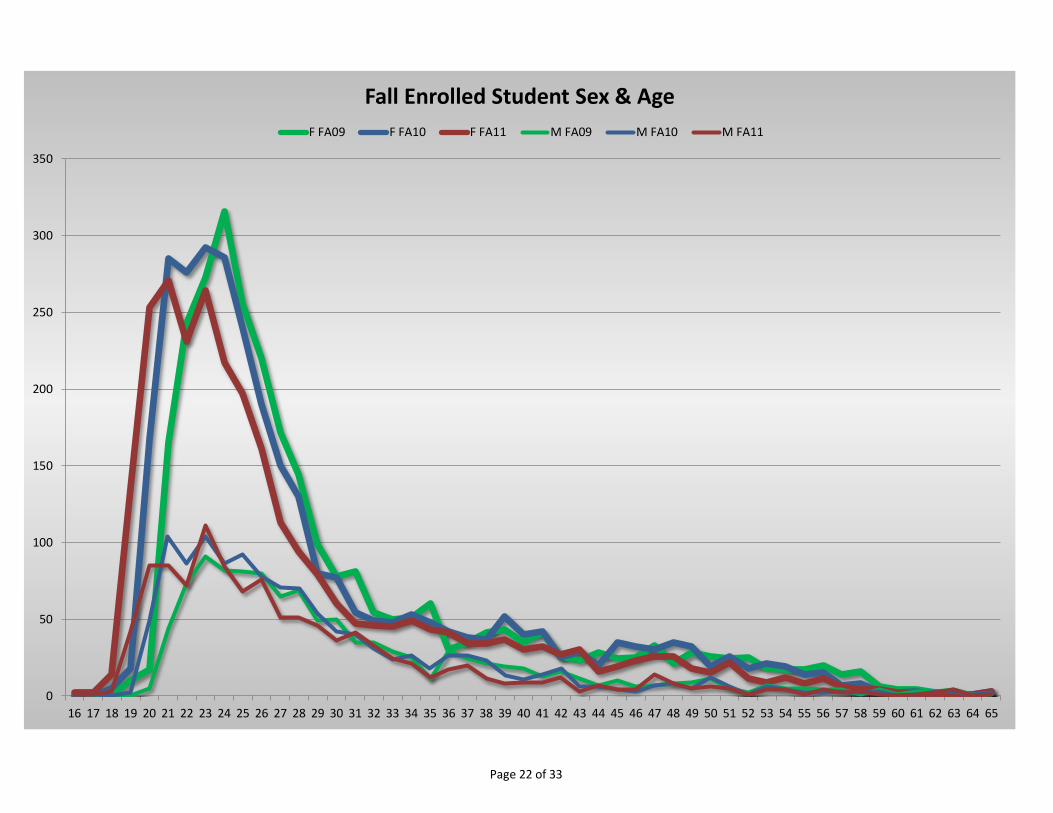
Fall Enrolled Student Sex & Age
F FA09 F FA10 F FA11 M FA09 M FA10 M FA11
Page 23 of 33
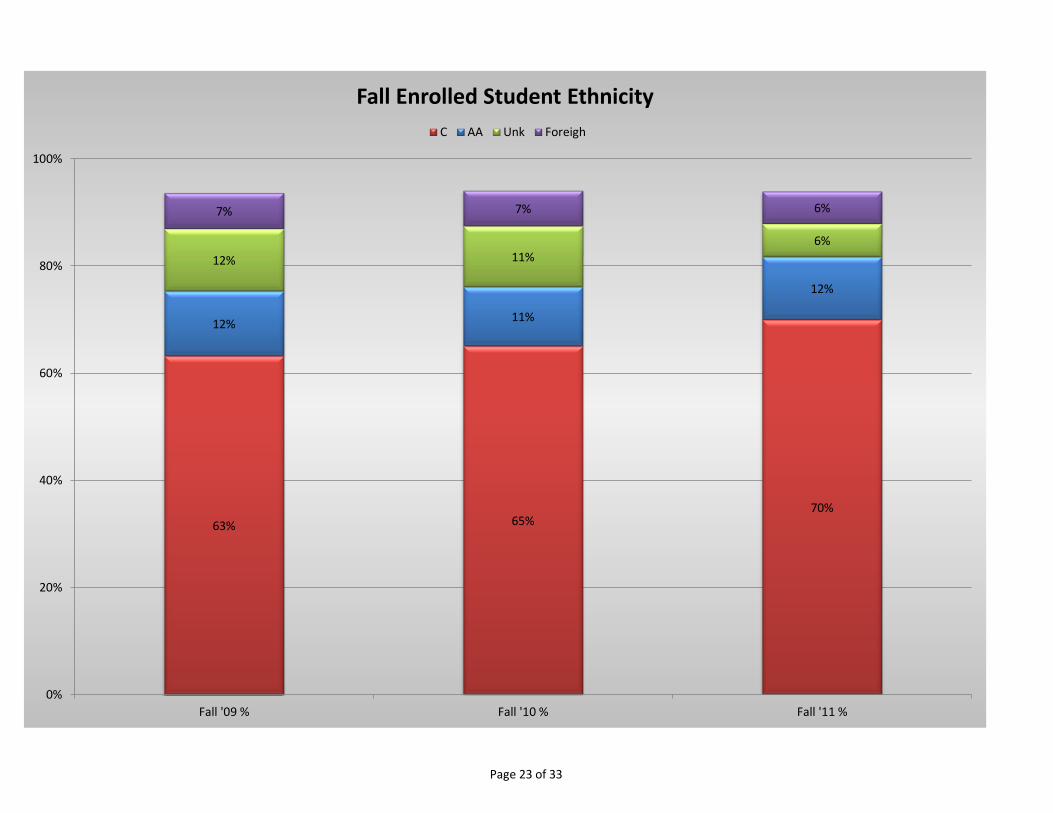
63% 65% 70%
12% 11%
12%
12% 11% 6%
7% 7% 6%
0%
20%
40%
60%
80%
100%
Fall '09 % Fall '10 % Fall '11 %
Fall Enrolled Student Ethnicity
C AA Unk Foreigh
Page 24 of 33
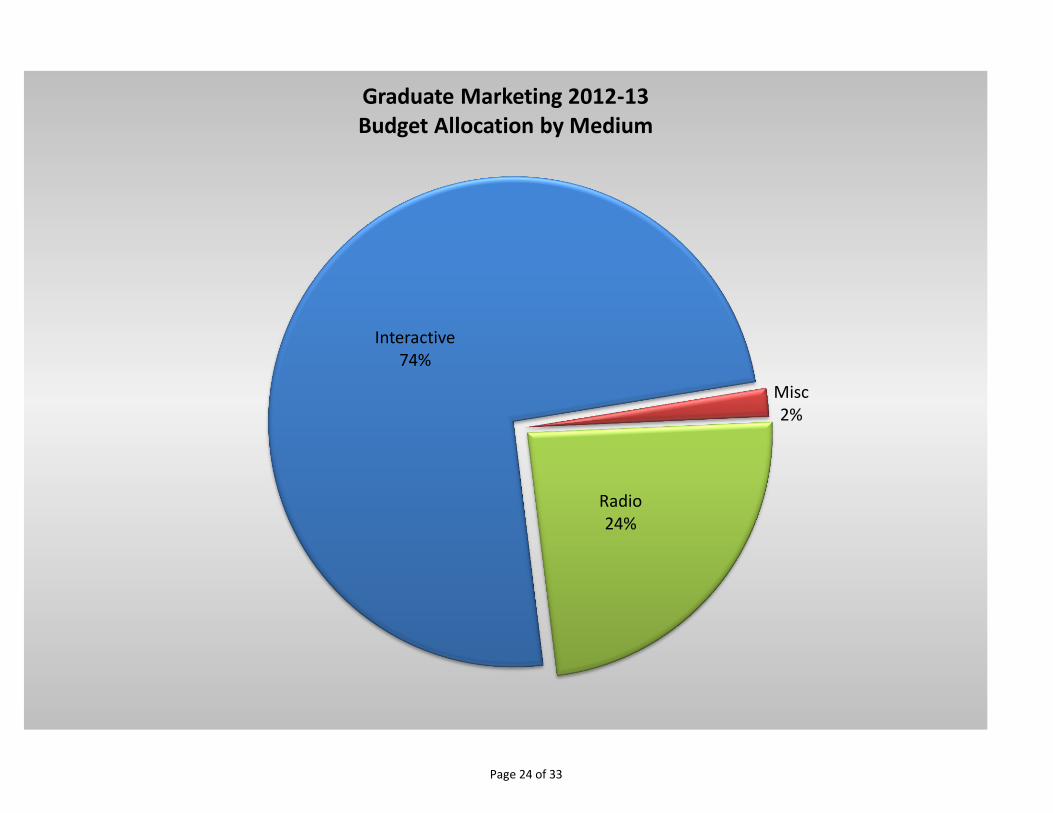
Interactive 74%
Misc 2%
Radio 24%
Graduate Marketing 2012-13 Budget Allocation by Medium
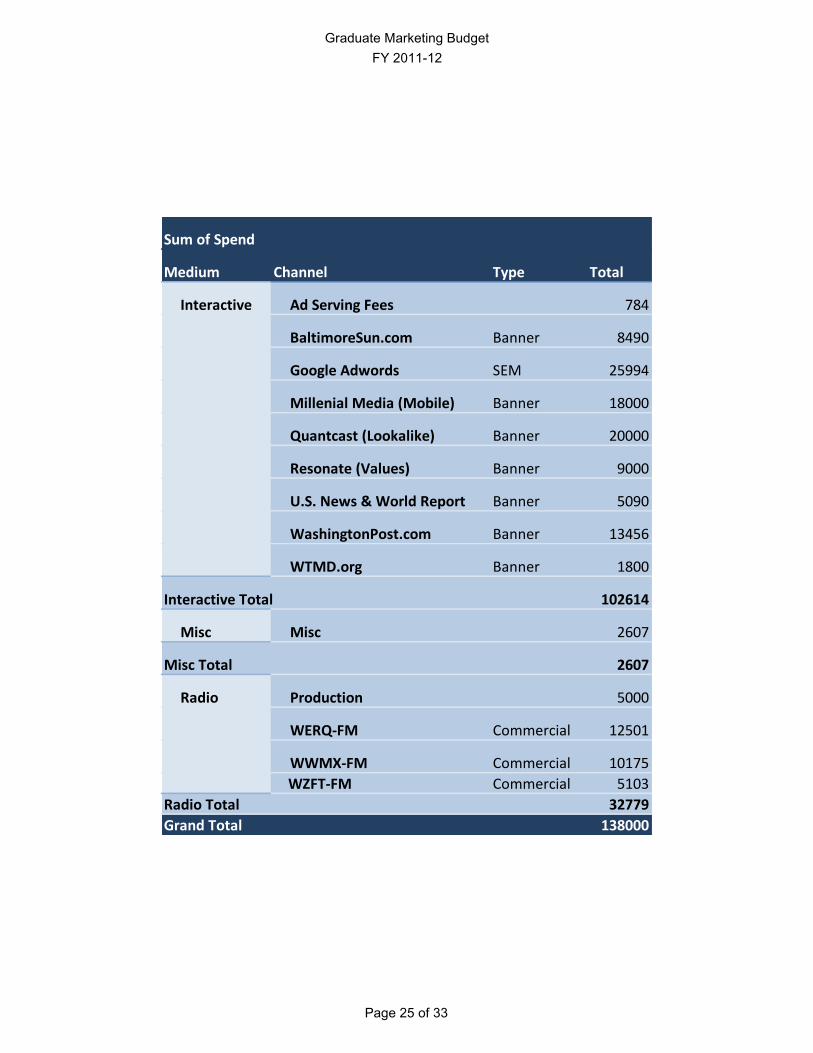
Graduate Marketing Budget
FY 2011-12
Sum of Spend
Medium Channel Type Total
Interactive Ad Serving Fees 784
BaltimoreSun.com Banner 8490
Google Adwords SEM 25994
Millenial Media (Mobile) Banner 18000
Quantcast (Lookalike) Banner 20000
Resonate (Values) Banner 9000
U.S. News & World Report Banner 5090
WashingtonPost.com Banner 13456
WTMD.org Banner 1800
Interactive Total 102614
Misc Misc 2607
Misc Total 2607
Radio Production 5000
WERQ-FM Commercial 12501
WWMX-FM Commercial 10175
WZFT-FM Commercial 5103
Radio Total 32779
Grand Total 138000
Page 25 of 33
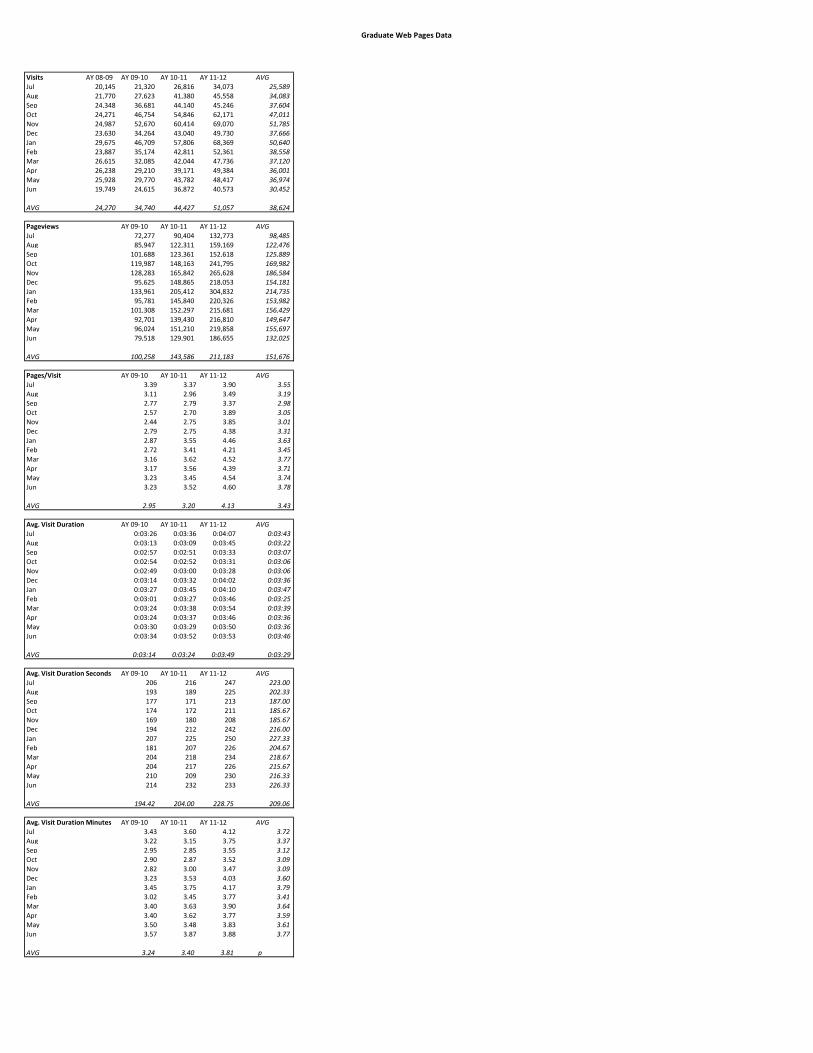
Graduate Web Pages Data
Visits AY 08-09 AY 09-10 AY 10-11 AY 11-12 AVGJul 20,145 21,320 26,816 34,073 25,589 Aug 21,770 27,623 41,380 45,558 34,083 Sep 24,348 36,681 44,140 45,246 37,604 Oct 24,271 46,754 54,846 62,171 47,011 Nov 24,987 52,670 60,414 69,070 51,785 Dec 23,630 34,264 43,040 49,730 37,666 Jan 29,675 46,709 57,806 68,369 50,640 Feb 23,887 35,174 42,811 52,361 38,558 Mar 26,615 32,085 42,044 47,736 37,120 Apr 26,238 29,210 39,171 49,384 36,001
May 25,928 29,770 43,782 48,417 36,974 Jun 19,749 24,615 36,872 40,573 30,452
AVG 24,270 34,740 44,427 51,057 38,624
Pageviews AY 09-10 AY 10-11 AY 11-12 AVGJul 72,277 90,404 132,773 98,485 Aug 85,947 122,311 159,169 122,476 Sep 101,688 123,361 152,618 125,889 Oct 119,987 148,163 241,795 169,982 Nov 128,283 165,842 265,628 186,584 Dec 95,625 148,865 218,053 154,181 Jan 133,961 205,412 304,832 214,735 Feb 95,781 145,840 220,326 153,982 Mar 101,308 152,297 215,681 156,429
Apr 92,701 139,430 216,810 149,647 May 96,024 151,210 219,858 155,697 Jun 79,518 129,901 186,655 132,025
AVG 100,258 143,586 211,183 151,676
Pages/Visit AY 09-10 AY 10-11 AY 11-12 AVGJul 3.39 3.37 3.90 3.55Aug 3.11 2.96 3.49 3.19Sep 2.77 2.79 3.37 2.98Oct 2.57 2.70 3.89 3.05Nov 2.44 2.75 3.85 3.01Dec 2.79 2.75 4.38 3.31Jan 2.87 3.55 4.46 3.63Feb 2.72 3.41 4.21 3.45
Mar 3.16 3.62 4.52 3.77Apr 3.17 3.56 4.39 3.71May 3.23 3.45 4.54 3.74Jun 3.23 3.52 4.60 3.78
AVG 2.95 3.20 4.13 3.43
Avg. Visit Duration AY 09-10 AY 10-11 AY 11-12 AVGJul 0:03:26 0:03:36 0:04:07 0:03:43Aug 0:03:13 0:03:09 0:03:45 0:03:22Sep 0:02:57 0:02:51 0:03:33 0:03:07Oct 0:02:54 0:02:52 0:03:31 0:03:06Nov 0:02:49 0:03:00 0:03:28 0:03:06Dec 0:03:14 0:03:32 0:04:02 0:03:36Jan 0:03:27 0:03:45 0:04:10 0:03:47
Feb 0:03:01 0:03:27 0:03:46 0:03:25Mar 0:03:24 0:03:38 0:03:54 0:03:39Apr 0:03:24 0:03:37 0:03:46 0:03:36May 0:03:30 0:03:29 0:03:50 0:03:36Jun 0:03:34 0:03:52 0:03:53 0:03:46
AVG 0:03:14 0:03:24 0:03:49 0:03:29
Avg. Visit Duration Seconds AY 09-10 AY 10-11 AY 11-12 AVGJul 206 216 247 223.00 Aug 193 189 225 202.33 Sep 177 171 213 187.00
Oct 174 172 211 185.67 Nov 169 180 208 185.67 Dec 194 212 242 216.00
Jan 207 225 250 227.33 Feb 181 207 226 204.67 Mar 204 218 234 218.67 Apr 204 217 226 215.67 May 210 209 230 216.33 Jun 214 232 233 226.33
AVG 194.42 204.00 228.75 209.06
Avg. Visit Duration Minutes AY 09-10 AY 10-11 AY 11-12 AVGJul 3.43 3.60 4.12 3.72 Aug 3.22 3.15 3.75 3.37 Sep 2.95 2.85 3.55 3.12 Oct 2.90 2.87 3.52 3.09 Nov 2.82 3.00 3.47 3.09
Dec 3.23 3.53 4.03 3.60
Jan 3.45 3.75 4.17 3.79 Feb 3.02 3.45 3.77 3.41 Mar 3.40 3.63 3.90 3.64 Apr 3.40 3.62 3.77 3.59 May 3.50 3.48 3.83 3.61 Jun 3.57 3.87 3.88 3.77
AVG 3.24 3.40 3.81 p
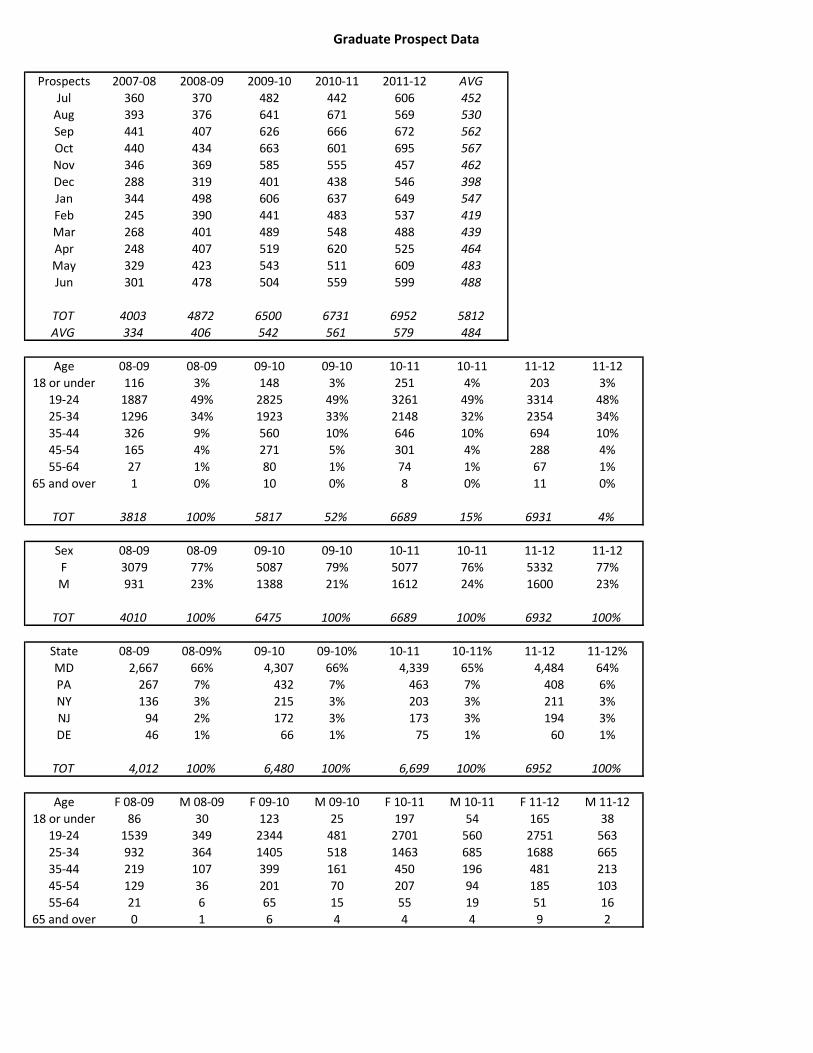
Graduate Prospect Data
Prospects 2007-08 2008-09 2009-10 2010-11 2011-12 AVG
Jul 360 370 482 442 606 452
Aug 393 376 641 671 569 530
Sep 441 407 626 666 672 562
Oct 440 434 663 601 695 567
Nov 346 369 585 555 457 462
Dec 288 319 401 438 546 398
Jan 344 498 606 637 649 547
Feb 245 390 441 483 537 419
Mar 268 401 489 548 488 439
Apr 248 407 519 620 525 464
May 329 423 543 511 609 483
Jun 301 478 504 559 599 488
TOT 4003 4872 6500 6731 6952 5812
AVG 334 406 542 561 579 484
Age 08-09 08-09 09-10 09-10 10-11 10-11 11-12 11-12
18 or under 116 3% 148 3% 251 4% 203 3%
19-24 1887 49% 2825 49% 3261 49% 3314 48%
25-34 1296 34% 1923 33% 2148 32% 2354 34%
35-44 326 9% 560 10% 646 10% 694 10%
45-54 165 4% 271 5% 301 4% 288 4%
55-64 27 1% 80 1% 74 1% 67 1%
65 and over 1 0% 10 0% 8 0% 11 0%
TOT 3818 100% 5817 52% 6689 15% 6931 4%
Sex 08-09 08-09 09-10 09-10 10-11 10-11 11-12 11-12
F 3079 77% 5087 79% 5077 76% 5332 77%
M 931 23% 1388 21% 1612 24% 1600 23%
TOT 4010 100% 6475 100% 6689 100% 6932 100%
State 08-09 08-09% 09-10 09-10% 10-11 10-11% 11-12 11-12%
MD 2,667 66% 4,307 66% 4,339 65% 4,484 64%
PA 267 7% 432 7% 463 7% 408 6%
NY 136 3% 215 3% 203 3% 211 3%
NJ 94 2% 172 3% 173 3% 194 3%
DE 46 1% 66 1% 75 1% 60 1%
TOT 4,012 100% 6,480 100% 6,699 100% 6952 100%
Age F 08-09 M 08-09 F 09-10 M 09-10 F 10-11 M 10-11 F 11-12 M 11-12
18 or under 86 30 123 25 197 54 165 38
19-24 1539 349 2344 481 2701 560 2751 563
25-34 932 364 1405 518 1463 685 1688 665
35-44 219 107 399 161 450 196 481 213
45-54 129 36 201 70 207 94 185 103
55-64 21 6 65 15 55 19 51 16
65 and over 0 1 6 4 4 4 9 2
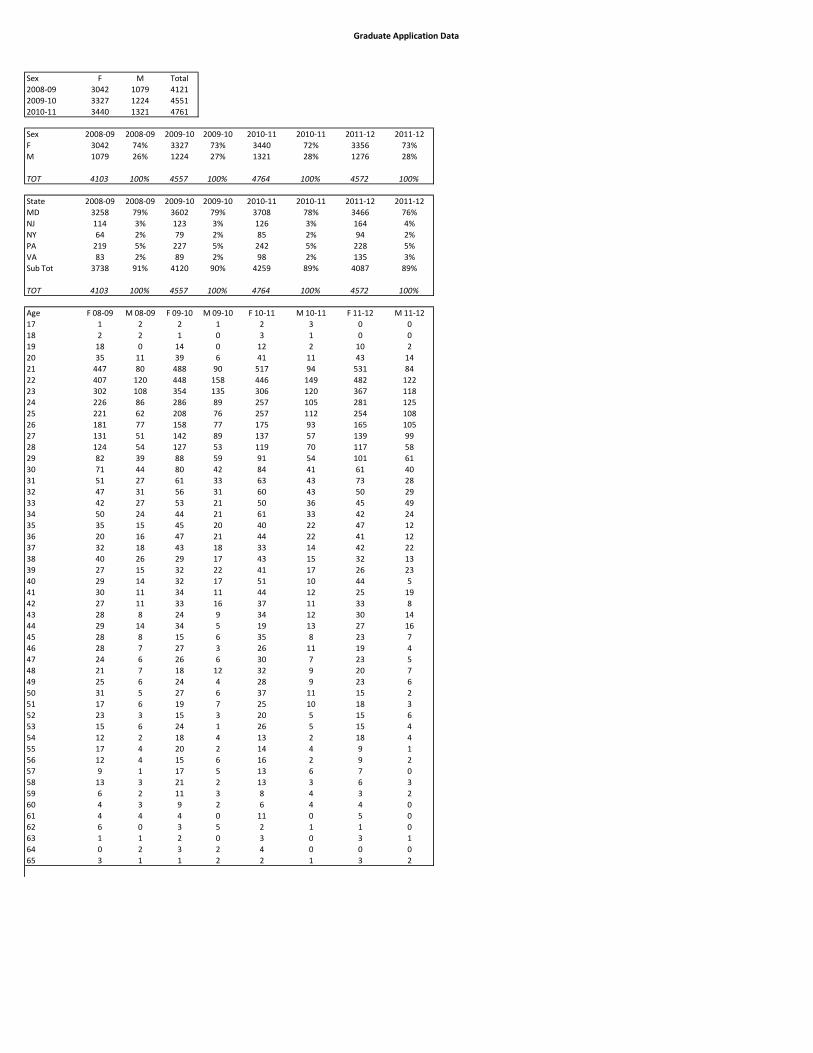
Graduate Application Data
Sex F M Total
2008-09 3042 1079 4121
2009-10 3327 1224 4551
2010-11 3440 1321 4761
Sex 2008-09 2008-09 2009-10 2009-10 2010-11 2010-11 2011-12 2011-12
F 3042 74% 3327 73% 3440 72% 3356 73%
M 1079 26% 1224 27% 1321 28% 1276 28%
TOT 4103 100% 4557 100% 4764 100% 4572 100%
State 2008-09 2008-09 2009-10 2009-10 2010-11 2010-11 2011-12 2011-12
MD 3258 79% 3602 79% 3708 78% 3466 76%
NJ 114 3% 123 3% 126 3% 164 4%
NY 64 2% 79 2% 85 2% 94 2%
PA 219 5% 227 5% 242 5% 228 5%
VA 83 2% 89 2% 98 2% 135 3%
Sub Tot 3738 91% 4120 90% 4259 89% 4087 89%
TOT 4103 100% 4557 100% 4764 100% 4572 100%
Age F 08-09 M 08-09 F 09-10 M 09-10 F 10-11 M 10-11 F 11-12 M 11-12
17 1 2 2 1 2 3 0 0
18 2 2 1 0 3 1 0 0
19 18 0 14 0 12 2 10 2
20 35 11 39 6 41 11 43 14
21 447 80 488 90 517 94 531 84
22 407 120 448 158 446 149 482 122
23 302 108 354 135 306 120 367 118
24 226 86 286 89 257 105 281 125
25 221 62 208 76 257 112 254 108
26 181 77 158 77 175 93 165 105
27 131 51 142 89 137 57 139 99
28 124 54 127 53 119 70 117 58
29 82 39 88 59 91 54 101 61
30 71 44 80 42 84 41 61 40
31 51 27 61 33 63 43 73 28
32 47 31 56 31 60 43 50 29
33 42 27 53 21 50 36 45 49
34 50 24 44 21 61 33 42 24
35 35 15 45 20 40 22 47 12
36 20 16 47 21 44 22 41 12
37 32 18 43 18 33 14 42 22
38 40 26 29 17 43 15 32 13
39 27 15 32 22 41 17 26 23
40 29 14 32 17 51 10 44 5
41 30 11 34 11 44 12 25 19
42 27 11 33 16 37 11 33 8
43 28 8 24 9 34 12 30 14
44 29 14 34 5 19 13 27 16
45 28 8 15 6 35 8 23 7
46 28 7 27 3 26 11 19 4
47 24 6 26 6 30 7 23 5
48 21 7 18 12 32 9 20 7
49 25 6 24 4 28 9 23 6
50 31 5 27 6 37 11 15 2
51 17 6 19 7 25 10 18 3
52 23 3 15 3 20 5 15 6
53 15 6 24 1 26 5 15 4
54 12 2 18 4 13 2 18 4
55 17 4 20 2 14 4 9 1
56 12 4 15 6 16 2 9 2
57 9 1 17 5 13 6 7 0
58 13 3 21 2 13 3 6 3
59 6 2 11 3 8 4 3 2
60 4 3 9 2 6 4 4 0
61 4 4 4 0 11 0 5 0
62 6 0 3 5 2 1 1 0
63 1 1 2 0 3 0 3 1
64 0 2 3 2 4 0 0 0
65 3 1 1 2 2 1 3 2
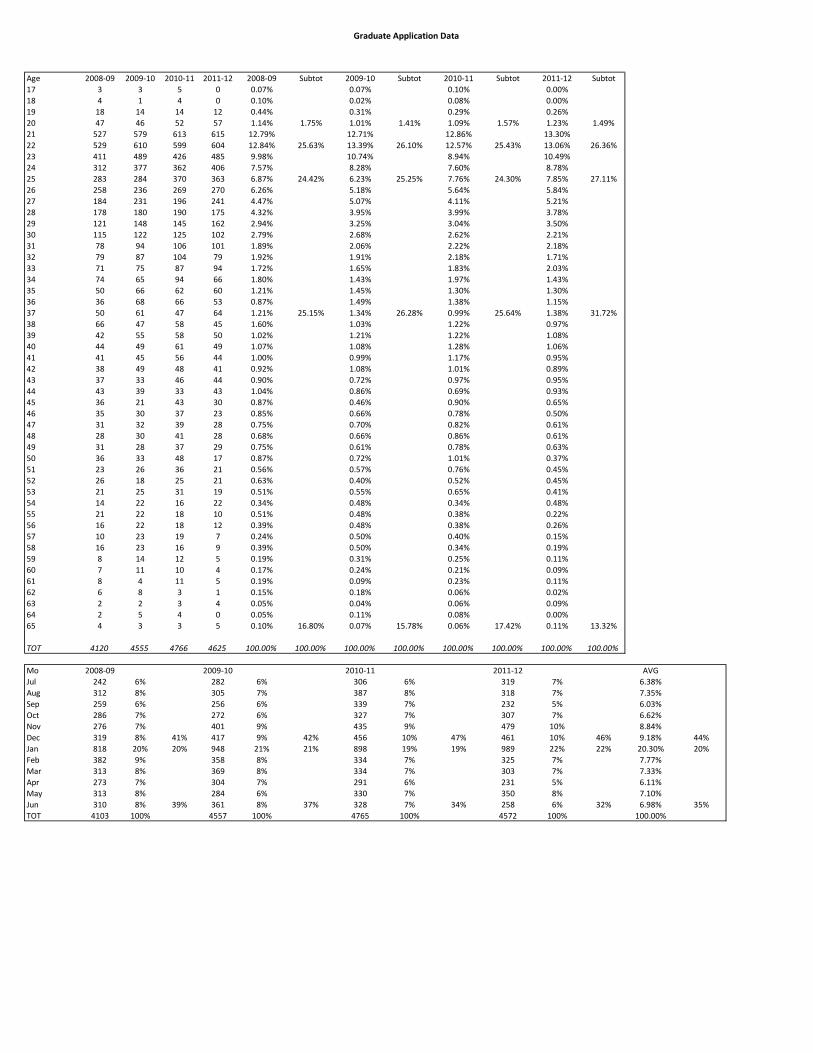
Graduate Application Data
Age 2008-09 2009-10 2010-11 2011-12 2008-09 Subtot 2009-10 Subtot 2010-11 Subtot 2011-12 Subtot
17 3 3 5 0 0.07% 0.07% 0.10% 0.00%
18 4 1 4 0 0.10% 0.02% 0.08% 0.00%
19 18 14 14 12 0.44% 0.31% 0.29% 0.26%
20 47 46 52 57 1.14% 1.75% 1.01% 1.41% 1.09% 1.57% 1.23% 1.49%
21 527 579 613 615 12.79% 12.71% 12.86% 13.30%
22 529 610 599 604 12.84% 25.63% 13.39% 26.10% 12.57% 25.43% 13.06% 26.36%
23 411 489 426 485 9.98% 10.74% 8.94% 10.49%
24 312 377 362 406 7.57% 8.28% 7.60% 8.78%
25 283 284 370 363 6.87% 24.42% 6.23% 25.25% 7.76% 24.30% 7.85% 27.11%
26 258 236 269 270 6.26% 5.18% 5.64% 5.84%
27 184 231 196 241 4.47% 5.07% 4.11% 5.21%
28 178 180 190 175 4.32% 3.95% 3.99% 3.78%
29 121 148 145 162 2.94% 3.25% 3.04% 3.50%
30 115 122 125 102 2.79% 2.68% 2.62% 2.21%
31 78 94 106 101 1.89% 2.06% 2.22% 2.18%
32 79 87 104 79 1.92% 1.91% 2.18% 1.71%
33 71 75 87 94 1.72% 1.65% 1.83% 2.03%
34 74 65 94 66 1.80% 1.43% 1.97% 1.43%
35 50 66 62 60 1.21% 1.45% 1.30% 1.30%
36 36 68 66 53 0.87% 1.49% 1.38% 1.15%
37 50 61 47 64 1.21% 25.15% 1.34% 26.28% 0.99% 25.64% 1.38% 31.72%
38 66 47 58 45 1.60% 1.03% 1.22% 0.97%
39 42 55 58 50 1.02% 1.21% 1.22% 1.08%
40 44 49 61 49 1.07% 1.08% 1.28% 1.06%
41 41 45 56 44 1.00% 0.99% 1.17% 0.95%
42 38 49 48 41 0.92% 1.08% 1.01% 0.89%
43 37 33 46 44 0.90% 0.72% 0.97% 0.95%
44 43 39 33 43 1.04% 0.86% 0.69% 0.93%
45 36 21 43 30 0.87% 0.46% 0.90% 0.65%
46 35 30 37 23 0.85% 0.66% 0.78% 0.50%
47 31 32 39 28 0.75% 0.70% 0.82% 0.61%
48 28 30 41 28 0.68% 0.66% 0.86% 0.61%
49 31 28 37 29 0.75% 0.61% 0.78% 0.63%
50 36 33 48 17 0.87% 0.72% 1.01% 0.37%
51 23 26 36 21 0.56% 0.57% 0.76% 0.45%
52 26 18 25 21 0.63% 0.40% 0.52% 0.45%
53 21 25 31 19 0.51% 0.55% 0.65% 0.41%
54 14 22 16 22 0.34% 0.48% 0.34% 0.48%
55 21 22 18 10 0.51% 0.48% 0.38% 0.22%
56 16 22 18 12 0.39% 0.48% 0.38% 0.26%
57 10 23 19 7 0.24% 0.50% 0.40% 0.15%
58 16 23 16 9 0.39% 0.50% 0.34% 0.19%
59 8 14 12 5 0.19% 0.31% 0.25% 0.11%
60 7 11 10 4 0.17% 0.24% 0.21% 0.09%
61 8 4 11 5 0.19% 0.09% 0.23% 0.11%
62 6 8 3 1 0.15% 0.18% 0.06% 0.02%
63 2 2 3 4 0.05% 0.04% 0.06% 0.09%
64 2 5 4 0 0.05% 0.11% 0.08% 0.00%
65 4 3 3 5 0.10% 16.80% 0.07% 15.78% 0.06% 17.42% 0.11% 13.32%
TOT 4120 4555 4766 4625 100.00% 100.00% 100.00% 100.00% 100.00% 100.00% 100.00% 100.00%
Mo 2008-09 2009-10 2010-11 2011-12 AVG
Jul 242 6% 282 6% 306 6% 319 7% 6.38%
Aug 312 8% 305 7% 387 8% 318 7% 7.35%
Sep 259 6% 256 6% 339 7% 232 5% 6.03%
Oct 286 7% 272 6% 327 7% 307 7% 6.62%
Nov 276 7% 401 9% 435 9% 479 10% 8.84%
Dec 319 8% 41% 417 9% 42% 456 10% 47% 461 10% 46% 9.18% 44%
Jan 818 20% 20% 948 21% 21% 898 19% 19% 989 22% 22% 20.30% 20%
Feb 382 9% 358 8% 334 7% 325 7% 7.77%
Mar 313 8% 369 8% 334 7% 303 7% 7.33%
Apr 273 7% 304 7% 291 6% 231 5% 6.11%
May 313 8% 284 6% 330 7% 350 8% 7.10%
Jun 310 8% 39% 361 8% 37% 328 7% 34% 258 6% 32% 6.98% 35%
TOT 4103 100% 4557 100% 4765 100% 4572 100% 100.00%
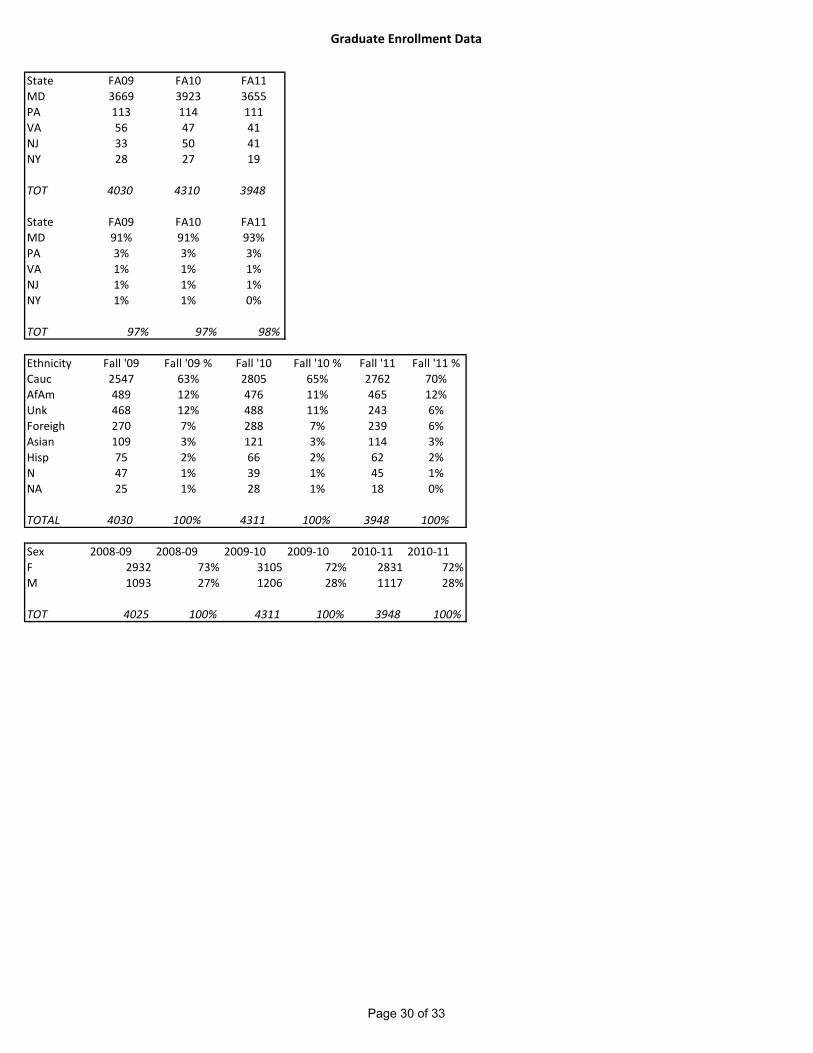
Graduate Enrollment Data
State FA09 FA10 FA11
MD 3669 3923 3655
PA 113 114 111
VA 56 47 41
NJ 33 50 41
NY 28 27 19
TOT 4030 4310 3948
State FA09 FA10 FA11
MD 91% 91% 93%
PA 3% 3% 3%
VA 1% 1% 1%
NJ 1% 1% 1%
NY 1% 1% 0%
TOT 97% 97% 98%
Ethnicity Fall '09 Fall '09 % Fall '10 Fall '10 % Fall '11 Fall '11 %
Cauc 2547 63% 2805 65% 2762 70%
AfAm 489 12% 476 11% 465 12%
Unk 468 12% 488 11% 243 6%
Foreigh 270 7% 288 7% 239 6%
Asian 109 3% 121 3% 114 3%
Hisp 75 2% 66 2% 62 2%
N 47 1% 39 1% 45 1%
NA 25 1% 28 1% 18 0%
TOTAL 4030 100% 4311 100% 3948 100%
Sex 2008-09 2008-09 2009-10 2009-10 2010-11 2010-11
F 2932 73% 3105 72% 2831 72%
M 1093 27% 1206 28% 1117 28%
TOT 4025 100% 4311 100% 3948 100%
Page 30 of 33
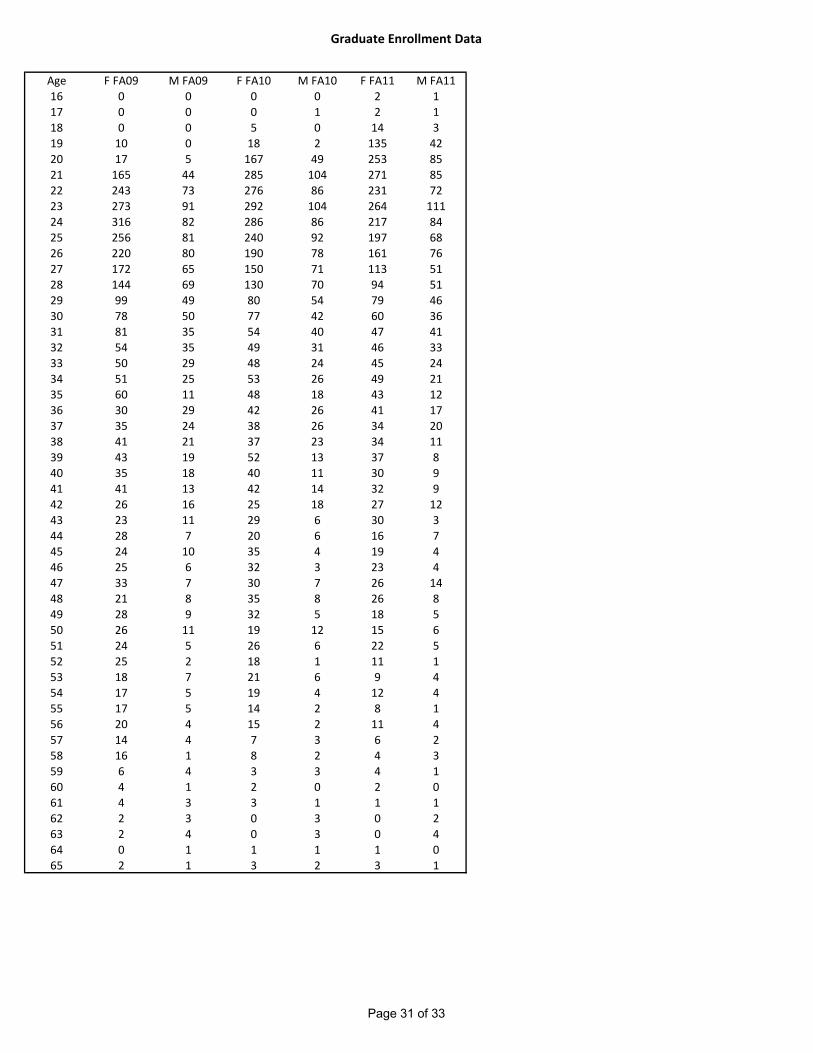
Graduate Enrollment Data
Age F FA09 M FA09 F FA10 M FA10 F FA11 M FA11
16 0 0 0 0 2 1
17 0 0 0 1 2 1
18 0 0 5 0 14 3
19 10 0 18 2 135 42
20 17 5 167 49 253 85
21 165 44 285 104 271 85
22 243 73 276 86 231 72
23 273 91 292 104 264 111
24 316 82 286 86 217 84
25 256 81 240 92 197 68
26 220 80 190 78 161 76
27 172 65 150 71 113 51
28 144 69 130 70 94 51
29 99 49 80 54 79 46
30 78 50 77 42 60 36
31 81 35 54 40 47 41
32 54 35 49 31 46 33
33 50 29 48 24 45 24
34 51 25 53 26 49 21
35 60 11 48 18 43 12
36 30 29 42 26 41 17
37 35 24 38 26 34 20
38 41 21 37 23 34 11
39 43 19 52 13 37 8
40 35 18 40 11 30 9
41 41 13 42 14 32 9
42 26 16 25 18 27 12
43 23 11 29 6 30 3
44 28 7 20 6 16 7
45 24 10 35 4 19 4
46 25 6 32 3 23 4
47 33 7 30 7 26 14
48 21 8 35 8 26 8
49 28 9 32 5 18 5
50 26 11 19 12 15 6
51 24 5 26 6 22 5
52 25 2 18 1 11 1
53 18 7 21 6 9 4
54 17 5 19 4 12 4
55 17 5 14 2 8 1
56 20 4 15 2 11 4
57 14 4 7 3 6 2
58 16 1 8 2 4 3
59 6 4 3 3 4 1
60 4 1 2 0 2 0
61 4 3 3 1 1 1
62 2 3 0 3 0 2
63 2 4 0 3 0 4
64 0 1 1 1 1 0
65 2 1 3 2 3 1
Page 31 of 33
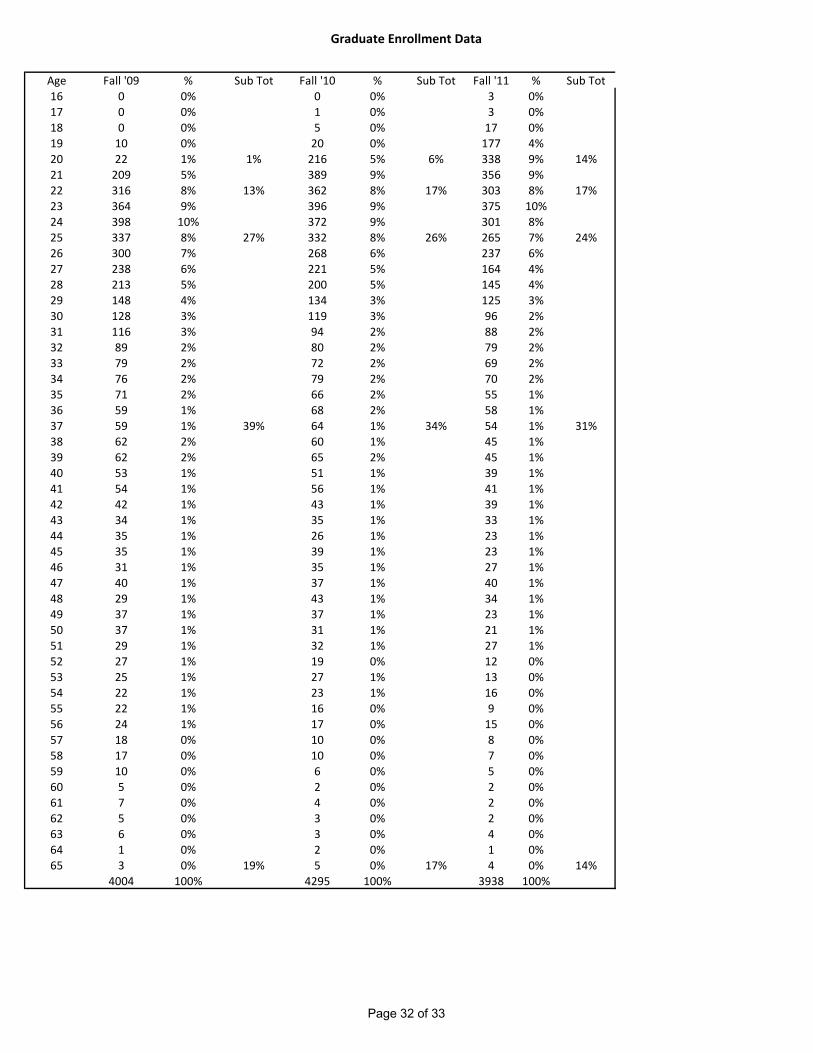
Graduate Enrollment Data
Age Fall '09 % Sub Tot Fall '10 % Sub Tot Fall '11 % Sub Tot
16 0 0% 0 0% 3 0%
17 0 0% 1 0% 3 0%
18 0 0% 5 0% 17 0%
19 10 0% 20 0% 177 4%
20 22 1% 1% 216 5% 6% 338 9% 14%
21 209 5% 389 9% 356 9%
22 316 8% 13% 362 8% 17% 303 8% 17%
23 364 9% 396 9% 375 10%
24 398 10% 372 9% 301 8%
25 337 8% 27% 332 8% 26% 265 7% 24%
26 300 7% 268 6% 237 6%
27 238 6% 221 5% 164 4%
28 213 5% 200 5% 145 4%
29 148 4% 134 3% 125 3%
30 128 3% 119 3% 96 2%
31 116 3% 94 2% 88 2%
32 89 2% 80 2% 79 2%
33 79 2% 72 2% 69 2%
34 76 2% 79 2% 70 2%
35 71 2% 66 2% 55 1%
36 59 1% 68 2% 58 1%
37 59 1% 39% 64 1% 34% 54 1% 31%
38 62 2% 60 1% 45 1%
39 62 2% 65 2% 45 1%
40 53 1% 51 1% 39 1%
41 54 1% 56 1% 41 1%
42 42 1% 43 1% 39 1%
43 34 1% 35 1% 33 1%
44 35 1% 26 1% 23 1%
45 35 1% 39 1% 23 1%
46 31 1% 35 1% 27 1%
47 40 1% 37 1% 40 1%
48 29 1% 43 1% 34 1%
49 37 1% 37 1% 23 1%
50 37 1% 31 1% 21 1%
51 29 1% 32 1% 27 1%
52 27 1% 19 0% 12 0%
53 25 1% 27 1% 13 0%
54 22 1% 23 1% 16 0%
55 22 1% 16 0% 9 0%
56 24 1% 17 0% 15 0%
57 18 0% 10 0% 8 0%
58 17 0% 10 0% 7 0%
59 10 0% 6 0% 5 0%
60 5 0% 2 0% 2 0%
61 7 0% 4 0% 2 0%
62 5 0% 3 0% 2 0%
63 6 0% 3 0% 4 0%
64 1 0% 2 0% 1 0%
65 3 0% 19% 5 0% 17% 4 0% 14%
4004 100% 4295 100% 3938 100%
Page 32 of 33
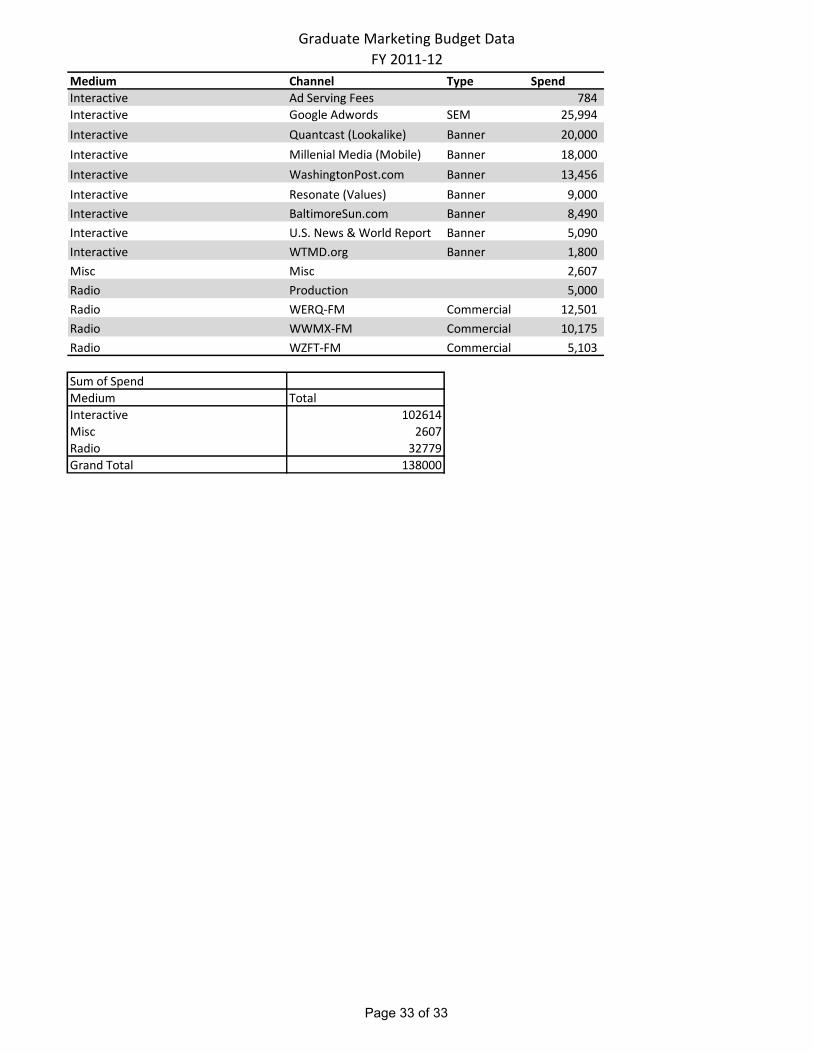
Graduate Marketing Budget Data
FY 2011-12
Medium Channel Type Spend
Interactive Ad Serving Fees 784
Interactive Google Adwords SEM 25,994
Interactive Quantcast (Lookalike) Banner 20,000
Interactive Millenial Media (Mobile) Banner 18,000
Interactive WashingtonPost.com Banner 13,456
Interactive Resonate (Values) Banner 9,000
Interactive BaltimoreSun.com Banner 8,490
Interactive U.S. News & World Report Banner 5,090
Interactive WTMD.org Banner 1,800
Misc Misc 2,607
Radio Production 5,000
Radio WERQ-FM Commercial 12,501
Radio WWMX-FM Commercial 10,175
Radio WZFT-FM Commercial 5,103
Sum of Spend
Medium Total
Interactive 102614
Misc 2607
Radio 32779
Grand Total 138000
Page 33 of 33