
Data driven design
35
Data Driven Design Sean Byrnes http://seanbyrnes.com @sbyrnes
-
Upload
sean-byrnes -
Category
Design
-
view
198 -
download
0
Transcript of Data driven design

Data Driven Design
Sean Byrneshttp://seanbyrnes.com
@sbyrnes

Who Am I?
FOUNDED
BLOG
from Yahoo!
seanonstartups.co

de·sign /dəˈzīn/ noun1. a plan or drawing produced to show the look and function or workings
of a building, garment, or other object before it is built or made.2. purpose, planning, or intention that exists or is thought to exist behind
an action, fact, or material object.
verb3. decide upon the look and functioning of (a building, garment, or other
object), typically by making a detailed drawing of it.

Design is not just what it looks like and feels like.
Design is how it works.- Steve Jobs

Overview
• Customer Lifecycles• Goal Driven Design• Feature Competition• Measuring Customer Satisfaction
Won’t cover:• A/B Testing• Usability studies

Vision > Metrics

1 // LEARNING IS DANGEROUSCustomer Lifecycles

NEWBIES EXPERTS
Funnel Analysis Cohort Retention Analysis

Newbie
DAYS
Signup
EX
PERTIS
EA
CTIO
NS
Student
Advanced
Expert
Power Use

NEWBIES
EXPERTS
STUDENTS

So, how do we hit a moving target?

Lifecycle Analysis
Newbie Student Expert

Predictive Analytics
NOTE: I am an investor in Framed Data

Modeling Lifecycles
• Identify key behaviors that represent levels of user expertise
• Classify users by expertise segments and evaluate satisfaction by segment
2 // THE MEANING OF LIFEGoal Driven Design
Customers don’t care about features,they care about achieving their goals.

Features
Share a photo
Goals
Make someone laugh
Buy a book
Accounting automation
Stay in touch with friends
Save time
Learn something new
Entertainment

How do you understand goals?
(Other than asking)

3 // PICK ONEFeature Competition

Feature 1
Feature 3 Feature 4
Feature 5Feature 2

Feature 1

Do you want Feature A?• Yes• No
Which do you like best?• Feature A• Feature B• Feature C• Feature D• Feature E
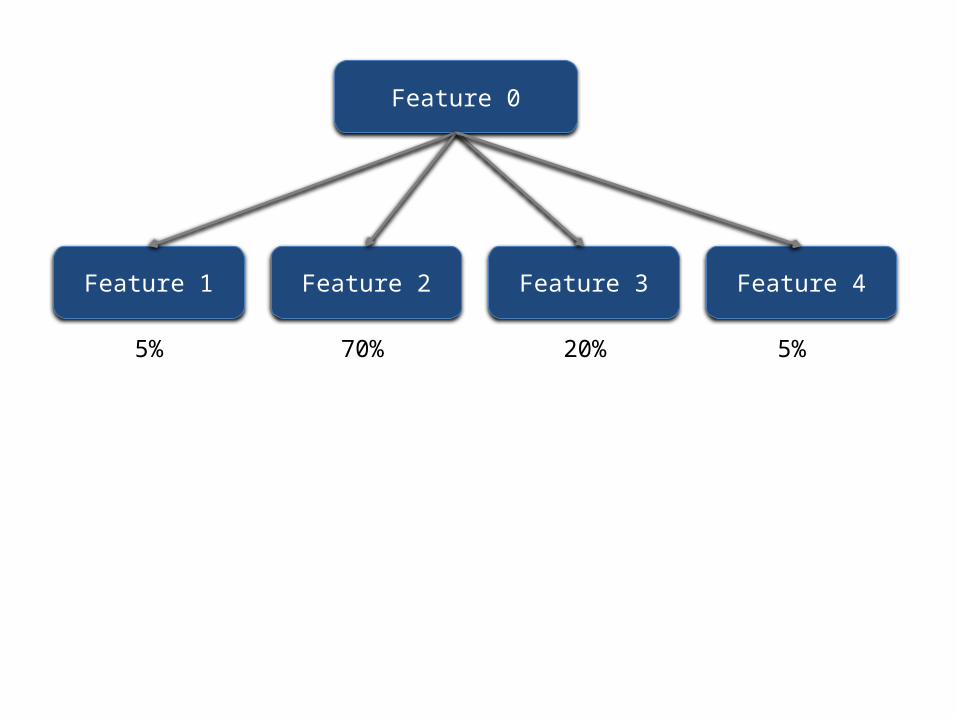
Feature 0
Feature 1 Feature 2 Feature 3 Feature 4
70% 20% 5%5%

Feature 0
Feature 1 Feature 2 Feature 3 Feature 4
70% 20% 5%5%
Feature 0
Feature 1 Feature 3 Feature 4
40% 30%30%
Feature Competition
• Do not analyze features in a vaccuum
• Run experiments to understand feature independence
4 // DO YOU LIKE IT?Measure Customer Satisfaction

On a scale of 1 to 10, how likely are you to recommend this talk?
1 2 3 4 5 6 7 8 9 10
Very Unlikely Very Likely
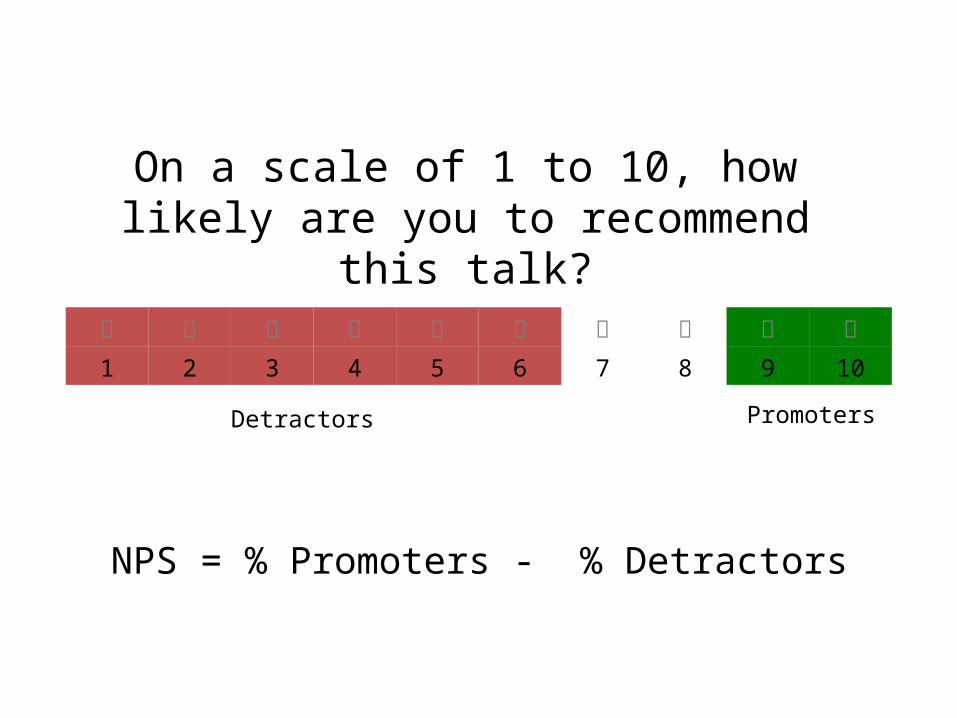
On a scale of 1 to 10, how likely are you to recommend this talk?
1 2 3 4 5 6 7 8 9 10
NPS = % Promoters - % Detractors
Detractors Promoters

You can’t recommend a feature to a friend.

Measuring Feature Satisfaction
All Customers
Promoters Detractors
Feature 1 34% 20%
Feature 2 75% 17%
Feature 3 20% 80%
Feature 4 67% 50%
Feature 5 23% 25%

Measuring Feature Satisfaction
All Customers
Promoters Detractors
Feature 1 34% 20%
Feature 2 75% 17%
Feature 3 20% 80%
Feature 4 67% 50%
Feature 5 23% 25%

Measuring Happiness
• Use satisfaction to segment customers
• Analyze differences in behavior by segment
• IMPORTANT: Account for other factors!

Okay, Let’s Review
Review
• Design for customer goals, not features
• Model the entire customer lifecycle• Segment by both expertise and
satisfaction• Don’t analyze features in a vaccuum• Correlate features with happiness


![[@IndeedEng] Data-Driven Product Design](https://static.fdocuments.us/doc/165x107/5457d513af795963388b45d2/indeedeng-data-driven-product-design.jpg)