Data-driven behavioural modelling of residential water consumption to inform water demand management...
27
Data-driven behavioural modelling of residential water consumption to inform water demand management strategies M. Giuliani, A. Cominola, A. Alsahaf, A. Castelletti, M. Anda EGU General Assembly 2016
-
Upload
smarth2o -
Category
Engineering
-
view
250 -
download
3
Transcript of Data-driven behavioural modelling of residential water consumption to inform water demand management...

Data-driven behavioural modelling of residential water consumption to inform water demand management strategies
M. Giuliani, A. Cominola, A. Alsahaf, A. Castelletti, M. Anda
EGU General Assembly 2016

US246.2
Urban population in millions
81%Urban percentage
Mexico84.392
77%
Colombia34.373%
Brazil162.685%
Argentina35.690%
Ukraine30.968%
Russia103.673%
China559.2
Urban population in millions
42%Urban percentage
Turkey51.168%
India329.329%
Bangladesh38.226%
Philippines55.064%
Indonesia114.150%
S Korea39.081%
Japan84.766%
Egypt33.143%
S Africa28.660%
Canada26.3
Venezuela26.0
Poland23.9
Thailand21.5
Australia18.3
Netherlands13.3
Peru21.0
Saudi Arabia20.9
Iraq20.3 Vietnam
23.3
DR Congo20.2
Algeria22.0Morocco
19.4
Malaysia18.1
Burma16.5
Sudan16.3
Chile14.6
N Korea14.1
Ethiopia13.0
Uzbekistan10.1
Tanzania9.9
Romania11.6
Ghana11.3
Syria10.2
Belgium10.2
80%
94%
62%
33%
89%
81%
73%
81%
67%
27%
33%
65%60%
69%
32%
43%
88%
62%
16%
37%
25%
54%
49%
51%
97%
Nigeria68.650%
UK54.090%
France46.977%
Spain33.677%
Italy39.668%
Germany62.075%
Iran48.468%
Pakistan59.336%
Cameroon
AngolaEcuador
IvoryCoast
Kazakh-stan
Cuba
Afghan-istan
Sweden
Kenya
CzechRepublic
9.5
9.38.7
8.6
8.6
8.5
7.8
7.6
7.6
7.4
Mozam-bique
HongKong
Belarus
Tunisia
Hungary
Greece
Israel
Guate-mala
Portugal
Yemen
DominicanRepublic
Bolivia
Serbia &Mont
Switzer-land
Austria
Bulgaria
Mada-gascar
Libya
Senegal
Jordan
Zimbabwe
Nepal
Denmark
Mali
Azerbaijan
Singapore
ElSalvador
Zambia
Uganda
PuertoRico
Paraguay
UAE
Benin
Norway
NewZealand
Honduras
Haiti
Nicaragua
Guinea
Finland
Uruguay
Lebanon
Somalia
Sri Lanka
Cambodia
Slovakia
Costa Rica
Palestine
Kuwait
Togo
ChadBurkina
Ireland
Croatia
Congo
Niger
Sierra Leone
Malawi
Panama
Turkmenistan
Georgia
Lithuania
Liberia
Moldova
Rwanda
Kyrgyzstan
Oman
ArmeniaBosnia
Tajikistan
CAR
Melanesia
Latvia
Mongolia
Albania
Jamaica
Macedonia
Mauritania Laos
Gabon
Botswana
Slovenia
Eritrea
Estonia
Gambia
Burundi
Papua New Guinea
NamibiaMauritius
Guinea-Bissau
Lesotho E Timor
Bhutan
Swaziland
Trinidad & Tobago
The earth reaches a momentous milestone: by next year, for the first time in history, more than half its population will be living in cities. Those 3.3 billion people are expected to grow to 5 billion by 2030 — this unique map of the world shows where those people live now
At the beginning of the 20th century, the world's urban population was only 220 million, mainly in the west
By 2030, the towns and cities of the developing world will make up 80% of urban humanity
The new urban world
Urban growth, 2005—2010
Predominantly urban75% or over
Predominantly urban50—74%
Predominantly rural25—49% urban
Predominantly rural0—24% urban
Cities over 10 million people(greater urban area)
Key
Tokyo33.4
Osaka16.6
Seoul23.2
Manila15.4
Jakarta14.9
Dacca 13.8
Bombay21.3
Delhi21.1 Calcutta
15.5
Karachi14.8
Shanghai17.3
Canton14.5
Beijing12.7
Moscow13.4
Tehran12.1
Cairo15.9
Istanbul11.7
London12.0
Lagos10.0
MexicoCity22.1
New York21.8
Sao Paulo20.4
LA17.9
Rio deJaneiro
12.2
BuenosAires13.5 3,307,950,000
The world’s urban population — from a total of 6,615.9 million SOURCE: UNFPA GRAPHIC: PAUL SCRUTONAfrica Asia Oceania Europe0.1%
Eastern Europe-0.4%
Arab StatesLatin America& Caribbean North America
3.2%2.4%
1.3%
2.8%
1.7%1.3%
Urban population is growing
Source: United Nations Population Fund, 2007

2000 2030 2050
+130%
Dom
estic
water
dem
and
41 megacities worldwide
Source: United Nations. Department of Economic and Social Affairs. Population Division, 2010 Leflaive, X., et al. (2012), "Water", in OECD, OECD Environmental Outlook to 2050: The Consequences of Inaction, OECD Publishing, Paris
… and so residential water demand

city/district scale
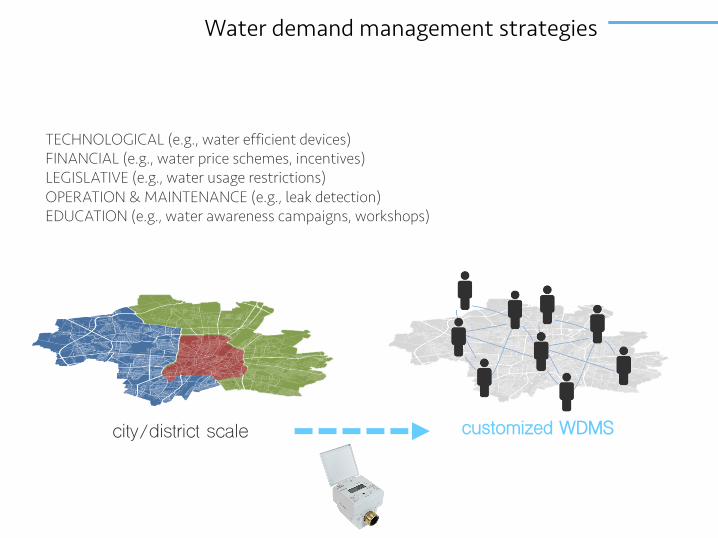
Water demand management strategies
TECHNOLOGICAL (e.g., water efficient devices)FINANCIAL (e.g., water price schemes, incentives)LEGISLATIVE (e.g., water usage restrictions)OPERATION & MAINTENANCE (e.g., leak detection)EDUCATION (e.g., water awareness campaigns, workshops)
city/district scale
Water demand management strategies
TECHNOLOGICAL (e.g., water efficient devices)FINANCIAL (e.g., water price schemes, incentives)LEGISLATIVE (e.g., water usage restrictions)OPERATION & MAINTENANCE (e.g., leak detection)EDUCATION (e.g., water awareness campaigns, workshops)
customized WDMS

What is the current state-of-the-art of residential Water Demand Management?

1990 1994
50
30
10
1995 1999
2000 2004
2005 2009
2010 2015
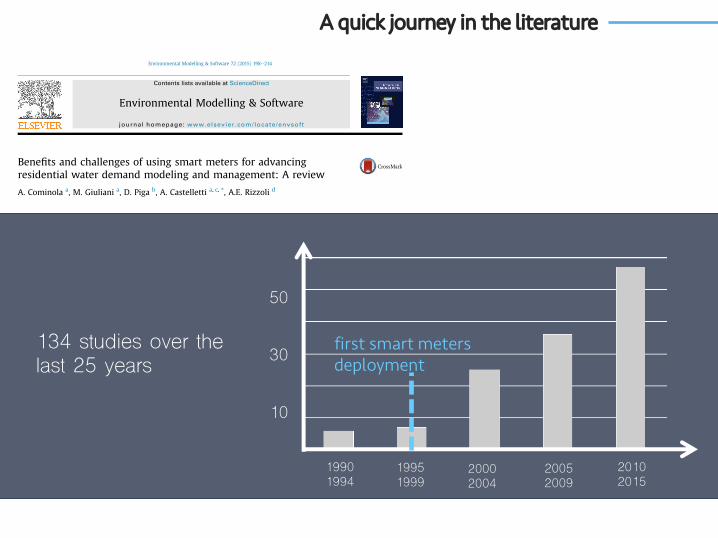
Benefits and challenges of using smart meters for advancingresidential water demand modeling and management: A review
A. Cominola a, M. Giuliani a, D. Piga b, A. Castelletti a, c, *, A.E. Rizzoli da Department of Electronics, Information, and Bioengineering, Politecnico di Milano, Milan, Italyb IMT Institute for Advanced Studies Lucca, Lucca, Italyc Institute of Environmental Engineering, ETH Zurich, Zurich, Switzerlandd Istituto Dalle Molle di Studi sull'Intelligenza Artificiale, SUPSI-USI, Lugano, Switzerland
a r t i c l e i n f o
Article history:Received 2 April 2015Received in revised form21 July 2015Accepted 21 July 2015Available online xxx
Keywords:Smart meterResidential water managementWater demand modelingWater conservation
a b s t r a c t
Over the last two decades, water smart metering programs have been launched in a number of mediumto large cities worldwide to nearly continuously monitor water consumption at the single householdlevel. The availability of data at such very high spatial and temporal resolution advanced the ability incharacterizing, modeling, and, ultimately, designing user-oriented residential water demand manage-ment strategies. Research to date has been focusing on one or more of these aspects but with limitedintegration between the specialized methodologies developed so far. This manuscript is the firstcomprehensive review of the literature in this quickly evolving water research domain. The papercontributes a general framework for the classification of residential water demand modeling studies,which allows revising consolidated approaches, describing emerging trends, and identifying potentialfuture developments. In particular, the future challenges posed by growing population demands, con-strained sources of water supply and climate change impacts are expected to require more and moreintegrated procedures for effectively supporting residential water demand modeling and management inseveral countries across the world.
© 2015 Elsevier Ltd. All rights reserved.
1. Introduction
World's urban population is expected to raise from current54%e66% in 2050 and to further increase as a consequence of theunlikely stabilization of human population by the end of the cen-tury (Gerland et al., 2014). By 2030 the number of mega-cities,namely cities with more than 10 million inhabitants, will growover 40 (UNDESA, 2010). This will boost residential water demand(Cosgrove and Cosgrove, 2012), which nowadays covers a largeportion of the public drinking water supply worldwide (e.g.,60e80% in Europe (Collins et al., 2009), 58% in the United States(Kenny et al., 2009)).
The concentration of the water demands of thousands or mil-lions of people into small areas will considerably raise the stress onfinite supplies of available freshwater (McDonald et al., 2011a).Besides, climate and land use change will further increase the
number of people facingwater shortage (McDonald et al., 2011b). Insuch context, water supply expansion through the construction ofnew infrastructures might be an option to escape water stress insome situations. Yet, geographical or financial limitations largelyrestrict such options in most countries (McDonald et al., 2014).Here, acting on the water demand management side through thepromotion of cost-effective water-saving technologies, revisedeconomic policies, appropriate national and local regulations, andeducation represents an alternative strategy for securing reliablewater supply and reduce water utilities' costs (Gleick et al., 2003).
In recent years, a variety of water demand management stra-tegies (WDMS) has been applied (for a review, see Inman andJeffrey, 2006, and references therein). However, the effectivenessof these WDMS is often context-specific and strongly depends onour understanding of the drivers inducing people to consume orsave water (Jorgensen et al., 2009). Models that quantitativelydescribe how water demand is influenced and varies in relation toexogenous uncontrolled drivers (e.g., seasonality, climatic condi-tions) and demand management actions (e.g., water restrictions,pricing schemes, education campaigns) are essential to explorewater users' response to alternative WDMS, ultimately supporting
* Corresponding author. Department of Electronics, Information, and Bioengi-neering, Politecnico di Milano, Milan, Italy.
E-mail address: [email protected] (A. Castelletti).
Contents lists available at ScienceDirect
Environmental Modelling & Software
journal homepage: www.elsevier .com/locate/envsoft
http://dx.doi.org/10.1016/j.envsoft.2015.07.0121364-8152/© 2015 Elsevier Ltd. All rights reserved.
Environmental Modelling & Software 72 (2015) 198e214
134 studies over the last 25 years
A quick journey in the literature
1990 1994
50
30
10
1995 1999
2000 2004
2005 2009
2010 2015
Benefits and challenges of using smart meters for advancingresidential water demand modeling and management: A review
A. Cominola a, M. Giuliani a, D. Piga b, A. Castelletti a, c, *, A.E. Rizzoli da Department of Electronics, Information, and Bioengineering, Politecnico di Milano, Milan, Italyb IMT Institute for Advanced Studies Lucca, Lucca, Italyc Institute of Environmental Engineering, ETH Zurich, Zurich, Switzerlandd Istituto Dalle Molle di Studi sull'Intelligenza Artificiale, SUPSI-USI, Lugano, Switzerland
a r t i c l e i n f o
Article history:Received 2 April 2015Received in revised form21 July 2015Accepted 21 July 2015Available online xxx
Keywords:Smart meterResidential water managementWater demand modelingWater conservation
a b s t r a c t
Over the last two decades, water smart metering programs have been launched in a number of mediumto large cities worldwide to nearly continuously monitor water consumption at the single householdlevel. The availability of data at such very high spatial and temporal resolution advanced the ability incharacterizing, modeling, and, ultimately, designing user-oriented residential water demand manage-ment strategies. Research to date has been focusing on one or more of these aspects but with limitedintegration between the specialized methodologies developed so far. This manuscript is the firstcomprehensive review of the literature in this quickly evolving water research domain. The papercontributes a general framework for the classification of residential water demand modeling studies,which allows revising consolidated approaches, describing emerging trends, and identifying potentialfuture developments. In particular, the future challenges posed by growing population demands, con-strained sources of water supply and climate change impacts are expected to require more and moreintegrated procedures for effectively supporting residential water demand modeling and management inseveral countries across the world.
© 2015 Elsevier Ltd. All rights reserved.
1. Introduction
World's urban population is expected to raise from current54%e66% in 2050 and to further increase as a consequence of theunlikely stabilization of human population by the end of the cen-tury (Gerland et al., 2014). By 2030 the number of mega-cities,namely cities with more than 10 million inhabitants, will growover 40 (UNDESA, 2010). This will boost residential water demand(Cosgrove and Cosgrove, 2012), which nowadays covers a largeportion of the public drinking water supply worldwide (e.g.,60e80% in Europe (Collins et al., 2009), 58% in the United States(Kenny et al., 2009)).
The concentration of the water demands of thousands or mil-lions of people into small areas will considerably raise the stress onfinite supplies of available freshwater (McDonald et al., 2011a).Besides, climate and land use change will further increase the
number of people facingwater shortage (McDonald et al., 2011b). Insuch context, water supply expansion through the construction ofnew infrastructures might be an option to escape water stress insome situations. Yet, geographical or financial limitations largelyrestrict such options in most countries (McDonald et al., 2014).Here, acting on the water demand management side through thepromotion of cost-effective water-saving technologies, revisedeconomic policies, appropriate national and local regulations, andeducation represents an alternative strategy for securing reliablewater supply and reduce water utilities' costs (Gleick et al., 2003).
In recent years, a variety of water demand management stra-tegies (WDMS) has been applied (for a review, see Inman andJeffrey, 2006, and references therein). However, the effectivenessof these WDMS is often context-specific and strongly depends onour understanding of the drivers inducing people to consume orsave water (Jorgensen et al., 2009). Models that quantitativelydescribe how water demand is influenced and varies in relation toexogenous uncontrolled drivers (e.g., seasonality, climatic condi-tions) and demand management actions (e.g., water restrictions,pricing schemes, education campaigns) are essential to explorewater users' response to alternative WDMS, ultimately supporting
* Corresponding author. Department of Electronics, Information, and Bioengi-neering, Politecnico di Milano, Milan, Italy.
E-mail address: [email protected] (A. Castelletti).
Contents lists available at ScienceDirect
Environmental Modelling & Software
journal homepage: www.elsevier .com/locate/envsoft
http://dx.doi.org/10.1016/j.envsoft.2015.07.0121364-8152/© 2015 Elsevier Ltd. All rights reserved.
Environmental Modelling & Software 72 (2015) 198e214
134 studies over the last 25 years
A quick journey in the literature
first smart meters deployment

quarterly / half yearly basis readings
1 kilolitre (=1m3)
Traditional water meters
Traditional vs Smart water meters

Smart meters resolution: 72 pulses/L (=72k pulses/m3 )Data logging resolution: 5-10 s intervalInformation on time-of-day for consumption
Smart water meters
Traditional vs Smart water meters
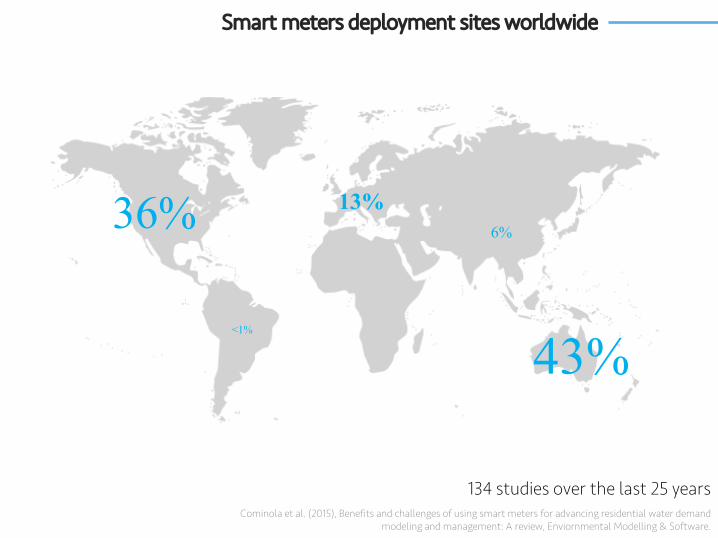
36%
43%
13%6%
<1%
Smart meters deployment sites worldwide
134 studies over the last 25 yearsCominola et al. (2015), Benefits and challenges of using smart meters for advancing residential water demand
modeling and management: A review, Enviornmental Modelling & Software.

CUSTOMIZED DEMAND MANAGEMENT
CONSUMERS’ COMMUNITYWATER
CONSUMPTION MONITORING
BEHAVIORAL USER MODELLING
_ SMART METERED WATER CONSUMPTION
_ PSYCHOGRAPHIC DATA
_ RESPONSE TO WDMS
_ technological
_ financial
_ legislative_ operation and maintenance_ education
Smart meters potential for WDMS

CUSTOMIZED DEMAND MANAGEMENT
CONSUMERS’ COMMUNITYWATER
CONSUMPTION MONITORING
BEHAVIORAL USER MODELLING
_ SMART METERED WATER CONSUMPTION
_ PSYCHOGRAPHIC DATA
_ RESPONSE TO WDMS
_ technological
_ financial
_ legislative_ operation and maintenance_ education
3-step behavioral modelling procedure
SMART METERED WATER CONSUMPTION
Users’ consumption class (label)
USERS PROFILING
PREDICTED CONSUMPTION PROFILE
HOUSEHOLD and CONSUMERS’ PSYCHOGRAPHIC DATA Relevant consumption
determinants subset
BEHAVIORAL MODEL
z
FEATURE EXTRACTION

Case Study Application
Source: H2ome smart project (Anda et al., 2013)
Pilbara
Kimberley
3-months resolution water consumption readings (Aug 2010 – Feb 2012)
Approx. 730 households
27 user and household features
Dataset
Case study application

Dataset
Years of occupancy
House responsibility
# occupants
Resident type
Land use
House type
# toilets
Washing machine type
Toilet type
Shower type
Dishwasher presence
Garden area
Watering method
Watering time
Mulch usage
Native plant presence
Average max temperature
Average min temperature
Average daily precipitation
Pool presence
Pool cover usage
Spa presence
Town
Suburb
Metering period start
Metering period end
Metering period length
Users’ and households’ features

USERS PROFILING FEATURE EXTRACTION
Chi-square scoreInformation GainFast Correlation Based FilterCorrelation Feature SelectionBayesian Logistic RegressionSparse Bayesian Multinomial Logistic RegressionIterative Input Variable Selection
Naïve Bayes ClassifierJ48 Decision Tree algorithmExtremely Randomized Trees
BEHAVIORAL MODEL
Cominola et al. (2015), Modelling residential water consumers’ behaviors by feature selection and feature weighting, In Proceedings of the 36th IAHR world congress
K-means clustering (k=4)
Algorithms

USERS PROFILING FEATURE EXTRACTION
Chi-square scoreInformation GainFast Correlation Based FilterCorrelation Feature SelectionBayesian Logistic RegressionSparse Bayesian Multinomial Logistic RegressionIterative Input Variable Selection
Naïve Bayes ClassifierJ48 Decision Tree algorithmExtremely Randomized Trees
BEHAVIORAL MODEL
K-means clustering (k=4)
Algorithms
An evaluation framework for input variable selection algorithms forenvironmental data-driven models
Stefano Galelli a, *, Greer B. Humphrey b, Holger R. Maier b, Andrea Castelletti c,Graeme C. Dandy b, Matthew S. Gibbs b, d
a Pillar of Engineering Systems and Design, Singapore University of Technology and Design, 20 Dover Drive, 138682, Singaporeb School of Civil, Environmental, and Mining Engineering, University of Adelaide, SA, 5005, Australiac Department of Electronics, Information, and Bioengineering, Politecnico di Milano, Piazza L. da Vinci, 32, 20133, Milan, Italyd Department of Environment, Water and Natural Resources, GPO Box 2384, Adelaide, SA, 5001, Australia
a r t i c l e i n f o
Article history:Received 18 May 2014Received in revised form14 August 2014Accepted 14 August 2014Available online
Keywords:Input variable selectionData-driven modellingEvaluation frameworkLarge environmental datasetsArtificial neural networks
a b s t r a c t
Input Variable Selection (IVS) is an essential step in the development of data-driven models and isparticularly relevant in environmental modelling. While new methods for identifying important modelinputs continue to emerge, each has its own advantages and limitations and no single method is bestsuited to all datasets and modelling purposes. Rigorous evaluation of new and existing input variableselection methods would allow the effectiveness of these algorithms to be properly identified in variouscircumstances. However, such evaluations are largely neglected due to the lack of guidelines or precedentto facilitate consistent and standardised assessment. In this paper, a new framework is proposed for theevaluation and inter-comparison of IVS methods which takes into account: (1) a wide range of datasetproperties that are relevant to real world environmental data, (2) assessment criteria selected to high-light algorithm suitability in different situations of interest, and (3) a website for sharing data, algorithmsand results (http://ivs4em.deib.polimi.it/). The framework is demonstrated on four IVS algorithmscommonly used in environmental modelling studies and twenty-six datasets exhibiting different typicalproperties of environmental data. The main aim at this stage is to demonstrate the application of theproposed evaluation framework, rather than provide a definitive answer as to which of these algorithmshas the best overall performance. Nevertheless, the results indicate interesting differences in the algo-rithms' performance that have not been identified previously.
© 2014 Elsevier Ltd. All rights reserved.
Software and data availability
SoftwareName of software: PMIS_PCIS, IIS, GA_ANN.Developers (PMIS_PCIS, GA_ANN): Greer B. Humphrey,
Holger R. Maier, GraemeC. Dandy, Matthew S.Gibbs.
Developers (IIS): Stefano Galelli, Andrea Castelletti.Year first available: 2014.Hardware required: PC or MAC.Software required: R (PMIS_PCIS and GA_ANN), MatLab (IIS).Program language: R (PMIS_PCIS and GA_ANN), MatLab (IIS).
Program size: 41 KB (PMIS_PCIS), 135 KB (IIS), 172 KB(GA_ANN).
DataName of dataset: IVS Framework datasets.Developers: Greer B. Humphrey.Form of repository: zipped files.Size of archive: 239.3 MB.Access form: public Dropbox folder.Contact address: Pillar of Engineering Systems and Design,
Singapore University of Technology andDesign, 20 Dover Drive, Singapore 138682.
Telephone: þ 65 6499 4786.E-mail: [email protected]: http://ivs4em.deib.polimi.it.Availability: software and data are available on the IVS
framework website.Cost: free of charge.
* Corresponding author. Tel.: þ65 6499 4786.E-mail address: [email protected] (S. Galelli).
Contents lists available at ScienceDirect
Environmental Modelling & Software
journal homepage: www.elsevier .com/locate/envsoft
http://dx.doi.org/10.1016/j.envsoft.2014.08.0151364-8152/© 2014 Elsevier Ltd. All rights reserved.
Environmental Modelling & Software 62 (2014) 33e51
http://ivs4em.deib.polimi.it/

F-sc
ore
Relative contribution
Results: feature extraction

Relative contribution
Fsco
re
ET Largest Class Random
Accuracy 0.75 0.56 0.44
F-score 0.48 0.18 0.25
# users correctly profiled
total # usersTrue Positive
True Positive + False Negative
True Positive
True Positive + False Positive
Results: behavioral model

Take home points
• Smart-meters can improve our understanding of residential water consumption behaviors at very high spatial and temporal resolution
• Feature extraction algorithms can identify key users’ featuresdetermining the observed water consumption behaviors
• The combination of smart meters and machine learning techniqueshas the potential for supporting the development of data-drivenbehavioral models

LONDON | UKThames Water water supply utility
15 million customers served
2.6 Gl/day drinking water distributed
Development plan: 3 Million smart meters installed by 2030
LOCARNO | CHSocietà Elettrica Sopracenerina
power supply utility, 80 thousand customers served
Interested in multi-utility smart metering (water, energy, gas)
Almost 400 smart water meters installed
VALENCIA | ESEMIVASA water supply utility
2 million customers served
490,000 water smart meters currently installed
Development plan: 650,000 water smart meters installed by end 2015
Ongoing research
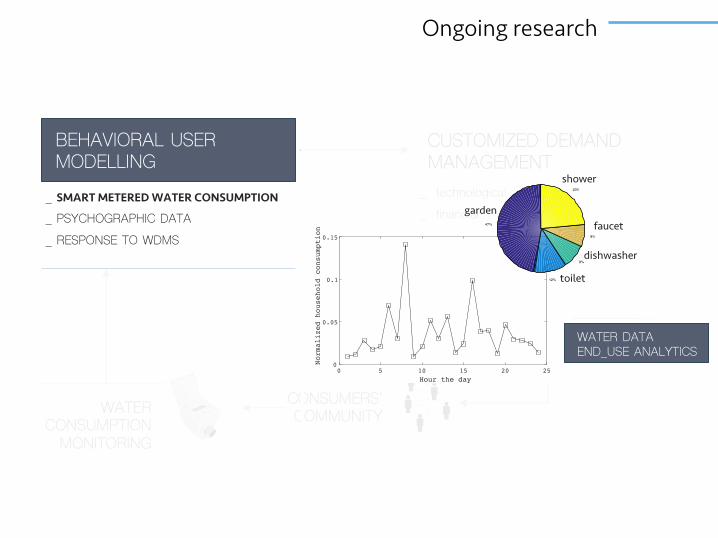
_ technological
_ financial
_ legislative_ operation and maintenance_ education
CUSTOMIZED DEMAND MANAGEMENT
CONSUMERS’ COMMUNITYWATER
CONSUMPTION MONITORING
BEHAVIORAL USER MODELLING
_ SMART METERED WATER CONSUMPTION
_ PSYCHOGRAPHIC DATA
_ RESPONSE TO WDMS
Hour the day0 5 10 15 20 25
Normalized household consumption
0
0.05
0.1
0.15
WATER DATA END_USE ANALYTICS
47%
12%
9%
8%
23%
HPE
CDE CDE CDE CDE CDE CDE CDE
HPE HPE HPE HPE HPE HPEhighest contribution
lowest contribution
garden
shower
toilet
faucet
dishwasher
Ongoing research

_ technological
_ financial
_ legislative_ operation and maintenance_ education
CUSTOMIZED DEMAND MANAGEMENT
CONSUMERS’ COMMUNITYWATER
CONSUMPTION MONITORING
BEHAVIORAL USER MODELLING
_ SMART METERED WATER CONSUMPTION
_ PSYCHOGRAPHIC DATA
_ RESPONSE TO WDMS
Ongoing research
CONSUMER PORTAL
ENGAGEMENT AND BEHAVIOURAL CHANGE

Ongoing research

Ongoing research

Matteo [email protected]
@smartH2Oproject@NRMPolimi
@MxgTeo
Thank You
The event will be held on August 22-25 in the Monte Verità, Switzerland.More Info: www2.idsia.ch/cms/smartwater/
DropTheQuestion available on Google Play