Data, Data, Data: Collection and Data...
35
Data, Data, Data: Collection and Data Books KERI LAGOW EXCEPTIONAL EDUCATION MENTOR TEACHER RICHMOND PUBLIC SCHOOLS
Transcript of Data, Data, Data: Collection and Data...

Data, Data, Data:
Collection and
Data Books KERI LAGOW
EXCEPTIONAL EDUCATION MENTOR TEACHER
RICHMOND PUBLIC SCHOOLS
Agenda
The WH questions of Data
Choosing a data collection
system based on..
Reinforcement review
A little bit about prompting
Program/data binder examples
What do we mean by data collection?
Gathering
Information
Data sheets
Work samples
Grades
Formal Evaluations and
Reports
Classroom Assessments
Data Notebooks
Why
DO WE TAKE DATA?????
Why do we take data?
Drives Instruction
Helps us see patterns in behavior and learning.
Helps us uncover variables that are impacting the student.
Gives us credibility.
Informs our decision making process.
Why do we take data?
Assess student academic and behavioral progress
Provide objective information on student’s performance
Allows for documentation of small steps towards goal
Easy way to communicate between team members
Let’s you know what you’re doing is working!
WHO
Who should take data
Who should take data?
Teachers
Instructional Assistants
Related service providers
Any staff working with the
student
How often do we take data?
Depends on…
Target skill
Classroom resources
Opportunities to respond
Rate of skill acquisition
Data can be collected
Each trial
Each class or program
Each day
Several times each week
When should I take
data??
Well…What does the goal say?
Probe dates
Pre/Post tests
Certain hours in the day
Certain days of the week
Is errorless learning involved?
Across the day
Across settings
Across people
As often as time allows
On What do we take data?
IEP Goals and Objectives !!!!!!!!
Behaviors
Define the target behavior (are they measurable,
observable, and specific? ).
Toileting
Make sure the data you are collecting is relevant to the
students development and learning style.
Ask the teacher/case manager if you ever have
questions about what you need to record.
What can you keep track of?
How often a behavior occurs… Saying “Hi”
Talking to peers
Problem behaviors
When presented with the opportunity to demonstrate a skill, is the child independent? Answering math problems
Raising hand
Following a routine
Valid Questions and
Concerns…
“HOW AM I SUPPOSED TO TAKE DATA??” “I’m teaching! I don’t have time to write down everything anyone does!” “I just don’t think I can manage shuffling all those papers, timers, and watches…” “When am I supposed to teach??”
Let’s make this data thing
work…
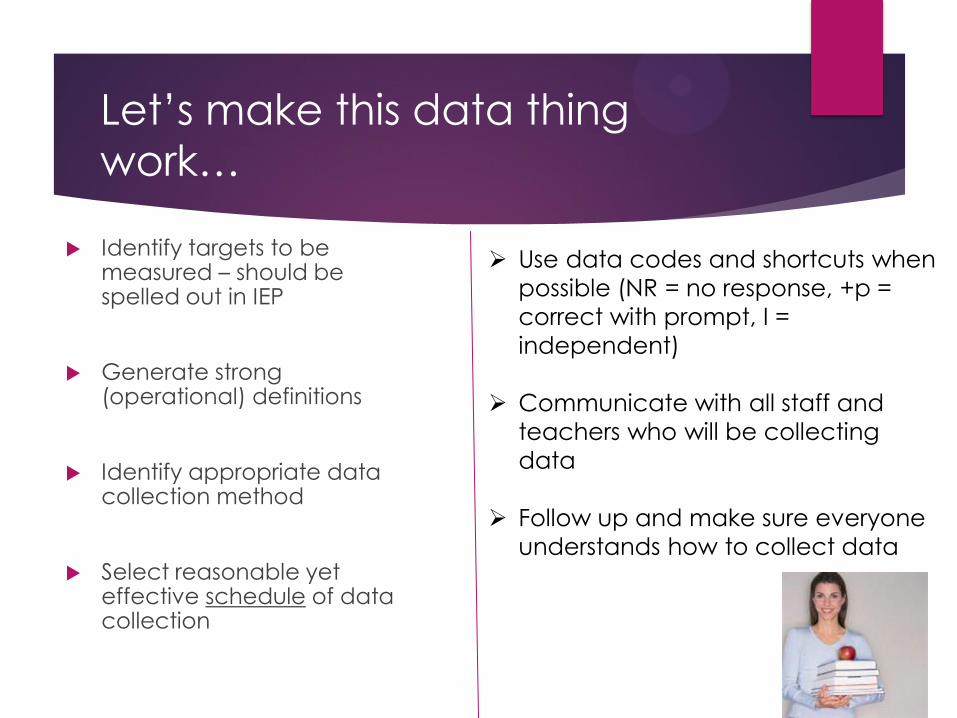
Identify targets to be measured – should be spelled out in IEP
Generate strong (operational) definitions
Identify appropriate data collection method
Select reasonable yet effective schedule of data collection
Use data codes and shortcuts when
possible (NR = no response, +p =
correct with prompt, I =
independent)
Communicate with all staff and
teachers who will be collecting
data
Follow up and make sure everyone
understands how to collect data
Direct Data
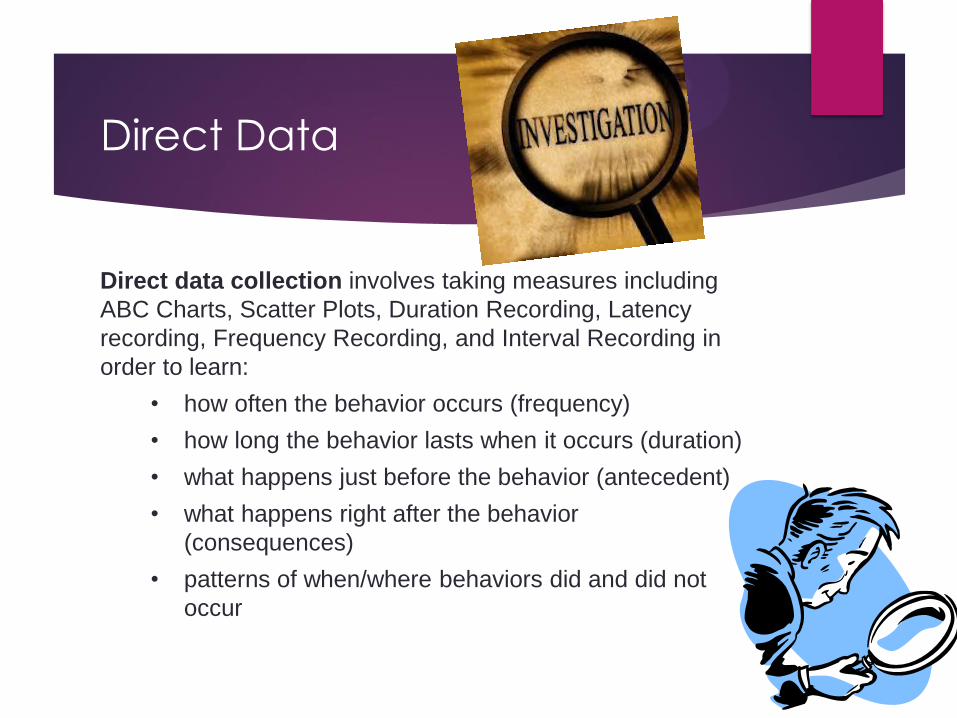
Direct data collection involves taking measures including
ABC Charts, Scatter Plots, Duration Recording, Latency
recording, Frequency Recording, and Interval Recording in
order to learn:
• how often the behavior occurs (frequency)
• how long the behavior lasts when it occurs (duration)
• what happens just before the behavior (antecedent)
• what happens right after the behavior
(consequences)
• patterns of when/where behaviors did and did not
occur
Taking Accurate Data
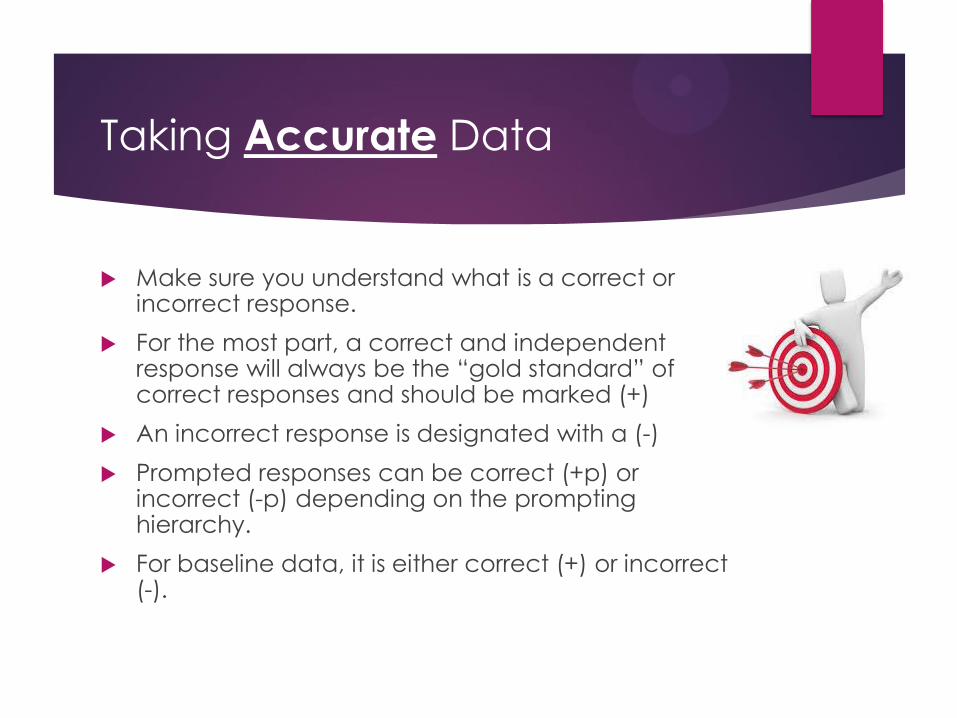
Make sure you understand what is a correct or incorrect response.
For the most part, a correct and independent response will always be the “gold standard” of correct responses and should be marked (+)
An incorrect response is designated with a (-)
Prompted responses can be correct (+p) or incorrect (-p) depending on the prompting hierarchy.
For baseline data, it is either correct (+) or incorrect (-).
Behavior Examples
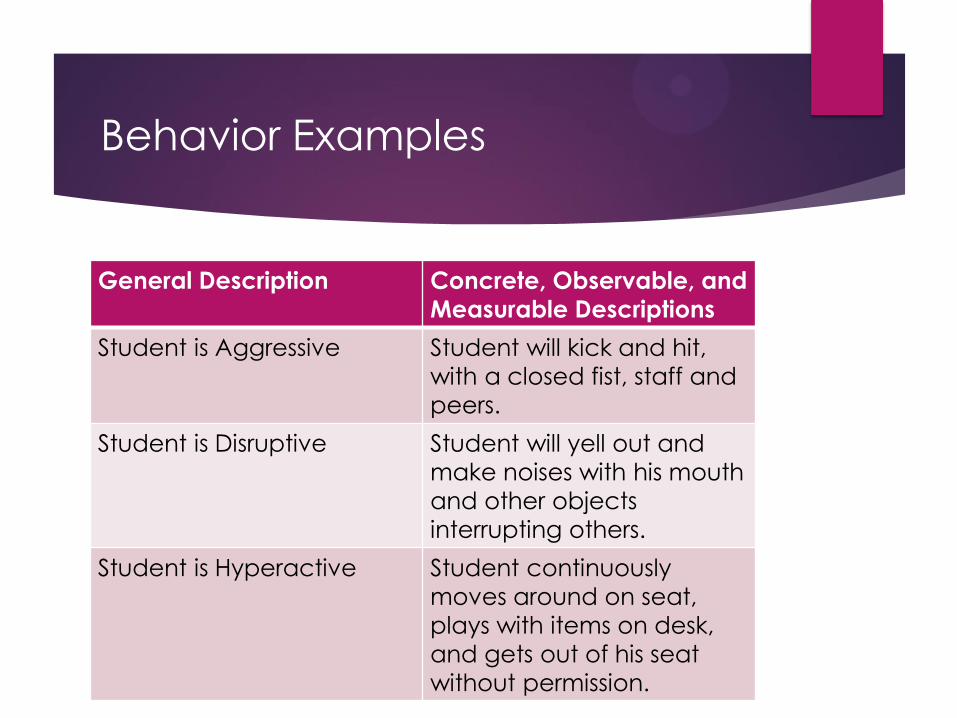
General Description Concrete, Observable, and
Measurable Descriptions
Student is Aggressive Student will kick and hit,
with a closed fist, staff and
peers.
Student is Disruptive Student will yell out and
make noises with his mouth
and other objects
interrupting others.
Student is Hyperactive Student continuously
moves around on seat,
plays with items on desk,
and gets out of his seat
without permission.
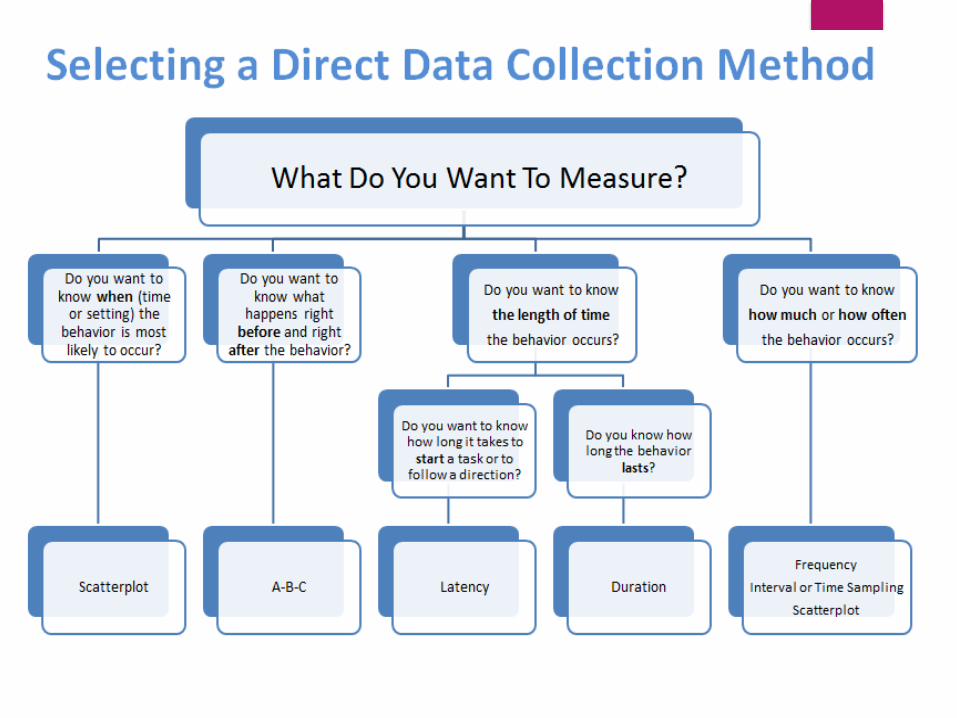
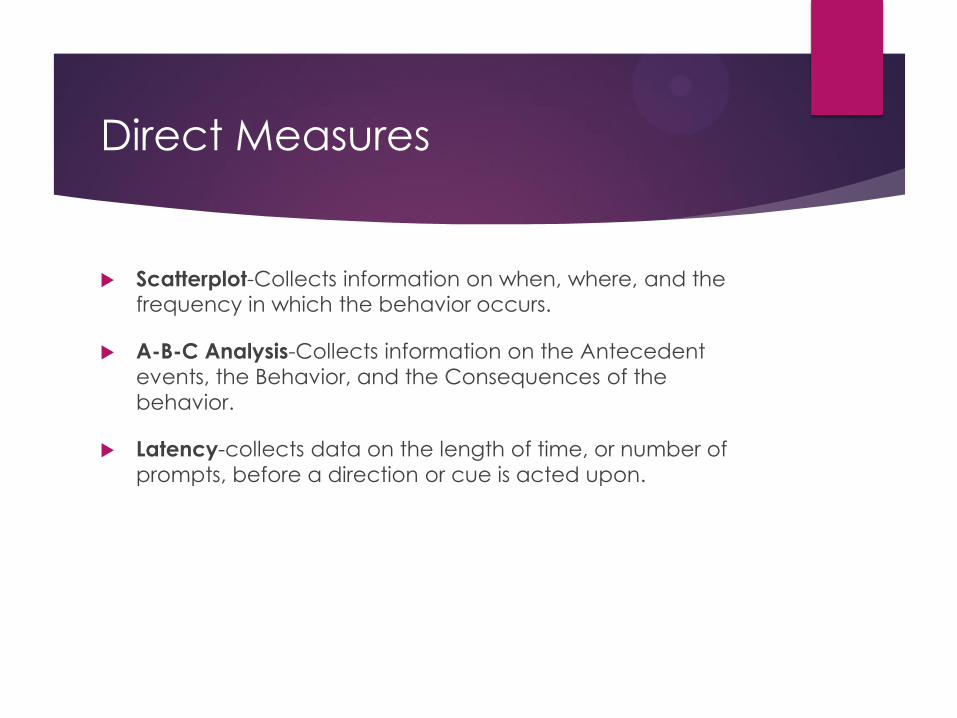
Direct Measures
Scatterplot-Collects information on when, where, and the frequency in which the behavior occurs.
A-B-C Analysis-Collects information on the Antecedent
events, the Behavior, and the Consequences of the
behavior.
Latency-collects data on the length of time, or number of
prompts, before a direction or cue is acted upon.
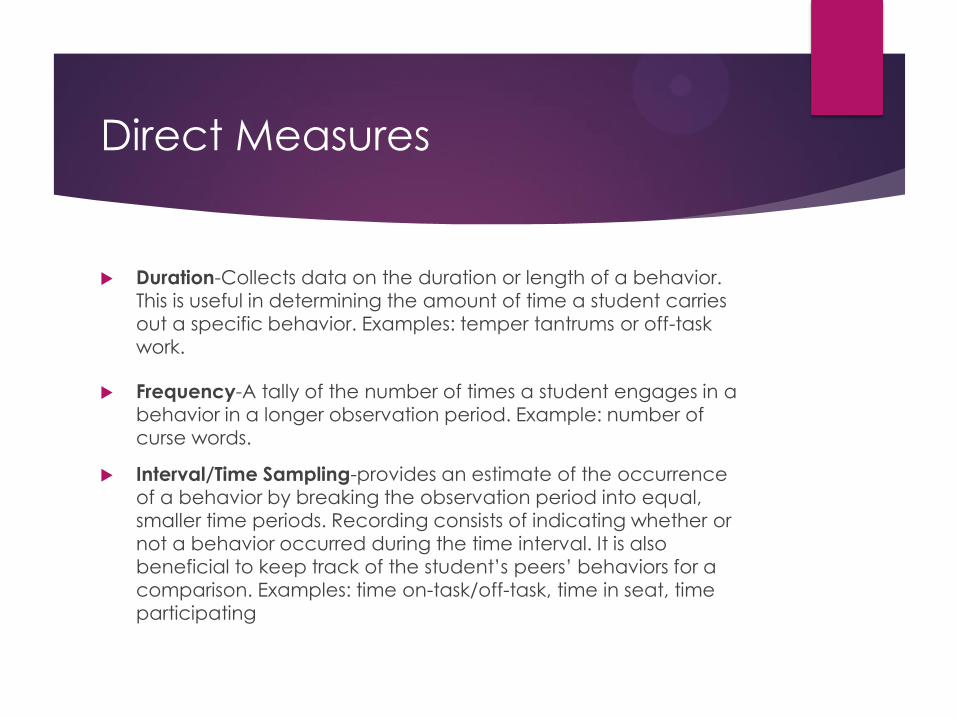
Direct Measures
Duration-Collects data on the duration or length of a behavior.
This is useful in determining the amount of time a student carries
out a specific behavior. Examples: temper tantrums or off-task
work.
Frequency-A tally of the number of times a student engages in a
behavior in a longer observation period. Example: number of
curse words.
Interval/Time Sampling-provides an estimate of the occurrence
of a behavior by breaking the observation period into equal, smaller time periods. Recording consists of indicating whether or
not a behavior occurred during the time interval. It is also
beneficial to keep track of the student’s peers’ behaviors for a
comparison. Examples: time on-task/off-task, time in seat, time
participating
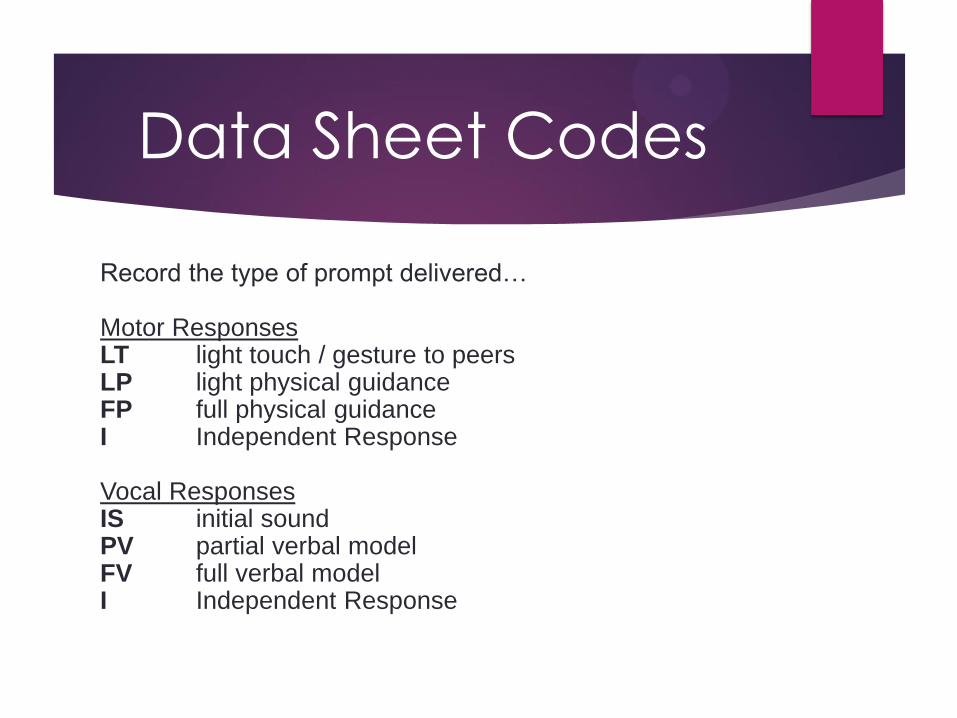
Data Sheet Codes
Record the type of prompt delivered… Motor Responses LT light touch / gesture to peers LP light physical guidance FP full physical guidance I Independent Response Vocal Responses IS initial sound PV partial verbal model FV full verbal model I Independent Response
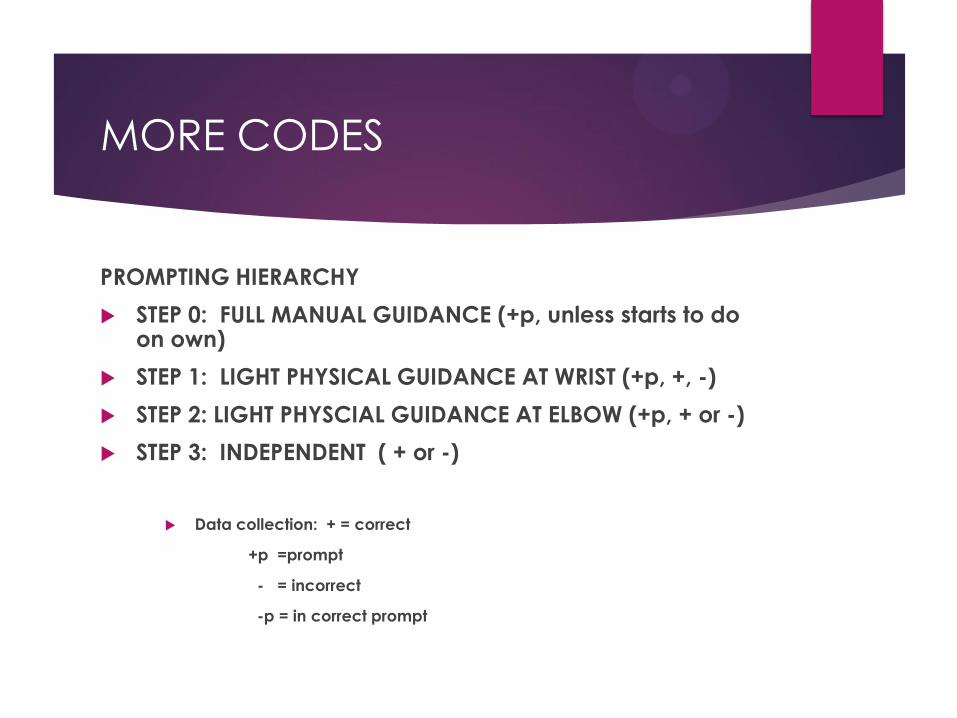
MORE CODES
PROMPTING HIERARCHY
STEP 0: FULL MANUAL GUIDANCE (+p, unless starts to do on own)
STEP 1: LIGHT PHYSICAL GUIDANCE AT WRIST (+p, +, -)
STEP 2: LIGHT PHYSCIAL GUIDANCE AT ELBOW (+p, + or -)
STEP 3: INDEPENDENT ( + or -)
Data collection: + = correct
+p =prompt
- = incorrect
-p = in correct prompt
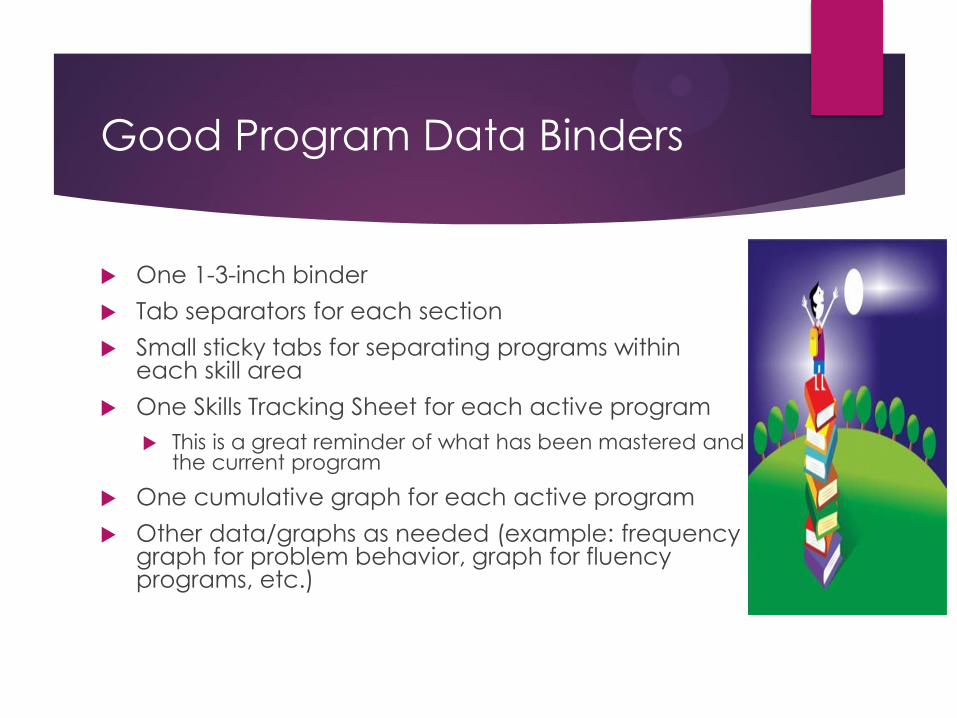
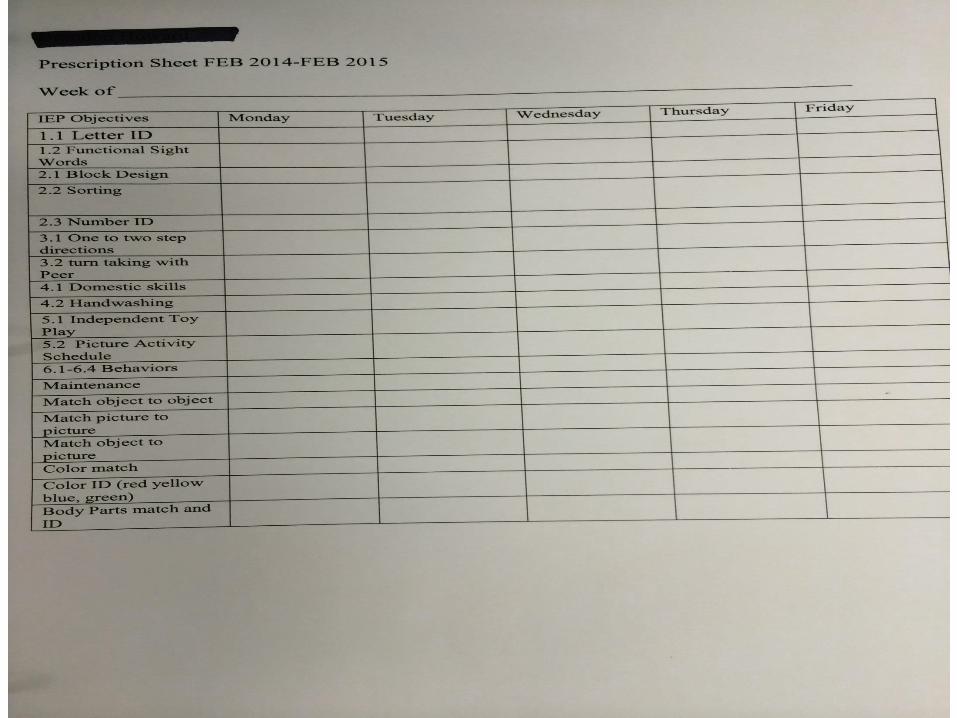
Good Program Data Binders
One 1-3-inch binder
Tab separators for each section
Small sticky tabs for separating programs within each skill area
One Skills Tracking Sheet for each active program
This is a great reminder of what has been mastered and the current program
One cumulative graph for each active program
Other data/graphs as needed (example: frequency graph for problem behavior, graph for fluency programs, etc.)
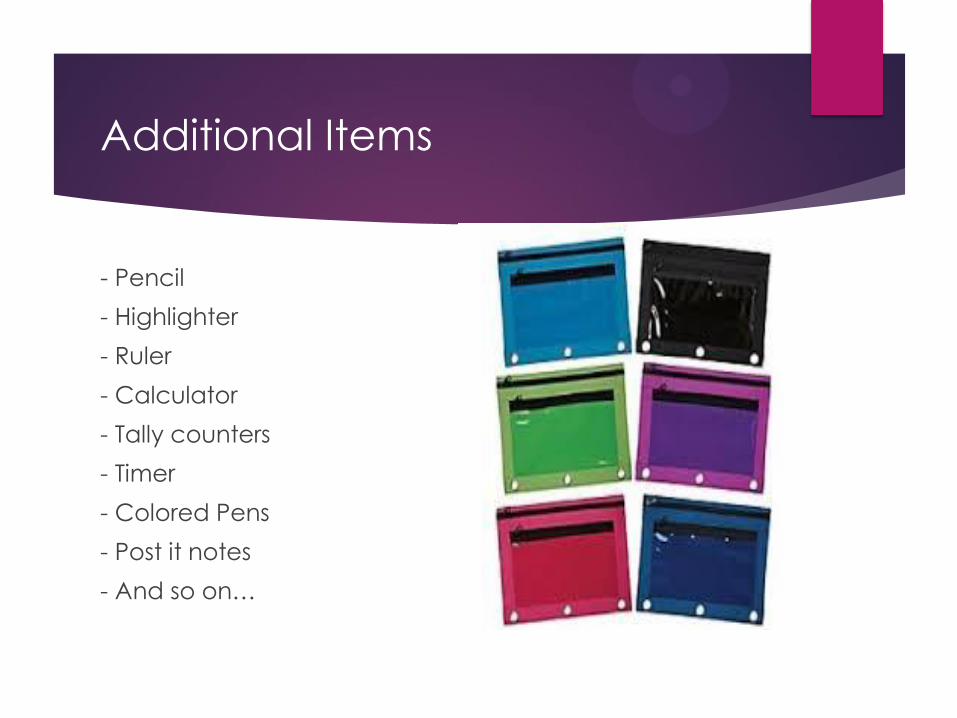
Additional Items
- Pencil
- Highlighter
- Ruler
- Calculator
- Tally counters
- Timer
- Colored Pens
- Post it notes
- And so on…
Let’s take a look!
PLOP
Accommodations
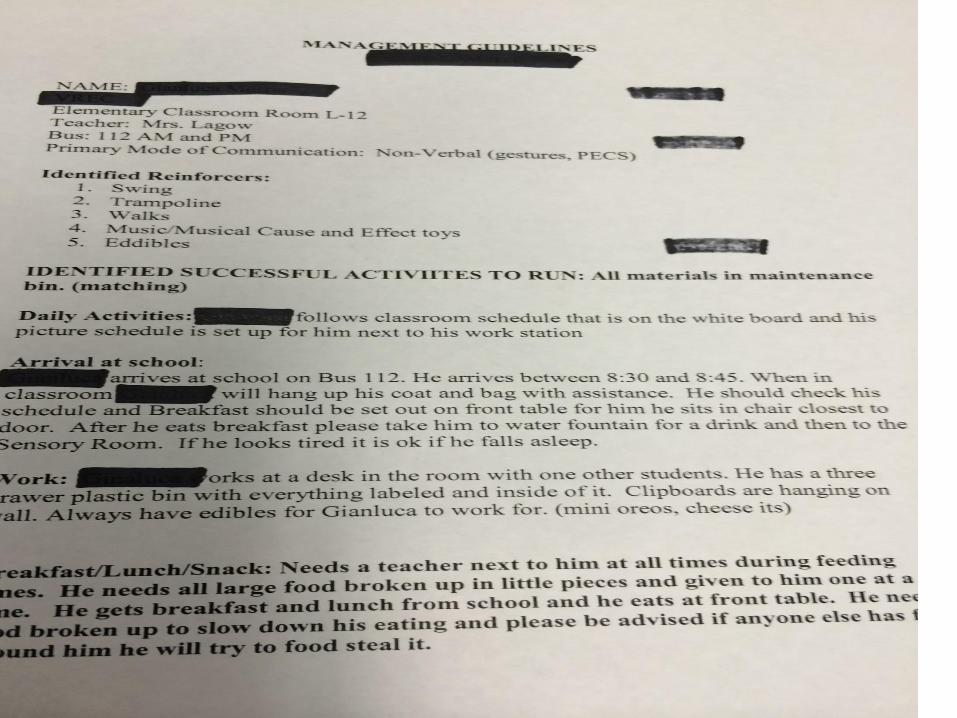
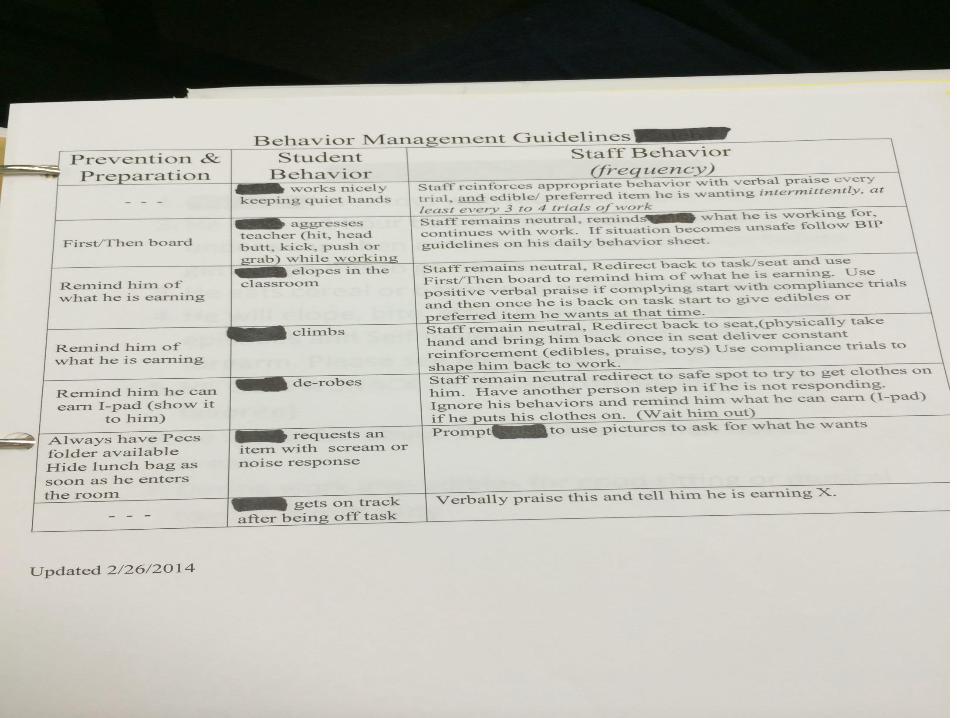
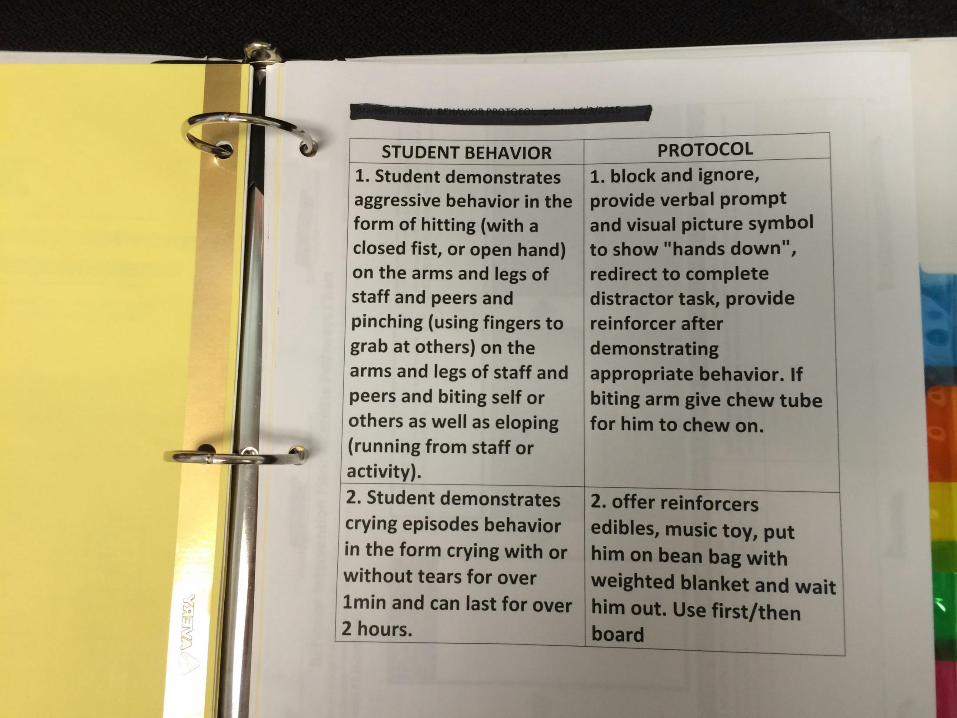
Management Guidelines (Cheat sheet for new staff
or substitutes).
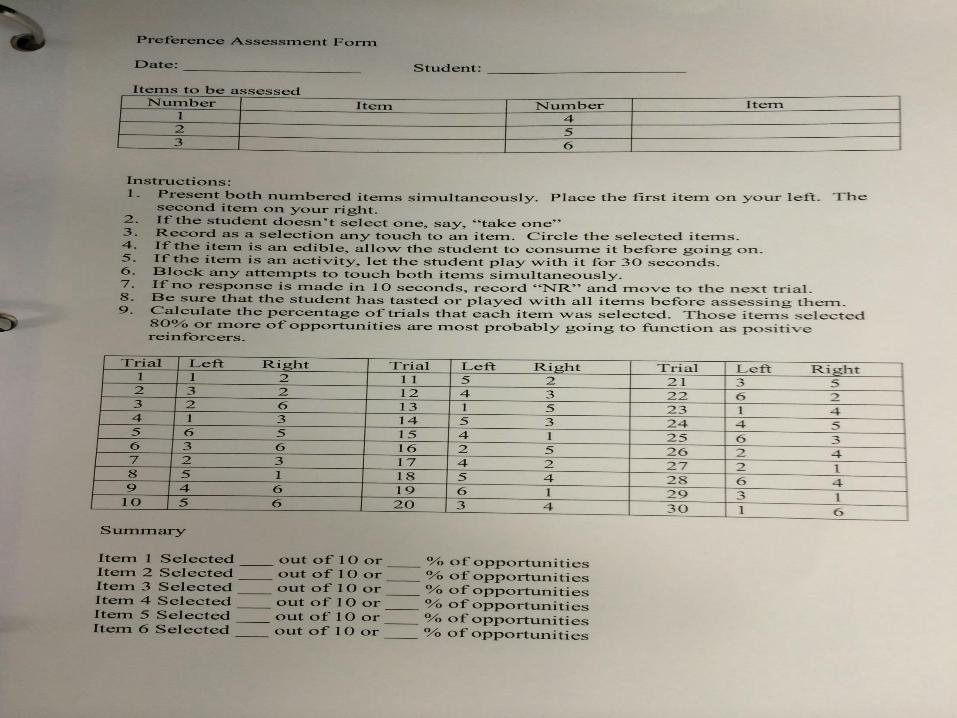
Preference assessments
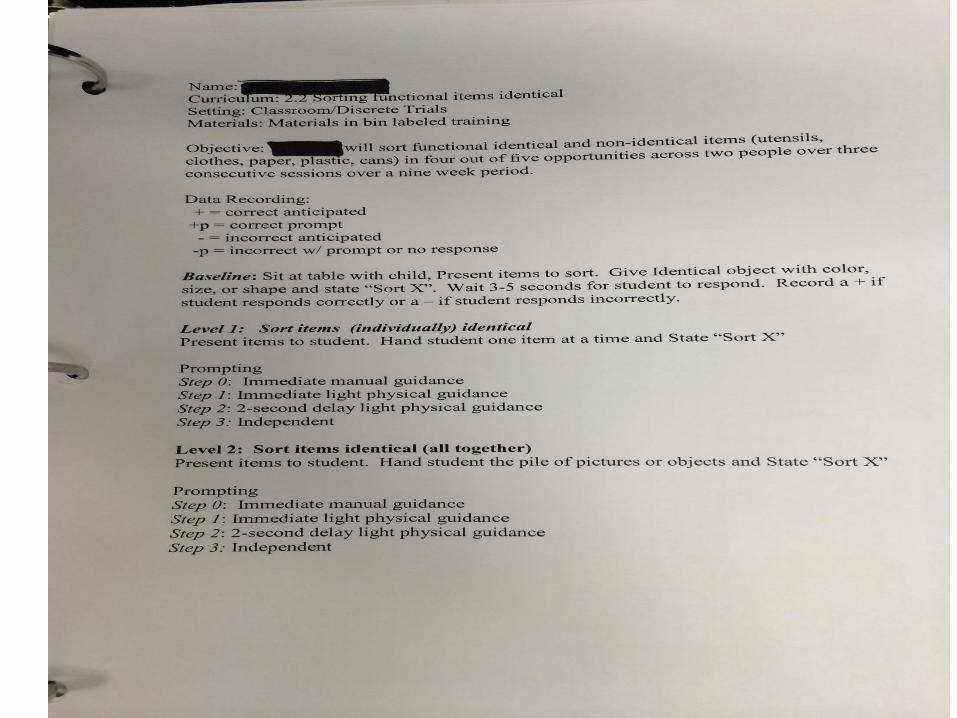
Curriculum Sheets
Describes how to run each program to ensure
consistency.
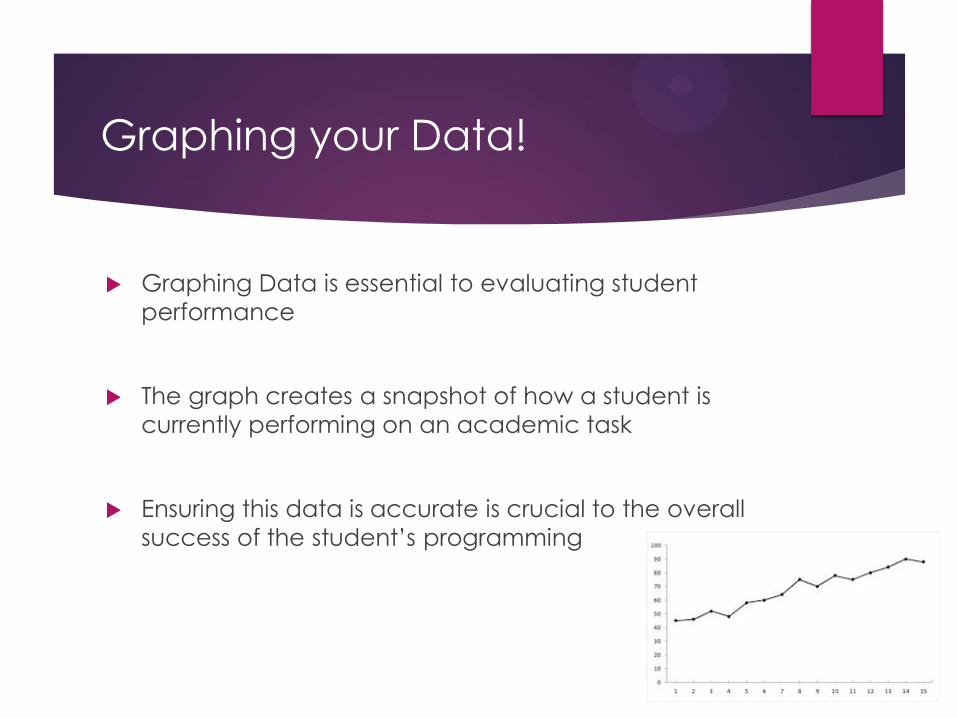
Graphing your Data!
Graphing Data is essential to evaluating student
performance
The graph creates a snapshot of how a student is
currently performing on an academic task
Ensuring this data is accurate is crucial to the overall
success of the student’s programming
The Big Finish!
Why is Data important?
Drives decision making
Provides visual evidence
Credibility
Importance of a Data Binder
Organization
Time-management
Questions????
Contacts
• Bron Hansboro: Instructional Specialist Low
Incidence Disabilitie,
[email protected], 780-4295
• Keri Lagow: Mentor Teacher- Autism/Low Incidence
Disabilities, [email protected] ,780-6267
• Holly Walker: Mentor Teacher-Autism/Low
Incidence Disabilities,
[email protected], 780-6267

WEBSITE
Web.richmond.k12.va.us
Departments
Exceptional Education and
Student Services
Autism Spectrum disorders
Staff