
DATA COLLECTION GUIDELINES FOR Implementing Pavement Preservation...
50
DATA COLLECTION GUIDELINES FOR Implementing Pavement Preservation Projects October 2014 Product of the Guidelines for the Preservation of High-Traffic Volume Roadways (R26)
Transcript of DATA COLLECTION GUIDELINES FOR Implementing Pavement Preservation...

Rutting
Time, years
Threshold
Untreated Pavement
Preservation-Treated
Pavement
Treatment Application
Thermal Cracking
Time, years
Threshold
Preservation-Treated
PavementTreatment Application
Untreated Pavement
IRI
Time, years
Threshold
Preservation-Treated
Pavement
Treatment Application
Untreated Pavement
PCI
Threshold
Treatment Application
Untreated Pavement
Time, years
Preservation-Treated
Pavement
OPI
Threshold
Treatment Application
Preservation-Treated
Pavement Untreated Pavement
Time, years
DATA COLLECTION GUIDELINES FOR
Implementing Pavement Preservation Projects
October 2014
Product of the Guidelines for the Preservation of High-Traffic Volume Roadways (R26)

The second Strategic Highway Research Program (or SHRP2) is a national partnership of key transportation organizations: the Federal Highway Administration, American Association of State Highway and Transportation Officials, and Transportation Research Board. Together, these partners are deploying products that will help the transportation community enhance the productivity, boost the efficiency, increase the safety, and improve the reliability of the nation’s highway system. This report is a work product of the SHRP2 Solution, Guidelines for the Preservation of High‐Traffic‐ Volume Roadways (R26). The product leads are Thomas Van at FHWA, [email protected], and Jameelah Hayes at AASHTO, [email protected]. This report was authored by the subject matter expert, David Peshkin, Applied Pavement Technology, Inc. All rights reserved.

Data Collection Guidelines for Implementing Pavement Preservation Projects
October 2014

Contents
Section Page
Executive Summary ............................................................................................................... 1
Chapter 1. Introduction ......................................................................................................... 3 Background ......................................................................................................................... 3 Objective of Guide .............................................................................................................. 4 Organization of Guide ......................................................................................................... 4
Chapter 2. Overview of Data Needs to Support the Implementation of Preservation on High-Traffic-Volume Roads ................................................................................................. 5 Project and Treatment Selection ........................................................................................ 6 Preservation Test Site Design and Construction................................................................. 6 Preservation Treatment Monitoring and Analysis .............................................................. 8
Chapter 3. Data Collection Guidelines for Project and Treatment Selection ............................ 9 Project Selection ................................................................................................................. 9 Treatment Selection ......................................................................................................... 11
Preliminary Identification of Feasible Treatments—Pavement Condition Assessment ............................................................................................... 12
Final Identification of Feasible Preservation Treatments—Project Needs and Constraints Assessment ............................................................................ 13
Chapter 4. Data Collection Guidelines for Test Site Design and Construction ........................ 15 Test Site Design ................................................................................................................. 15
Data Collection for Test Site Design ...................................................................... 17 Data Collection for Test Site Construction Work Plan .......................................... 18
Test Site Construction ....................................................................................................... 19 Data Collection for Construction Monitoring and Documentation ...................... 19 Data Collection for Post-Construction Pavement Condition ................................ 20
Data Collection Summary ................................................................................................. 20
Chapter 5. Data Collection Guidelines for Preservation Treatment Monitoring and Analysis . 22 Pavement Condition Surveys and Testing ........................................................................ 22 Treatment Cost-Effectiveness Analysis ............................................................................. 23 Data Collection Summary ................................................................................................. 25
Chapter 6. References ......................................................................................................... 27
i

CONTENTS, Continued
Appendix A Data Collection Details for Different Phases of a Preservation Project .............. A-1
Tables
Table 1. Project Suitability for Implementing Pavement Preservation—Consideration of Pavement Type, Traffic, and Overall Condition and Serviceability ..................................................................... 9
Table A-1. Data Elements to Characterize Project or Site ........................................................................ A-1 Table A-2. Data Elements to Characterize Pavement ............................................................................... A-3 Table A-3. Data Elements to Characterize HMA- and PCC-Surfaced Pavement Distresses ...................... A-4 Table A-4. Pavement Surface Characteristics Data Elements ................................................................... A-5 Table A-5. Examples of Overall Pavement Condition Indicators .............................................................. A-6 Table A-6. Data Items for Assessing Preservation Project Selection ........................................................ A-9 Table A-7. Data Elements to Assess Preservation Treatment Selection ................................................. A-10 Table A-8. Data Items for Assessing Project Needs and Constraints ...................................................... A-11 Table A-9. Data for Treatment Cost-Effectiveness Analysis and Final Selection .................................... A-12 Table A-10. Data for Preservation Test Site Design and Treatment Construction ................................. A-13
Figures
Figure 1. Process of Selecting the Preferred Preservation Treatment for High-Traffic-Volume Roadways ............................................................................................... 7
Figure 2. Summary of Data Collection Needs for Project Selection ........................................................... 11 Figure 3. Summary of Data Collection Needs for Treatment Selection ...................................................... 14 Figure 4. Recommendations regarding the types of performance observations to support analysis
of preservation treatment effectiveness. .............................................................................. 16 Figure 5. Summary of Data Collection Needs for Preservation Test Site Design and Construction ........... 21 Figure 6. Pavement Performance Trends Using Different Condition Measures ........................................ 24 Figure 7. Illustration of Benefits and Costs Associated with a Pavement Preservation Treatment
Strategy—SHRP2 Guidelines BCR Analysis Procedure ........................................................... 25 Figure 8. Summary of Data Collection Needs for Treatment Monitoring and Evaluation ......................... 26 Figure A-1. Example Illustration of Windows of Opportunity for Pavement Preservation,
Rehabilitation, and Reconstruction ..................................................................................... A-8 Figure A-2. Identification of Measures and Criteria for Preservation Project Selection. ......................... A-8 Figure A-3. All-inclusive Windows of Opportunity for Pavement Preservation ....................................... A-9
ii

Acronyms
AADT average annual daily traffic
AASHTO American Association of State Highway and Transportation Officials
BCR benefit-to-cost-ratio
ChS chip seal
CIR cold in-place recycling
CrF crack fill
CrS crack seal
DBR dowel bar retrofit
DGd diamond grinding
DGv diamond grooving
DOT Department of Transportation
FDR full-depth repair
FN40R friction number measured with ribbed tire at 40 miles per hour
FN40S friction number measured with smooth tire at 40 miles per hour
Guidelines Guidelines for the Preservation of High-Traffic-Volume Roadways
HIR hot in-place recycling
HMA hot-mix asphalt
HMAOL thin HMA overlay
IRI International Roughness Index
JRS joint resealing
LCCA life-cycle cost analysis
M/HMAOL mill and thin HMA overlay
MS microsurfacing
OBSI on-board sound intensity
PCC Portland cement concrete
PCI Pavement Condition Index
iii

Acronyms and Abbreviations
PDR partial-depth repair
PM profile milling
PMS pavement management system
RSI remaining service interval
RSL remaining service life
SlS slurry seal
SHRP2 Strategic Highway Research Program
UBWC ultra-thin bonded wearing course
UW ultra-thin whitetopping
iv
Executive Summary
Pavement preservation is an important strategy used by highway agencies to extend the service life of roads. If properly timed, designed, and constructed, preservation treatments can prevent, delay, or slow distress from developing in a pavement and correct or restore its functionality and serviceability. The relatively small investments associated with preservation activities and the potential significant performance life increases make them a valuable part of agencies’ program of managing pavements.
Applying preservation treatments has generally been targeted to lower-volume roadways. While several agencies have successfully applied preservation to high-traffic-volume roads, this preservation application presents a complicated set of challenges that includes increased risk of failure associated with treatment durability under more and heavier traffic loads, greater liability associated with failure, shorter available construction windows due to higher demand for uncongested traffic flow, and greater expectations for a high performance, aesthetically appealing road.
The second Strategic Highway Research Program tackled the issue of preservation of high-traffic-volume roadways through the conduct of its Renewal research project R26. That study identified best practices through a comprehensive literature review and highway agency survey and used the information to develop a guide document, Guidelines for the Preservation of High-Traffic-Volume Roadways (the Guidelines; Peshkin et al., 2011a) and companion report, Preservation Approaches for High-Traffic Volume Roadways, (Peshkin et al., 2011b) to help expand the use of preservation techniques on roads with higher volumes. The Guidelines help agency personnel determine which highway projects are suitable candidates for preservation and which treatments are most feasible for use considering key factors such as traffic volume, existing pavement condition, environmental conditions, work zone requirements, and expected performance. The Guidelines also detail a process for evaluating the cost-effectiveness of alternative treatments and for selecting the preferred treatment based on relevant economic and noneconomic factors.
To expand the use of the Guidelines and the wider use of pavement preservation techniques on higher-volume roads nationally, the Federal Highway Administration and the American Association of State Highway and Transportation Officials developed an implementation plan consisting of technical support, tool development, workshops and peer exchanges, and communications and marketing efforts. An Implementation Assistance Program was established to provide opportunities for highway agencies to receive technical and financial assistance in integrating the Guidelines into their everyday practices.
1

In 2013, 14 agencies were selected for participation in the R26 Implementation Assistance Program. Nearly all participants planned to implement the Guidelines through the conduct of actual preservation projects in the field. This Data Collection Guidelines for Implementing Pavement Preservation Projects document was prepared specifically for the 14 implementing agencies to help them identify the information needed in their projects and correspondingly evaluate the performance and benefits of their preservation treatments. While it was developed with high-traffic-volume roadways in mind, it is applicable to any preservation projects in which the collection and analysis of performance data are envisioned. This document will also be of interest to other highway agencies challenged with implementing pavement preservation and in need of establishing effective, economical practices related to the matter. All highway agencies can benefit when such practices are a seamless part of their overall pavement program.
2

Chapter 1. Introduction
Background
This document provides data collection guidance to highway agencies interested in improving their process of implementing pavement preservation techniques on all roadways, including high-traffic-volume roads. The information presented is intended to help agencies identify data needed for a number of decisions and analyses, including the following:
• Evaluating the suitability of roadway projects for pavement preservation and the feasibility of different treatments for a selected project
• Designing the selected project to accommodate a selected treatment and constructing the treatment according to specifications
• Monitoring the performance of the constructed treatment and evaluating its cost-effectiveness in a high-traffic-volume scenario
This document is based on information in key pavement preservation reports, most notably those developed under the second Strategic Highway Research Program’s (SHRP2) Project R26. This document is also based on the pavement preservation and pavement management practices of several state and local highway agencies participating in the Implementation Assistance Program, which is a joint initiative of the Federal Highway Administration, the American Association of State Highway and Transportation Officials (AASHTO), and SHRP2.
The data requirements for project and treatment selection are outlined in the SHRP2 reports Guidelines for the Preservation of High-Traffic-Volume Roadways (Guidelines; Peshkin et al., 2011a) and Preservation Approaches for High-Traffic-Volume Roadways (Peshkin et al., 2011b). These documents describe the various types of preservation treatments for hot-mix asphalt (HMA) and Portland cement concrete (PCC)-surfaced pavements and detail the processes of selecting the preferred preservation treatment at the project level.
The data requirements for preservation treatment construction and monitoring are derived from various sources, including the Guidelines document, Pavement Maintenance Effectiveness (Smith et al., 1993), and the California Department of Transportation’s Pavement Preservation Studies Technical Advisory Guide (Jones, 2007). These latter two documents in particular contain a wealth of information and guidance on planning, designing, installing, monitoring, and evaluating experimental pavement preservation treatments.
3

Objective of Guide
The primary objective of these guidelines is to assist agencies engaged in collecting data that can subsequently be used to evaluate the performance and benefits of their pavement preservation treatments. These guidelines are also intended to assist highway agencies with identifying data to collect to improve their process of implementing pavement preservation techniques.
Organization of Guide
This document consists of six chapters and an appendix, including this introductory chapter, and is organized as follows:
• Chapter 2 provides an overview of the data needed to support implementing pavement preservation.
• Chapter 3 presents data collection guidelines for identifying a suitable project and preservation treatment for implementation and study.
• Chapter 4 provides data collection guidelines for designing the test or evaluation site and constructing the proposed preservation treatment.
• Chapter 5 provides data collection guidelines for monitoring the performance of the constructed treatment and conducting a cost-effectiveness analysis of the treatment.
• Chapter 6 provides references cited in this document.
• Appendix A provides more detail on data elements that could be collected during various stages of a pavement preservation project.
4

Chapter 2. Overview of Data Needs to Support the Implementation of Pavement Preservation
This chapter presents an overview of the data needs to support implementing pavement preservation projects. While the focus is on high traffic-volume roads, the content is applicable to roads of all traffic volumes. The data needs are described in three separate sections covering the following topics: project and treatment selection, preservation test site design and construction, and preservation treatment monitoring and analysis.
Because different highway agencies have different abilities and resources available to collect data, the data needs are grouped into the following three categories for consideration by the pavement practitioner:
• Level 1—Comprehensive
− Detailed pavement history and performance data and highway project and site data are available and easily accessible through agency database systems.
− Project-level pavement condition surveying and testing equipment and personnel are readily available or can be easily scheduled for use.
− Detailed performance analysis of time-series pre-treatment and post-treatment pavement condition data can be performed.
• Level 2—Intermediate
− Pavement history and performance data and highway project data are somewhat limited or may involve a significant level of effort to obtain.
− Project-level pavement condition surveying and testing activities are readily available but may be limited in terms of monitoring frequency or the level of condition data that can be collected.
− Detailed performance analysis is limited to immediate pre-treatment pavement condition data and post-treatment time-series pavement condition data.
• Level 3—Basic
− Pavement history and performance data are limited in terms of time-series completeness or frequency, specific pavement cross-section or treatment applications, specific distresses, and level of sampling and/or testing. Accessibility of pavement and project data is limited.
5

− Project-level pavement condition surveying and testing activities are not readily available, resulting in no immediate pre-treatment pavement condition data and less-than-desirable monitoring frequency or level of condition data.
− Detailed performance analysis is limited to post-treatment time-series pavement condition data.
Appendix A describes the full set of data needs, and Chapters 3 through 5 provide further details concerning the data needed for each level and how and why the data should be collected, while Appendix A describes the full set of data needs.
Project and Treatment Selection
As discussed previously, the SHRP2 Guidelines document outlines data requirements for preservation project and treatment selection. The requirements are identified in the selection process flowchart presented in that document and repeated in Figure 1. The types of data needed throughout the selection process relate to the history of the existing pavement (e.g., physical makeup and condition), the characteristics of the project and/or site (e.g., location, dimensions, environment, and traffic), and project construction constraints and the treatment performance needs and expectations (i.e., factors that might preclude or diminish the use of a particular preservation treatment). Information on the agencies’ pavement management practices are also relevant, including the pavement condition indicators used to track and predict performance and the condition trigger and threshold values used to determine when and which preservation and rehabilitation treatments should be applied.
Preservation Test Site Design and Construction
Once agencies have selected their projects and preservation treatments, the next steps involve designing the projects to accommodate the treatment studies and then constructing the treatments. The data needed to support the test site design are associated with establishing a formal test site in the field. The test site would consist of multiple test sections for evaluating treated-pavement performance (and untreated pavement performance, as needed).
The data needed to support test site construction relate to the process used to install the treatment, weather and traffic conditions present at time of construction, quality of the constructed treatment, problems encountered and solutions applied during treatment installation, and resulting pavement condition. The data collection activities ensure that the preservation test sections are installed properly and in accordance with the design plans and specifications so that they are given the best opportunity to perform to their potential.
6

Figure 1. Process of Selecting the Preferred Preservation Treatment for High-Traffic-Volume Roadways (Peshkin et al., 2011a).
Current and Historical Pavement Performance Data (from field surveys and testing and/or PMS database)
Overall condition indicator (e.g., Pavement Condition Index, Pavement Condition
Rating) Individual distress types, severities, and extents Smoothness (e.g., International Roughness Index, Performance Index, Present
Serviceability Index, Present Serviceability Rating) Surface and subsurface drainage characteristics Safety characteristics:
Friction and/or texture (e.g., Friction Number, Mean Profile Depth/Mean Texture Depth, International Friction Index)
Crashes Pavement–tire noise
Develop Preliminary Set of Feasible Preservation T
Historical Design, Construction, and Maintenance and
Rehabilitation Data Pavement type and
cross-sectional design Materials and as-built
construction Maintenance and
rehabilitation treatments (i.e., materials, thicknesses)
Develop Final Set of Feasible Preservation Treatments
Select the Preferred Preservation Treatment • Conduct cost-effectiveness analysis Benefit-cost analysis Life-cycle cost analysis
• Evaluate economic and noneconomic factors
Pavement Preservation
or Major Rehabilitation?
Major
Rehabilitation
Pavement Preservation
Develop Feasible Rehabilitation
Treatments
Assess Needs and Constraints of Project
Performance Needs Targeted and/or required performance Expected performance of treatments
Existing pavement condition effects Traffic effects (e.g., functional class
and/or traffic level) Climate and/or environment effects Construction quality risk effects (e.g.,
agency and contractor experience, materials quality)
Construction Constraints Funding Time of year of construction Geometrics (e.g., curves, intersections,
pavement markings, and striping) Work zone duration restrictions (e.g., facility
downtime) Traffic accommodation and safety Availability of qualified contractors and quality
materials Environmental considerations (e.g., emissions
and air quality, recycling, and sustainability)
7

Preservation Treatment Monitoring and Analysis
Preservation treatment monitoring and analysis is the stage in which almost all treatment performance data are collected and analyzed to determine each treatment’s value in the specific project environment. The data needs to support this effort are primarily tied to the condition of the preservation-treated pavements (and untreated pavements, if “do-nothing” test sections are included), as determined through regularly scheduled distress surveys and surface testing. They are also linked to pretreatment historical performance, documented treatment construction costs, and agencies’ pavement management and life-cycle costing practices.
8

Chapter 3. Data Collection Guidelines for Project and Treatment Selection
This chapter provides data collection guidance for selecting a suitable roadway project for preservation and identifying a feasible treatment (or multiple treatments) for implementation on that project. Again, while the focus is on high-traffic-volume roadways, the guidelines could be applied to all potential projects. The selection process shown in Figure 1 is used to determine whether a project is suitable for preservation and, if so, what treatments are appropriate for use. Because a SHRP2 R26 implementation will likely involve a treatment with little or no performance history under a high-traffic-volume scenario, the last two steps in the selection process—cost-effectiveness analysis and evaluation of economic and noneconomic factors—do not apply to this stage. However, cost-effectiveness analysis will be a key component in the treatment monitoring and analysis stage, as outlined in Chapter 5.
Project Selection
Identifying candidate pavement preservation projects typically begins with analyses of the agency pavement management system (PMS) database. The PMS database contains historical work activities and cross-sectional details for each pavement section in the network, as well as historical condition data collected via manual or automated distress surveys and surface characteristics testing. Agencies can identify pavement sections in the network that meet the criteria outlined in SHRP2’s Guidelines (Peshkin et al., 2011a) and summarized in Table 1 by filtering the data according to the criteria listed.
Table 1. Project Suitability for Implementing Pavement Preservation—Consideration of Pavement Type, Traffic, and Overall Condition and Serviceability
Consideration Guidelines Criteria Types of treatments suitable for existing pavement type
HMA-Surfaced Pavements CrF, CrS, SlS, MS, ChS, UBWC, HMAOL, M/HMAOL, PM, HIR, CIR, UW PCC-Surfaced Pavements CrS, JRS, DGd, DGv, PDR, FDR, DBR, UBWC, HMAOL
High-traffic-volume designation for rural and urban settings
AADT more than 5,000 vehicles per day (rural) AADT more than 10,000 vehicles per day (urban)
9

Table 1. Project Suitability for Implementing Pavement Preservation—Consideration of Pavement Type, Traffic, and Overall Condition and Serviceability
Consideration Guidelines Criteria Age-based window of opportunity for pavement preservation treatments
HMA-Surfaced Pavements 2 to 12 years PCC-Surfaced Pavements 5 to 15 years
PCI-based window of opportunity for pavement preservation treatments
HMA-Surfaced Pavements PCI: 60 to 95 PCC-Surfaced Pavements PCI: 65 to 90
Possible pavement surface characteristics issues
Smoothness IRI less than 140 inches per mile Friction Smooth tire friction number at 40 miles per hour test speed less than 30 to 32 Pavement-Tire Noise On-board sound intensity more than 106 to 108 decibels
Table Notes: AADT annual average daily traffic ChS chip seal CIR cold in-place recycling CrF crack fill CrS crack seal DBR dowel bar retrofit DGd diamond grinding DGv diamond grooving FDR full-depth repair HIR hot in-place recycling HMA hot-mix asphalt
HMAOL thin HMA overlay IRI International Roughness Index JRS joint resealing M/HMAOL mill and thin HMA overlay MS microsurfacing PCC Portland cement concrete PCI Pavement Condition Index PDR partial-depth repair PM profile milling SlS slurry seal UBWC ultra-thin bonded wearing course UW ultra-thin whitetopping
During the project selection process, agencies might want to focus on a particular type of high-traffic-volume road for preservation implementation. This focus could be governed by factors such as facility type, highway setting, lane configuration, annual average daily traffic (AADT), and pavement type. For instance, the implementation focus might be on a treatment(s) that can be used on moderately high-traffic-volume, four-lane rural arterials mostly comprising flexible and composite pavements, or it might be on a treatment(s) that can be used on
Helpful Hint: Because of the experimental nature of the preservation project implementation, candidate pavement sections must be of sufficient length for applying a treatment in a normal construction manner and for including an untreated control section, if needed. An untreated control section provides a basis for determining whether the applied preservation treatment is more cost-effective than a “do-nothing” approach. A control section may also consist of a section with the agency’s typical or standard treatment practice.
10
extremely high-traffic-volume, six- to ten-lane urban expressways comprising largely concrete pavements.
Figure 2 summarizes the data collection needs for project selection. For the three categories of data, the minimum set of data items that should be evaluated are shown. The “hows and whys” of evaluating data to select projects are also listed. Agencies can use the process shown in Figure 2 as a checklist for ensuring that they are collecting the right types of information and using the right evaluation methods in selecting a project.
Figure 2. Summary of Data Collection Needs for Project Selection
Treatment Selection
Once agencies have identified and selected for study their suitable preservation project (or multiple projects), they can shift their focus to evaluating the treatment’s feasibility for that
PROJECT SELECTION
HOW to Evaluate • Query and review databases and data files Pavement management system database Inventory Traffic Design Construction and materials Maintenance management system database
• Conduct special field review or survey Project or site conditions and size Pavement distress survey Pavement surface testing
WHY Evaluate • Identify good candidate projects for study of a
preservation treatment applied to a high-traffic-volume road.
WHAT to Evaluate
Data Item
Data Need Category
1 2 3
Pavement type (e.g., HMA, PCC)
Pavement age
Traffic level (AADT)
Highway setting (e.g., urban, rural)
Existing pavement condition–overall measure (PCI or equivalent measure [e.g., PSR, PQI])
Historical pavement condition–overall measure (PCI or equivalent measure) Optional X
Existing pavement surface characteristics–IRI, FN40S, and/or OBSI levels
Historical pavement surface characteristics– IRI, FN40S, and/or OBSI levels Optional X
Existing pavement condition–prominent structural distresses (e.g., rutting, faulting, fatigue cracking) and materials distresses (e.g., stripping or tender mix for HMA; ASR or major D-cracking for PCC)
Existing pavement condition–prominent other distresses X X
11

project. As outlined in the Guidelines, this is a two-step process: (1) first measure treatment capabilities and functions against existing pavement conditions, and (2) then assess the impacts of project needs and constraints on treatment construction and performance. Details of these steps and the data collection needs are provided in the sections below. It should be noted that the end result of the treatment selection process is identifying a viable treatment (or multiple treatments) that can be formally tested on the selected roadway project. While all treatment types recommended in Guidelines should ideally be evaluated, there might only be an interest in evaluating a subset of those treatments. Examples might include the following:
• Treatments commonly used by an agency on lower volume roads that have not yet beentried on higher volume roads due to the perceived risk of failure
• Treatments that have been tried once or twice on higher volume roads with poor results
• Treatments not commonly used by an agency that other agencies have found to beeffective and economical in high-traffic-volume environments
• Treatments that are a refinement of a conventionally used material and/or process andare expected to provide greater durability under traffic loadings than the conventionalmaterial and/or process (e.g., a material containing modified binder or special aggregate)
• Treatments that comprise a combination of treatments designed to address multiplepavement deficiencies (e.g., thin HMA overlay placed on a rubberized asphalt chip seal)
Preliminary Identification of Feasible Treatments—Pavement Condition Assessment
Agencies should further examine the selected pavement project with respect to the distresses and surface characteristics that exist and what their historical trends have been. They can query the PMS database to obtain the most current and historical sets of distress data (i.e., types, severities, and amounts) and surface characteristics data (i.e., smoothness, friction, noise) for the project’s pavement sections. For a reliable suitability assessment, distress and smoothness data should reflect conditions within the last year, and friction and noise data should represent conditions within the last 2 years. Ideally, agencies should examine the time-series trends of each performance parameter to ensure that the most recent year’s data are reasonable.
The SHRP2 Guidelines contains treatment feasibility matrices for determining the appropriateness of individual treatments for pavements that exhibit different distress types and severity levels and different surface characteristics issues (Peshkin et al., 2011a). Agencies should evaluate how well different treatments fit the selected project using these matrices. Because each agency is unique in how it collects, processes, and uses pavement condition data to make decisions about treatments, the ability to fully use the Guidelines feasibility matrices may be reduced. For example, some agencies may not measure certain distresses, and some may use
12

different measures of distress severity and distress extent. Also, for windows of opportunity, some agencies may use an overall distress indicator other than the Pavement Condition Index (PCI), and some may use a remaining life indicator rather than pavement age.
Where information about a particular distress or distresses for the selected project is missing, agencies should consider evaluating (via manual or automated surveys) pavement in the field to ascertain the existence, severity, and extent of the distress. Agencies should also verify other distresses for a complete and up-to-date assessment of pavement conditions. In a similar vein, if the most recent condition data in the PMS database are more than 1 year old or the preservation treatment will not be constructed within the next year, then agencies should conduct a detailed field evaluation of the selected project to provide the best possible assessment of treatment feasibility.
Final Identification of Feasible Preservation Treatments—Project Needs and Constraints Assessment
Agencies must evaluate preservation treatments deemed suitable for addressing the existing pavement conditions of the selected project in terms of project or site factors that could affect treatment placement and performance. For instance, the traffic levels and highway setting may be too extreme for a treatment in terms of a treatment’s durability (i.e., ability to perform for some expected timeframe), or the climate and facility type may be such that the time opportunities for constructing the treatment are too limited (e.g., short work zone durations, short or poorly timed construction windows). Additionally, some project geometrics may not be conducive to treatment placement (e.g., construction operation constraints, vertical constraints) or the site location may be too far removed from qualified contractors or the needed materials.
The Guidelines contains a second set of treatment feasibility matrices for determining whether a treatment is suitable for a project having unique needs and constraints (Peshkin et al., 2011a). Agencies should determine how well different treatments fit the selected project using these matrixes. Figure 3 summarizes the data collection needs for treatment selection, divided into the three data need categories. This figure can be used as a checklist for ensuring that the right types of information are collected and the right evaluation methods are used in establishing the preservation study.
13

Figure 3. Summary of Data Collection Needs for Treatment Selection
TREATMENT SELECTION
WHAT to Evaluate
Data Item
Data Need Category
1 2 3
Preliminary Treatment Feasibility
Pavement age
Existing pavement condition–overall measure (PCI or equivalent measure)
Historical pavement condition–overall measure (PCI or equivalent measure) Optional X
Existing pavement condition–prominent distress types and severity levels (e.g., L, M, H)
Existing pavement surface characteristics–IRI, FN40S, and/or OBSI levels
Historical pavement surface characteristics–IRI, FN40S, and/or OBSI levels Optional X
Final Treatment Feasibility
Treatment performance measures to be used–overall measure
Treatment performance measures to be used –surface characteristics measures
Treatment performance measures to be used –key distresses Optional X
Treatment performance expectations–treatment life considering combination of overall measure, surface characteristic measures, and key distresses
Optional X
Treatment performance expectations–treatment life considering combination of overall measure and surface characteristic measures
X
Treatment performance impact of traffic–AADT/lane and percent trucks (to establish high and very high traffic categories)
Optional X
Treatment performance impact of traffic–subjective estimates of high and very high traffic
X
Treatment performance impact of climate–freeze index (FI) Optional X
Treatment performance impact of climate–project location relative to R26 climate zone map
X
Treatment performance impact of construction quality risk–subjective estimates
Construction constraints–work zone duration restrictions (e.g., overnight or single shift, weekend, extended duration)
HOW to Evaluate
• Query and review databases and data files Pavement management system database Inventory Traffic Design Construction and materials Maintenance management system database
• Conduct special field review or survey Project or site conditions and size Pavement distress survey Pavement surface testing
WHY Evaluate
• Develop list of feasible preservation treatments proposed for study and implementation on a selected high-traffic-volume road.
14

Chapter 4. Data Collection Guidelines for Test Site Design and Construction
This chapter provides data collection guidance and recommendations for designing the selected project to serve as a SHRP2 Guidelines preservation test site and for constructing the planned preservation treatment at that site. The design aspects relate mostly to the project’s experimentation component, such as designing and laying out of the test site, conducting pre-construction surveys and testing, and developing a test site construction work plan. Although normal design activities, such as developing a mix design, preparing overall project design plans, and developing specifications and testing requirements, are not specifically covered, they are discussed where appropriate.
The construction aspects covered include construction monitoring and documentation, post-construction surveys and testing, and the development of a test site construction report. Again, while normal construction activities, such as inspection and laboratory and field testing, are not specifically covered, they are discussed where appropriate.
Test Site Design
The preservation test site design depends on each agency’s goals and objectives for the study. If one treatment is planned solely for determining its performance under high-traffic-volume conditions, then either the entire project length can be used for the proposed treatment or the project can be subdivided into two sections: one for the treatment and one for an untreated control section (or a control section treated with the agency’s typical treatment practice). As shown in Figure 4, the advantage of including an untreated control section is the ability to graph the actual performance trend for the “do-nothing” approach rather than a composite trend of its actual and estimated performance.
If multiple treatments are planned for comparing treatment performance and cost-effectiveness, then the project must be subdivided into test sections of near equal length to accommodate each treatment (and an untreated control section, if needed). As noted earlier, the project must be sufficiently long enough to apply each treatment in its normal manner and to include an untreated control section, if needed. The project must also be long enough to
Helpful Hint: Agencies may wish to use a commonly used treatment as a control for comparing new or refined versions of the same treatment or a combined application of that treatment with another. Other study goals that could impact the test site design include successfully applying a treatment over time or using a supplemental shoulder treatment adjacent to mainline primary treatment.
15

create a series of test sections that help to minimize performance biases associated with variation throughout the project (e.g., pavement condition, traffic, geometry, structural and support conditions) and the presence of interfering items (e.g., intersections, interchanges, sharp curves, steep grades, bridges, deep cuts or high fills).
Figure 4. Recommendations regarding the types of performance observations to support analysis of preservation treatment effectiveness (adapted from Peshkin et al., 2005).
Test site layout will also be affected by how an agency decides to evaluate treatment performance. Although specific forms of distress and smoothness and an overall distress indicator are commonly used to analyze treatment or treated-pavement performance, other parameters may be more appropriate for evaluation. For instance, preservation treatments are sometimes applied to improve the safety and comfort of the traveled way. If the study is expected to examine friction, surface texture, or other safety characteristics (e.g., splash and/or spray, hydroplaning potential, cross-slope), then an agency will need to coordinate testing these items. Similarly, if the noise-reduction properties of the planned treatment are of interest, then an agency will need to incorporate pavement-tire noise testing into the study. Furthermore, because preservation treatments are believed to help preserve structural integrity through sealing, waterproofing, and rejuvenation, agencies might want to monitor treated pavement
Estimated Untreated Pavement Performance Historical condition of
pavement prior to application of
treatment is projected into future to the
established condition threshold level
Unacceptable Condition Threshold Level (Repair and/or Rehabilitation Trigger)
Pavement Condition
Time, years
Application of Preservation Treatment
Immediate Pre-Treatment Condition Level
Existing Pavement Structure
Very Poor
Very Good
Actual Untreated Pavement Performance
Actual condition of untreated control section is monitored simultaneously with preservation-treated
test section until established condition
threshold level is reached
Preservation-Treated Pavement Performance
Actual condition of preservation test section is monitored simultaneously with
untreated control section until established condition threshold level is
reached
16

structural capacity. Nondestructive testing using a falling weight deflectometer or other device would address this need.
Data Collection for Test Site Design
To create the layout of project test sections, agencies need to obtain and review several data elements. They might have already been compiled these data as part of the effort to select the project, whereas other data may require further querying of the PMS database or other information systems (e.g., design, construction, inventory, history, traffic). The most critical data agencies will need to collect are part of a pre-construction survey and testing effort, which in addition to providing a more recent measurement of pre-treatment pavement condition, will help determine the following:
• Traffic flow characteristics throughout project—Traffic volume and composition (AADTand percent trucks), posted speeds, and locations of unique traffic loadings or maneuvers
• Structure and foundation throughout project—Locations where pavement type orsubgrade support are drastically different than the project as a whole (destructive and/ornondestructive testing will provide the best indications of this)
• Roadway geometrics throughout project—Locations of sharp curves, steep grades, deepcuts, and high fills
• Roadway events throughout the project—Locations of intersections, interchanges,bridges, railroad crossings, and other possible interfering items
• Other roadway assets throughout the project—Locations of overhead structures, curbsand gutters, manholes, and other items that may pose a vertical constraint
• Pavement distress throughout project (collected via manual or automated distresssurveys)—Locations where distress types, severities, and extents drastically differ fromthe project as a whole
• Pavement surface characteristics throughout project (collected via surfacecharacteristics testing)—Locations where smoothness, friction, texture, or other surfaceproperties drastically differ from the project as a whole
Based on the information collected, an implementing agency must devise a layout of test sections that facilitates a fair performance comparison of the planned treatments (and a “do-nothing” treatment, if included) and uses existing historical pavement condition data. To this end, the test section boundaries should match the boundaries of individual PMS sections so that historical pre-treatment condition data can be used for analysis along with future long-term condition monitoring data. If the length of individual PMS sections and/or the length of segments
17
unsuitable for testing are too long, thereby preventing an agency from accommodating the planned number of test sections, then agencies should consider establishing shorter test sections (528-foot-long minimum). For this option to be viable, the historical pavement condition data must be available on shorter intervals than the PMS section length. While this usually means that the distress data must have been collected using automated systems, manually collected distress data could exist for these shorter intervals.
Replicate test sections for each treatment are strongly encouraged for statistical validity of the performance results. If directional differences in the factors listed above do not exist, then replicates can be established by direction. Alternatively, if PMS sections can be subdivided into shorter intervals with respect to condition data, then those shorter intervals could be used as replicates as well.
Whichever way the replicate test sections are designated and arranged, it is important that pre-treatment pavement condition (e.g., distresses, surface characteristics) data exist for each test section. In addition, if agencies use manual surveys for the distress survey, then they should supplement the data with photographs or video to provide a visual reference if needed in the future.
Agencies should enter all data collected for each test section from both historical files and newly performed surveys and testing into a preservation project database. This database can be a simple spreadsheet program like Microsoft Excel® or a more comprehensive database management system like Microsoft Access®. The agency’s PMS database might also be used, especially if subsequent data collection is accomplished as part of routine pavement management processes. Regardless of which database system is used, it is important that it can store, organize, and process data for analysis and reporting.
Data Collection for Test Site Construction Work Plan
To aid the contractor or maintenance unit responsible for constructing the planned preservation treatment and to provide a starting point for a well-documented test site construction report, agencies should prepare a work plan in advance of the construction work. This work plan should provide specific details about the planned treatment, such as the material types composing the treatment, treatment design application rate and thickness, equipment and procedures to be used in its placement, and any pre-application repairs or preparation work that may be required (e.g., milling to a specified depth, patching of a specified amount).
The work plan also should include a map of the test site showing the layout and locations of formal test sections, as well as the designated areas throughout the project in which the treatments must be placed (e.g., the treatment may be designated for placement between mileposts 12.4 and 16.2, but due to locations of nonuniformity, formal test sections for the
18

treatment may be designed to occur between mileposts 13.5 and 14.5). The location information should also include details about which lanes and directions are to be treated.
A third component of the work plan is information on any standard or provisional specifications that will be in effect as part of the project, along with the plans for monitoring construction quality. Summarized laboratory or field tests that will be required, along with the acceptance criteria, will be useful in assessing the quality of the constructed treatments and the possible implications on long-term performance.
Agencies will have developed most of the above data during the project selection and test site design phases. Specification and testing and inspection information should be available from project letting files or from maintenance unit work order files.
Test Site Construction
Agencies should closely follow the contract or work order plans and specifications and the developed construction work plan when constructing the preservation test site. Some last-minute adjustments might be needed to address issues arising from pre-application repair and surface preparation, traffic, weather, material production and placement, or other factors. Such adjustments must not adversely affect the conduct of the study.
The data collection activities described below should provide the basis for preparing a well-documented construction report for the treatment being studied. In addition, agencies could combine the collected data with performance monitoring data to conduct a cost-effectiveness analysis of the treatment and to ultimately determine its worth in a high-traffic-volume scenario.
Data Collection for Construction Monitoring and Documentation
Construction monitoring and documentation includes all activities associated with overseeing the construction of the planned preservation treatment and recording key information about its placement. The activities are intended to ensure that the treatment is properly applied and has the best opportunity to perform to its ability.
Quality control testing, acceptance testing, and construction inspection of the planned treatment must be performed as designated in the project contract or maintenance work order. While the information from these activities may be collected by the contractor or by certain departments within the implementing agency, it is vital that all activities be closely monitored so that adjustments or corrections to the construction process can be made as needed. The testing and inspection data should be obtained for use as they become available.
Figure 5 lists the construction items that should be closely monitored and documented by the implementing agency. Depending on the treatment installed, other types of information will also
19

need to be collected. For instance, for a crack sealing or joint resealing operation, agencies should collect data on the cleanliness, dryness, and integrity of the prepared crack or joint, because these are important factors in performance. Similarly, for a chip seal operation, agencies should collect data on aggregate quality and binder properties, the application/coverage rates of each, and the timing of aggregate spreading and rolling, because these factors significantly affect treatment performance.
In addition to collecting the above data, agencies should photograph and/or video-record the construction operations. As mentioned earlier, these materials will supplement the data and provide a visual reference if needed in the future.
Data Collection for Post-Construction Pavement Condition
Post-construction pavement condition is important from the standpoint of determining immediate pavement performance improvement and defining the short- and long-term performance curve of the preservation-treated pavement. Ideally, agencies should collect data, including all pavement condition parameters (e.g., individual distresses and surface characteristics) evaluated prior to treatment construction, within a few weeks of construction. As with the pre-construction pavement distress survey and surface characteristics testing, agencies should collect data for each test section and photograph or video-record any manual distress surveys that are performed. Agencies should then add all collected data to the preservation project database for subsequent analysis and reporting.
Data Collection Summary
Figure 5 summarizes the data collection needs for preservation test site design and construction, broken down into the three data need categories. This figure can be used as a checklist for agencies to ensure that they are collecting the right types of information and using the right evaluation methods in designing and implementing the preservation test site.
20

Figure 5. Summary of Data Collection Needs for Preservation Test Site Design and Construction
DESIGN AND CONSTRUCTION
HOW to Evaluate
• Query and review databases and data files Pavement management system database Inventory Traffic Design Construction and materials Maintenance management system database
• Perform test site layout Mark test section locations and boundaries in field Document layout
• Conduct pre- and post-treatment surveys Pavement distress survey Pavement surface testing Photographs and videos, as needed
WHY Evaluate
• Establish a well-designed and -constructed field experiment by which a selected preservation treatmentcan be properly monitored and evaluated for use on ahigh-traffic-volume road.
WHAT to Evaluate
Data Item
Data Need Category
1 2 3
Test Site Design (Project Suitability and Test Site Layout)
Proposed number of test sections
Available length
Uniformity throughout length based on data evaluation (e.g., traffic, pavement conditions, structural/support conditions)
Optional X
Uniformity throughout length based on visual survey (e.g., traffic, pavement conditions)
Locations of roadway events, geometrics, and vertical constraints based on visual survey (e.g., bridges, intersections, sharp curves, steep grades, overhead structures, manholes)
PMS section alignment and possible segmentation of PMS sections X
Test Site Construction
Pre-treatment repair needs–repair types, locations, and quantities Optional
Pre-treatment pavement conditions–overall measure (PCI or equivalent measure) X
Pre-treatment pavement conditions–prominent distress types and severity levels X
Pre-treatment pavement conditions–surface characteristics (IRI, FN40S, OBSI) X
Post-treatment pavement conditions–overall measure (PCI or equivalent measure)
Post-treatment pavement conditions–prominent distress types and severity levels
Post-treatment pavement conditions–surface characteristics (IRI, FN40S, OBSI) (as needed)
Treatment application plans and specifications Optional
Treatment application operations and rates Optional
Treatment application conditions
Quality control and acceptance testing results Optional X
Construction inspection observations
Treatment costs
21
Chapter 5. Data Collection Guidelines for Preservation Treatment Monitoring and Analysis
This chapter presents data collection guidelines for monitoring the short- and long-term performance of the installed preservation treatment and analyzing its cost-effectiveness as a treatment for high-traffic-volume roads. As mentioned previously, the data collected in this phase will primarily consist of pavement distress and surface characteristics data, obtained through regularly scheduled surveys and testing. However, agencies should also collect other data relevant to treatment analysis, including traffic data and any maintenance and rehabilitation data.
To ensure consistency in the monitoring process and continuity between pre-treatment and post-treatment performance data, agencies are strongly recommended to develop a monitoring and evaluation plan around the time of test site construction. In addition to providing the test site layout, this plan should present a timetable for the monitoring activities, detail the standard protocol for collecting pavement condition and surface characteristics data, and outline the data analyses to be conducted toward achieving the goal(s) of the study. If the monitoring will be done as part of the pavement management process, the sections with preservation treatments should be clearly flagged to facilitate the analysis of their performance.
The monitoring and evaluation plan should present a reasonable, balanced approach in terms of the frequency and timing of surveys and testing and the time period over which the activities should occur (Jones, 2007). The plan should also specify the types of surveys and testing to be performed, the types of data to be generated for analysis, and the parties responsible for performing these activities. The plan should also outline the process for addressing maintenance and rehabilitation needs at the test site during the monitoring period. Further guidance on the monitoring and evaluation activities is provided in the sections below.
Pavement Condition Surveys and Testing
Test site monitoring should consist of the same set of pavement survey and testing activities as those performed right after construction. At a minimum, these will include automated or manual distress surveys that capture a range of distress types, severity levels, extents and high-speed inertial profiling for measuring smoothness (e.g., the International Roughness Index), and rutting or faulting. Monitoring may also include inertial profiling for measuring surface texture (mean texture depth or mean profile depth) and cross-slope; locked-wheel friction testing for measuring friction number with ribbed tire at 40 miles per hour (FN40R) and friction number with smooth tire at 40 miles per hour (FN40S); pavement-tire noise testing for measuring on-board sound intensity (OBSI); and nondestructive testing for measuring deflections and load transfer.
22

Ideally, agencies should conduct distress surveys and smoothness testing once or twice annually to ensure that sufficient data are collected and that the onset of deterioration in each test section is fully understood and documented. If agencies can perform two evaluations per year, then they should do so during the two season extremes. If agencies can perform only one evaluation per year, then they should develop a strategy that either targets a particular season for the annual evaluation or alternates the annual evaluation among the two season extremes. If the cost of a yearly approach is too great, then biennial evaluations might be adequate, provided the treated pavement will last longer than 5 years.
The data collection effort should produce data specific to each test section so that agencies can develop and analyze time-series performance trends for each section. If a test section has deteriorated significantly and must undergo rehabilitation, then an agency should conduct a final round of surveys and testing for that section before the rehabilitation work. As with test site design and construction, agencies should add all collected monitoring data to the preservation project database for analysis and reporting.
Treatment Cost-Effectiveness Analysis
The time-series pavement condition data collected for the in-place test sections and stored in the preservation project database will be used to develop performance trends and assess treatment cost-effectiveness. If not done previously, agencies should use the collected distress data and surface characteristics data to compute values for the specific overall pavement condition indicators that will be analyzed.
Figure 6 illustrates the types of performance curves that will ultimately be developed using the collected condition data. Based on the methodology outlined in the Guidelines, the effectiveness of the installed treatment will be evaluated in terms of the effect of the treatment on pavement life. For each performance parameter evaluated, knowing an agency’s threshold level for that parameter will be required. As discussed and illustrated previously, the threshold level represents an unacceptable condition and serves as a trigger for a rehabilitation activity.
Helpful Hint: If included in the study plan, other pavement testing activities (e.g., friction, texture, noise, deflection) should be performed every 1 or 2 years. Depending on the expected trends of these performance parameters for the treatment being evaluated and on an agency’s ability to conduct these tests throughout the monitoring period, devising a flexible testing schedule might be more appropriate. For instance, if experience indicates that most of a treatment’s surface texture is lost in the first year, then the schedule might best include annual testing the first 2 years followed by testing every 2 or 3 years.
23

Figure 6. Pavement Performance Trends Using Different Condition Measures
Depending on the cost-effectiveness analysis procedure to be used, the amount of additional data needed will vary significantly. With the simplified equivalent annual cost approach, only the cost of the constructed treatment will be required. On the other hand, if the detailed benefit-to-cost-ratio (BCR) approach will be used, then both the treatment construction cost and an array of life-cycle cost analysis (LCCA) input parameters will be needed. These parameters include the following:
• Agency-specified analysis period for conducting LCCA
• Agency-specified discount rate for conducting LCCA
• Agency-specified user cost inputs for conducting LCCA
• Agency-forecasted sequence of rehabilitation treatments for completing the life-cycle models of the preservation-treated and untreated pavements
• Agency-recommended costs and performance characteristics of the rehabilitation treatments
Figure 7 illustrates the BCR analysis approach, in which a complete life-cycle model for the preservation-treated pavement is constructed using both the historical events (i.e., original
Rutting
Time, years
Threshold
Untreated Pavement
Preservation-Treated
Pavement
Treatment Application
Thermal Cracking
Time, years
Threshold
Preservation-Treated
Pavement Treatment Application
Untreated Pavement
IRI
Time, years
Threshold
Preservation-Treated
Pavement
Treatment Application
Untreated Pavement
PCI
Threshold
Treatment Application
Untreated Pavement
Time, years
Preservation-Treated
Pavement
OPI
Threshold
Treatment Application
Preservation-Treated
Pavement Untreated Pavement
Time, years
24

pavement construction and applied preservation treatment) and the forecasted events (i.e., rehabilitation treatments following the preservation treatment).
Figure 7. Illustration of Benefits and Costs Associated with a Pavement Preservation Treatment Strategy—SHRP2 Guidelines BCR Analysis Procedure (adapted from Peshkin et al., 2011a)
It bears mentioning that when costs of experimental implementations or test sections are used in LCCA, then these may not reflect what the costs would be if the treatment were more widely used. Agencies should consider the difference between experimental treatment costs and routine costs if comparisons are being made.
Data Collection Summary
Figure 8 summarizes the data collection needs for treatment monitoring and analysis, broken down into the three data need categories. Agencies can use this figure as a checklist for ensuring that they collect the right types of information and using the right evaluation methods when
25

monitoring treatment performance and analyzing treatment cost-effectiveness in a high-traffic-volume application.
Figure 8. Summary of Data Collection Needs for Treatment Monitoring and Evaluation
MONITORING AND ANALYSIS
WHAT to Evaluate
Data Item
Data Need Category
1 2 3
Treatment Monitoring
Pavement conditions over time–overall measure (PCI or equivalent measure)
Pavement conditions over time–prominent distress types and severity levels
Pavement conditions over time–surface characteristics (IRI, FN40S, OBSI) (as needed)
Test section interventions–maintenance and/or rehabilitation treatments applied
Treatment Cost-Effectiveness Analysis
Test section performance (treated and untreated pavements)–performance trends using overall measure
Test section performance (treated and untreated pavements)–performance trends using key distresses
Optional Optional
Test section performance (treated and untreated pavements)– performance trends using surface characteristic measures
(as needed)
Test section performance (treated pavements)–pavement life extension provided by treatment using overall measure
Test section performance (treated pavements)– pavement life extension provided by treatment using key distresses
Optional Optional
Test section performance (treated pavements)–pavement life extension provided by treatment using surface characteristic measures
(as needed)
Treatment cost-effectiveness–equivalent annual cost method
Treatment cost-effectiveness–benefit-to-cost ratio method Optional X
HOW to Analyze
• Compile and Link Pavement Performance Data Historical data Formal test site data
• Prepare Time-Series Performance Plots (e.g., overall condition, individual distress types, individual surface characteristics) Treated-pavement test sections Untreated-pavement control sections
• Conduct Cost-Effectiveness Analysis Simplified equivalent annual cost approach Detailed benefit-to-cost-ratio approach
WHY Monitor and Analyze
• Determine the value of the constructed preservation treatment in a high-traffic-volume environment.
26

Chapter 6. References
Elkins, G.E., G. Rada, J. Groeger, and B. Visintine. 2013. Pavement Remaining Service Interval Implementation Guidelines. Report No. FHWA-HRT-13-050. Federal Highway Administration, Washington, DC.
Jones, D. 2007. Pavement Preservation Studies Technical Advisory Guide. Guideline No. UCPRC-GL-2005-01. California Department of Transportation, Sacramento, CA.
Peshkin, D., K.L. Smith, A. Wolters, J. Krstulovich, J. Moulthrop, and C. Alvarado. 2011a. Guidelines for the Preservation of High-Traffic-Volume Roadways. SHRP2 Report S2-R26-RR-2. Strategic Highway Research Program 2 (SHRP2), Washington, DC.
Peshkin, D., K.L. Smith, A. Wolters, J. Krstulovich, J. Moulthrop, and C. Alvarado. 2011b. Preservation Approaches for High-Traffic-Volume Roadways. SHRP2 Report S2-R26-RR-1. Strategic Highway Research Program 2 (SHRP2), Washington, DC.
Smith, R., T. Freeman, and O. Pendleton. 1993. Pavement Maintenance Effectiveness. Report No. SHRP-H-358. Strategic Highway Research Program (SHRP), Washington, DC.
27

Appendix A Data Collection Details for Different Phases of a
Preservation Project

Data Collection Details for Different Phases of a Preservation Project
Project and Site Information
The first step in the project and treatment selection process involves identifying basic project information, such as the roadway identifier, location, dimensions, and operating environment. This information will help determine whether the project fits the Guidelines for the Preservation of High-Traffic-Volume Roadways (the Guidelines; Peshkin et al., 2011a) high-traffic-volume criteria (in terms of average annual daily traffic [AADT]), as well as whether there are any potential constructability issues or treatment performance impacts. This information also will be useful in generating treatment quantities for detailed cost analysis.
Table A-1 lists the data elements included in the project and site category. Sources for this information include the agency pavement management system (PMS), roadway inventory files, project design records, traffic volume maps or traffic database, climatic maps, and weather station files.
Table A-1. Data Elements to Characterize Project or Site
Category Data Item General • Route number or road name (e.g., I-94, U.S. 45, University Avenue)
• Location (i.e., city, county, state) • Elevation • Facility type (i.e., functional class and/or highway system) • Facility setting (i.e., urban, suburban, rural) • Begin and end limits (i.e., milepost and/or marker, reference post
and/or marker) • Length • Travel direction(s) (e.g., northbound/southbound, eastbound only)
Geometric Features • Number of lanes • Lane widths • Divided or undivided • Presence of shoulders • Shoulder widths • Median type • Horizontal and vertical curves
A-1

Table A-1. Data Elements to Characterize Project or Site
Category Data Item Roadway Landmarks and Other Assets
• Presence of landmarks, such as intersections, interchanges, bridges, railroad crossings, and access drives, that could interfere with pavement treatment operations
• Presence of roadway assets, such as overhead structures, curbs and gutter, guardrails, drainage structures (e.g., manholes), and other items, that could restrict elevation and/or grade of pavement treatment
Traffic • Average annual daily traffic (current two-way) • Average annual daily truck traffic or percent commercial/heavy
trucks • Traffic growth rate
Climate/Environment • Climatic and/or environmental zone (four long-term pavement performance zones, nine American Association of Safety and Transportation Officials (AASHTO) zones, agency-defined zone)
• Average annual (or even monthly) precipitation • Average annual (or even monthly) temperature
Existing Pavement Structure and History Data
The next step in the process involves compiling details about the existing pavement structure and the history of previous pavement treatments. This information is critical to identifying the types of treatments that should be considered for the project and, to some extent, the timing of treatment application. Table A-2 lists the specific types of data targeted in this step. Sources for this information include the agency PMS, project design records, construction plans, construction and materials quality databases, and maintenance management systems.
Existing Pavement Condition and Performance Data
The third step in the process is to obtain information about the current condition and past performance of the subject pavement. Examining this information helps to understand pavement needs and to determine an appropriate pavement strategy. For example, the existing pavement could still be in such good condition that any kind of preservation or rehabilitation treatment applied to it would not cost-effectively extend its life. Conversely, its condition might be so poor that no preservation treatment could be effective, in which case a major rehabilitation, or perhaps even reconstruction, might be warranted. Guidelines includes basic criteria for determining whether pavement is suitable for preservation (Peshkin et al., 2011a).
A-2
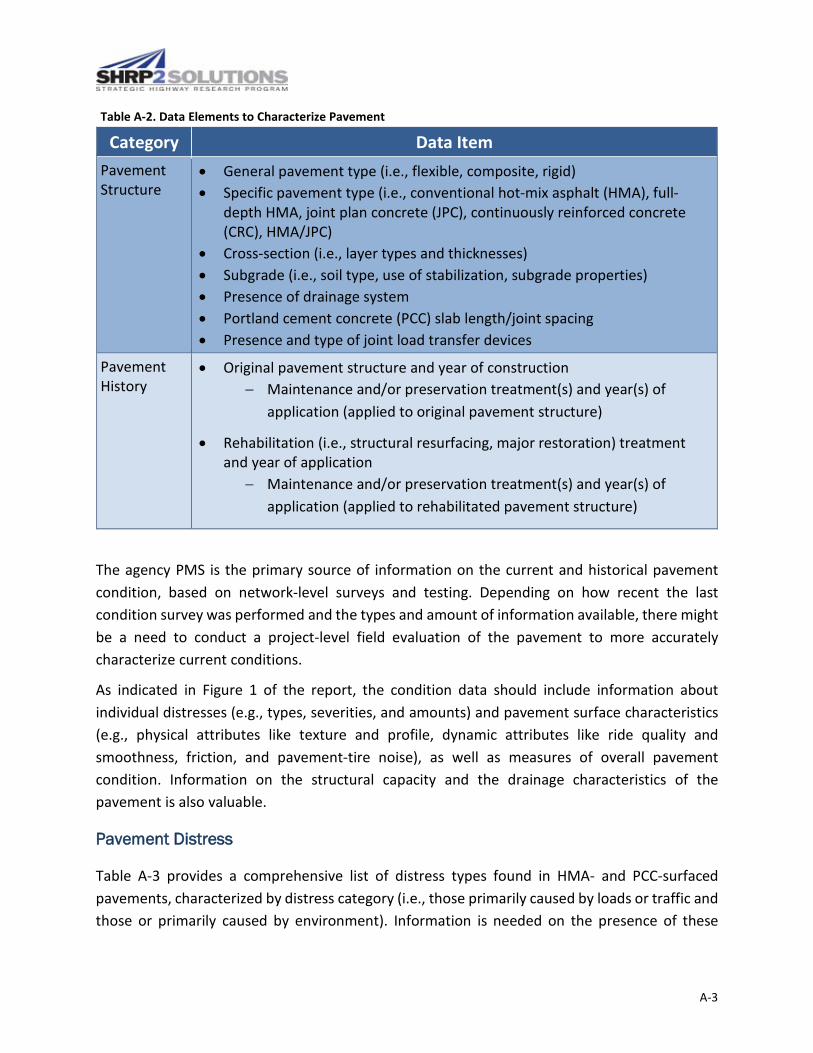
Table A-2. Data Elements to Characterize Pavement
Category Data Item Pavement Structure
• General pavement type (i.e., flexible, composite, rigid) • Specific pavement type (i.e., conventional hot-mix asphalt (HMA), full-
depth HMA, joint plan concrete (JPC), continuously reinforced concrete (CRC), HMA/JPC)
• Cross-section (i.e., layer types and thicknesses) • Subgrade (i.e., soil type, use of stabilization, subgrade properties) • Presence of drainage system • Portland cement concrete (PCC) slab length/joint spacing • Presence and type of joint load transfer devices
Pavement History
• Original pavement structure and year of construction − Maintenance and/or preservation treatment(s) and year(s) of
application (applied to original pavement structure)
• Rehabilitation (i.e., structural resurfacing, major restoration) treatment and year of application
− Maintenance and/or preservation treatment(s) and year(s) of application (applied to rehabilitated pavement structure)
The agency PMS is the primary source of information on the current and historical pavement condition, based on network-level surveys and testing. Depending on how recent the last condition survey was performed and the types and amount of information available, there might be a need to conduct a project-level field evaluation of the pavement to more accurately characterize current conditions.
As indicated in Figure 1 of the report, the condition data should include information about individual distresses (e.g., types, severities, and amounts) and pavement surface characteristics (e.g., physical attributes like texture and profile, dynamic attributes like ride quality and smoothness, friction, and pavement-tire noise), as well as measures of overall pavement condition. Information on the structural capacity and the drainage characteristics of the pavement is also valuable.
Pavement Distress
Table A-3 provides a comprehensive list of distress types found in HMA- and PCC-surfaced pavements, characterized by distress category (i.e., those primarily caused by loads or traffic and those or primarily caused by environment). Information is needed on the presence of these
A-3
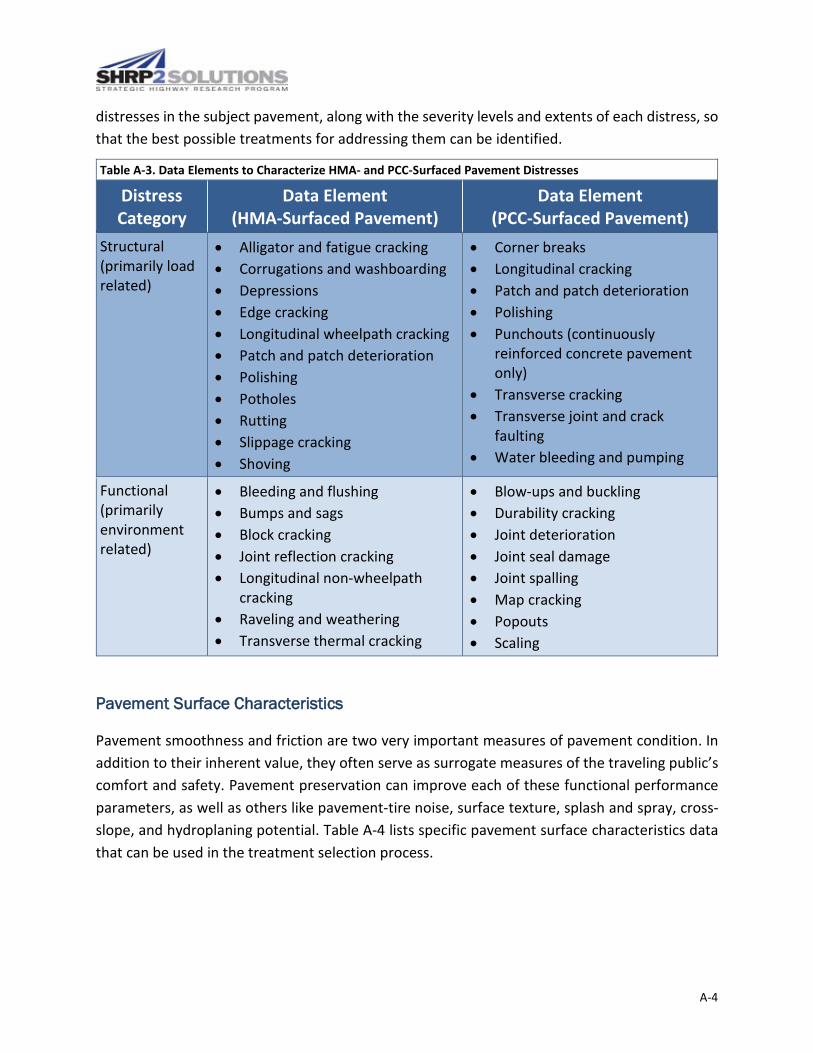
distresses in the subject pavement, along with the severity levels and extents of each distress, so that the best possible treatments for addressing them can be identified.
Table A-3. Data Elements to Characterize HMA- and PCC-Surfaced Pavement Distresses
Distress Category
Data Element (HMA-Surfaced Pavement)
Data Element (PCC-Surfaced Pavement)
Structural (primarily load related)
• Alligator and fatigue cracking • Corrugations and washboarding • Depressions • Edge cracking • Longitudinal wheelpath cracking • Patch and patch deterioration • Polishing • Potholes • Rutting • Slippage cracking • Shoving
• Corner breaks • Longitudinal cracking • Patch and patch deterioration • Polishing • Punchouts (continuously
reinforced concrete pavement only)
• Transverse cracking • Transverse joint and crack
faulting • Water bleeding and pumping
Functional (primarily environment related)
• Bleeding and flushing • Bumps and sags • Block cracking • Joint reflection cracking • Longitudinal non-wheelpath
cracking • Raveling and weathering • Transverse thermal cracking
• Blow-ups and buckling • Durability cracking • Joint deterioration • Joint seal damage • Joint spalling • Map cracking • Popouts • Scaling
Pavement Surface Characteristics
Pavement smoothness and friction are two very important measures of pavement condition. In addition to their inherent value, they often serve as surrogate measures of the traveling public’s comfort and safety. Pavement preservation can improve each of these functional performance parameters, as well as others like pavement-tire noise, surface texture, splash and spray, cross-slope, and hydroplaning potential. Table A-4 lists specific pavement surface characteristics data that can be used in the treatment selection process.
A-4

Table A-4. Pavement Surface Characteristics Data Elements
Category Data Elements Physical Attributes
• Surface texture (e.g., mean texture depth, mean profile depth) • Cross slope
Dynamic Attributes
• Smoothness (e.g., international roughness index) • Friction (friction number with ribbed tire at 40 miles per hour test speed
[FN40R] and friction number with smooth tire at 40 miles per hour test speed [FN40S])
• Pavement-tire noise (on-board sound intensity) • Splash and spray • Hydroplaning potential
Overall Distress Indicators
Many highway agencies have developed and use an overall distress indicator that factors the type, severity, and extent of multiple distresses into a single distress rating. Some agencies might even have separate indicators for structural-, load-, -functional- and/or environmental-related distresses. These types of indicators help to determine whether a pavement is a good candidate for preservation (i.e., pavement is in fair to good condition, giving preservation treatments the best opportunity to perform well). Table A-5 provides a few examples of overall distress indicators.
Serviceability Indicators
Some highway agencies have correlated their smoothness index (international roughness index [IRI]) with the ride quality ratings provided by a highway user panel. The correlations are a way of translating a measured smoothness level into a ride quality score that reflects the judgment of the average highway user. Table A-5 provides a few examples of serviceability indicators.
Composite Condition Indicators
Some highway agencies have also developed and use a composite condition indicator that factors distresses, smoothness, and serviceability into an overall pavement quality or health rating. Table A-5 provides some examples of composite condition indicators.
A-5

Table A-5. Examples of Overall Pavement Condition Indicators
Overall Distress Indicator Serviceability Indicator Composite Condition
Indicator • Pavement Condition
Index (American Society of Testing and Materials D 6433)
• Pavement Distress Index (Arizona DOT)
• Pavement Condition Evaluation System Rating (Georgia DOT)
• Surface Rating (Minnesota DOT)
• Pavement Structural Condition (Washington DOT)
• Present Serviceability Rating (PSR) (AASHTO Road Test 0-to-5 score)
• PSR (various studies relating PSR with IRI)
• Ride Quality Index (Minnesota DOT)
• Roughness Index (Pennsylvania DOT)
• Pavement Quality Index (Minnesota DOT)
• Overall Pavement Index (Delaware DOT)
• Pavement Condition Rating (Maine DOT)
Structural Capacity
While some agencies conduct network-level, nondestructive testing of pavements to determine existing structural capacity, this is more commonly done at the project level. The deflection data obtained from falling weight deflectometer testing can indicate whether a pavement is structurally capable of accommodating the current and projected traffic loadings and, thus, whether the pavement is a good candidate for preservation. The following types of falling weight deflectometer data are useful to the treatment selection process:
• HMA-surfaced pavements
− Deflection profile and deflection summary statistics
• PCC-surfaced pavements (and composite pavements)
− Deflection profile and deflection summary statistics
− Joint load transfer efficiency
− Void detection
A-6
Drainage Conditions
Drainage conditions are typically assessed in conjunction with project-level field evaluations. In addition to identifying any moisture-related distresses (e.g., water pumping, D-cracking, and any distresses caused by asphalt stripping), information concerning the pavement’s transverse cross-slope, ditch condition and depth, and the condition of drainage inlets and longitudinal edge drain outlets is important.
Remaining Service Interval
The various types of condition data discussed above can be used to develop an estimate of pavement remaining service interval (RSI). The RSI parameter is being introduced to replace the remaining service life (RSL) concept, which is considered a measure of the time from the present until a pavement requires rehabilitation or reconstruction (Elkins et al., 2013). The RSI is more closely related to the various activities that occur on a pavement before it is rehabilitated or reconstructed and, as such, is more relevant to preservation decision making. Implementing the RSI concept, however, is just getting underway.
Project Selection Criteria Data
To determine whether pavement preservation is a feasible option for a candidate project, agencies must examine the treatment timing aspect in terms of overall pavement condition. For example, if a preservation treatment were applied too soon, then funds are expended on roads that do not require treatment, or the treatments do not generate sufficient benefit to justify their costs. Conversely, if a treatment were applied too late, then the road may have deteriorated to the point that the treatment is ineffective or does not add sufficient life to the pavement to justify the cost.
A key to selecting an appropriate treatment is the concept of “windows of opportunity.” As shown in Figure A-1, a window of opportunity for preservation can be defined by a trigger value and corresponding threshold value for a given pavement condition measure. Likewise, windows of opportunity for rehabilitation (major resurfacing or restoration) and reconstruction can be defined, representing more deteriorated condition levels.
An agency’s trigger and threshold criteria (or window of opportunity) for preservation are needed to determine whether preservation should be considered. These criteria are often provided in the form of pavement decision trees or matrices. As illustrated in Figure A-2, the criteria might be associated with just one performance measure, such as an overall condition or serviceability indicator, or with multiple measures, such as an overall quality indicator, a smoothness indicator, a cracking indicator, and a rutting or faulting indicator. Windows of opportunity corresponding to pavement age or remaining service life might also be needed.
A-7

Figure A-1. Example Illustration of Windows of Opportunity for Pavement Preservation, Rehabilitation, and Reconstruction (adapted from Peshkin et al., 2011a)
Figure A-2. Identification of Measures and Criteria for Preservation Project Selection
Pavement Preservation Window
Preventive Maintenance Very
Good
Pave
men
t Con
ditio
n
Reconstruction Window
Preservation Threshold
Preservation Trigger
Time
Maintenance
Rehabilitation Window
Very Poor
Pavement Preservation or Major Rehabilitation?
Overall Indicator PCI PSR Major
Rehabilitation
Develop Feasible Rehabilitation
Treatments
Timing Age
Remaining life
Pavement Preservation
Identify Measures to be Used Establish Trigger and
Threshold Criteria
Surface Characteristics
Indicator IRI, FN
Key Distresses Fatigue cracking
Rutting Faulting
Develop Preliminary Set of Feasible Preservation Treatments
A-8
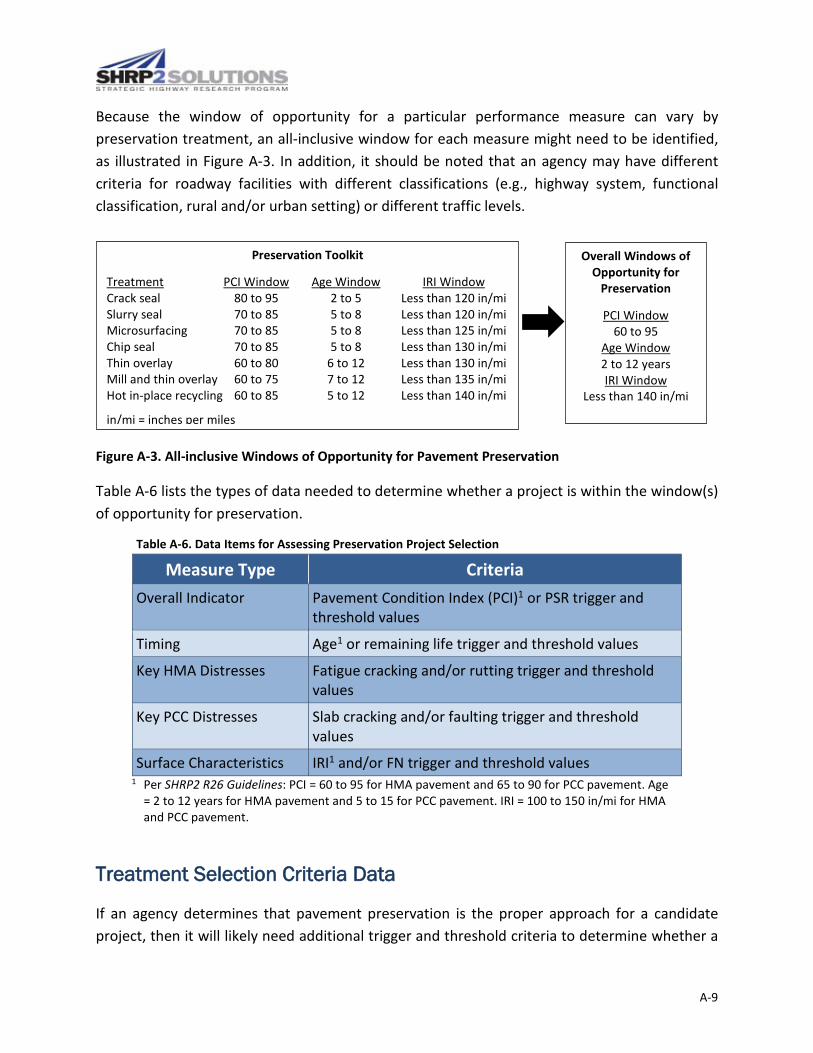
Because the window of opportunity for a particular performance measure can vary by preservation treatment, an all-inclusive window for each measure might need to be identified, as illustrated in Figure A-3. In addition, it should be noted that an agency may have different criteria for roadway facilities with different classifications (e.g., highway system, functional classification, rural and/or urban setting) or different traffic levels.
Figure A-3. All-inclusive Windows of Opportunity for Pavement Preservation
Table A-6 lists the types of data needed to determine whether a project is within the window(s) of opportunity for preservation.
Table A-6. Data Items for Assessing Preservation Project Selection
Measure Type Criteria Overall Indicator Pavement Condition Index (PCI)1 or PSR trigger and
threshold values
Timing Age1 or remaining life trigger and threshold values
Key HMA Distresses Fatigue cracking and/or rutting trigger and threshold values
Key PCC Distresses Slab cracking and/or faulting trigger and threshold values
Surface Characteristics IRI1 and/or FN trigger and threshold values 1 Per SHRP2 R26 Guidelines: PCI = 60 to 95 for HMA pavement and 65 to 90 for PCC pavement. Age
= 2 to 12 years for HMA pavement and 5 to 15 for PCC pavement. IRI = 100 to 150 in/mi for HMA and PCC pavement.
Treatment Selection Criteria Data
If an agency determines that pavement preservation is the proper approach for a candidate project, then it will likely need additional trigger and threshold criteria to determine whether a
Preservation Toolkit
Treatment PCI Window Age Window IRI Window Crack seal 80 to 95 2 to 5 Less than 120 in/mi Slurry seal 70 to 85 5 to 8 Less than 120 in/mi Microsurfacing 70 to 85 5 to 8 Less than 125 in/mi Chip seal 70 to 85 5 to 8 Less than 130 in/mi Thin overlay 60 to 80 6 to 12 Less than 130 in/mi Mill and thin overlay 60 to 75 7 to 12 Less than 135 in/mi Hot in-place recycling 60 to 85 5 to 12 Less than 140 in/mi
in/mi = inches per miles
Overall Windows of Opportunity for
Preservation
PCI Window 60 to 95
Age Window 2 to 12 years IRI Window
Less than 140 in/mi
A-9

specific treatment is suitable for addressing the existing pavement conditions. Although criteria for an overall indicator might be useful in treatment selection, such as the PCI shown in Figure A-3, the criteria of greatest need are those associated with specific distresses (particularly functional and/or environmental distresses) and surface characteristics. Like project selection criteria, treatment selection criteria are often provided in the form of pavement decision trees or matrices that help to identify the best treatment options.
Guidelines includes evaluation matrices for assessing the feasibility of using different treatments for HMA- and PCC-surfaced pavements with varying conditions (Peshkin et al., 2011a). The matrices include PCI- and age-based windows of opportunity for different treatments, as well as appropriateness ratings reflecting a treatment’s ability to address different distresses and different surface characteristics issues. Although specific trigger and threshold criteria are not provided for the different distresses and surface characteristics, the information can serve as a check on the reasonableness of an agency’s selection criteria. Table A-7 lists the data elements needed to determine which types of preservation treatments are suitable for a project.
Table A-7. Data Elements to Assess Preservation Treatment Selection
Measure Type Criteria HMA Distresses Trigger and threshold values of individual distress types,
severity levels, and quantities. See Table 1 of the report for types of HMA distresses.
PCC Distresses Trigger and threshold values of individual distress types, severity levels, and quantities. See Table 1 of the report for types of PCC distresses.
Surface Characteristics IRI, FN, and/or on-board sound intensity(OBSI) trigger and threshold values
Project Needs and Constraints
Once an agency identifies a preservation treatment that will address the existing pavement conditions, the agency then assesses the treatment to determine how well it satisfies the needs and constraints of the candidate project. Thus, the agency will need information regarding the targeted or required treatment performance and any potential impacts the project or site may have on both the constructability of the treatment (e.g., qualified local contractors, traffic accommodations, work zone restrictions) and the expected performance of the treatment (e.g., traffic effects, climate effects). Table A-8 lists the types of information that are critical to this step in the treatment selection process.
A-10

Table A-8. Data Items for Assessing Project Needs and Constraints
Performance Needs Construction Constraints • Targeted and/or required performance • Expected performance of treatments
− Existing pavement condition effects
− Traffic effects (e.g., functional class and/or traffic level)
− Climate and environment effects
− Construction quality risk effects (e.g., agency and contractor experience, materials quality)
• Funding • Time of year of construction • Geometrics (e.g., curves, intersections,
pavement markings/striping) • Work zone duration restrictions (i.e.,
facility downtime) • Traffic accommodation and safety • Availability of qualified contractors and
quality materials • Environmental considerations (e.g.,
emissions and air quality, recycling/ sustainability)
Treatment Cost-Effectiveness and Final Selection
Where two or more feasible preservation treatments are identified for a project, a cost-effectiveness analysis of those treatments is performed, followed by a final selection that considers both monetary and nonmonetary factors. As described in Guidelines, cost-effectiveness can be evaluated using the simplified equivalent annual cost method or the detailed benefit-to-cost-ratio method. The data needed for this step are identified in Table A-9.
Preservation Test Site Design and Construction
Table A-10 lists the anticipated data items for each stage.
Preservation Treatment Monitoring and Analysis
As described in Chapter 5 of the report, treatment monitoring data primarily consists of pavement distress and surface characteristics data, obtained through regularly scheduled surveys and testing. Other information that should be collected include traffic data, maintenance and rehabilitation data, and structural capacity data.
A-11
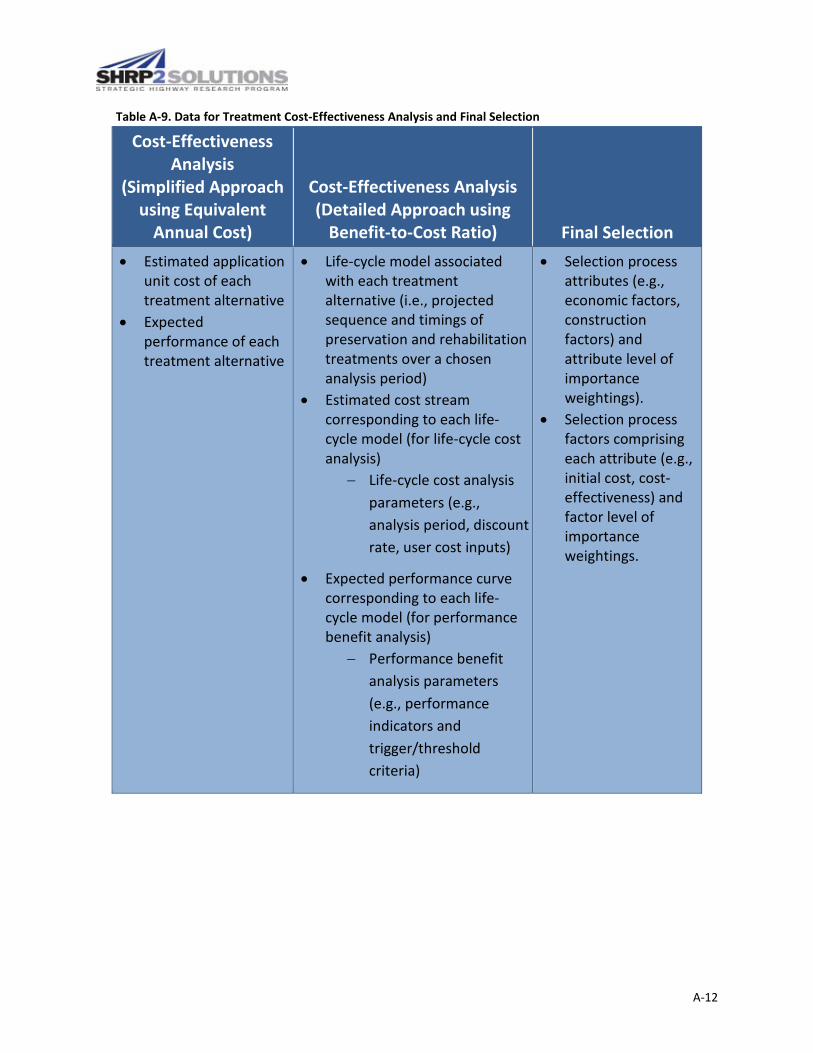
Table A-9. Data for Treatment Cost-Effectiveness Analysis and Final Selection
Cost-Effectiveness Analysis
(Simplified Approach using Equivalent
Annual Cost)
Cost-Effectiveness Analysis (Detailed Approach using
Benefit-to-Cost Ratio) Final Selection • Estimated application
unit cost of each treatment alternative
• Expected performance of each treatment alternative
• Life-cycle model associated with each treatment alternative (i.e., projected sequence and timings of preservation and rehabilitation treatments over a chosen analysis period)
• Estimated cost stream corresponding to each life-cycle model (for life-cycle cost analysis)
− Life-cycle cost analysis parameters (e.g., analysis period, discount rate, user cost inputs)
• Expected performance curve corresponding to each life-cycle model (for performance benefit analysis)
− Performance benefit analysis parameters (e.g., performance indicators and trigger/threshold criteria)
• Selection process attributes (e.g., economic factors, construction factors) and attribute level of importance weightings).
• Selection process factors comprising each attribute (e.g., initial cost, cost-effectiveness) and factor level of importance weightings.
A-12

Table A-10. Data for Preservation Test Site Design and Treatment Construction
Test Site Design Test Site Construction • Project boundaries (i.e., begin and
end mileposts) and dimensions (e.g., length, directions, lanes)
• Project linkage to PMS database (i.e., PMS pavement sections and subsections contained within the project and their respective locations)
• Test section requirements (e.g., number of replicate sections needed to accommodate the treatment, and “do-nothing” treatment, if included)
• Test section designations and locations
• Roadway geometrics throughout the project
• Roadway events and other assets throughout the project
• Traffic flow characteristics throughout the project
• Pavement structure and foundation characteristics throughout the project
• Pavement distress data for individual established test sections
• Pavement surface characteristics data for individual established test sections
• Description of treatment constructed and locations of test sections incorporating treatment
• Dates and times of treatment construction • Contractor or maintenance unit responsible for
construction • Weather conditions (e.g., air and pavement
temperatures, precipitation, sun and cloud, winds) during treatment construction
• Traffic conditions (e.g., work zone or traffic control setup used, traffic characteristics) during treatment construction
• Treatment mix design information (if applicable)
• Treatment test strip information (if applicable) • Pre-application repair and surface preparation
work − Types (e.g., patching, pavement marker
removal, sweeping)
− Locations and quantities
− Problems encountered and solutions applied
• Treatment application − Construction process (e.g., equipment,
manpower, procedure)
− Pavement surface removal locations, depth, and quantity (if used)
− Treatment material placement locations, thickness and coverage, and quantity
− Treatment operation rate (e.g., feet per minute , lane-miles per day =)
− Problems encountered and solutions applied
A-13

Table A-10. Data for Preservation Test Site Design and Treatment Construction
Test Site Design Test Site Construction − Construction deficiencies
• Quality control testing and inspection − Production tests and results
− Placement tests and results
• Quality acceptance testing − Production tests and results
− Placement tests and results
• Post-treatment pavement condition − Distresses
− Pavement surface characteristics
• Treatment cost − Contracted: Bid prices and final
payments for treatment and associated pay items (e.g., pavement marker removal, maintenance and protection of traffic)
− In-house: Estimated and final reported expenses for treatment and associated activities
A-14

DESIGN AND CONSTRUCTION
HOW to Evaluate � Query and review databases and data files
� Pavement management system database
� Inventory � Traffic � Design � Construction and materials
� Maintenance management system database
� Perform test site layout � Mark test section locations and boundaries in field
� Document layout � Conduct pre- and post-treatment surveys
� Pavement distress survey � Pavement surface testing � Photographs and videos, as needed
WHY Evaluate � Establish a well-designed and -constructed field
experiment by which a selected preservation treatment
can be properly monitored and evaluated for use on a
high-traffic-volume road.
WHAT to EvaluateData Item
Data Need Category 1 2
3
Test Site Design (Project Suitability and Test Site Layout)
Proposed number of test sections
��
�
Available length
��
�
Uniformity throughout length based on data evaluation (e.g., traffic, pavement
conditions, structural/support conditions)
�Optional X
Uniformity throughout length based on visual survey (e.g., traffic, pavement
conditions)
��
�
Locations of roadway events, geometrics, and vertical constraints based on visual
survey (e.g., bridges, intersections, sharp curves, steep grades, overhead structures,
manholes)
��
�
PMS section alignment and possible segmentation of PMS sections
��
X
Test Site Construction
Pre-treatment repair needs–repair types, locations, and quantities
��
Optional
Pre-treatment pavement conditions–overall measure (PCI or equivalent measure) �
� X
Pre-treatment pavement conditions–prominent distress types and severity levels �
� X
Pre-treatment pavement conditions–surface characteristics (IRI, FN40S, OBSI) �
� X
Post-treatment pavement conditions–overall measure (PCI or equivalent measure) �
� �
Post-treatment pavement conditions–prominent distress types and severity levels �
� �
Post-treatment pavement conditions–surface characteristics (IRI, FN40S, OBSI) �
� �
(as needed)
Treatment application plans and specifications
��
Optional
Treatment application operations and rates
��
Optional
Treatment application conditions
��
�
Quality control and acceptance testing results
�Optional X
Construction inspection observations
��
�
Treatment costs
��
�
Rutting
Time, years
Threshold
Untreated
Pavement
Preservation-
Treated
Pavement Treatment
Application
Thermal
Cracking
Time, years
Threshold
Preservation-
Treated
PavementTreatment
Application
Untreated
Pavement
IRI
Time, years
Threshold
Preservation-
Treated
Pavement
Treatment
Application
Untreated
Pavement
PCI
Threshold
Treatment
Application
Untreated
Pavement
Time, years
Preservation-
Treated
Pavement
OPI
Threshold
Treatment
Application
Preservation-
Treated
Pavement
Untreated
Pavement
Time, years
For additional information, go tohttp://SHRP2.transportation.org or http://www.fhwa.dot.gov/goshrp2


