Data Collection and analysis in the cultural and creative sectors in the EU - EP 15/3/2016
17
Feasibility study on data collection and analysis in the cultural and creative sectors (CCS) in the EU 15 March 2016 European Parliament - CULT Committee
-
Upload
allison-reekie -
Category
Data & Analytics
-
view
567 -
download
0
Transcript of Data Collection and analysis in the cultural and creative sectors in the EU - EP 15/3/2016

Feasibility study on data collection and
analysis in the cultural and creative
sectors (CCS) in the EU
15 March 2016
European Parliament - CULT Committee

KEA

CCS’ impacts

20 years of efforts to improve CCS’ statistics
• 1995: European Council resolution on culture stats and economic growth.
• 1997-2000: ‘LEG-Culture’ group (1997-2000).
• 2001-2004: WG on Cultural Stats first Eurostat Pocketbook (2007).
• 2009-2011: ESSnet-Culture’s new reference system.
• 2014-2018: Eurostat to revise and implement ESSnet’s framework.
2014: Feasibility study requested by EU institutions in the framework of the
Regulation establishing the Creative Europe programme (art. 15.2)

Regulation establishing the Creative Europe programme
Article 15
2. {…} the Commission shall carry out a feasibility study exploring the
possibility of collecting and analysing data in the cultural and creative
sectors other than the audiovisual sector, and shall present the results of
that study to the European Parliament and to the Council.

Methodology
Screening of Eurostat
statistics
Mapping of
alternative sources
Benchmarking of
Cultural
Observatories
Assessment of needs & gaps
Policy recommendations & scenarios
• EU Structural Business
Statistics
• Community Innovation Survey
• EU Labour Force Survey
• Comext
• Adult Education Survey
• Social Income and Living
Conditions survey
• Time Use Survey
• Household Budget Surveys
• ICT Use Survey
• Administrative sources
• Business registers
• Trade and professional
associations
• ‘Big data’ from the Internet
• Creative Europe projects
• European Audiovisual
Observatory
• European Group on Museum
Statistics
• Compendium of Cultural Policies
and Trends in Europe
• ENUMERATE project
• Budapest Observatory
• Observatoire de la Culture et
des communications du Québec
• UNESCO Institute for Statistics

Findings (I): major challenges in European CCS’ statistics
Sectoral
• The international classification system (NACE and ISCO) not adapted
(need for revision: video games, music, craft)
• No or poor coverage of heritage, libraries, festivals, crafts, design, fashion
• Difficult to measure GVA in heritage, museums, libraries, performing arts
Transversal
• Not a priority area for statistical bodies
• High number of small and micro-companies – difficult to capture
• Rights’ revenues does not clearly appear from official statistics
• Detailed data on new sales trends and delivery methods are missing
• No measure of cultural diversity
• Poor statistics on trade in services and immaterial goods (i.e. e-books).
CCS statistics measure partially Europe’s excellence and competitiveness of
the sector vs. EU wishes to build a creative economy.

Findings (II): alternative sources to better grasp CCS’ value
• Gather evidence on sectors currently little covered by European
official statistics, notably the ‘heritage sectors’ (i.e. by collating data from
national ministries, EGMUS and EBLIDA);
• Add new insights and provide ‘market intelligence’ in areas which fall
outside the scope of European official statistics to understand new sales
patterns and delivery methods, and forms of engagement in cultural
activities (e.g. through professional associations, private companies);
• Improve official statistics in the long term (particularly in relation to micro-
companies) through the development of new mapping methods based, for
instance, on the use of Internet data (i.e. ‘big data’ approaches).

Source: EGMUS accessed 11 April 2015
Example 1: gather evidence on poorly covered sectors
0
10
20
30
40
50
60
70
80
90
100A
ustr
ia 2
012
Bulg
aria
201
2
Czec
h Re
p. 2
013
Esto
nia
2013
Finl
and
2013
Fran
ce 2
010
Hun
gary
201
3
Irel
and
2005
Latv
ia 2
013
Luxe
mbo
urg
2011
Mac
edon
ia 2
009
Slov
enia
201
3
Spai
n 20
12
Swed
en 2
011
Switz
erla
nd 2
013
Net
herl
ands
201
1
Volunteers as % all staff Subsidies as % of all income

Example 2: add new insights
Figure 3 - Weekly web searches for ‘Performing Arts’ as a share of total searches January 2004 to February 2015, indexed to 2004
Source: Google Trends http://www.google.ca/trends/explore#cat=0-3-
23&geo=DE%2C%20FR%2C%20GB%2C%20IT%2C%20PL&cmpt=geo&tz=

Example 3: improve official statistics on micro-companies
• Mapping of the UK video game industry (NESTA, 2014) uses a ‘hybrid’ approach:
official statistics + web-based search for companies whose web sites included
key words describing their business function (‘web scraping’ technique).
• +90 per cent of the companies identified are micro-companies.
1,320
582
1,902

Limits of alternative sources
• Geographical coverage
EU28 coverage not always ensured, but often the majority of MS is
covered;
Even if all MS are covered, data might not be available for all countries.
• Quality & comparability issues
No application of the European Statistical System’s (ESS) or other
international quality standards – but internal quality control and
validation;
Data are rarely comparable as coming from very different and mostly
incomparable sources – however, comparability of data in business
registers is satisfactory.

Conclusions
• Importance of reliable set of data to show impact of CCS and
inform policy making (Culture, Education, Trade, Innovation,
Internal Market, Competition, etc.) towards a “Creative Europe”.
• Guiding principles to recommendations & scenarii:
Feasible, given financial constraints
Europe to adopt a leading position at UN level for better classifications
Build on the existing - ESSnet, Eurostat - but address gaps
Inclusive - mobilise the industry and complementary data sources
Time-bound - can be implemented in the short and long term
(incremental approach)

Key recommendations
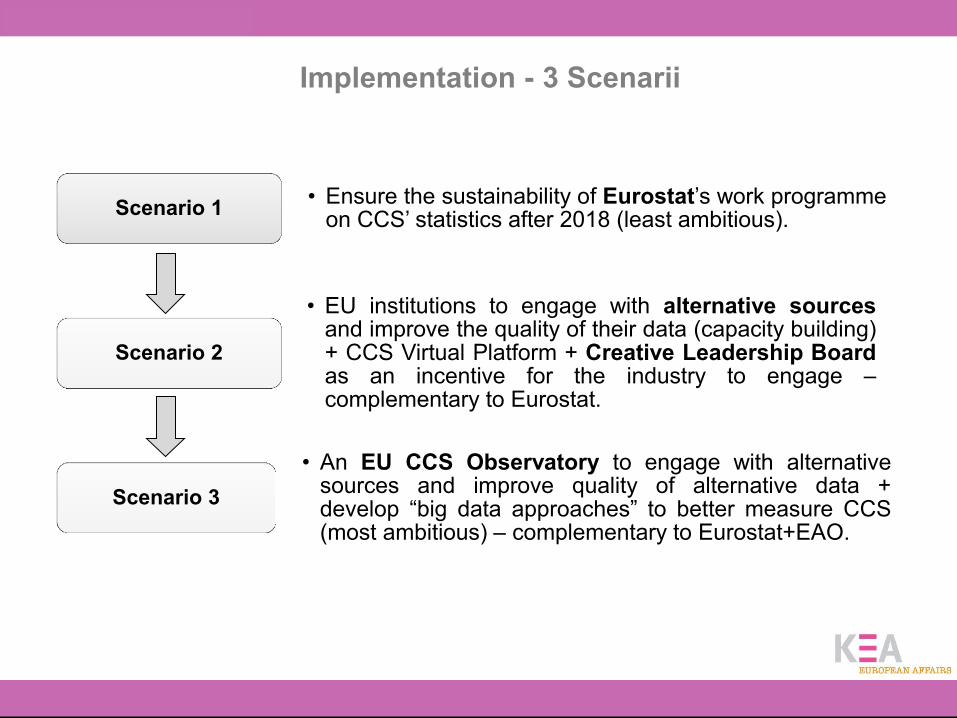
Implementation - 3 Scenarii
• Ensure the sustainability of Eurostat’s work programme on CCS’ statistics after 2018 (least ambitious).
Scenario 1
• EU institutions to engage with alternative sources and improve the quality of their data (capacity building) + CCS Virtual Platform + Creative Leadership Board as an incentive for the industry to engage – complementary to Eurostat.
Scenario 2
• An EU CCS Observatory to engage with alternative sources and improve quality of alternative data + develop “big data approaches” to better measure CCS (most ambitious) – complementary to Eurostat+EAO.
Scenario 3

Thank you!
Valentina Montalto
51 Rue du Trône
B -1050 Brussels
+32 2 289 26 00
www.keanet.eu
Creative Europe
@KEAtweets

Terms Of References (TOR) of the Study
• CCS definition: ESSnet + Creative Europe.
• Data sources (both public and private) to be identified along six
statistical axes: cultural capital of Europe (e.g. number of museums and
heritage sites), entrepreneurial dimension of CCS in the EU, CCS labour
market in the EU, contribution of CCS to the EU economy, cultural
diversity and participation in Europe, financing and expenditure.