DATA CARPENTRY FOR THE SOCIAL SCIENCES · Data Organization in Spreadsheets Learn how to organize...
36
DATA CARPENTRY FOR THE SOCIAL SCIENCES RDA Germany conference, 25-27 February 2020 https://subugoe.github.io/2020-02-25-dc-rda-germany/
Transcript of DATA CARPENTRY FOR THE SOCIAL SCIENCES · Data Organization in Spreadsheets Learn how to organize...

DATA CARPENTRY
FOR THE SOCIAL SCIENCES
RDA Germany conference, 25-27 February 2020
https://subugoe.github.io/2020-02-25-dc-rda-germany/

How we will proceed
• Round of Introductions• Short intro to the Carpentries • Overview of the workshop
• Housekeeping• Breaks
• Restrooms
• Notes during the workshop: https://pad.carpentries.org/2020-02-25-dc-rda-germany
2
● Train people in foundational computational and data science skills for more effective work and career development
● Build community and local capacity for teaching and learning these skills and perspectives
For a very brief history of The Carpentries see
https://twitter.com/raynamharris/status/1062516187874189312 (image)
https://carpentries.org/
3

76 member organisations https://carpentries.org/members/
38K learners reached
1.7K workshops
1.6K instructors trained
Workshops on 7 continents
Source: https://carpentries.org/files/assessment/TheCarpentries2018AnnualReport.pdf
4

Lesson programs
5

6
Lessons
Data Organization in Spreadsheets Learn how to organize tabular data, handle date formatting, carry out quality control and quality assurance and export data to use with downstream applications.
Data Cleaning with OpenRefine Explore, summarize, and clean tabular data reproducibly.
Data Analysis and Visualisation with R Import data into R, calculate summary statistics, and create publication-quality graphics.
Source: https://datacarpentry.org/socialsci-workshop/

7

Dataset
Studying African Farmer-led Irrigation (SAFI) dataset
The SAFI Project (http://www.safi-research.org/) is a research project looking at farming and irrigation methods used by farmers in Tanzania and Mozambique. This dataset is composed of survey data relating to households and agriculture in Tanzania and Mozambique.
The survey form was created using the ODK (Open Data Kit) software via an Excel spreadsheet.
We will use a sample of the collected data in CSV format throughout this workshop. The data can be downloaded from Figshare:https://figshare.com/articles/SAFI_Survey_Results/6262019
Source: https://datacarpentry.org/socialsci-workshop/ 8

How we will proceed during the workshop
Be kind & help each other, see Code of Conduct (see next slide)
Your questions are welcome - please use the sticky notes:➔Green = All is fine. / I am done.➔Red = Help me! / I have a question
9

Code of Conduct – Expected Behaviour
All participants are expected to show respect and courtesy to others.
In particular, we encourage the following behaviour:
• Use welcoming and inclusive language
• Be respectful of different viewpoints and experiences
• Gracefully accept constructive criticism
• Focus on what is best for the community
• Show courtesy and respect towards other community members
https://docs.carpentries.org/topic_folders/policies/code-of-conduct.html 10

Our trainers & helpers
• Trainers: oClaudia Engelhardt, Timo Gnadt
• Helpers:
oDaniel Bangert, Claudio Leone
11

After the workshop
• Certificates• Voluntary surveys
• Pre-workshop survey: https://www.surveymonkey.com/r/dcpreworkshopassessment?workshop_id=2020-02-25-dc-rda-germanyPost-workshop survey: https://www.surveymonkey.com/r/dcpostworkshopassessment?workshop_id=2020-02-25-dc-rda-germany
12

Data Organization in Spreadsheets
https://flickr.com/photos/ileohidalgo/1615237284813

Data Organization in SpreadsheetsRDA-DE Tagung
25.-27.02.2020
Potsdam, Germany

Data Organization in Spreadsheets
Breaking the 80/20 rule
How data scientists spend their time (roughly)*:
• 20% on data collection• 60% on data organization and cleaning• 20% on data analysis
15
*) CrowdFlower DataScience Report 2016: https://visit.figure-eight.com/rs/416-ZBE-142/images/CrowdFlower_DataScienceReport_2016.pdf
Why spreadsheets?

Data Organization in Spreadsheets
livestock_owned_and_numbers
1, (poultry)
3, (oxen , cows, goats)
1, (goats)
4, (oxen , cows)
10, (oxen , cows , goats , poultry)
1, (goats)
1, (oxen)
2, (oxen , goats)
3, (oxen , cows , goats)
Source: https://datacarpentry.org/spreadsheets-socialsci/ 16

Data Organization in Spreadsheets
livestock_owned_and_numbers
1, (poultry)
3, (oxen , cows, goats)
1, (goats)
4, (oxen , cows)
10, (oxen , cows , goats , poultry)
1, (goats)
1, (oxen)
2, (oxen , goats)
3, (oxen , cows , goats)
poultry cows goats oxen total
1 0 0 0 1
0 2 0 1 3
0 0 1 0 1
0 3 0 1 4
5 2 2 1 10
0 0 1 0 1
0 0 0 1 1
0 0 1 1 2
0 0 2 1 3
Source: https://datacarpentry.org/spreadsheets-socialsci/ 17

Data Organization in Spreadsheets
Tidy Data Principles1:
1.Put variables in columns
2.Put observations into rows
3.Don’t combine information in one cell
Var1 Var2 Var3 … VarX
Var1 Var2 Var3 … VarX
Observation 1
Observation 2
Var1 Var2 Var3 … VarX
Obs1_Var1 Obs1_Var2 Obs1_Var3 Obs1_... Obs1_Var5
Obs2_Var1 Obs2_Var2 Obs2_Var3 Obs2_... Obs2_Var5
181Hadley Wickham, Tidy Data, Vol. 59, Issue 10, Sep 2014, Journal of Statistical Software. http://www.jstatsoft.org/v59/i10

Data Organization in Spreadsheets
Tidy Data Principles:
1. Put variables in columns2. Put observations into rows3. Don’t combine information
in one cell
Further recommendations:
4. Leave raw data raw5. Take notes of cleaning steps6. Export cleaned data to text-based format7. Be concise and consistent in naming
8. Use date format YYYY-MM-DD (ISO standard)9. Leave no cells empty10.Make it a rectangle11.Explain your data (Data dictionary, metadata)12.No colors or comments
19

Data Organization in Spreadsheets
Exercise 1:
1. Download the messy data: https://ndownloader.figshare.com/files/11502824
2. Open up the data in a spreadsheet program. Notice that there are two tabs. Two researchers conducted the interviews, one in Mozambique and the other in Tanzania. They both structured their data tables in a different way. Now, you’re the person in charge of this project and you want to be able to start analyzing the data.
3. With the person next to you, identify what is wrong with this spreadsheet. Discuss the steps you would need to take to clean up the two tabs, and to put them all together in one spreadsheet.
Source: https://datacarpentry.org/spreadsheets-socialsci/ 20

Data Organization in Spreadsheets
Exercise 2:
1. Download a clean version of this dataset: https://ndownloader.figshare.com/files/11492171
2. Open the file with your spreadsheet program. You will need to import it since it is in .csv format. This data has many more variables that were not included in the messy spreadsheet and is formatted according to tidy data principles.
3. Discuss this data with a partner and make a list of some of the types of metadata that should be recorded about this dataset. It may be helpful to start by asking yourself:
a. What is not immediately obvious to me about this data?
b. What questions would I need to know the answers to in order to analyze and interpret this data?
Source: https://datacarpentry.org/spreadsheets-socialsci/ 21

Data Organization in Spreadsheets
Common errors in spreadsheets
1. Using multiple tables
2. Using multiple tabs
3. Not filling in zeros
4. Using problematic null values
5. Using formatting to convey information
6. Using formatting to make the data sheet look pretty
7. Placing comments or units in cells
8. Entering more than one piece of information in a cell
9. Using problematic field names
10. Using special characters in data
Source: https://datacarpentry.org/spreadsheets-socialsci/ 22

Data Organization in Spreadsheets
Exercise 3:1. Download and open the dates.xlsx file:
https://ndownloader.figshare.com/files/11502827
This file contains a subset of the data from the SAFI interviews, including the dates on which the interviews were conducted.
2. Choose the tab of the spreadsheet that corresponds to the way you format dates in your location (either day first DD_MM_YEAR, or month first MM_DD_YEAR).
3. Extract the components of the date to new columns. For this we can use the built in Excel functions:
=MONTH() =MONAT()
=DAY() =TAG()
=YEAR() =JAHR()
Apply each of these formulas to its entire column. Make sure the new column is formatted as a number and not as a date.
4. Add another data point in the interview_date column by typing either 11/17 (if your location uses MM/DD formatting) or 17/11 (if your location uses DD/MM formatting). The Day, Month, and Year columns should populate for this new data point. What year is shown in the Year column?
Source: https://datacarpentry.org/spreadsheets-socialsci/ 23

Data Organization in Spreadsheets
Exercise 4:
1. Apply a new data validation rule to one of the other numeric columns in the data table of the clean dataset. Discuss with the person sitting next to you what a reasonable rule would be for the column you’ve selected. Be sure to create an informative input message.
Exercise 5:
1. Apply a new data validation rule to one of the other categorical columns in the data table of the clean dataset. Discuss with the person sitting next to you what a reasonable rule would be for the column you’ve selected. Be sure to create an informative input message.
Source: https://datacarpentry.org/spreadsheets-socialsci/ 24

Data Organization in Spreadsheets
References:
Karl W. Broman & Kara H. Woo, Data Organization in Spreadsheets, Vol. 72, Issue 1, 2018, The American Statistician.https://www.tandfonline.com/doi/full/10.1080/00031305.2017.1375989
Hadley Wickham, Tidy Data, Vol. 59, Issue 10, Sep 2014, Journal of Statistical Software. http://www.jstatsoft.org/v59/i10
25

OpenRefine for Social Science DataRDA-DE Tagung
25.-27.02.2020
Potsdam, Germany

OpenRefine for Social Science Data
What you need today:
• OpenRefine installed (we recommend using the latest stable version 3.3)https://openrefine.org/download.html
• A Web browser (Firefox or Chrome recommended – NOT Internet Explorer)
• The SAFI Dataset SAFI_openrefine.csvhttps://ndownloader.figshare.com/files/11502815
Starting OpenRefine:
• Windows: double-click on openrefine.exe
• MacOS: launch OpenRefine from Applications folder
• Linux: run ./refine in the OpenRefine directory
If you are using a different browser, or OpenRefine does not automatically open for you, point your browser at http://127.0.0.1:3333/ or http://localhost:3333 to launch the program.
Source: https://datacarpentry.org/openrefine-socialsci/ 27

OpenRefine for Social Science Data
Why OpenRefine?
• Tools to identify and amend messy data• Documentation of data cleaning steps• Leave raw data untouched• Undo/redo of steps, also on other files• Easy use of complex algorithms• Open source• Large community• Works with datasets up to 100.000 rows, extendable
Source: https://datacarpentry.org/openrefine-socialsci/ 28

OpenRefine for Social Science Data
Exercise 1 (Faceting):
1. Using faceting, find out how many different interview_date values there are in the survey results.
2. Is the column formatted as Text or Date?
3. Use faceting to produce a timeline display for interview_date. You will need to use Edit cells
> Common transforms > To date to convert this column to dates.
4. During what period were most of the interviews collected?
Source: https://datacarpentry.org/openrefine-socialsci/ 29

OpenRefine for Social Science Data
Exercise 2 (Transforming data):
1. Using the strategy just shown, remove the single quote marks ('), the right square brackets (]), and spaces
from the items_owned column.
2. Which two items are the most commonly owned? Which are the two least commonly owned?
3. Perform the same clean up steps and customized text faceting for the months_lack_food column.
Which month(s) were farmers more likely to lack food?
4. Perform the same clean up steps for the months_no_water, liv_owned, res_change, and
no_food_mitigation columns.
Hint: To reuse a GREL command, click the History tab and then click Reuse next to the command you
would like to apply to that column.
Source: https://datacarpentry.org/openrefine-socialsci/ 30

OpenRefine for Social Science Data
Exercise 3 (Undo/Redo):
1. Click where it says Undo / Redo on the left side of the screen. All the changes you have made so far are listed here.
2. Click on the step that you want to go back to, in this case go back several steps to before you had done any text transformation.
3. Visually confirm that those columns now contain the special characters that we had removed previously.4. Notice that you can still click on the later steps to Redo the actions. Before moving on to the next
lesson, redo all the steps in your analysis so that all of the column you modified are lacking in square brackets, spaces, and single quotes.
Source: https://datacarpentry.org/openrefine-socialsci/ 31

OpenRefine for Social Science Data
Exercise 4 (Filtering):
1. Click the down arrow next to respondent_roof_type > Text filter. A
respondent_roof_type facet will appear on the left margin.
2. Type in mabat and press return. There are 58 matching rows of the original 131 rows (and these rows
are selected for the subsequent steps).
3. At the top, change the view to Show 50 rows. This way you will see most of the matching rows.
4. What roof types are selected by this procedure?
5. How would you restrict this to only one of the roof types?
6. Use include / exclude to select only entries from one of these two roof types.
Source: https://datacarpentry.org/openrefine-socialsci/ 32

OpenRefine for Social Science Data
Source: https://datacarpentry.org/openrefine-socialsci/ 33
Faceting and Filtering
• Faceting gives you an overview description of all of the data that is currently selected
• Filtering allows you to select a subset of your data for analysis
When you create a facet of a filtered dataset, it will only display values from the filtered dataset
When you add or remove a filter while having a facet open, the facet will update its values
OpenRefine for Social Science Data
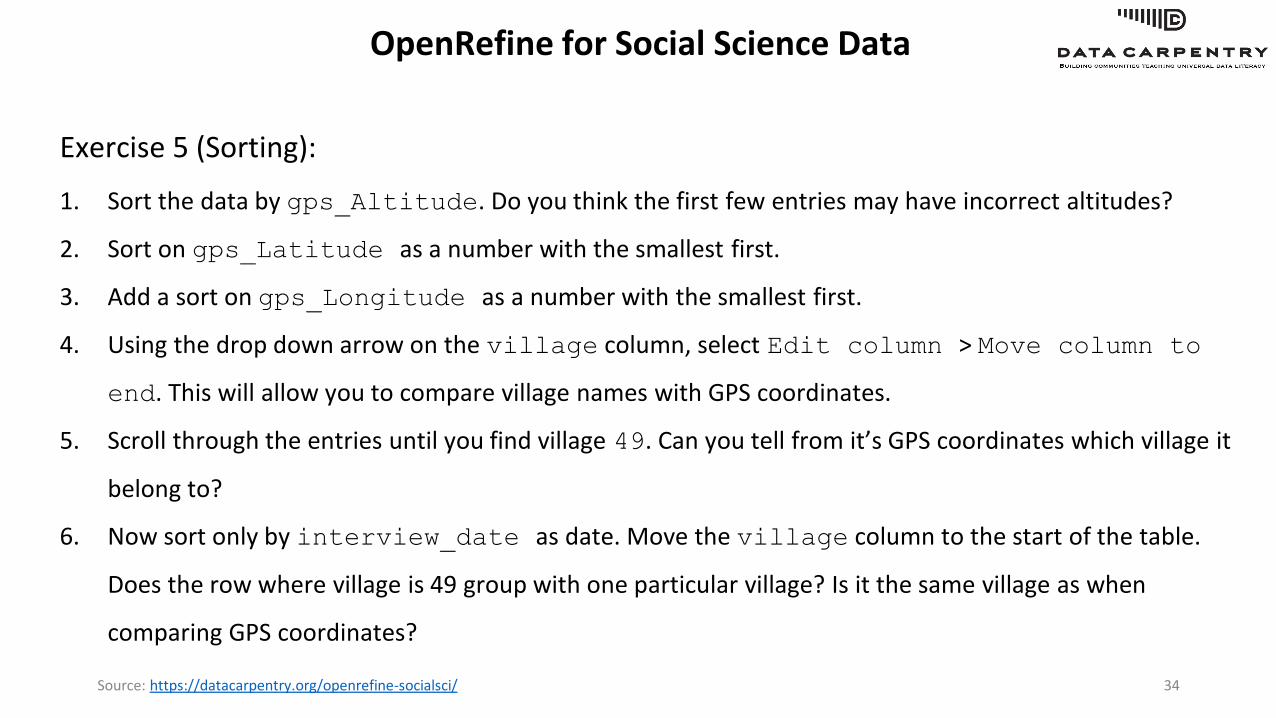
Exercise 5 (Sorting):
1. Sort the data by gps_Altitude. Do you think the first few entries may have incorrect altitudes?
2. Sort on gps_Latitude as a number with the smallest first.
3. Add a sort on gps_Longitude as a number with the smallest first.
4. Using the drop down arrow on the village column, select Edit column > Move column to
end. This will allow you to compare village names with GPS coordinates.
5. Scroll through the entries until you find village 49. Can you tell from it’s GPS coordinates which village it
belong to?
6. Now sort only by interview_date as date. Move the village column to the start of the table.
Does the row where village is 49 group with one particular village? Is it the same village as when
comparing GPS coordinates?
Source: https://datacarpentry.org/openrefine-socialsci/ 34
OpenRefine for Social Science Data
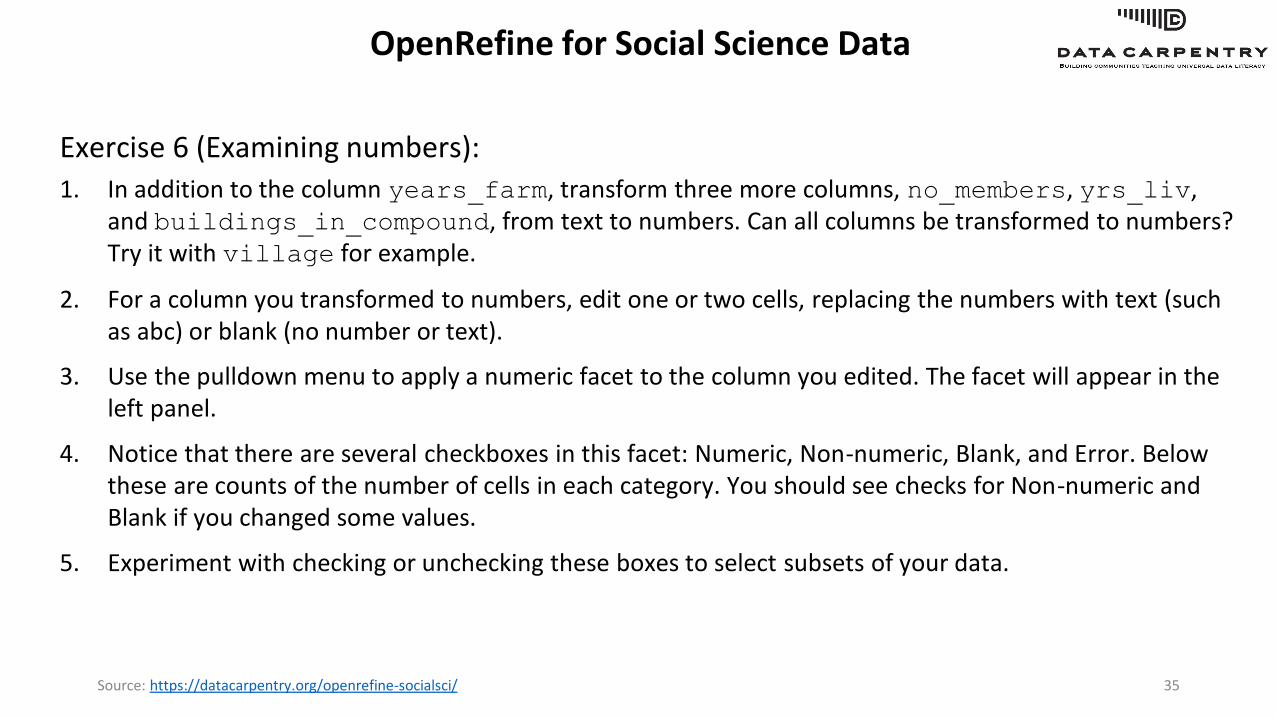
Exercise 6 (Examining numbers):
1. In addition to the column years_farm, transform three more columns, no_members, yrs_liv, and buildings_in_compound, from text to numbers. Can all columns be transformed to numbers? Try it with village for example.
2. For a column you transformed to numbers, edit one or two cells, replacing the numbers with text (such as abc) or blank (no number or text).
3. Use the pulldown menu to apply a numeric facet to the column you edited. The facet will appear in the left panel.
4. Notice that there are several checkboxes in this facet: Numeric, Non-numeric, Blank, and Error. Below these are counts of the number of cells in each category. You should see checks for Non-numeric and Blank if you changed some values.
5. Experiment with checking or unchecking these boxes to select subsets of your data.
Source: https://datacarpentry.org/openrefine-socialsci/ 35

OpenRefine for Social Science Data
Other Resources on OpenRefine
https://datacarpentry.org/openrefine-socialsci/07-resources/index.html
36


![Modeling Tabular data using Conditional GAN...PATE-GAN [14] generates differentially private synthetic data. 3 Challenges with GANs in Tabular Data Generation Task The task of synthetic](https://static.fdocuments.us/doc/165x107/60d1dfbcc54759291e4cf3d3/modeling-tabular-data-using-conditional-gan-pate-gan-14-generates-differentially.jpg)