
Data Analytics and Members’ Economic Footprint and Impact...
49
Innovative Medicines Canada Data Analytics and Members’ Economic Footprint and Impact in Canada Analysis and Assessment of Members’ Economic Footprint and Impact in Canada to Support Innovation and System Sustainability October 2017
Transcript of Data Analytics and Members’ Economic Footprint and Impact...
Innovative Medicines Canada
Data Analytics and Members’ Economic Footprint and Impact in Canada Analysis and Assessment of Members’ Economic Footprint and Impact in Canada to Support Innovation and System Sustainability
October 2017
All Rights Reserved | EY
i
About Innovative Medicines Canada
Innovative Medicines Canada represents Canada’s innovative pharmaceutical industry. Innovative
Medicines Canada is the national voice of Canada's innovative pharmaceutical industry. The
association advocates for policies that enable the discovery, development and commercialization of
innovative medicines and vaccines that improve the lives of all Canadians, and supports members'
commitment to being valued partners in the Canadian healthcare system.
About Ernst & Young
EY is a global leader in assurance, tax, transaction and advisory services. The insights and quality
services we deliver help build trust and confidence in the capital markets and in economies the
world over. We develop outstanding leaders who team to deliver on our promises to all of our
stakeholders. In so doing, we play a critical role in building a better working world for our people, for
our clients and for our communities.
Our Global Life Sciences and Health Sectors jointly bring together a worldwide network of 19,000
sector-focused professionals to anticipate trends, identify their implications and help our clients
create competitive advantage. This wide-reaching network allows us to rapidly share leading
practices and solutions around the globe and contribute to building a better working world for all
stakeholders.
Project background
EY was commissioned by Innovative Medicines Canada in January 2017 to provide data analytics
and insights. This work is intended to inform an evidence-based predictable, stable and sustainable
pricing and patient access environment with the public payers, as well as the various bodies
(PMPRB, pCPA, CADTH, INESSS, CAPCA etc.) that influence pharmaceutical review and funding
decisions in Canada. This will ultimately improve timely and appropriate access for patients,
affordability for public payers, and support R&D and innovation in the pharmaceutical sector. This
report is not an analysis of the entire life-sciences sector in Canada.

All Rights Reserved | EY
ii
Key contributors
The following individuals contributed to the content of this report:
From Innovative Medicines Canada:
► Chander Sehgal
From EY:
► Giselle Commissiong
► Mike Miller
A number of other individuals contributed to the planning, data collection, data analysis and
development of the content of this report:
From Innovative Medicines Canada:
► Sarah Lussier-Hoskyn
► Declan Hamill
► Glenn Monteith
From EY:
► Chris Wayman
► Mehdi Assadi-Moghadam
► Varun Malhotra
► Elizabeth Pequegnat

Confidential | All Rights Reserved | EY
2
Executive summary ........................................................ 1
Introduction ................................................................... 6
Scope and objectives.................................................... 11
Methodology ................................................................ 13
Results ........................................................................ 17
Discussion ................................................................... 28
Appendix ..................................................................... 33
References .................................................................. 43
This publication contains information in summary form, current as of the date of the publication, and is intended for general
guidance only. It should not be regarded as comprehensive or a substitute for professional advice. The information presented in
this publication should not be construed as legal, tax, accounting, or any other professional advice or service. Ernst & Young LLP
can accept no responsibility for loss occasioned to any person acting or refraining from action as a result of any material in this
publication. You should consult with Ernst & Young LLP or other professional advisors familiar with your particular factual
situation for advice concerning specific audit, tax or other matters before making any decision. (c) 2017 Ernst & Young LLP. All
rights reserved.
Con
ten
ts
All Rights Reserved | EY 1
Executive summary Drug spending represents a significant
component of healthcare spending in Canada,
along with hospitals and physicians. As such, it
is an increasing focus area for policy makers,
with systemic changes, from PMPRB, to CADTH,
INESSS, CAPCA, and pCPA (please see
Appendix-A for Glossary) all designed to
increase scrutiny on value and cost-
effectiveness. With higher priced, specialty
drugs making up an increasing share of
products being introduced into a budget-
constrained market on the one hand, and the
advent of new technologies such as biosimilars
and genomics enabling a search for value on
the other, pressure and complexity of pricing
approaches can only be expected to increase.
For example, in May 2017, Health Canada
proposed updating several aspects of PMPRB
regulations governing patented medicines,
including an update of the reference country
basket set.
The objective of this project is to help
Innovative Medicines Canada and its members
inform future public policy responses using
hard data, supported by an analytical model,
and based on actual member data. Ultimately,
this work should inform a “made-in-Canada”
patient access and innovation framework. The
project has several objectives:
► Develop a comprehensive data set based
on member data
► Assess the economic footprint and impact
of Innovative Medicines Canada members;
► Quantify Innovative Medicines Canada
members’ investments in Canada;
► Identify potential solutions, based on data
and evidence, to support long-term
sustainability for all stakeholders.
The analysis for this project is informed by
Innovative Medicines Canada member-specific
data collected by EY including revenue, R&D,
other investments, operational and corporate
datasets. The data has been aggregated to
conduct analysis and inform key insights. A
critical mass of two-thirds or more of the
Innovative Medicines Canada members
contributed to different parts of the datasets of
this report as of August 9, 2017. Given that
data was not collected from all members, the
resulting gross revenue and investment figures
may be considered conservative.
Economic footprint and impact
Innovative Medicines Canada members
contribute to Canada’s health sector ecosystem
and broader economy, indirectly supporting
other employment through the network effect
of its supply chain and distribution activities,
and through the purchasing power of its
employees. Analysis was completed to
determine the economic impact of Innovative
Medicines Canada’s members, based on the
data collected from individual members.
As can be seen in Figure 1, the activities of the
Innovative Medicines Canada members who
submitted data as of August 9, 2017, added
over $19.2B of gross value added (GVA, a
measure of the total economic footprint) to the
Canadian economy in 2016. For every $1.00
attributed directly to the participating
members, another $0.59 is generated
indirectly by the activities through the supply
chain, while a further $0.44 of induced impact
is supported by the employment income and
associated spending across the Canadian
economy.

All Rights Reserved | EY 2
The activities of these members also support
just over 30,000 jobs across the Canadian
economy, as shown in Figure 1, which
represents a relatively important contribution
with respect to other sectors. For example, in
terms of R&D, while it is not the largest R&D
investor, it has a strong R&D footprint: a report
by Research Infosource compiled information
on Canada’s top corporate spenders for 2016
suggests that the Pharmaceutical and
Biotechnology firms represented in the top 100
list have the third greatest combined total
spending on R&D, only behind the Aerospace
and Software/Computer Services sectors.
Gross patented product revenues of
Innovative Medicines Canada
members
Total reported gross patented
products revenue as reported
by the participating Innovative
Medicines Canada members to
PMPRB was approximately
$11.95B for 2016. The growth
in gross annual patented
product revenue as reported to
PMPRB was marginal over the
reporting period of 2014-16
(CAGR 2.2%), with a slight
reduction observed in 2016
from 2015.
Figure 1. Economic impact of participating Innovative Medicines Canada members.
$9,901M$10,909M $11,091M
$1,296M
$1,213M $0,862M
$0,M
$2,000M
$4,000M
$6,000M
$8,000M
$10,000M
$12,000M
$14,000M
2014 2015 2016
Existing New
Figure 2. Total reported gross patented products revenue for participating Innovative Medicines Canada members.

All Rights Reserved | EY 3
These revenue figures exclude public sector rebates, such as those negotiated by pCPA, but may
include other benefits reported to PMPRB as per the current regulations.
Research and development
Participating members also reported a total of $1,19B in R&D
investments for 2016, primarily for clinical research-based
activities. These investments include PMPRB Form 3 SR&ED-
eligible and non-SR&ED-eligible R&D such as investments in
randomized controlled trials (RCT), real world evidence, and
Phase IV studies. This amounts to an estimated total 9.97% of
gross patented product revenues (i.e. $1,190M of the $11.95B)
reported in 2016. Of note, even with the decrease in gross
revenues from 2015 to 2016, the total investment in R&D and
innovation still increased.
Patient support programs
Patient support programs (PSPs) have been
developed by innovative pharmaceutical
companies over time to help patients and
health care providers navigate the gaps and
challenges in accessing manufacturers’
innovative therapies within a healthcare system
that is not always equipped to deliver these
emerging new therapies at launch. Despite
this, there are no published comprehensive
sources of the estimated scope and impact of
PSPs in Canada. This exercise attempted to
build a baseline data set from which to begin to
understand this impact. Based on the member
data collected, the number of patients reported
by participating members to be enrolled in
PSPs in Canada was approximately 673,000 in
2016. In tandem with the increase in number of
patients supported over the reporting period,
members’ reported level of investment also
increased over the time period, from $560M in
2014, to $720M in 2015, to $900M in 2016,
suggesting ongoing and long term
commitments by members to patients and
PSPs. Just over 50% of 2016 PSP spending
was allocated to non-oncology specialty drugs.
Moving forward
The findings from this exercise demonstrate
that there are potential benefits for Innovative
Medicines Canada members, payers and policy
makers, in co-developing solutions to the
system sustainability challenges that will lead
to longer term certainty of outcomes for
patients, payers, and manufacturers. Examples
of potential areas of collaboration include
improving system efficiencies, collaboration
between public and private sectors to make
Canada a more competitive place for both basic
R&D and clinical research, implementation of
performance-based risk-sharing agreements
supported by real-world evidence, and building
and governing the necessary associated data
and infrastructure.
Key to the implementation of such agreements
Figure 3. Total R&D spend 2016 as reported by Innovative Medicines Canada members

All Rights Reserved | EY 4
is the data infrastructure, administrative
capacity, and governance model in which they
are implemented. At present, although Canada
benefits from highly centralized datasets of
public administrative data which could facilitate
the implementation of such agreements, the
investment required to establish an effective
infrastructure to manage such a system on a
widespread basis over the long term, enabled
by real-world evidence collected at the point of
patient care, is significant. Innovative
Medicines Canada member participation and
investment in such infrastructure could help
move system transformation forward.
This exercise is ultimately one step in a long-
term journey. While a critical mass of data has
been captured and analysed, it is important
that the exercise not stop at this early stage. It
is essential that efforts be made to maintain
and build on the current dataset, to establish a
longitudinal and robust set of information that
can be analysed over time.

All Rights Reserved | EY 5
Introduction
All Rights Reserved | EY
6
Introduction Policy environment for prescription medicines in the Canadian healthcare system
Overview
The policy environment for drug pricing and
reimbursement in Canada has evolved
significantly in the past 15 years. As
healthcare has consumed increasing shares of
overall public budgets across the country,
driven by demographic and other demand
factors, policy makers have placed their focus
on new approaches to manage the long-term
sustainability challenge. Opportunities are
being identified to shift patients out of more
expensive acute hospital settings, into
community based care. Innovative models of
care are being developed to determine how
more multidisciplinary provider approaches can
improve patient care while reducing overall cost
structures. For drugs, the discussion has
largely been around price. The system has gone
from one where pricing was left to be
negotiated between manufacturers and
individual provincial jurisdictions, with little to
no provincial coordination, to the present
system in which the pan-Canadian
Pharmaceutical Alliance (pCPA) is driving
negotiation of pricing terms on behalf of the
provinces. While this has resulted in a more
streamlined process, it has actually amplified
the very real challenges of establishing a
common vision of the value of pharmaceuticals
between payers and manufacturers.
In this environment, the challenge of
1 Canadian Institute for Health Information, National
Health Expenditure Trends 1975 to 2016
demonstrating the value of innovative
medicines in Canada has never been greater.
In addition to providing “pills”, value may be
contributed in other ways, through additional
front-line supports such as investments in R&D
and clinical trials; medical education, patient
education, specialized tools, patient support
programs, and financial assistance; community
investments; as well as the effort invested in
working collaboratively with payers in the
conversation around achieving system
sustainability, through mechanisms such as
rebates to public payers.
Key considerations for a comprehensive pricing policy and patient access framework
Public health care spending takes up an
increasing share of government budgets and is
becoming more challenging for governments to
finance. In Canada, according to the Canadian
Institute for Health Information (CIHI), total
health expenditure in 2016 was expected to
reach $228.1 billion. Earlier CIHI data from
2013 showed that health care expenditures
represent the largest budget line for provinces,
in general representing between 30% and 40%
of provincial budgets although there are some
outliers. 1
Drug spending represents approximately 16% of
all public health care spending according to
CIHI. In addition to public spending on drugs,
individuals and private payers also contribute to
pharmaceutical expenditures. Hospitals
(29.5%), drugs (16.0%) and physician services
All Rights Reserved | EY
7
(15.3%) continue to account for the largest
shares of health dollars (more than 60% of total
health spending). Although spending continues
to grow in all three categories, the pace has
slowed in recent years.
Reflecting global trends, the mix of drug
therapies that Canadians are accessing is
evolving to higher-priced, specialty drugs. CIHI
data shows that, from 2008 to 2013, for
example, that 4 of 10 drug classes contributing
to the bulk of public drug spending were
biologic agents. 2
A review of manufacturer
pipelines suggests that there are many more
such therapies on the horizon to come to
market in the coming years. All of these
factors, among others, point to an increasing
challenge for patients to access the drugs that
they need and for public payers to contain the
costs of drugs. Thus, on several fronts, there is
impetus to assess broader approaches to
achieving universal drug coverage for citizens
in Canada. Below are several key
considerations for Innovative Medicines Canada
in developing a comprehensive pricing
framework with payers.
Budget Sustainability
The approach for developing a
comprehensive pricing policy and
market access framework will need to balance
the desire to reduce the burden on taxpayers
and create a more consistent environment of
drug pricing while maintaining quality and
accessibility to new and existing drugs. Like
most developed countries, Canada has adopted
a good number of policies aiming to control
pharmaceutical spending, including price caps,
2 Canadian Institute for Health Information,
Prescribed Drug Spending in Canada, 2013: A Focus on Public Drug Programs, (May 2015).
drug reimbursement limits (formularies), cost-
effectiveness analyses and bulk purchasing.
Therefore it is timely to seek a different
approach to increasing the availability of
prescription drugs through new approaches to
value, cost, and pricing, including new
contracting models based on patient outcomes
and risk-sharing or pay for performance, for
example. While these models have held some
appeal, the challenge of defining and agreeing
on end points, how risk is shared, how
performance is rewarded, etc. is more difficult
to address at a conceptual level. The idea of
developing a comprehensive analytical model to
analyze various scenarios could be a key
starting point in gaining this agreement.
Creating value within the
health system
The desire to increase reasonable and
equitable access to drug treatment options and
improving consistency of access across Canada
while rewarding innovation are important goals
for a comprehensive patient access framework.
While other jurisdictions may be implementing
new approaches, there are also differences in
health system design and governance, including
the role of public payers, providers, and HTA
bodies, which may inform important
considerations given Canada’s complex
operating environment. For example, the role
of patient support programs in Canada is very
different than that in other jurisdictions:
Canadian patient support programs often
address gaps in the healthcare system to help
enable patient access. Experience in other
jurisdictions will highlight the importance of
1
2
All Rights Reserved | EY
8
defining, in a Canadian context, the roles and
responsibilities of manufacturer and payer, and
the value delivered by each party. Proactively
agreeing on what services and value the public
system can provide, and what the role of the
manufacturers should be, is key to striking the
balance between patient accessibility and
health system affordability.
Creating value beyond the
Health System
The potential economic value
generated to the overall economy by drug
manufacturers and their products and activities
extends beyond the healthcare system.
Identifying the value generated by employment,
community and infrastructure investments,
contributions to research and innovation, and
other factors beyond direct health system
impacts is an important element of developing
a comprehensive pricing and market access
framework. It will be important to ensure that
any long-term solutions take economic impacts
into account.
Optimizing Canadian decision
processes
The existing landscape of governance
and administration of drug funding decision
processes in Canada has multiple layers,
including PMPRB, pCPA, CADTH, INESSS,
CAPCA, and also requires engagement of
patient groups to be effective. These multiple
review steps contribute to a relative lack of
timeliness in getting drugs to patients, post-
NOC. There is opportunity to look across NOC,
HTA, price negotiations, and other key
3 Accelerated Access Review: Final Report, Review
of innovative medicines and medical technologies, Wellcome Trust, 2016
processes to understand and quantify
inefficiencies, and build these into the model, in
terms of potential resource savings, improved
patient outcomes and other key benefits. The
UK Accelerated Access Review3, which provides
an example of strategies to enhance patient
access through collaboration between
governments and innovative pharmaceutical
companies, is an attempt to cut through some
of these inefficiencies under the appropriate
conditions. However, these types of innovative
approaches also require collaboration to
implement, underlying the importance of
bringing system stakeholders together to
develop common ground.
3
4
All Rights Reserved | EY 9
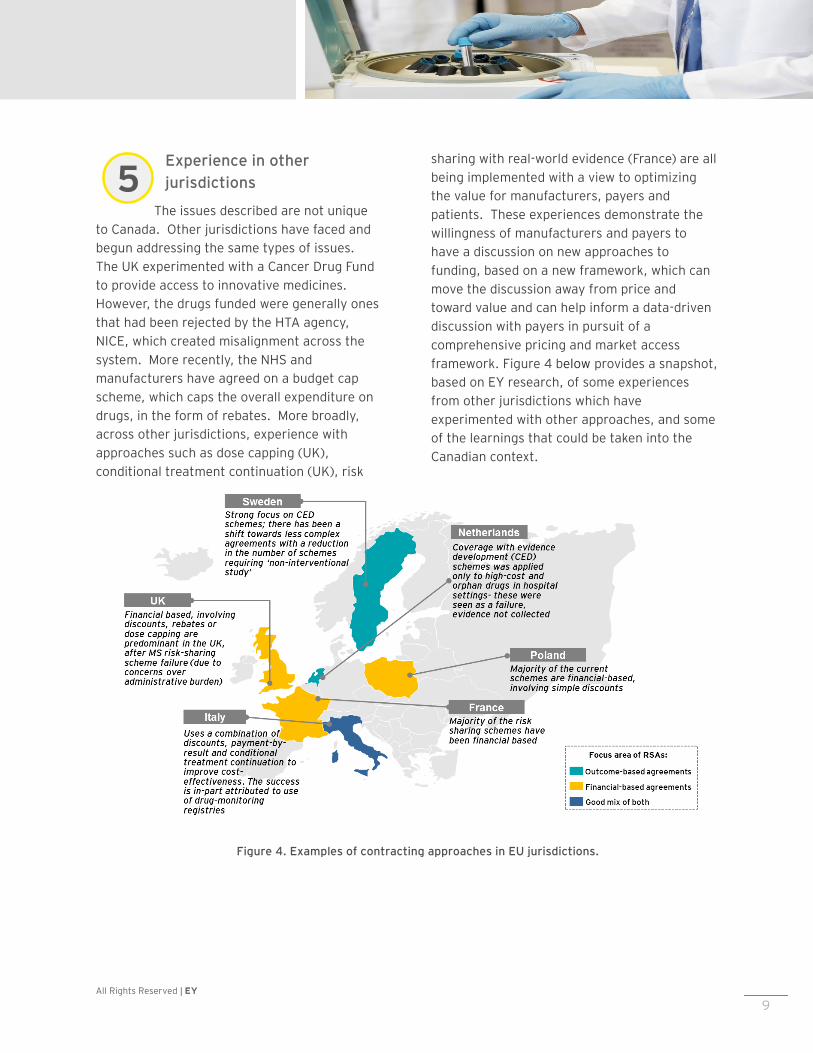
Experience in other
jurisdictions
The issues described are not unique
to Canada. Other jurisdictions have faced and
begun addressing the same types of issues.
The UK experimented with a Cancer Drug Fund
to provide access to innovative medicines.
However, the drugs funded were generally ones
that had been rejected by the HTA agency,
NICE, which created misalignment across the
system. More recently, the NHS and
manufacturers have agreed on a budget cap
scheme, which caps the overall expenditure on
drugs, in the form of rebates. More broadly,
across other jurisdictions, experience with
approaches such as dose capping (UK),
conditional treatment continuation (UK), risk
sharing with real-world evidence (France) are all
being implemented with a view to optimizing
the value for manufacturers, payers and
patients. These experiences demonstrate the
willingness of manufacturers and payers to
have a discussion on new approaches to
funding, based on a new framework, which can
move the discussion away from price and
toward value and can help inform a data-driven
discussion with payers in pursuit of a
comprehensive pricing and market access
framework. Figure 4 below provides a snapshot,
based on EY research, of some experiences
from other jurisdictions which have
experimented with other approaches, and some
of the learnings that could be taken into the
Canadian context.
Figure 4. Examples of contracting approaches in EU jurisdictions.
5

All Rights Reserved | EY 10
Scope and objectives

All Rights Reserved | EY 11
Scope and objectives Drug spending is an increasing focus area for
policy makers, with systemic changes, from
PMPRB, to CADTH and INESSS, CAPCA and
pCPA - all designed to increase scrutiny on
value and cost-effectiveness. With higher
priced, specialty drugs making up an increasing
share of products being introduced into a
budget-constrained market on the one hand,
and the advent of new technologies such as
biosimilars and genomics enabling a search for
value on the other, pressure and complexity of
pricing approaches can only be expected to
increase.
The level of effort, time and resource
requirements to navigate this landscape have
resulted in corresponding increasing timelines
from NOC (Notice of Compliance - i.e. market
authorization or approval by Health Canada) to
public coverage, ultimately impacting patients’
ability to access new therapies in a timely
manner. The sustainability of the current state
from a drug budget expenditure perspective is
of significant concern for payers as specialty
drugs make up an increasing share of drugs
being introduced into the Canadian market. In
addition, the focus on funding sustainability is a
concern for manufacturers from an economic
perspective.
These challenges present an opportunity for a
fresh approach that recognizes and leverages a
broad set of tools, beyond price and cost, to
deliver value for all stakeholders.
The objective of this project was to help
Innovative Medicines Canada and its members
inform future public policy solutions using hard
data, supported by analytical models based on
actual member data. Ultimately, the goal of
this and future exercises is to inform a “made-
in-Canada” negotiated pricing framework to be
used for all future pricing negotiations with
payers.
The goal is to constructively change the
conversation and help establish a more
sustainable framework that mutually benefits
payers, providers, industry, and patients. A key
part of changing the conversation is to establish
and agree on the issues at hand, based on hard
data and facts.
This initiative would enable more transparent
and data-driven decision-making process
around the trade-offs that policy makers and
manufacturers can jointly make among price,
innovation, social impact, and resource effort.
To enable this level of transparent process and
discussion, this project used historical member
data to understand potential trade-offs between
different parameters. This undertaking, while
complex, is a required step in creating
alignment between payers and manufacturers
on pricing and value trade-offs.
Project Scope and Objectives:
► Identify data-driven solutions to support
long-term sustainability for all
stakeholders;
► Develop a comprehensive data set
based on member data;
► Assess the economic footprint and
impact of Innovative Medicines Canada
members; and
► Quantify Innovative Medicines Canada
members’ investments in Canada

All Rights Reserved | EY 12
Methodology

All Rights Reserved | EY 13
Methodology This section outlines the key methodologies used to collect and analyse data associated with this project. It includes a detailed overview of the methods used to collect and aggregate individual Innovative Medicines Canada member data, as well as an outline of the analytical approaches to capture insights from the collected data.
Data Collection Approach
Data description
The analyses in the current report are based in part on data solicited from the members of Innovative
Medicines Canada. The data solicited from the member firms included sensitive information
concerning:
► Gross patented product revenue generated from the sale of prescription medicines in Canada as
reported to PMPRB
► Volumes of medicines sold in Canada as reported to PMPRB
► The geographic distribution of sales
► The distribution of sales across different buyers and payers
► The volume of investment in research and development (R&D) carried out in Canada in terms of
dollars spent and R&D activities (e.g. clinical trials)
► The volume and distribution of investment and spending in non-research activities including patient
support, provider education, charitable giving, and other operations.
Collection of this data took two forms, the first being the use of standard reporting forms all
pharmaceutical companies in Canada are required to provide to the Canadian patented pharmaceutical
pricing regulator, the PMPRB, on a regular basis, and the second being a series of customized
questionnaires prepared by EY and provided to each member firm.
PMPRB Forms
Member firms were asked to provide the following forms which they provide annually or semi-annually
to the Patented Medicine Prices Review Board (PMPRB):
► Form 2 – Information on the Identity and Prices of the Medicine
o Block 4 – Sales of the Medicine by the Patentee in Final Dosage Form in Canada
o Block 5 – Publicly Available Ex-Factory Prices for Canada and Other Countries
► Form 3 – Revenues and Research and Development Expenditures
The use of PMPRB data confers a number of advantages to the data pool used for the analysis in this
report including timeliness, consistency, and transparency. Submissions covered the years 2014,
2015, and 2016.
EY questionnaires
In addition to standardized data provided to the PMPRB, the member firms were asked to respond to

All Rights Reserved | EY 14
several questionnaires that were prepared by EY, requesting key data for the analyses in this report.
The questionnaires covered the following data areas:
R&D and Clinical Trials – The EY questionnaire concerning R&D and Clinical Trials complemented
PMPRB Form 3 through a more granular view of R&D-related investments.
Patient Support Programs (PSP) – Data was solicited from member firms concerning their investment
in Patient Support Programs including spending, patient type, and numbers of patients supported.
Corporate Information – Data was solicited from member firms to examine the economic role played
both in the healthcare domain and in the broader Canadian economy including investment in provider
education, community programs, and related initiatives. With regard to the broader economy, member
firms were solicited to provide data on capital investments, salaries and benefits, and taxes.
A data collection process was developed which balanced the needs for assuring the confidentiality of
the data being solicited.
Data collection results
A critical mass of Innovative Medicines Canada member data (i.e. two-thirds or more of members
contributed to one or more parts of the datasets collected as of August 9, 2017) has been collected
through this exercise, with most major firms (i.e. those with significant revenues and portfolios in
Canada) participating.
Overview of analysis approach
Total investments
Member survey data is analysed to describe investments across:
► R&D;
► Patient support programs; and
► Community and charitable expenditures.
Economic footprint and Gross Value Added (GVA) analysis
The pharmaceutical industry’s productive activity generally, and that of Innovative Medicines Canada members specifically, contributes directly to Canada's economic activity which can be shown through the Gross Value Added which it produces. Members’ activities support jobs across Canada. Direct effects of participating Innovative Medicines Canada members have been calculated using the revenue, expenditure, and workforce data provided by members. Economic activities are related to one another within the wider economy through a dense network of supplier-customer relations, and thus produce effects that cross corporate and sector borders. Each unit of output produced in a specific sector of the economy requires the production of additional units of goods and services in other parts of the economy to fulfil its input requirements. Production of an additional unit of any good or service also requires the application of additional amounts of labour. Therefore, any increase in the demand for goods and services in the economy will trigger yet more demand for other goods and services, to fulfil the input needs described above. The amount of labour as well as the quantity and type of goods and services necessary to produce an additional unit of output
All Rights Reserved | EY 15
is industry specific and depends on the technology used. The Input-Output model developed by Wassily Leontief describes such relationships and allows quantifying such additional demand for labour, goods and services through the computation of industry-specific multipliers. Using the Input-Output model as its main building block, the Economic Footprint methodology allows quantifying a productive activity’s total contribution to the wider economy. Within this framework, three distinct effects can be identified and measured:
► A Direct Effect arising from the initial increase in economic activity, the GVA it generates and the
additional jobs it creates;
► An Indirect Effect arising from the additional demand of goods and services along an industry’s
supply chain; and
► An Induced Effect arising as an effect of households spending a share of the additional income
generated through the provision of labour on the consumption of goods and services.
Indirect and induced economic impacts described in the economic impact analysis have been derived from direct economic impacts using multipliers for the life sciences sector in Canada. Output multipliers are obtained from Input Output tables, through a mathematical process known as Leontief Inverse. By applying industry GVA / Output ratios and apparent labour productivity measures to the Output multipliers thus obtained, industry level GVA multipliers and employment multipliers can be produced. These multipliers are described in the results section. GVA / Output ratios and apparent labour productivity measures are based on statistical data published by Statistics Canada.
Analytical limitations and caveats
Total investments
Not all members responded to the questionnaires concerning investments such as R&D, patient support programs, total costs, and other key investment measures. As such, where these results are presented, they are presented only for the subset of participating members who submitted such data.

All Rights Reserved | EY 16
Results
All Rights Reserved | EY 17
Results
Innovative Medicines Canada members’ data
In this section, we present the analysis of the
data submitted by Innovative Medicines Canada
members covering 2014, 2015 and 2016. This
dataset consisted of completed questionnaire
responses for “corporate information”, “clinical
trials and innovation” and patient support
programs (PSPs)”. These were combined with
copies of PMPRB-submitted pricing and
investment summaries, i.e. PMPRB Block 4,
Block 5 and Form 3 data respectively. Since not
all Innovative Medicines Canada members who
submitted data provided all datasets, the
analysis of some parameters may reflect a
subset of participating Innovative Medicines
Canada members. Where this is the case, we
have noted the number of Innovative Medicines
Canada members represented by the analysis.
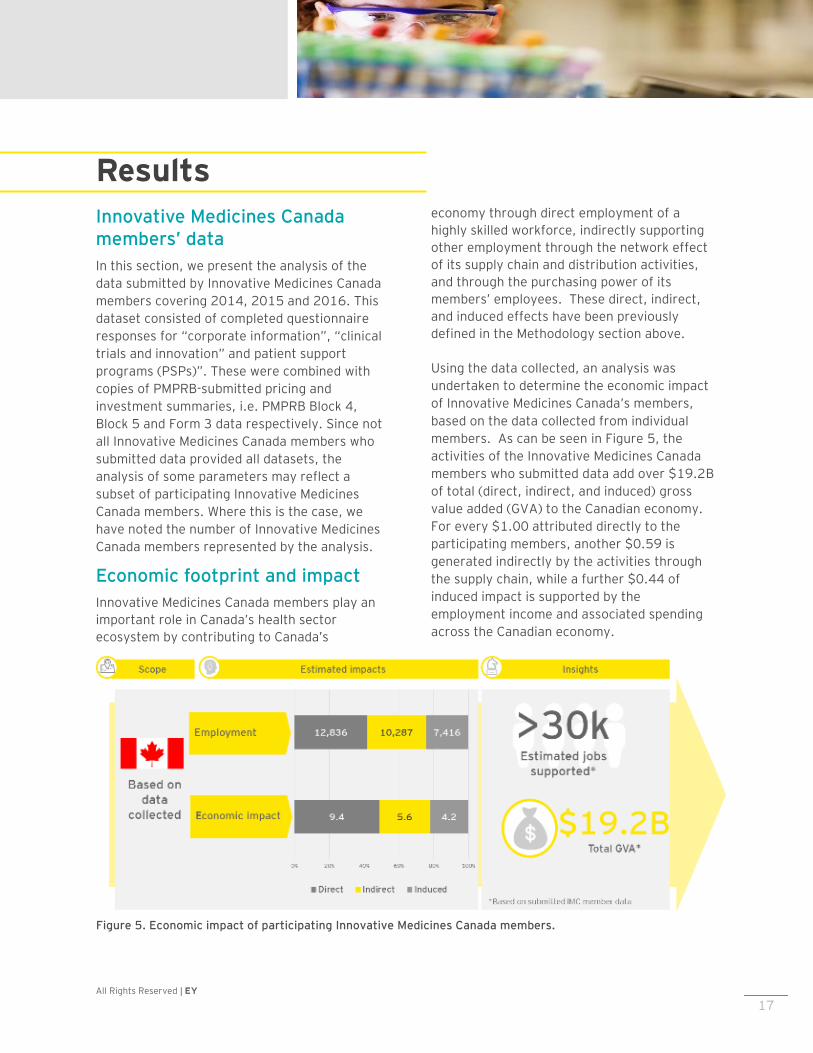
Economic footprint and impact
Innovative Medicines Canada members play an
important role in Canada’s health sector
ecosystem by contributing to Canada’s
economy through direct employment of a
highly skilled workforce, indirectly supporting
other employment through the network effect
of its supply chain and distribution activities,
and through the purchasing power of its
members’ employees. These direct, indirect,
and induced effects have been previously
defined in the Methodology section above.
Using the data collected, an analysis was
undertaken to determine the economic impact
of Innovative Medicines Canada’s members,
based on the data collected from individual
members. As can be seen in Figure 5, the
activities of the Innovative Medicines Canada
members who submitted data add over $19.2B
of total (direct, indirect, and induced) gross
value added (GVA) to the Canadian economy.
For every $1.00 attributed directly to the
participating members, another $0.59 is
generated indirectly by the activities through
the supply chain, while a further $0.44 of
induced impact is supported by the
employment income and associated spending
across the Canadian economy.
Figure 5. Economic impact of participating Innovative Medicines Canada members.
All Rights Reserved | EY
18
The activities of these members also support
just over 30,000 jobs across the Canadian
economy, as Figure 5 shows.
Based on the information analyzed, the
majority of these impacts are concentrated in
Ontario and Quebec, where the Canadian
headquarters of most Innovative Medicines
Canada members are based.
Comparing with other analyses
Since these results represent the contributions
of only a portion of Innovative Medicines
Canada members, and do not account for the
innovative pharmaceutical sector as a whole, a
desktop scan was conducted to understand
how these results align with past analyses
conducted by other groups. The purpose of
this scan was to identify similar economic
footprint analyses conducted by other
organizations, as well as to assess the relative
significance of the Life Sciences /
Pharmaceutical sector. The analysis relies on
published economic studies as its basis: it is
important to emphasize that EY did not
conduct these prior studies and relied on the
information presented in the highlighted
reports to conduct our analysis. As such,
insights should be considered qualitatively
directional rather than quantitatively factual.
There is no singular description of what
constitutes the “Life Sciences” sector, which
broadly ranges from health care delivery and
support activities, to manufacturing of drugs
and devices, to research and development
activities across these areas. Moreover,
Statistics Canada does not track a specific “Life
Sciences” industry group. Therefore, for the
purposes of this analysis, definitions from
published economic analyses were adopted.
4 Life Sciences in BC: Economic Impact now and in the
Future (2015)
A 2015 report by Life Sciences BC4 presented
an “expanded” definition for life sciences,
which included items such as Health and
Personal Care Stores, Hospitals, R&D Life
Sciences, R&D Laboratories, R&D Biotech
Research, Ambulatory Health Care Services,
Other Scientific and Technical Consulting
Services. The report further defined “core” life
sciences which included Drugs and
Pharmaceuticals, Medical Devices and
Equipment, and Research, Testing and Medical
Labs. Innovative Medicines Canada members
are assumed to be part of the “Core” Life
Sciences sector, in particular the Drugs and
Pharmaceuticals sub-sector, which may also
include non-members.
While each analysis has its own methodological
basis and limitations, the order of magnitude of
members’ impact appears to be consistent.
Our review of published information for 2014
from the Life Sciences BC report, Life Sciences
Ontario, as well as Statistics Canada, suggests
an approximate $26.0B total impact for the
Life Sciences / Pharmaceutical sector, broken
down into $12.2B, $7.4B, and $6.4B of direct,
indirect, and induced effects respectively. The
estimate for employment however, produced a
net effect of over 100,000 jobs, which may
likely be accounted for due to the differences in
industry scope and sample sizes. In addition
there are methodological differences between
the original studies, and our current analysis
which takes a bottom-up approach by utilizing
data from Individual Innovative Medicines
Canada members.
Overall, the current total direct, indirect, and
induced $19.2B and 30,000 jobs impacts from
members participating in this exercise may be
considered conservative relative to the full
member and industry footprints.

All Rights Reserved | EY
19
Comparing with other jurisdictions
A scan was also conducted to understand the
global context. In particular, three studies of
note were reviewed: one of the UK Life
Sciences sector, one for a subset of EU-based
companies, and a government-sponsored
analysis of the Australian pharmaceutical
sector. Again, it should be noted that each
study has its own methodological basis and as
such the following analysis and comparisons
are directional. In addition, while the
assessments were conducted in local
currencies, they have been converted to
Canadian dollars for the purposes of this
comparison, using the average exchange rate
for the year in question, so purchasing parity
power effects are not accounted for.
Results of this analysis are provided in Figure
6, which represents a comparison of published
analyses of economic footprints of other
jurisdictions with which Canada is frequently
compared, namely the UK and the EU. While
each analysis represents a different scope and
definition of “life-sciences”, some very broad
insights may be drawn. It should be noted that
the analysis conducted by EY for Canada
includes only Innovative Medicine Canada
members which is a subset of the Canadian bio-
pharmaceutical sector.
The UK analysis5, which considered a “core”
life sciences industry definition, estimated an
5 ABPI: The economic contribution of the UK Life
Sciences industry
equivalent of $26.4B in direct impact for the
industry, of which approximately 52% was
assessed to be due to the pharmaceutical
subsector. In contrast, the EU study6, which
only assessed seven large pharmaceutical
companies, found an estimated equivalent of
$50.7B direct impact for just this subset of
companies. This result may speak to the
importance of the sector within the EU
economy. It is noted that for both the UK and
EU, the estimated indirect and induced
employment effects are proportionally greater
than for Canada, which may be linked to the
fact that there is comparatively greater activity
along the value chain (e.g. R&D, manufacturing
and supply chain) relative to Canada, as well as
the presence of international headquarters.
6 EFPIA: The Economic Footprint of Selected
Pharmaceutical Companies in Europe
Figure 6. Summary of analysis of economic impacts from other jurisdictions, compared with current analysis.

All Rights Reserved | EY
20
Comparison with other sectors in
Canada
With respect to other industry sectors in
Canada, the Canadian Life Sciences sector is an
important R&D contributor. While it is not the
largest R&D investor, it still has a strong R&D
footprint. A report by Research Infosource
compiled information on Canada’s top
corporate spenders for 20167 suggests that
the 23 Pharmaceutical and Biotechnology firms
represented in the top 100 list have the third-
greatest combined total spending, behind five
(5) Aerospace and seventeen (17)
Software/Computer Services.
With respect to R&D intensity, defined as R&D
spending as a proportion of revenues, the
Pharmaceutical and Biotechnology firms in the
top 50 have an estimated 6.9% R&D intensity
based on the data reported, which appears
consistent with information collected as part of
this project, and slightly lower than that of the
Software/Computer Services firms in the top
50 which have a combined R&D intensity of
8.4%. It should be noted that this report looked
at the Life Sciences sector as a whole and may
include firms who are not IMC members.
From an economic footprint perspective, our
analysis above suggested that the footprint of
the “core” life sciences sector was in the range
of $26B for 2014. This may be considered
comparable to that of the aerospace sector at
$29.5B in 20148, based on published
information from the Aerospace Industries
Association of Canada (AIAC). While there is
no cause and effect data published, one
7 Research Infosource, 2016 Canada's Top 100 Corporate
R&D Spenders Report
hypothesis is that the presence of Canadian-
headquartered aerospace firms makes a key
difference in terms of R&D focus and intensity.
Innovative Medicines Canada member portfolio size and growth
► Total number of patent protected
medicines (DINs) by year for
Innovative Medicines Canada
members. Figure 8 provides the total
number of unique DINs reported by
members from 2014-16, broken down
between existing DINs, namely those
that had been marketed in previous
years, and new DINs, referring to those
which were sold for the first time in the
given year. In 2016, Innovative
Medicines Canada members had 970
total DINs listed in Canada. This
number has remained largely constant
over the reporting period. The
percentage of new DINs
8 ISED and AIAC, State of Canada’s Aerospace Industry,
2017 Report
Figure 7. Estimated R&D investment by industry sector.

All Rights Reserved | EY 21
entering the Canadian market in 2016, at
12.1%, was the lowest over the three-year
period, although as a result of the new DINs
entering the market in 2014 and 2015 the
number of existing medicines was higher than
other reported years.
► Total 2016 Gross patented products
Revenue. Figure 9 below provides the
total gross reported patented product
revenues from new and existing DINs
over the reporting period, which
804 755853
184179
117
0
100
200
300
400
500
600
700
800
900
1000
2014 2015 2016
Existing DINs New DINs
Figure 9. Breakdown of reported member revenue between existing and new drugs for participating Innovative Medicines Canada members.
$9,901M$10,909M $11,091M
$1,296M$1,213M $0,862M
$0,M
$2,000M
$4,000M
$6,000M
$8,000M
$10,000M
$12,000M
$14,000M
2014 2015 2016
Existing DINs New DINs
$11,950M12,122M
11,197M
Figure 8. Breakdown of DINs between existing and new drugs for participating Innovative Medicines Canada members.
970 934
988

All Rights Reserved | EY 22
correspond to payers’ expenditures on
members’ patented products over that
time period. These revenue figures
exclude public sector rebates, such as
those negotiated by pCPA, but may
include other benefits reported to
PMPRB as per the current regulations.
The total reported gross revenue from
Innovative Medicines Canada members’
patent protected medicines based on
PMPRB Block 5 submissions was
approximately $11.950B for 2016.
The growth in gross annual revenue
was marginal over the period 2014-16
(CAGR 2.2%), with a slight reduction
observed in 2016. It should also be
noted that the amount of revenue
coming from new DINs declined in
2016, resulting in a net decline in
overall revenues as well. Members
derive over 90% of their revenue from
four provinces: Ontario, Quebec,
Alberta, and British Columbia,
reflecting the distribution of Canada’s
population and budgetary resources.
► Split of gross patented product
revenue by source of funding.
Individual Innovative Medicines Canada
members also provided the split of
individual member revenues between
public (including public drug plan and
hospital payers) and private funding
(private insurers but not cash) sources.
For the 19 Innovative Medicines
Canada members that submitted this
data, the average proportion of public
funding sources as a percentage of
total revenues was 64%, implying that
36% of revenues were derived from
private sources for 2016. Although in
aggregate there was little variance in
the reported public/private split over
the reporting period, there were
observed variations in this split across
the participating members, which may
be driven by differences in portfolios
and disease area focus, as well as to
the degree to which their portfolios
address areas of focus of public payers.
Figure 10 below shows the split of
public/private revenue for 2014, 2015
and 2016 for the 19 Innovative
Medicines Canada members that
submitted data.
$5,715M $6,293M $5,994M
$3,164M$3,403M $3,403M
$0M
$2,000M
$4,000M
$6,000M
$8,000M
$10,000M
$12,000M
2014 2015 2016
Public Revenue Private Revenue
Figure 10. Estimated public/private split of member revenues (note: breakdown is based only on Innovative Medicines Canada members reporting public/private split).

All Rights Reserved | EY 23
Total member Investments
Historically, members have reported their
investments in research and development
(R&D) to the PMPRB as a means of assessing
the effectiveness of Canada’s patent protection
regime. The patent protection regime is
intended to promote re-investment of member
revenues in R&D. The PMPRB collects,
annually, data on members’ investments in
Canadian R&D. The reported figures are based
on Revenue Canada definitions according to
the SR&ED program. However, as R&D has
evolved in Canada, certain R&D investments
may no longer fit the strict definition. As such,
in addition to revenue data, members were
asked to provide information on their
investments in both SR&ED-eligible and non-
SR&ED-eligible R&D investments. Information
was also collected from members on
investments in patient support programs
(PSPs), and general corporate operations.
► R&D and innovation expenditures as a
percentage of revenue. Members
reported a total of $1.19B in R&D
investments for 2016. These investments
include PMPRB Form 3 SR&ED-eligible and
non-SR&ED-eligible R&D, as well as
investments in randomized controlled
trials (RCT), real world evidence, and
Phase IV studies. SR&ED-eligible R&D
investments reported by participating
members were $0.62B in 2016,
representing 5.1% of revenues. Non-
SR&ED-eligible expenditures represented a
further $0.45B or 3.8% of revenues. The
inclusion of other investments in
innovation, such as donations to charities
for research, grants, university chair
endowments, round out members’ total
contributions to R&D and innovation,
amounting to an estimated total 9.97% of
revenues in 2016. Of note, even with the
decrease in gross revenues from 2015 to
2016, the total investment in R&D and
innovation still increased, underlying the
long-term nature of members’
commitments.
Figure 11. Total participating member R&D spend, 2016

All Rights Reserved | EY 24
Figure 12. R&D investments, 2016, as reported to PMPRB.
► SR&ED-eligible R&D investments.
Figure 12 represents the total SR&ED-
eligible R&D investment reported to the
PMPRB by participating Innovative
Medicines Canada members for 2016,
broken down by purpose. Although the
total amount of R&D investment has
increased slightly from 2014-16, the
amount spent by members on Phase 3
clinical trials in Canada has decreased
over time, from $198m in 2014, to
$176m in 2016. This finding is
important since the presence of phase
3 trials may be associated with
increased patient access to promising
new therapies at an early stage.
$20MBasic biological
3%
$71MBasic chemical
11% $41MClinical trials I
7%
$56MClinical trials II
9%
$176MClinical trials III
28%
$35MManufacturing
processes6%
$172MOther qualifying
R&D28%
$36MPreclinical trials I
6%
$13MPreclinical trials II
2%
All Rights Reserved | EY 25
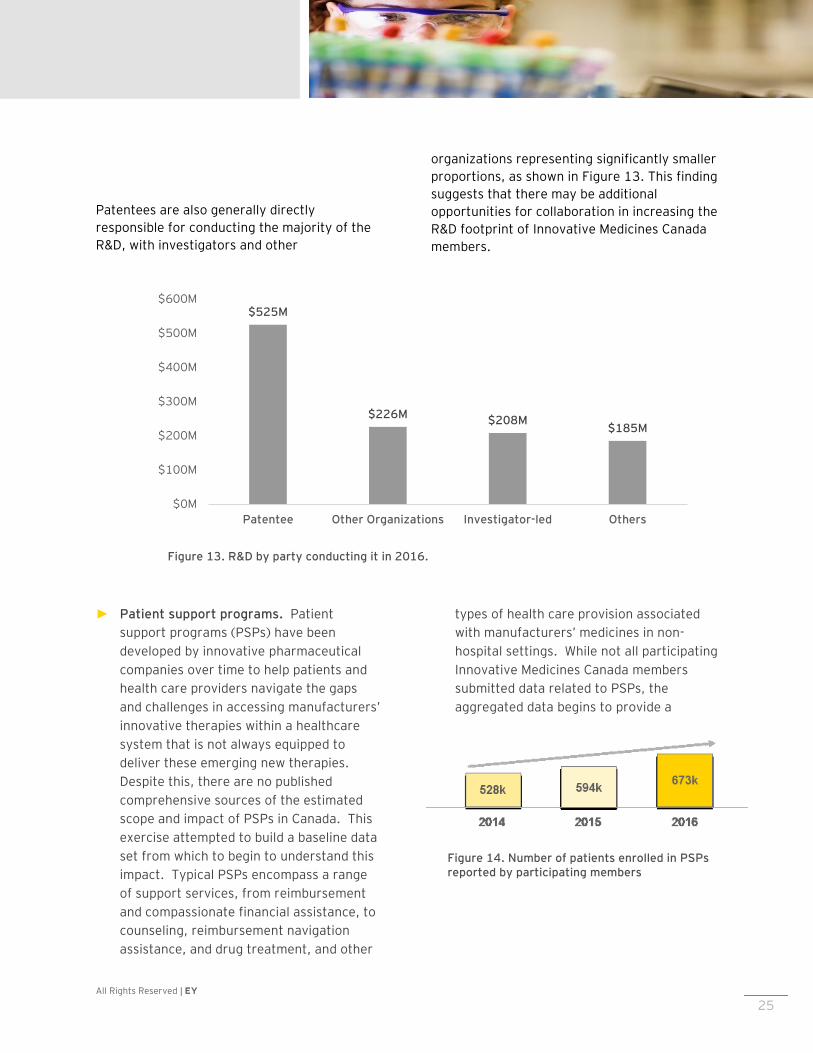
Patentees are also generally directly
responsible for conducting the majority of the
R&D, with investigators and other
organizations representing significantly smaller
proportions, as shown in Figure 13. This finding
suggests that there may be additional
opportunities for collaboration in increasing the
R&D footprint of Innovative Medicines Canada
members.
► Patient support programs. Patient
support programs (PSPs) have been
developed by innovative pharmaceutical
companies over time to help patients and
health care providers navigate the gaps
and challenges in accessing manufacturers’
innovative therapies within a healthcare
system that is not always equipped to
deliver these emerging new therapies.
Despite this, there are no published
comprehensive sources of the estimated
scope and impact of PSPs in Canada. This
exercise attempted to build a baseline data
set from which to begin to understand this
impact. Typical PSPs encompass a range
of support services, from reimbursement
and compassionate financial assistance, to
counseling, reimbursement navigation
assistance, and drug treatment, and other
types of health care provision associated
with manufacturers’ medicines in non-
hospital settings. While not all participating
Innovative Medicines Canada members
submitted data related to PSPs, the
aggregated data begins to provide a
Figure 14. Number of patients enrolled in PSPs reported by participating members
Figure 13. R&D by party conducting it in 2016.
$525M
$226M$208M
$185M
$0M
$100M
$200M
$300M
$400M
$500M
$600M
Patentee Other Organizations Investigator-led Others
All Rights Reserved | EY 26
window into the reach of PSPs across
patient communities.
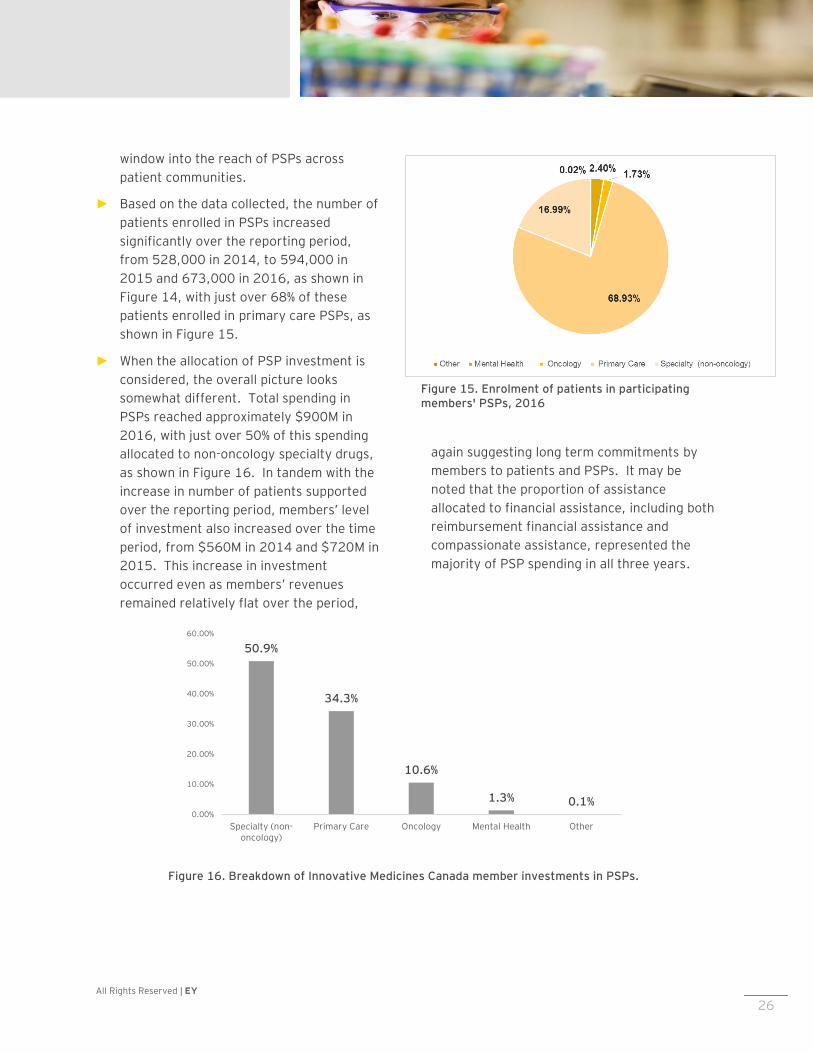
► Based on the data collected, the number of
patients enrolled in PSPs increased
significantly over the reporting period,
from 528,000 in 2014, to 594,000 in
2015 and 673,000 in 2016, as shown in
Figure 14, with just over 68% of these
patients enrolled in primary care PSPs, as
shown in Figure 15.
► When the allocation of PSP investment is
considered, the overall picture looks
somewhat different. Total spending in
PSPs reached approximately $900M in
2016, with just over 50% of this spending
allocated to non-oncology specialty drugs,
as shown in Figure 16. In tandem with the
increase in number of patients supported
over the reporting period, members’ level
of investment also increased over the time
period, from $560M in 2014 and $720M in
2015. This increase in investment
occurred even as members’ revenues
remained relatively flat over the period,
again suggesting long term commitments by
members to patients and PSPs. It may be
noted that the proportion of assistance
allocated to financial assistance, including both
reimbursement financial assistance and
compassionate assistance, represented the
majority of PSP spending in all three years.
Figure 16. Breakdown of Innovative Medicines Canada member investments in PSPs.
50.9%
34.3%
10.6%
1.3% 0.1%0.00%
10.00%
20.00%
30.00%
40.00%
50.00%
60.00%
Specialty (non-oncology)
Primary Care Oncology Mental Health Other
Figure 15. Enrolment of patients in participating members' PSPs, 2016

All Rights Reserved | EY 27
Discussion
All Rights Reserved | EY 28
Discussion
Moving the dialogue in Canada from price to value
The analysis is based on data provided by
Innovative Medicines Canada members, who are
in turn a subset of Canadian pharmaceutical
and biotechnology companies. The estimated
total economic footprint of Innovative
Medicines Canada members is in the order of
almost $20B and over 30,000 jobs. Members
contribute across the health care value chain,
from contributions to R&D, clinical trials, and
innovation; to patients’ ability to access
medicines through patient support programs;
and the use of rebates to help public payers
manage their budgetary challenges. As payers
continue to use the tools at their disposal to
manage drug budget expenditures, it is critical
that innovative pharmaceutical companies,
including Innovative Medicines Canada
members, seek opportunities to constructively
collaborate with payers, to ensure that the
impact on these contributions is minimized, and
optimize the overall balance of the health care
ecosystem. For example, regulatory changes
focused on ensuring payer budget sustainability
may ultimately erode members’ impact if their
response is to scale back investments in certain
aspects of their operations to compensate for
payers’ reduced expenditures on drugs. In
addition, delays in product listing impact the
effective length of patent-protected sales once
a product has been approved for marketing in
Canada and may lead to foregone member
revenue.
The social costs of disease in Canada
The ultimate goal of the system is to bring
better care to patients and improve their overall
health, quality of life, and societal impact. In
addition to the directly measurable financial
drug and healthcare costs, if one takes a
broader societal view, there are associated
costs of delayed treatments to the quality of
patients’ lives, and to society as a whole,
including caregivers, employers, and
governments who may be required to support
these patients while they are unable to be
productive due to their illness. Conducting
more detailed quantitative assessments of the
social costs of the disease burden will be a
useful tool in understanding the potential
economic impacts beyond the healthcare
system.
Opportunities for Innovative Medicines Canada to work collaboratively with Government
Given the shared objectives of both
Government and manufacturers to improve
patients’ health, a new approach, built on trust
and collaboration, may be considered critical.
The findings from this study demonstrate that
there are clear benefits for Innovative
Medicines Canada members to seek to engage
governments, both payers and policy makers,
in co-developing solutions to the industry’s
sustainability challenges that will lead to longer
term certainty of outcomes for patients,
payers, and manufacturers. Three potential
areas of collaboration are identified below.

All Rights Reserved | EY 29
Improving system efficiencies
The analysis suggests that system efficiencies
are a key potential area of common ground
between Innovative Medicines Canada
members and policy makers. In theory, faster
access to medicines benefits patients,
productivity and potential benefits to
employers, and the economy as a whole,
although the impact on payers’ budgets needs
to be considered. In this context, Innovative
Medicines Canada members may also consider
working with payers to identify more mature,
under-performing products which could be
candidates for alternative contracting
approaches, price reductions or eventual de-
listing, although de-listing should always be
approached with caution so as not to disrupt
continuity of patient care. At the same time,
improving time to listing may mean that some
products may have a value gap as listing
agreements are being negotiated. For
example, payers and manufacturers may not be
able to agree on the value of a product that has
concluded Phase 3 trials, as the targeted value
end points may not have been adequately
demonstrated through randomized clinical
trials, due to study design limitations or other
considerations. Nevertheless, if the product is
agreed to hold great promise for patients, the
parties may agree that the product merits an
initial listing while value is being proven, as
shown in Figure 17.
The question of how the product should be
priced, however, remains outstanding.
Performance-based risk-sharing agreements,
also known as value-based, or outcomes-based
agreements, are frequently cited as a solution
to this challenge.
Performance-based risk sharing
agreements
There is a significant learning curve in
implementing such agreements to create value,
as shown in Figure 18 below. For example,
certain types of agreements may work better
with certain drug types. Products for chronic
diseases may be contracted differently than
those that address acute conditions. The
current paradigm in Canada, focused on
traditional discounting and patient support
schemes, has significant potential for a shift
over the long term toward performance-based
risk-sharing agreements.
Figure 17. Value matrix.
All Rights Reserved | EY 30
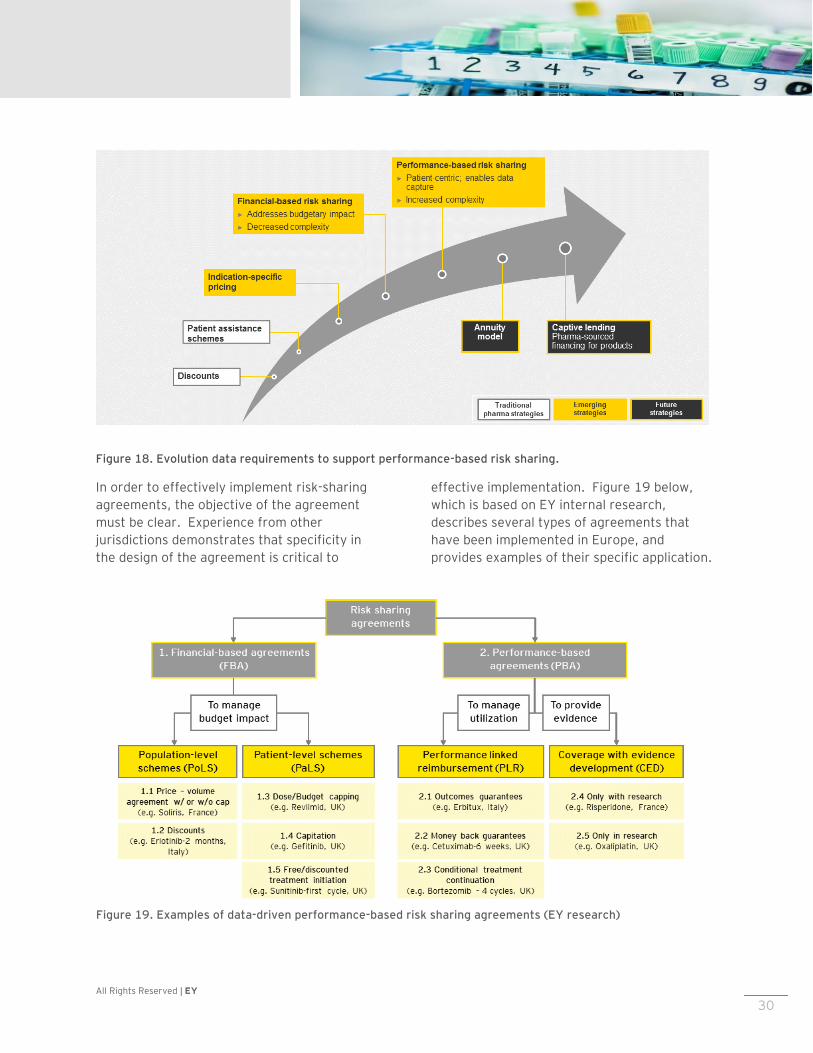
Figure 18. Evolution data requirements to support performance-based risk sharing.
In order to effectively implement risk-sharing
agreements, the objective of the agreement
must be clear. Experience from other
jurisdictions demonstrates that specificity in
the design of the agreement is critical to
effective implementation. Figure 19 below,
which is based on EY internal research,
describes several types of agreements that
have been implemented in Europe, and
provides examples of their specific application.
Figure 19. Examples of data-driven performance-based risk sharing agreements (EY research)

All Rights Reserved | EY 31
Data sharing and infrastructure
Implementation of risk sharing agreements is
not without challenges. These challenges
include the resourcing and administrative
burdens; the governance model to manage the
agreements transparently; addressing legal
issues regarding individual patient data
collection and transfer; and agreeing on
methodology, such as the definition of
effectiveness and the appropriate clinical
outcome indicators. Moreover, objective
clinical measures may not be readily available
in all disease areas. As such, the cost of
implementing such schemes may be perceived
to outweigh the benefits.
Key to the implementation of such agreements
is a data infrastructure that will reduce the
associated resource impact, and create trust in
the data, through transparency to all involved.
At present, although Canada benefits from
highly centralized datasets of public
administrative data which could facilitate the
implementation of such agreements, the
investment required to integrate and govern an
infrastructure to manage such a system on a
widespread basis over the long term, enabled
by real-world-evidence collected at the point of
patient care, is significant. Member
participation and investment in such
infrastructure could be seen as an act of
collaboration in the eyes of governments,
payers, and patients, given that these
stakeholders may not have the internal
capacity or experience to implement these
measures on their own. Moreover, the
collaboration required for this exercise of
jointly building such a new model will by
necessity require all parties to build trust over
time, which will be an essential component for
any future framework agreement between
stakeholders.
Moving forward
This study may be seen as one step in a long-
term journey to a more sustainable system.
While a critical mass of data has been captured
and analysed, providing a critical window into
the economic impact of a substantial subset of
Innovative Medicines Canada members, and
informing a range of potential responses and
solutions, it is important that the exercise not
stop at this early stage. It is essential that
efforts be made to maintain and build on the
current dataset, to establish a longitudinal and
robust set of information that can be analysed
over time to both assess impacts of any new
policy measures, as well as identify solutions
that may be proposed to government.
Innovative Medicines Canada’s actions should
continue in a transparent fashion, which will
help build the trust needed to co-create
sustainable solutions to the drug expenditure
challenge in Canada over the long term.

All Rights Reserved | EY 32
Appendix
All Rights Reserved | EY 33
Appendix
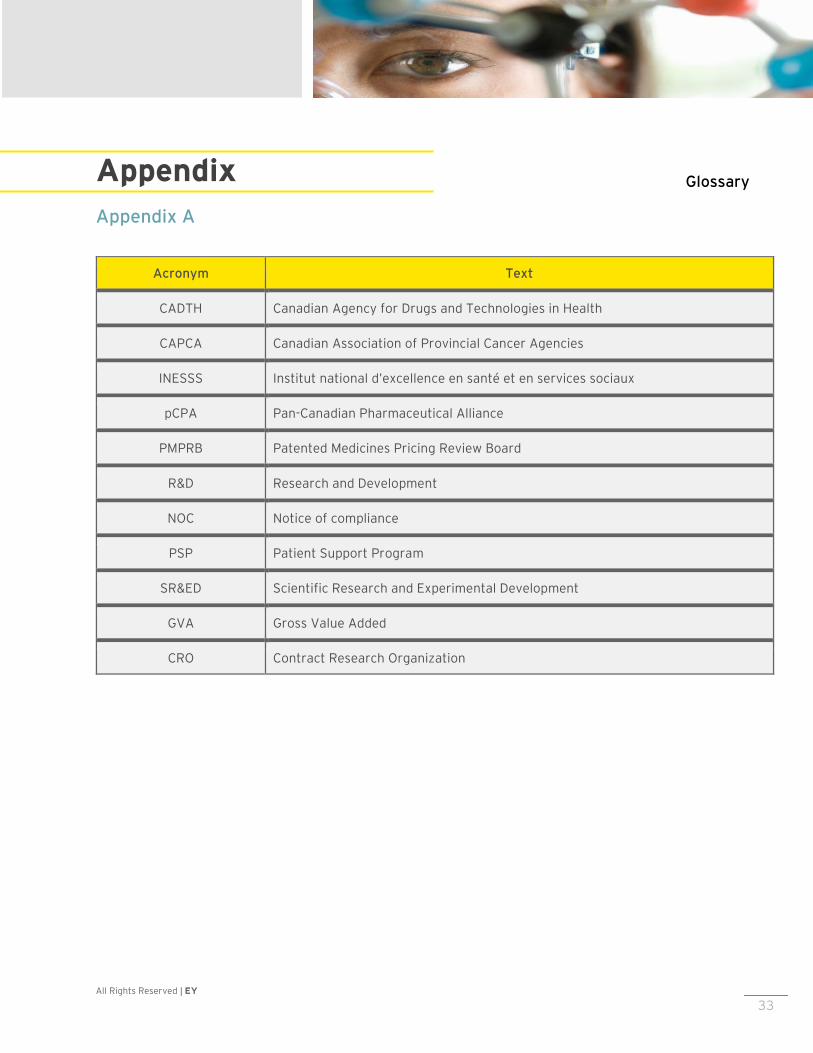
Appendix A
Glossary
Acronym Text
CADTH Canadian Agency for Drugs and Technologies in Health
CAPCA Canadian Association of Provincial Cancer Agencies
INESSS Institut national d’excellence en santé et en services sociaux
pCPA Pan-Canadian Pharmaceutical Alliance
PMPRB Patented Medicines Pricing Review Board
R&D Research and Development
NOC Notice of compliance
PSP Patient Support Program
SR&ED Scientific Research and Experimental Development
GVA Gross Value Added
CRO Contract Research Organization

All Rights Reserved | EY 34
Appendix B Methodology details
This section outlines the key methodologies used to collect and analyse data associated with this project. It includes a detailed overview of the methods used to collect and aggregate individual Innovative Medicines Canada member data, as well as an outline of the analytical approaches to capture insights from the collected data.
Data Collection Approach
Data description
The analyses in the current report are based in
part on data solicited from the members of
Innovative Medicines Canada. The data
solicited from the member firms included
sensitive information concerning:
► Gross Revenues generated from sale of
patented prescription medicines in Canada
Volumes of medicines sold in Canada as
reported to the PMPRB
► The geographic distribution of sales
► The distribution of sales across different
buyers and payers
► The volume of investment in research and
Development carried out in Canada in
terms of dollars spent and R&D activities
(e.g. clinical trials)
► The volume and distribution of investment
and spending in non-research activities
including patient support, provider
education, charitable giving, and other
operations.
Solicitation of this data took two forms, the
first being the use of standard reporting forms
all pharmaceutical companies in Canada are
required to provide to the Canadian patented
pharmaceutical pricing regulator, the PMPRB,
on an regular basis, and the second being a
series of customized questionnaires prepared
by EY and emailed to each member firm.
PMPRB Forms
Member firms were asked to provide the
following forms which they provide annually or
semi-annually to the Patented Medicine Prices
Review Board (PMPRB):
► Form 2 – Information on the Identity and
Prices of the Medicine
o Block 4 – Sales of the Medicine by
the Patentee in Final Dosage Form in
Canada
o Block 5 – Publicly Available Ex-
Factory Prices for Canada and Other
Countries
► Form 3 – Revenues and Research and
Development Expenditures
The use of PMPRB data confers a number of
advantages to the data pool used for the
analysis in this report including:
► Enhanced and timely participation by
member firms as the data has previously
been produced and formatted
► Consistent treatment of the data across
firms and across time as the PMPRB
defines the data required
► Enhanced data integrity given the role the
forms play in regulatory compliance
EY questionnaires
In addition to standardized data provided to the
PMPRB, the member firms were solicited to
respond to four questionnaires that were
prepared by EY, soliciting key data for the
analyses in this report. The questionnaires
covered the following data areas:
R&D and Clinical Trials – The EY questionnaire
concerning R&D and Clinical Trials
complemented PMPRB Form 3 through
questions looking specifically at who was
carrying out R&D work: the patentee, Clinical
All Rights Reserved | EY 35
Research Organizations (CROs) or Investigator-
Led Trials. It also solicited a more granular
view of R&D-related investment by soliciting
data regarding:
► R&D expenditure supported by Canada’s
Federal Government (SR&ED-eligible
expenditures)
► Breakdown of R&D spending by categories
including salaries, facility costs, etc.
► Clinical Data transparency
► Real World Evidence
► Phase 4 studies and their reach in terms of
patients enrolled or number of sites
involved
Patient Support Programs (PSP) – Data was
solicited from member firms concerning their
investment in Patient Support Programs
including:
► Total spending for such programs
► Spending by type of patient support or
clinical area
► Spending on internally managed programs
vs. 3rd party managed programs
► Reach in terms of number of patients
assisted
► Volume of activity in terms of number of
employees or resources employed to
deliver support
Corporate Info – Data was solicited from
member firms to examine the economic role
played both in the healthcare domain and in the
broader Canadian economy. Detailed questions
concerning investment and spending related to
promoting health and well-being include the
following:
► Investment in provider education
► Investment in community programs
► Expenditures on regulatory compliance
With regards to the broader economy, member
firms were solicited to provide data on:
► Capital investment by category (R&D vs.
non-R&D)
► Salaries and benefits
► Taxes at the federal, provincial and
municipal levels
► Non-health promotion investment
including charitable giving to promote, the
arts, education and the environment
In order to provide common-form analysis
across the different areas of data solicited,
member firms were also asked to provide
normalizing data such as the number of full-
time equivalent employees (FTEs) by
employment category, the number of different
drugs sold based on Drug Identification
Number, and the number of manufacturing,
R&D or other sites occupied in Canada.
Each questionnaire was prepared and sent by
email as a Microsoft .XLSX file for use in
Microsoft Excel. Questions solicited data for
each of the following years: 2014, 2015, and
2016. In addition, for each question type,
member firms were asked to provide a
subjective assessment of the quality of the data
being provided by indicating their level of
confidence in the question responses as high,
medium or low. Respondents were provided
both a set of instructions (included as a cover
page in each questionnaire) as well as an area
to provide pertinent assumptions that may
have been used in preparing the data.
In certain cases, the questionnaires solicited
data that overlapped with or was redundant
with data captured on PMPRB forms. This
allowed for analysts to identify and investigate
data that was inconsistent between the PMPRB
submission and the EY questionnaires. The EY
questionnaires, however, probed in much
greater detail certain areas that PMPRB forms
covered lightly and other areas not covered in
any regulatory submissions. The EY
Questionnaires also allowed member firms to
aggregate data by soliciting provincial and
territorial level data.
Data collection process

All Rights Reserved | EY 36
A data collection process was developed which
balanced the needs for assuring the
confidentiality of the data being solicited with
the flexibility required to manage a broad
solicitation which touched several different
functional areas within each member firm
including regulatory (market access), finance,
legal, and government relations functions. The
process and system developed is illustrated in
Figure 20.
The data collection process was designed to
rely on email and Microsoft Excel as the
primary tools for carrying out data collection
because of their ubiquity across functional
areas in each member firm and also because
these tools mirrored the PMPRB data
submission process member firms undertake
each year (PMPRB forms are completed in an
Excel spreadsheet provided by the PMPRB and
are submitted via email). This similarity
enhanced the ease of expanding the data
gathering and submission process by member
firms.
The confidentiality of the member firm data
was promoted by the use of a unique email
address created and hosted within EY’s secured
IT infrastructure. Member firms were
instructed to submit data only to that email
address and the number of EY analysts with
access to the submitted emails was restricted.
Data collection was organized in two phases.
The first phase was focused on soliciting
PMPRB Form 2 Block 4 and Form 2 Block 5
data. This phase was kicked off with a
comprehensive communication campaign
targeting all of the Innovative Medicines
Canada members. This communication
campaign included emails from Innovative
Figure 20. Data Collection Process
All Rights Reserved | EY 37
Medicines Canada executives and repeated
webinars where Innovative Medicines Canada
member firms were presented with the data
collection process by both Innovative Medicines
Canada staff and EY staff. Subsequent to
these communications, an EY project team
member was designated as the point of contact
for all questions concerning data collection in
order to ensure the confidentiality of
communications with Innovative Medicines
Canada members.
A second wave of member data collection included PMPRB Form 3 data as well as responses to three
EY-produced Questionnaires:
► Corporate Information: Information on members’ investments and economic activity in Canada
► Patient Support Programs: information on investments and numbers of patients enrolled in
PSPs in Canada
► R&D and Clinical Trials: information on all clinical trial, additional breakdown for SR&ED-eligible
contributions reported on Form 3, and other R&D, and innovation activities in Canada
This data collection exercise was initiated with a communications campaign of emails from Innovative
Medicines Canada executives and repeated webinars where Innovative Medicines Canada members
interacted with Innovative Medicines Canada staff and EY staff who answered questions clarifying the
type of data being solicited. The three EY questionnaires were emailed to designated contacts at
member firms.
The data collection process was also designed for active solicitation of the requested data. EY staff
provided regular status reports communicating the volume of data received and actively contacted
Innovative Medicines Canada member firms throughout the data collection phases in order to enhance
the quality of data by answering member questions, and to augment the volume of data by actively
addressing areas where data was missing.
Data collection results
A critical mass of Innovative Medicines Canada member data (i.e. two-thirds or more of members
contributed to one or more parts of the datasets collected as of August 9, 2017) has been collected
through this exercise, with most major firms (i.e. those with significant revenues and portfolios in
Canada) participating.
Data Validation
Overview
Data from Innovative Medicines Canada members was provided almost exclusively in Microsoft Excel
files and submitted to EY by email with some exceptions. Within the Microsoft Excel files submitted by
members, there were some variations in file structure and content when compared with the templates
that were provided as EY questionnaires or PMPRB forms provided by healthcare regulators. As a
consequence of the observed variations in data submissions, data handling was partially automated but
also relied on the intervention of EY analysts who contacted member firms directly to verify and

All Rights Reserved | EY 38
validate any observed variations. Variations from expected data formats were either corrected by
member firms and resubmitted or were adjusted by EY analysts, such adjustments having been fully
documented.
Data handling
Data handling was automated to the extent possible using Visual Basic for Applications to examine data
files sent as attachments and flag those that contained formats or structures that varied from the
expected templates. The variations in data format and structure that triggered further analysis by EY
staff included:
► PMPRB Form 2 and Form 3 data covering multiple reporting periods being submitted in a single file
rather than each period being captured in its own file
► PMPRB Form 2 Block 4 data submitted in the same data file as Form 2 Block 5 data
► The addition of rows or columns, either blank or containing data, to the original templates
► The use of file formats other than Microsoft Excel XLS and XLSX files, including the submission of
data in PDF format (either native or resulting from scanning documents containing the data)
► The presence of content (data or other) in fields which were meant to remain blank
Automation was used to track data submissions by automatically downloading, counting, and saving
data files attached to emails sent from Innovative Medicines Canada member firms to the secured email
address in EY’s network. EY staff manually intervened as in some cases, Innovative Medicines Canada
member firms provided access to downloadable data files located on secured file sharing facilities
rather than attach the files to email. Similar interventions were required for data files packaged as
archives with password protection set by the sender. EY staff also manually intervened to format data
to comply with the formats designated in the templates (i.e., EY Questionnaires and PMPRB forms)
including disaggregating files containing multiple years of data or files containing mixed content (i.e.,
Form 2 Block 4 data and Block 5 data). A backup copy of each file as submitted by member firms was
made and stored on a secured server within EY’s Network.
Other interventions by EY staff were required in cases where
► Innovative Medicines Canada Members indicated in their submission that certain formatting or
assumptions were used which would require manual adjustment (e.g., data was presented in
thousands or millions instead of units)
► Submitted data was in PDF format and required manual transcription to an Excel XLSX file
► It was not clear if empty data field represented the absence of data or a value of zero
In cases were Innovative Medicines Canada members did not clearly document their assumptions, EY
staff contacted members directly to verify the intent of the data and made adjustments where
appropriate (e.g. placing a value of zero in blank fields). Other cases of EY staff intervening to adjust
submitted data included the submission of amended PMPRB filings submitted by members. In these
limited cases, EY staff examined the original PMPRB filing, the amendment and the member firm’s
commentary in order to produce a true representation of the reported activity.
Data validation
All Rights Reserved | EY 39
Data files with compliant formats were then further processed using automation to ensure the
traceability of each submitted data point. A naming convention was applied that allowed EY analysts to
identify the source of each data point by member firm, by reporting period, and by source. For
example, 4-142-99 would indicate that the data point was from PMPRB Form 2 Block 4, covering 2014
2nd half reporting, and was from Innovative Medicines Canada member 99. This traceability of
individual data points enhanced data integrity and allowed tracing of data downstream in the analysis
back to its source. EY analysts manually renamed each data file using the above naming convention.
Automation with VBA was used to append the naming convention to each row of data in the file.
For the EY Questionnaires and the PMPRB Form 3 data files, the data structure required additional
processing to create a flat file where data points could have the data source appended. This was
accomplished with VBA automation.
For each of the PMPRB Form 2 data files, a system of sums and row counts was used to enhance data
integrity. A column containing numeric values was selected and the count and sum of those values was
recorded. In subsequent processing steps, the sum of these sums and counts was used to identify any
potential loss of data either due to processing errors or the use of inappropriate data types. Similar
steps were applied to EY Questionnaire data received from members as well as PMPRB Form 3
submissions.
Automation was used extensively where possible as the Innovative Medicines Canada member base
submitted data in a rolling fashion. The automated data handling and validation allowed for quick and
consistent preparation of the updated dataset which was reloaded to SQL server.
The final steps of data processing relied on VBA automation to assemble the submitted data from
across all Innovative Medicines Canada members into a flat file in CSV format where a single area of
inquiry would have all of its data points aggregated. Each of these flat files was processed using VBA
automation and metadata was included for each data point including the data source and the datatype
of the individual value or record. This step was in preparation for upload of the data to SQL server
where it would be available for analysis. Any inconsistent data types were automatically converted to
the target type compatible with the SQL table structure waiting to receive the data. Other
inconsistencies were flagged and investigated by EY analysts. Any modifications resulting from the
data validation were documented.
Overview of analysis approach
Total investments
Member survey data is analysed to describe investments across:
► R&D;
► Patient support programs; and
► Community and charitable expenditures.
For R&D, investments are divided into SR&ED and non-SR&ED components with information detailing
spend for real world evidence, Phase IV studies, university professorships and spend by trial types and
phases. For patient support programs, information is presented by disease level, number of patients
supported and spend across Aboriginal Health programs. For community and charitable expenditures,
All Rights Reserved | EY 40
information is presented by grants awarded to entities that support health and well-being of Canadians
(excluding research), programs that support and promote education/training, and other community
programs.
Economic footprint and Gross Value Added (GVA) analysis
The pharmaceutical industry’s productive activity generally, and that of Innovative Medicines Canada members specifically, contributes directly to Canada's economic activity which can be shown through the Gross Value Added which it produces. Members’ activities support jobs across Canada. Direct effects of participating Innovative Medicines Canada members have been calculated using the revenue, expenditure, and workforce data provided by members. Economic activities are related to one another within the wider economy through a dense network of supplier-customer relations, and thus produce effects that cross corporate and sector borders. Each unit of output produced in a specific sector of the economy requires the production of additional units of goods and services in other parts of the economy to fulfil its input requirements. Production of an additional unit of any good or service also requires the application of additional amounts of labour. Therefore any increase in the demand for goods and services in the economy will trigger yet more demand for other goods and services, to fulfil the input needs described above. The amount of labour as well as the quantity and type of goods and services necessary to produce an additional unit of output is industry specific and depends on the technology used. The Input-Output model developed by Wassily Leontief describes such relationships and allows quantifying such additional demand for labour, goods and services through the computation of industry-specific multipliers. Using the Input-Output model as its main building block, the Economic Footprint methodology allows quantifying a productive activity’s total contribution to the wider economy. Within this framework, three distinct effects can be identified and measured:
► A Direct Effect arising from the initial increase in economic activity, the GVA it generates and the
additional jobs it creates;
► An Indirect Effect arising from the additional demand of goods and services along an industry’s
supply chain; and
► An Induced Effect arising as an effect of households spending a share of the additional income
generated through the provision of labour on the consumption of goods and services.
Indirect and induced economic impacts described in the economic impact analysis have been derived from direct economic impacts using multipliers for the life sciences sector in Canada. Output multipliers are obtained from Input Output tables, through a mathematical process known as Leontief Inverse. By applying industry GVA/Output ratios and apparent labour productivity measures to the Output multipliers thus obtained, industry level GVA multipliers and employment multipliers can be produced. These multipliers are described in the results section. GVA/Output ratios and apparent labour productivity measures are based on statistical data published by Statistics Canada.

All Rights Reserved | EY 41
Analytical limitations and caveats
Total investments
Not all members responded to the questionnaires concerning investments such as R&D, patient support programs, total costs, and other key investment measures. As such, where these results are presented, they are presented only for the subset of participating members who submitted such data.

All Rights Reserved | EY 42
PMPRB, to CADTH and INESSS
References
All Rights Reserved | EY Proposal to Innovative Medicines Canada 43
References (Alphabetical Order) 2016 Canada's Top 100 Corporate R&D Spenders Report. (2016). Retrieved from Research Infosource:
https://researchinfosource.com/top100_corp.php
Access to New Medicines in Public Drug Plans: Canada and Comparable Countries, IMC Annual Report.
(2015). Retrieved from http://innovativemedicines.ca/wp-
content/uploads/2016/05/20160524_Access_to_Medicines_Report_EN_Web.pdf
Canada Statistics Cancer Registry, Conference Board of Canada. (2017). Retrieved from
http://www23.statcan.gc.ca/imdb/p2SV.pl?Function=getSurvey&SDDS=3207
Current expenditure on pharmaceuticals and other medical non-durables, per capita. (2015). Retrieved
from OECD, Health Statistics: https://data.oecd.org/healthres/pharmaceutical-spending.htm
Definitions of the different types of impacts eg direct/indirect/induced - ONS, Measuring the economic
impact of an intervention or investment . (2010). Retrieved from
http://webarchive.nationalarchives.gov.uk/20160129145340/http://www.ons.gov.uk/ons/rel
/regional-analysis/measuring-the-economic-impact-of-an-intervention-or-
investment/measuring-the-economic-impact-of-an-intervention-or-investment/index.html
GVA Canada vs UK - EY Analysis (ONS, What does the UK pharmaceutical industry look like today.
(2014). Retrieved from
http://webarchive.nationalarchives.gov.uk/20160106003953/http://www.ons.gov.uk/ons/rel
/iop/index-of-production/april-2014/sty-pharmaceuticals.html
(2015). Life Sciences in BC: Economic Impact now and in the Future.
National Health Expenditure Trends 1975 to 2016. (2016). Retrieved from Canadian Institute for
Health Information: https://secure.cihi.ca/free_products/NHEX-Trends-Narrative-
Report_2016_EN.pdf
Patentee’s Guide to Reporting. (2015, July). Retrieved from http://www.pmprb-
cepmb.gc.ca/view.asp?ccid=523&lang=en
PMPRB annual reports. (2014). Retrieved from http://www.pmprb-cepmb.gc.ca/view.asp?ccid=1217
PMPRB annual reports. (2015). Retrieved from http://www.pmprb-cepmb.gc.ca/view.asp?ccid=1273
Prescribed Drug Spending in Canada, 2013: A Focus on Public Drug Programs. (2015). Retrieved from
Canadian Institute for Health Information:
https://secure.cihi.ca/estore/productFamily.htm?locale=en&pf=PFC2896
Protecting Canadians from Excessive Drug Prices: Consulting on Proposed Amendments to the Patented
Medicines Regulations . (n.d.). Retrieved from https://www.canada.ca/en/health-
canada/programs/consultation-regulations-patented-medicine/document.html
State of Canada’s Aerospace Industry, 2017 Report. (2017). Retrieved from ISED and AIAC:
http://aiac.ca/wp-content/uploads/2017/06/State-of-Canadas-Aerospace-Industry-2017-
Report.pdf
The economic contribution of the UK Life Sciences industry. (2017). Retrieved from ABPI:

All Rights Reserved | EY Proposal to Innovative Medicines Canada 44
http://www.abpi.org.uk/our-
work/library/industry/Documents/The_economic_contribution_of_the_UK_Life_Sciences_indus
try.pdf
The Economic Footprint of Selected Pharmaceutical Companies in Europe. (2016). Retrieved from
EFPIA:
https://www.wifor.com/tl_files/wifor/PDF_Publikationen/161219_Efpia_EF_report_WifOR_upd
ated.pdf

EY | Assurance | Tax | Transactions | Advisory About EY
EY is a global leader in assurance, tax, transaction and advisory
services. The insights and quality services we deliver help build
trust and confidence in the capital markets and in economies the
world over. We develop outstanding leaders who team to deliver
on our promises to all of our stakeholders. In so doing, we play a
critical role in building a better working world for our people, for
our clients and for our communities.
EY refers to the global organization and/or one or more of the
member firms of Ernst & Young Global Limited, each of which is a
separate legal entity. Ernst & Young Global Limited, a UK
company limited by guarantee, does not provide services to
clients. For more information about our organization, please visit
ey.com.
© 2017 Ernst & Young LLP.
All Rights Reserved.
ey.com/ca