FRM - Level 1 Part 2 - Quantitative Methods including Probability Theory
date post
20-Dec-2015Category
view
218download
1
Data Analysis(Quantitative Methods)
Lecture 2
Probability
Probability
An experiment is an act or process of observation that leads to a single outcome that cannot be predicted with certainty. A sample point is the most basic outcome of an experiment. Ob1, Ob2, …, Obn.

Sample Space & Venn Diagram
The sample space of an experiment is the collection of all its sample points.
S: {Ob1, Ob2, … , Obn}Venn diagrams. Graphical representations. Ob1 Ob2 Obn
S

Examples
Experiment: Observe the up face on a coin
Sample Space: 1. Observe a head H 2. Observe a tail T S={ H, T}
H T
S

Examples
Experiment: Observe the up face on a die.Sample Space: 1. Observe a 1. 2. Observe a 2. 3. Observe a 3. 4. Observe a 4. 5. Observe a 5. 6. Observe a 6.
S= {1,2,3,4,5,6} 1 2 3 4 5 6 s

Examples
Experiment: Observe the up face on two coinsSample Space: 1. Observe HH 2. Observe HT 3. Observe TH 4. Observe TTS: {HH,HT,TH,TT}
HH HT TH TTS

Probability Rules for Sample Points
All sample point probabilities must lie between 0 and 1.The probabilities of all the sample points within a sample space must sum to 1.

Probability
An Event is a specific collection of Sample points.Example: Consider the experiment of tossing two balanced coins.Events: A: {Observe exactly one head}
B: {Observe at least one head}

Probability
Sample point Probability HH 1/4 HT 1/4 TH 1/4 TT 1/4
P(A)=P(HT)+P(TH)=1/2P(B)=P(HH)+P(TH)+P(HT)=3/4

Probability of an Event
The probability of an event A is calculated by summing the probabilities of the sample points in the sample space for A.

Steps for Calculating Probabilities of Events
Define the experiment.List the sample points. Ob1,Ob2,…,Obn
Assign probabilities to the sample points. P(Ob1), … , P(Obn).Determine the collection of sample points contained in the event of interest.Sum the sample point probabilities to get the event probability.

Steps for Calculating Probabilities of Events
Example:Experiment: Observe the up face on a die.Find the probability of event of sum of two
throws is equal to 6.Solution: Sample points 36 (6 by 6).A: sum of two throws is equal to 6.(1,5),(2,4),(3,3),(4,2),(5,1)Pr(A)=5/36

Unions and intersections
The Union of two events A and B is the event that occurs if either A or B or both occur on a single performance of the experiment, denoted as the symbol A B
Unions and intersections
The intersection of two events A and B is the event that occurs if both A and B occur on a single performance of the experiment, denoted as the symbol
P(A B)Events A and B are mutually exclusive if A B contains no sample points, i.e. if A
and B have no sample points in comon.

Unions and intersections
AA B
A B A B

Unions and intersections
Example 1.Consider the die-toss experiment.
Define the following events:A: {Toss an even number}B: {Toss a number less than or equal
to 3}Find:

Unions and intersections
( ) ( ).
:
{2,4,6}, {1,2,3}.
{1,2,3,4,6}, {2}.
( ) 5 / 6, ( ) 1/ 6
P A B and P A B
Solution
A B
A B A B
P A B P A B

Complementary Events
The complement of an event A is the event that A does not occur -- that is, the event consisting of all sample points that are not in event A and denoted as symbol Ac
P(A)+P(Ac)=1
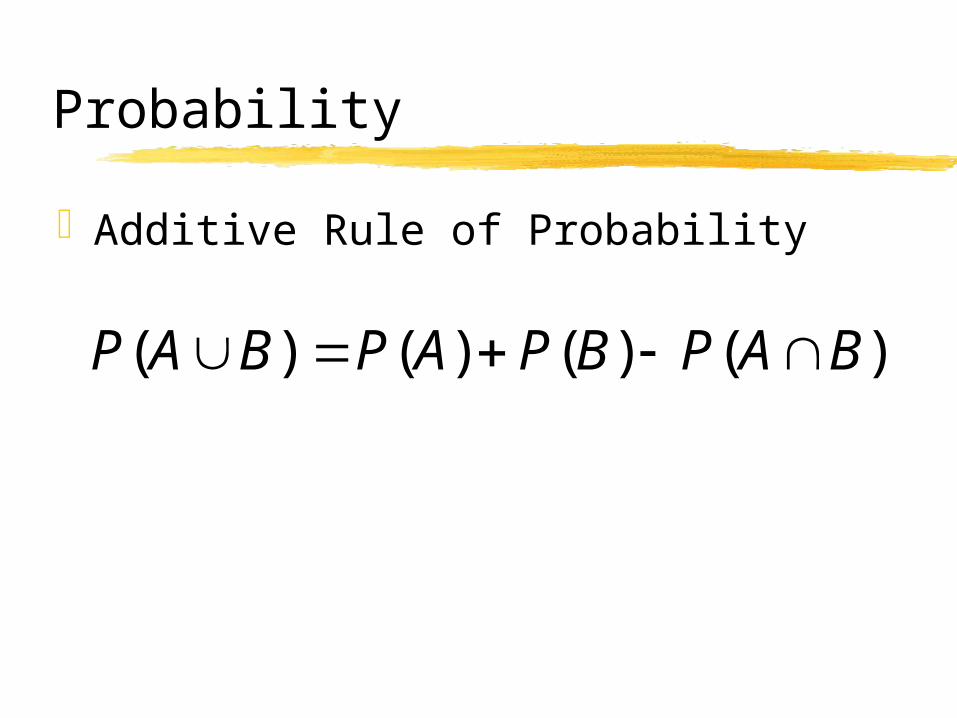
Additive Rule of Probability
( ) ( ) ( ) ( )P A B P A P B P A B
Probability

Conditional Probability
To find the conditional probability that event A occurs given that event B occurs, divide the probability that both A and B occur by the probability that B occurs, that is,
( )( | )
( )
P A BP A B
P B

Probability
Tree diagram
H
H
T
T
H
T
HH
HT
TH
TT
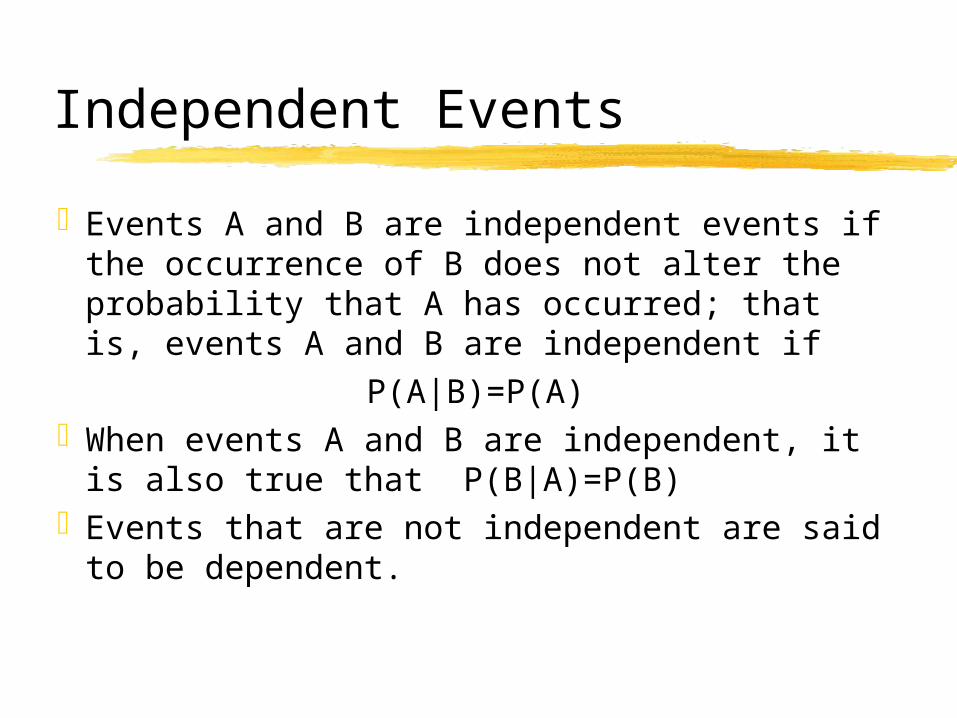
Independent Events
Events A and B are independent events if the occurrence of B does not alter the probability that A has occurred; that is, events A and B are independent if
P(A|B)=P(A)When events A and B are independent, it
is also true that P(B|A)=P(B)Events that are not independent are said
to be dependent.

Probability
Probability of Intersection of Two independent Events
If events A and B are independent, the probability of the intersection of A and B equals the product of the probabilities of A and B; that is P(A B)=P(A) P(B)
The converse is also true: if P(A B)=P(A) P(B), then A and B are
independent.

Example
Use tree-diagram to obtain the Sample space of an experiment that consists of a “fair” coin being tossed three times. Consider the following events:
A=“All three results are the same”. B=“exactly one Head occurs”. C=“at least two Heads occur”. Find: P(A),P(B),P(C), P(A)+P(B)+P(C), P(A C), P(A
B), P(Ac),P(A|C) Hence, explain if all the events A,B and C are not
mutually exclusive and independent as well.

Solution:
P(A)=1/4;P(B)=3/8;P(C)=1/2; P(A)+P(B)+P(C)=1, P(A C)=1/8, P(A B)=P(A)+P(B)-P(A B)=1/2.
P(Ac)=1-1/4=3/4,P(A|C)= P(A C)/P(C)=1/4P(A)*P(B)=3/32 P(A B) (P(A B)= 0)P(A)*P(C)=1/8 = P(A C)P(B)*P(C)=3/16 P(B C) (P(B C)= 1/8)

Exercise
Calculate the mode, mean, and median of the following data
(1) 12, 13, 15, 18, 12, 56, 13, 17, 19, 20, 35, 36
(2) 35, 23, 18, 26, 35, 23, 39, 45, 47, 37, 23, 35, 19

Answer:
(1):
Mode: 12,13
Mean: 22.17
Median 17.5
(2):
Mode: 23, 35
Mean: 31.15
Median 35
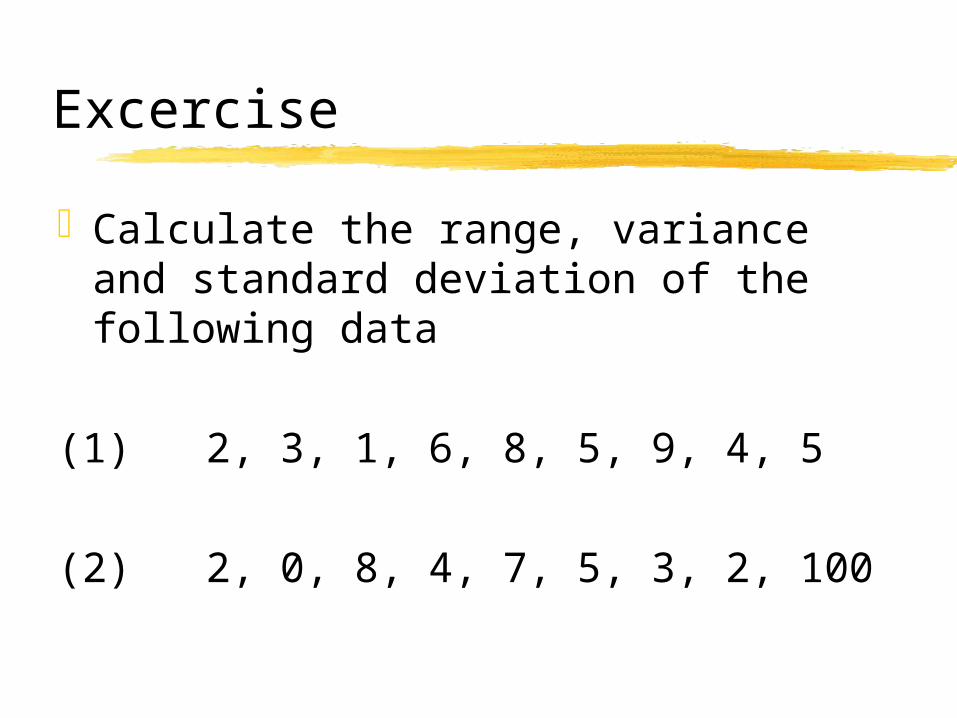
Excercise
Calculate the range, variance and standard deviation of the following data
(1) 2, 3, 1, 6, 8, 5, 9, 4, 5
(2) 2, 0, 8, 4, 7, 5, 3, 2, 100

Answer:
(1):
range: 8
sample variance: 6.94
sample standard deviation: 2.64
(2):
range: 98
sample variance: 1159.32
sample standard deviation: 34.05

Excercise
Two fair coins are tossed and the following events are defined:
A:{Observed at least one head} B:{Observed exactly one head} C:{Observed exactly one tail} D:{Observed at most one head}Find: P(A), P(B D), P(A|D)

Answer:
Pr(A)=3/4
Pr(B D)=1/2
Pr(A|D)=2/3

ExerciseUse tree-diagram to obtain the Sample space of an experiment that consists of a “fair” coin being tossed four times. Consider the following events:
A=“All four results are the same”.
B=“exactly one Head occurs”.
C=“at least two Heads occur”.
Find: P(A),P(B),P(C), P(A)+P(B)+P(C), P(A C), P(A B)
Hence, explain why all the events A,B and C are not mutually exclusive.

Answer:
Pr(A)=1/8, Pr(B)=1/4,Pr(C)=11/16
Pr(A)+Pr(B)+Pr(C)=17/16
Pr(AC)=1/16
Pr(AC)=3/4
Since Pr(AC) is not equal to 0, so A,B,C are not mutually exclusive.
But Pr(A B)=Pr(B C)=0, A,B and B,C are mutually exclusive respectively.

Exercise
Let P(A)=0.7, P(B)=0.5 and P(A B)= 0.8.
Find: (1) P(A B) (2) P(B|A)
(3) Is event A independent of event B?
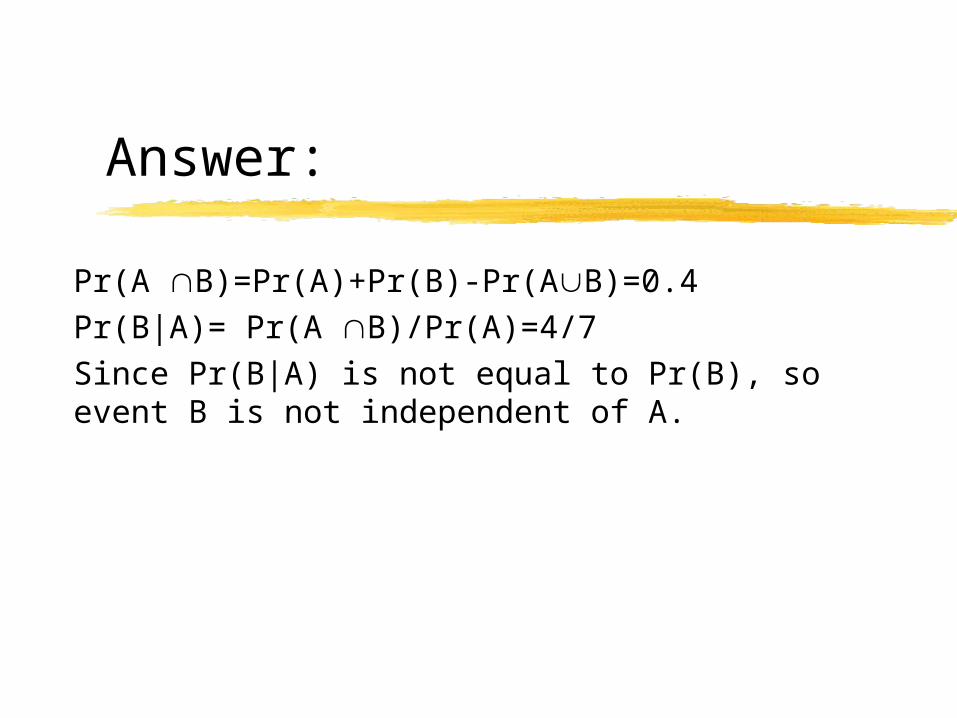
Answer:
Pr(A B)=Pr(A)+Pr(B)-Pr(AB)=0.4
Pr(B|A)= Pr(A B)/Pr(A)=4/7
Since Pr(B|A) is not equal to Pr(B), so event B is not independent of A.

References
Statistics, 8th Edition
MaClave and Sincich
Prentice Hall, 2000.