Data Analysis, Probability, & Discrete Math – Practice Problems
44
Data Analysis, Probability, & Discrete Math – Practice Problems Possible Outcomes 1. Cole is painting a picture with 8 equal-sized sections. Each section will be a different color. Which equation can be used to determine the number of ways in which the sections can be painted? A. w = 8 2 B. w = 8! - 7! C. w = 8 8 D. w = 8! Surveys & Sampling 2. Mrs. Allen wants to find out the favorite television show of the eighth grade students at the school. She rolls a die twice getting a 2 and a 5. Then, she decides to take an alphabetical list of all her eighth grade students, and starting with the second person on that list, polls every fifth student. Which of the following best describes the type of sample this would create? A. representative sample B. biased sample C. random sample D. convenience sample Scatter Plots 3.
Transcript of Data Analysis, Probability, & Discrete Math – Practice Problems

Data Analysis, Probability, & Discrete Math – Practice Problems
Possible Outcomes
1. Cole is painting a picture with 8 equal-sized sections. Each section will be a different color.
Which equation can be used to determine the number of ways in which the sections can be
painted?
A. w = 82
B. w = 8! - 7!
C. w = 88
D. w = 8!
Surveys & Sampling
2. Mrs. Allen wants to find out the favorite television show of the eighth grade students at the
school. She rolls a die twice getting a 2 and a 5. Then, she decides to take an alphabetical list of
all her eighth grade students, and starting with the second person on that list, polls every fifth
student.
Which of the following best describes the type of sample this would create?
A. representative sample
B. biased sample
C. random sample
D. convenience sample
Scatter Plots
3.

One state did a study to see if last year's reading test scores were related to the number of fire
drills each school conducted. The data is shown on the scatter plot above. Which of the following
is the best conclusion of the study?
A. The fewer fire drills a school conducted, the lower the test scores.
B. The more fire drills a school conducted, the higher the test scores.
C. The more fire drills a school conducted, the lower the test scores.
D. There was no relationship found between fire drills and test scores.
Select & Interpret Graphs
4. Which type of graph is best suited for displaying the range and frequency distribution of total
points scored each game during a high school's basketball season while still showing each game's
score?
A. circle graph
B. box-and-whisker plot
C. histogram
D. stem-and-leaf plot
Central Tendency
5. What is the median of the following set of numbers?
33, 29, 36, 32, 29, 31, 28, 41, 35
A. 33
B. 29
C. 45
D. 32
Probability
6. Mark purchased a box of 20 sports cards at a garage sale. Three are baseball cards, 4 are
football cards, 2 are basketball cards, and the rest are hockey cards. If he draws one card from
the box, what is the probability that it will be a baseball card?
A. 0.1
B. 0.2
C. 0.15
D. 0.4
Possible Outcomes
7. Sandra has 6 different jackets and 9 scarves. On a cold day, she wants to wear 1 jacket and 1
scarf. How many possible combinations could she choose to wear?
A. 45
B. 54
C. 15
D. 48
Select & Interpret Graphs
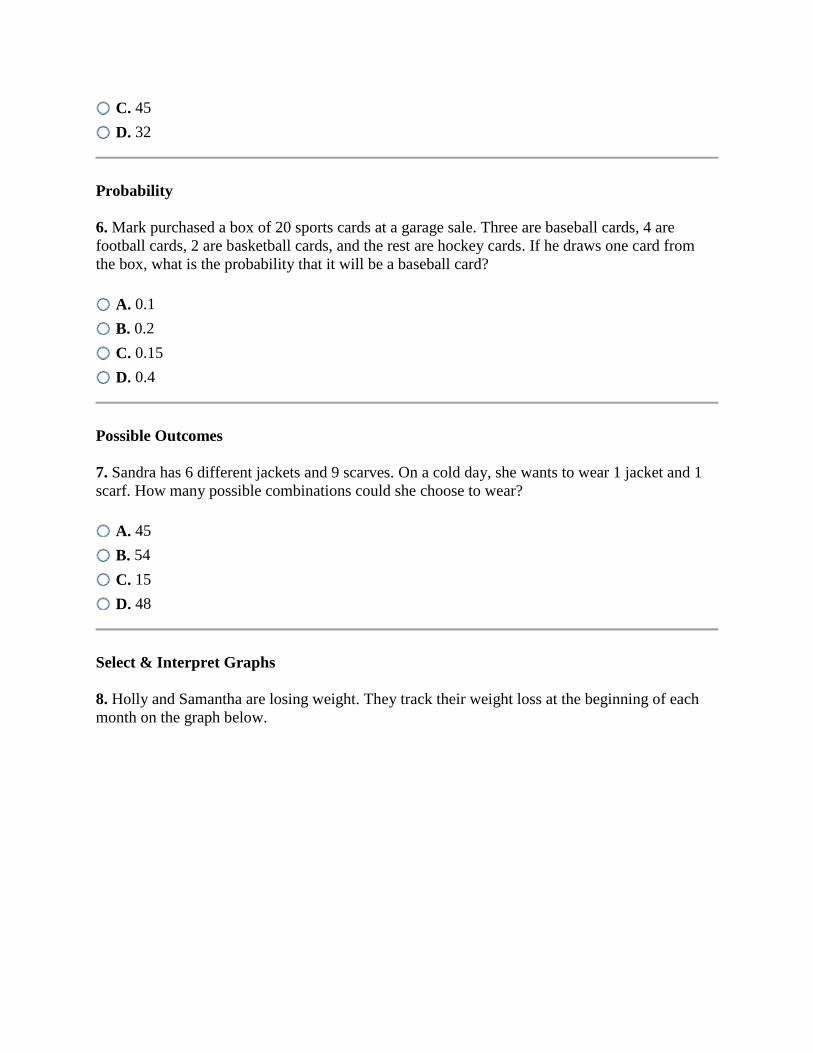
8. Holly and Samantha are losing weight. They track their weight loss at the beginning of each
month on the graph below.
By the fourth month, how many more pounds did Holly lose than Samantha?
A. 6
B. 4
C. 2
D. 10
Central Tendency
9. What is the upper quartile of the following data set?
24, 31, 32, 38, 36, 28, 31
A. 35
B. 36
C. 37
D. 28
Scatter Plots
10. Which of the scatter plots below shows the most accurate line of best fit?
Y.

W. X. Z.
A. Z
B. W
C. Y
D. X
Vertex-Edge Graphs
11. How many edges are on this graph?
A. 8
B. 14
C. 10
D. 12
Scatter Plots
12. Which of the scatter plots below shows the most accurate line of best fit?
W.
X.
Y.
Z.
A. W
B. Y
C. X

D. Z
Vertex-Edge Graphs
13. Find the shortest route from the bike shop to the library to the gym. Each square equals 1
block.
W.
X.
Y.
Z.
A. Z
B. Y
C. W
D. X
Vertex-Edge Graphs
14. What is the fewest number of colors that can be used to color the map so that regions sharing
boundaries do not use the same color?
A. 2
B. 3
C. 5
D. 4
Vertex-Edge Graphs
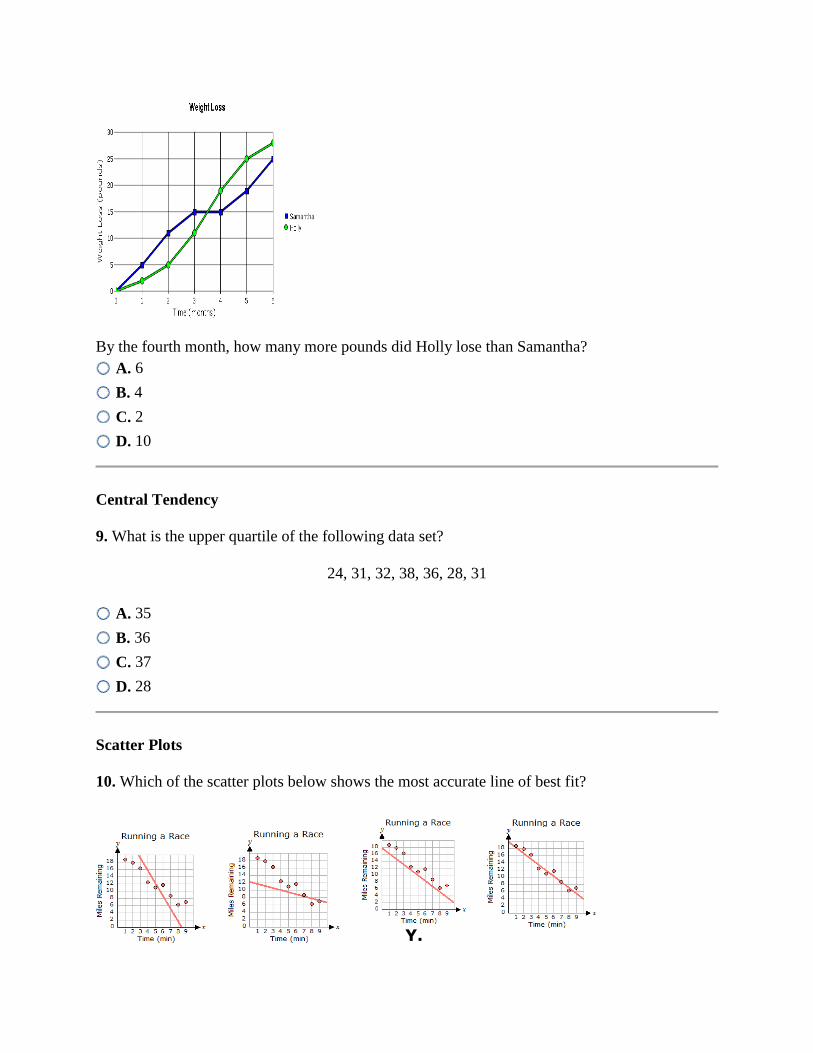
15. You are planning a trip to the beach and want to take the shortest route. Which route to the
beach is the shortest?
W.
X.
Y.
Z.
A. Z
B. W
C. Y
D. X
Possible Outcomes
16. Jim & Larry's Ice Cream Shoppe sells 19 different flavors of ice cream. They also have 8
different ice cream toppings. If Jan wants to buy an ice cream cone with exactly 1 flavor of ice
cream and 1 topping, how many possible combinations does she have from which to choose?
A. 133
B. 144
C. 27
D. 152
Surveys & Sampling

17. A school district wants to know how eighth grade students are doing in math this year. They
get a list of all 17,160 eighth grade students in the district and decide to look at the math grades
of every 10th
student on the list starting with the 6th
student. Then they took the average grade of
these students to use as a representative average.
What kind of sampling is this?
A. responses to a survey
B. random sampling
C. biased sampling
D. add and divide survey
Scatter Plots
18.
Which of the following is true, based on the scatter plot above?
A. There is a positive correlation between age and amount of time spent watching television.
B. There is a negative correlation between age and amount of time spent watching television.
C. There is no correlation between age and amount of time spent watching television.
D. There is both a positive and a negative correlation between age and amount of time spent
watching television.
Surveys & Sampling
19. Dr. Watts wants to find out which type of television show is most popular among women
living in the United States between the ages of 30 and 35. He randomly selects 100 women living
in Texas between the ages of 30 and 35 for his survey. The results of his survey show that the
most popular type of show is a talk show, followed by soap operas, and syndicated reruns.
Therefore, he infers that the most popular type of show among women living in the United States
between the ages of 30 and 35 is a talk show.
Is Dr. Watts' inference accurate?

A. No, because syndicated reruns are definitely better than talk shows.
B. No, because the sample was biased since they were not all women.
C. Yes.
D. No, because the sample was biased since they all lived in Texas.
Select & Interpret Graphs
20. The graph below shows the results of a middle school election for president of the student
body.
How many 6th graders voted in all?
A. 330
B. 350
C. 370
D. 280
Central Tendency
21. What is the lower quartile of the following data set?
42, 50, 55, 38, 61, 59, 43, 46, 41
A. 41
B. 42
C. 40.5
D. 41.5
Select & Interpret Graphs

22. What numbers are represented on this stem-and-leaf plot?
A. 60, 60, 61, 70, 73, 857, 91
B. 60, 60, 61, 703, 857, 91
C. 6,001, 703, 857, 91
D. 60, 60, 61, 70, 73, 85, 87, 91
Select & Interpret Graphs
23.
In the histogram above, how many tourists are over
the age of 50?
A. 14
B. 4
C. 3
D. 9
Probability
24. The following same-sized chips are placed in a bucket:
3 red, 5 yellow, 5 blue, and 5 green.
If one chip is randomly selected from the bucket, what is the probability that the chip is either
yellow or green?

A.
5
9
B.
5
18
C.
1
9
D.
5
4
Surveys & Sampling
25. Twenty-five people were randomly surveyed. After tasting four different sodas, each person
was asked which soda they preferred. The survey results are shown below.
Soda Number of People
Number 1 5
Number 2 8
Number 3 2
Number 4 10
Based on the survey results, which of the following is the best prediction for the number of
people who would prefer soda number 4 if 300 people were surveyed?
A. 110
B. 120
C. 60
D. 125
Surveys & Sampling
26. Jeret is separating the participants in a clinical trial into two groups using a number generator
that goes from 1 to 10. If a participant receives an odd number, he or she is assigned to the first
group. If a participant receives an even number, he or she is assigned to the second group.

Which of the following best describes the first group of participants?
A. The first group of participants is a survey response sample.
B. The first group of participants is a random sample.
C. The first group of participants is a representative sample.
D. The first group of participants is a convenience sample.
Surveys & Sampling
27. Jim wants to conduct a survey of U.S. teens aged 13 - 15 to find out what songs are their
favorites. To do this, he does a random survey of 300 teens aged 12 - 15.
Which of the following correctly describes his sample?
A. This method of sampling is neither biased nor unbiased.
B. This method of sampling is biased.
C. This method of sampling is unbiased.
D. This method of sampling can be considered both biased and unbiased.
Surveys & Sampling
28. One hundred single adults, who have a full-time job, were randomly surveyed. They were
asked what the result was when they filed their taxes last year. The survey results are shown
below.
Results from
Filing Taxes
Number of
Single Adults
Received a return of
more than $500 15
Received a return of
less than $500 40
Had to pay
less than $500 32
Had to pay
more than $500 13

Based on the survey results, which of the following is the best prediction for the number of
single adults who received a return of less than $500 after they filed their taxes last year if 850
single adults with a full-time job were surveyed?
A. 320
B. 340
C. 360
D. 350
Possible Outcomes
29. Given the set {A, B, C, D}, how many permutations and combinations are there of this set of
4 objects taken 2 at a time?
A. 20 permutations and 10 combinations
B. 12 permutations and 6 combinations
C. 20 permutations and 5 combinations
D. 10 permutations and 20 combinations
Vertex-Edge Graphs
30. This graph shows the route from Tim's house to Bill's house. How many vertices are on this
graph?
A. 11
B. 10
C. 12
D. 9
Probability

31. Teresa has a copy of her school's student directory on her desk.
Students whose last names start with the letters A to F occupy the first 6 pages of the
book.
Students whose last names start with the letters G to M occupy the next 3 pages of the
book.
Students whose last names start with the letters N to R occupy the following 8 pages of
the book.
Students whose last names start with the letters S to Z occupy the final 7 pages of the
book.
If she opens up the directory and picks out a student at random, what is the probability that this
student's last name begins with a letter from the first half of the alphabet?
A.
9
16
B.
5
8
C.
3
8
D.
1
4
Select & Interpret Graphs
32. What type of graph is best suited for displaying the percentages of students in each grade
level at a school?
A. bar graph
B. box-and whisker plot
C. pie chart
D. line graph
Probability

33. Christopher draws two marbles from the bag. He does not replace the first marble before
drawing the second marble. What is the probability that he will draw a blue marble on the first
draw and a blue marble on the second draw?
A. 1/4
B. 5/22
C. 1/36
D. 1/24
Vertex-Edge Graphs
34. Which of these vertex-edge graphs can be drawn with a single line without retracing the line?
W.
X.
Y.
Z.
A. W
B. Y
C. Z
D. X

Central Tendency
35. What is the mode of the following set of numbers?
90, 110, 20, 90, 110, 172, 90, 54, 54
A. 92
B. 20
C. 90
D. 172
Select & Interpret Graphs
36. Two hundred students were asked how many hours of TV they watch per night. The results
are displayed in the graph below.
How many students watch at least 1 hour of television per night?
A. 64
B. 128
C. 164
D. 36
Select & Interpret Graphs
37. Which type of graph is best suited for graphing the weight of a child as he or she ages?
A. box-and-whisker plot
B. line graph
C. histogram
D. stem-and-leaf plot

Possible Outcomes
38. How many three-number combinations can be made from the following three numbers?
551
A. 3
B. 6
C. 4
D. 5
Scatter Plots
39. Which of the following data would best be displayed on a scatter plot?
A. number of kittens born per litter
B. yearly rain totals in two different cities
C. math test score vs. reading test score
D. political parties and election years
Possible Outcomes
40. Drake has time to do one chore and play one video game. He has 6 chores he could choose to
do, and he has 7 video games from which to choose. How many possible combinations does
Drake have?
A. 42
B. 35
C. 13
D. 36
Vertex-Edge Graphs
41. Find the shortest route from the bike shop to the pool to the library. Each square equals 1
block.
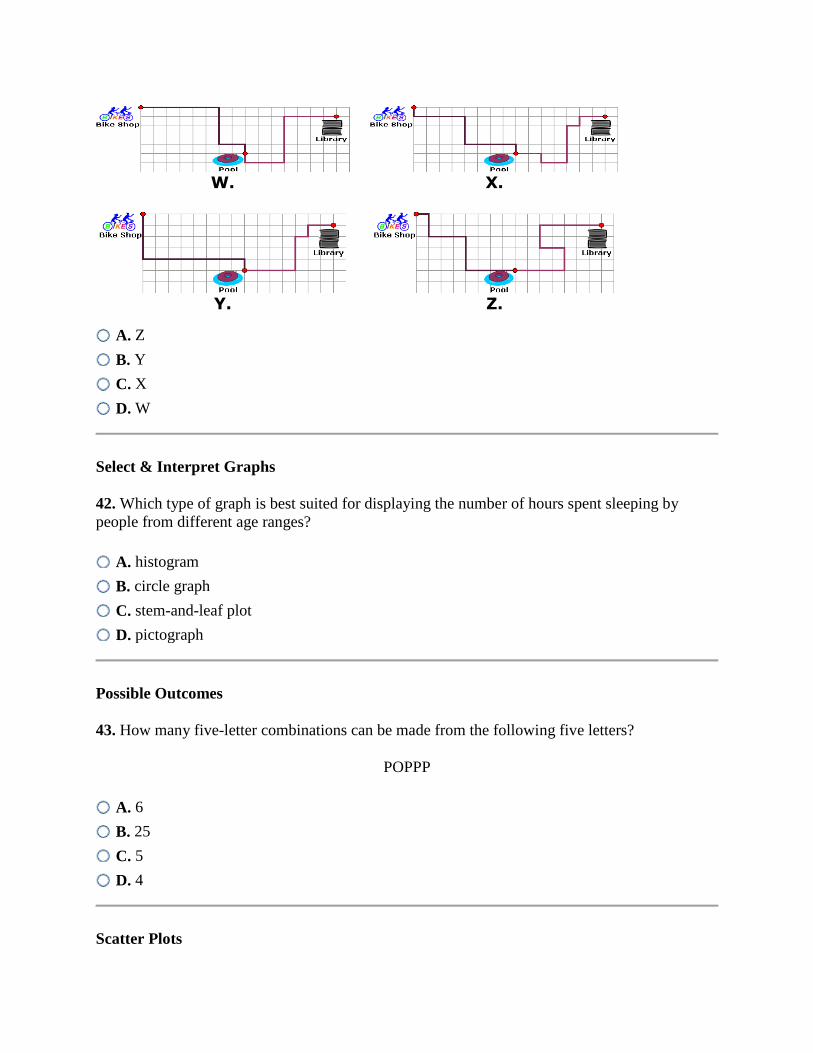
W.
X.
Y.
Z.
A. Z
B. Y
C. X
D. W
Select & Interpret Graphs
42. Which type of graph is best suited for displaying the number of hours spent sleeping by
people from different age ranges?
A. histogram
B. circle graph
C. stem-and-leaf plot
D. pictograph
Possible Outcomes
43. How many five-letter combinations can be made from the following five letters?
POPPP
A. 6
B. 25
C. 5
D. 4
Scatter Plots

44. Amos has been in charge of several construction projects. Each project took a different
amount of time to complete, based on the number of workers he hired, as shown in the scatter
plot below.
If Amos hires 14 workers for a new project, based on the trend shown by the line of best fit, how
long can he expect the project to take?
A. 15 days
B. 22 days
C. 14.5 days
D. 11.5 days
Vertex-Edge Graphs
45. What is the least number of edges that need to be removed to make the figure disconnected?
A. 3
B. 5
C. 1
D. 4
Possible Outcomes
46. How many four-letter arrangements are possible from the four letters given below?
MAMM
A. 16

B. 5
C. 4
D. 3
Central Tendency
47. What is the mode of the following set of numbers?
56, 73, 88, 56, 73, 105, 73, 119, 88, 119
A. 105
B. 119
C. 88
D. 73
Vertex-Edge Graphs
48. How many vertices are on this graph?
A. 10
B. 8
C. 6
D. 4
Surveys & Sampling
49. A marketing firm for Cobra Auto Security Systems mailed out a survey to 25% of the
households in New York City, Washington DC, and Chicago to determine the market for auto
security systems. According to the respondents of the survey, 45% of the population uses public
transportation and does not own an automobile. So, the marketing firm concluded that 45% of all
Americans use public transportation and do not own an automobile. Which of the following
statements is correct?
A. This method of sampling is unbiased.
B. This method of sampling is biased.
C. This method of sampling can be considered both biased and unbiased.
D. This method of sampling is neither biased nor unbiased.
Scatter Plots
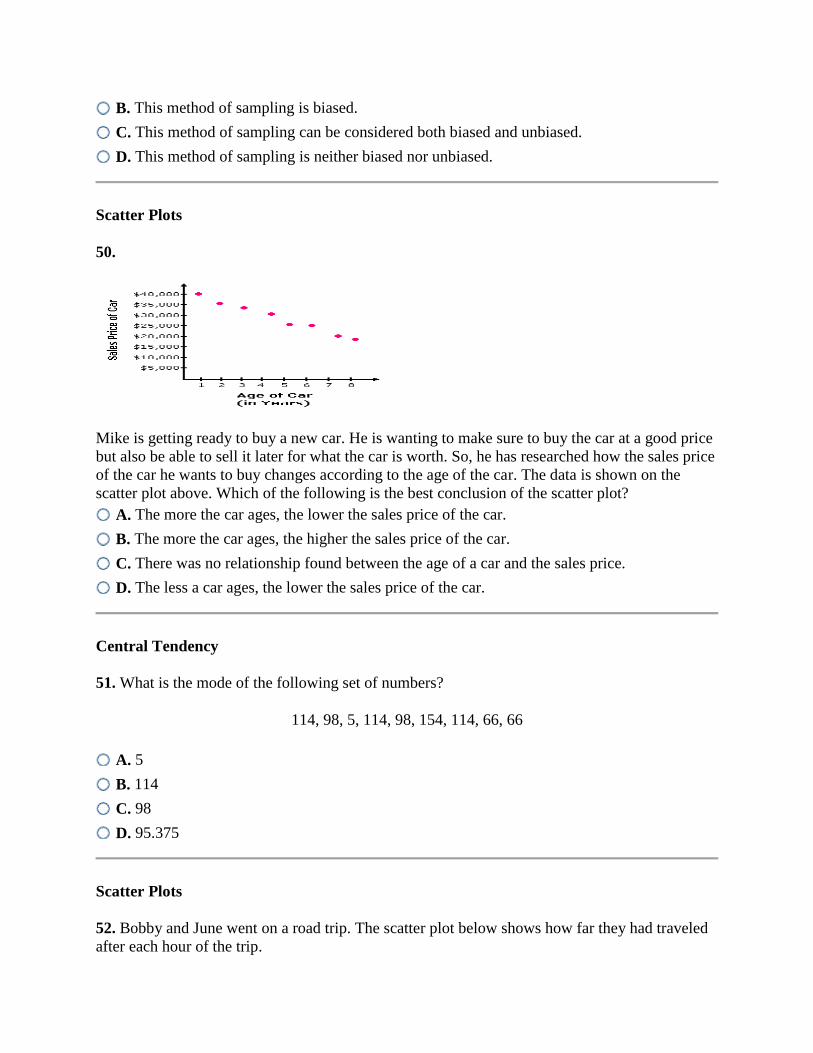
50.
Mike is getting ready to buy a new car. He is wanting to make sure to buy the car at a good price
but also be able to sell it later for what the car is worth. So, he has researched how the sales price
of the car he wants to buy changes according to the age of the car. The data is shown on the
scatter plot above. Which of the following is the best conclusion of the scatter plot?
A. The more the car ages, the lower the sales price of the car.
B. The more the car ages, the higher the sales price of the car.
C. There was no relationship found between the age of a car and the sales price.
D. The less a car ages, the lower the sales price of the car.
Central Tendency
51. What is the mode of the following set of numbers?
114, 98, 5, 114, 98, 154, 114, 66, 66
A. 5
B. 114
C. 98
D. 95.375
Scatter Plots
52. Bobby and June went on a road trip. The scatter plot below shows how far they had traveled
after each hour of the trip.

Based on the trend shown by the line of best fit, how far had Bobby and June expected to travel
after six hours?
A. 280 miles
B. 300 miles
C. 330 miles
D. 350 miles
Select & Interpret Graphs
53.
How many more students scored between 81 and 90 than between 71 and 80?
A. 8
B. 12
C. 4
D. 7
Surveys & Sampling
54. Which of the following methods could Joely use to create a survey response sample to find
the favorite type of restaurant of the eighth grade students in her school?
A. Ask the eighth grade students in her homeroom class which type of restaurant is their

favorite.
B. Ask ten of her seventh and eighth grade friends to complete a checklist about their
restaurant preferences.
C. Ask the eighth grade students to complete a checklist about their restaurant preferences.
D. Ask every fifth student in the eighth grade directory which type of restaurant is his or her
favorite.
Possible Outcomes
55. Chris needs to make a four-letter password for his e-mail account. If no two letters of the
alphabet can be duplicated for the password, how many possible passwords can he create?
A. 26 × 4
B. 26 × 25 × 24 × 23
C. 4 × 26 × 25 × 24 × 23
D. 26 × 26 × 26 × 26
Vertex-Edge Graphs
56. Find the shortest route from the beach to the ice cream shop to the gym. Each square equals 1
block.
W.
X.
Y.
Z.
A. Z

B. W
C. X
D. Y
Probability
57.
Bag Contents
Color Number
Blue 6
Red 2
Green 4
A bag contains 12 marbles, and the contents of the bag are shown in the table above. Christopher
draws two marbles from the bag. If he draws the second marble after replacing the first marble,
what is the probability of drawing a red marble on the first draw and a green marble on the
second draw?
A.
2
9
B.
2
33
C.
1
4
D.
1
18
Possible Outcomes
58. Billy has 5 chips numbered 1 to 5. He randomly stacks the chips on top of each other. How
many different ways can the 5 chips be stacked?

A. 5!
B. 6!
C. 4!
D. 3!
Central Tendency
59. The box-and-whisker plot below shows the ages of the people attending the two Saturday
afternoon movies.
Ages of People
Based on this information, what is the difference between the median ages of the people
attending the two movies?
A. 55 years
B. 45 years
C. 20 years
D. 35 years
Probability
60. Kadeem wrote twelve numbers on twelve cards, mixed them up, and placed them face down.
He drew two cards at random where the first card was replaced before the second card was
drawn.
What is the probability that the first card drawn was divisible by 10 and the second card drawn
was divisible by 11?

A.
5
24
B.
1
22
C.
1
36
D.
1
24
Possible Outcomes
61. Dippin' Donuts has 16 different flavors of donuts and 6 different flavors of coffee. Jessie
wants 1 donut and 1 cup of coffee. How many possible combinations does Jessie have from
which to choose?
A. 22
B. 96
C. 80
D. 90
Central Tendency
62. What is the median of the following set of numbers?
35, 32, 28, 32, 27, 25, 30, 37, 23
A. 27
B. 45
C. 30
D. 46
Central Tendency
63. What is the median of the following set of numbers?

28, 32, 32, 35, 39, 41, 43, 43, 46, 46, 46, 50
A. 43
B. 41
C. 40
D. 42
Vertex-Edge Graphs
64. What is the fewest number of colors that can be used to color the map so that regions sharing
boundaries do not use the same color?
A. 5
B. 3
C. 6
D. 4
Vertex-Edge Graphs
65. What is the fewest number of colors that can be used to color the map so that regions sharing
boundaries do not use the same color?
A. 3
B. 2
C. 5
D. 4

Central Tendency
66. Berry took a math course in which her test grade average made up 75% of her course grade,
and her daily grade average made up the rest. Her test scores in the course were 87, 89, 90, 82,
and 87, and the average of her daily grades was an 86.
Which grade did Berry receive for the entire course?
A. 87
B. 86.9
C. 86.5
D. 86.75
Surveys & Sampling
67. Each student in the eighth grade class was given a survey to fill out. It asked their preferences
about the kind of attraction they wanted to see for their class field trip. The survey indicated that
the only attractions open during this time of year were the zoo and the museum. The zoo was
preferred 67 to 33 when the votes were counted. When the students arrived at the zoo, they
noticed that next to the zoo, the new aquarium had just opened.
What statement below is true?
A. If the students had been given the choice of going to the aquarium, some of them may have
voted for it.
B. The only attractions open at this time are the zoo and the museum.
C. The majority of students would have chosen the aquarium.
D. Even if the aquarium was on the survey, no student would have voted for it.
Select & Interpret Graphs
68.
How many oranges were sold from May 1 to July 31?
A. 61
B. 26
C. 85
D. 60
Scatter Plots
69. The average height for boys is shown in the table below.
Age in Years 1 2 3 4 5 6 7 8 9 10
Height in Inches 31 36 39 42 44 46.75 49 51 53.25 55.25
The data listed in the table is plotted below.
Which of the following lines fits the data the best?
A.
B.
C.
D.

Select & Interpret Graphs
70. Which graph type would be best suited for showing the upper quartile for the ages of the
teachers in a high school?
A. box-and-whisker plot
B. circle graph
C. histogram
D. scatter plot
Surveys & Sampling
71. Mrs. Whitecastle believed that 43% of 8th
grade students across the state excel in math. Mrs.
Whitecastle gave the students in her class an exam over exponents. Based on the number of
students that made an A or B on the exam, she concluded that 46% of 8th
grade students across
the state excel in math.
Which type of sampling is this?
A. convenience sampling
B. response to survey
C. random sampling
D. census
Scatter Plots
72. Which of the scatter plots below shows the most accurate line of best fit?
W.
X.
Y.
Z.
A. X

B. Y
C. Z
D. W
Surveys & Sampling
73. A computer manufacturer sent out survey cards to customers who purchased new computers
over the last 3 months. The survey card only had boxes to check for replies, and no places to
write additional comments. What is a possible result of the design of the survey cards?
A. The customers who filled out the cards may not express their true opinions.
B. The results cannot be examined because customers returned comment cards instead of the
survey cards sent to them.
C. Not enough cards would be returned.
D. Customers would refuse to fill out the cards.
Probability
74.
Lauren has a normal deck of 52 playing cards
If she randomly draws a card from the deck, what is the probability that it will be a red jack, a
red queen, or a red king?
A.
B.
C.
D.
Scatter Plots
75. Luanne made the scatter plot below to record the cost of pizzas based on their number of
toppings. The pizzas were not all from the same pizzeria.
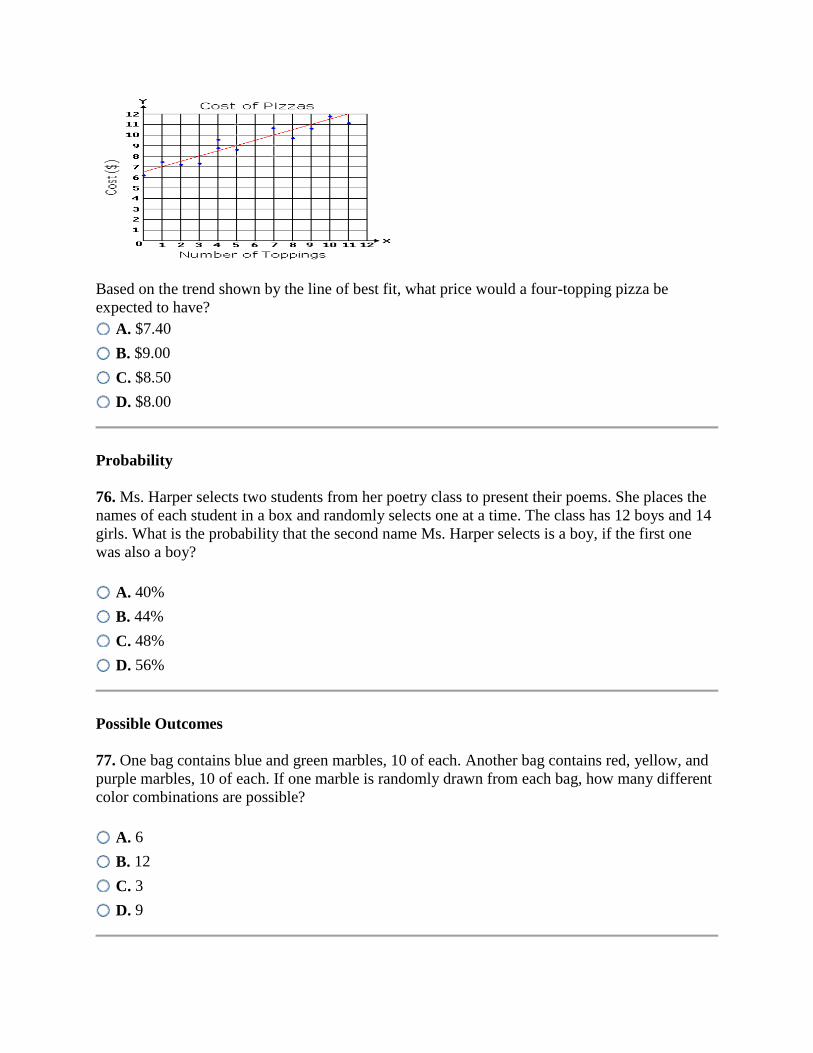
Based on the trend shown by the line of best fit, what price would a four-topping pizza be
expected to have?
A. $7.40
B. $9.00
C. $8.50
D. $8.00
Probability
76. Ms. Harper selects two students from her poetry class to present their poems. She places the
names of each student in a box and randomly selects one at a time. The class has 12 boys and 14
girls. What is the probability that the second name Ms. Harper selects is a boy, if the first one
was also a boy?
A. 40%
B. 44%
C. 48%
D. 56%
Possible Outcomes
77. One bag contains blue and green marbles, 10 of each. Another bag contains red, yellow, and
purple marbles, 10 of each. If one marble is randomly drawn from each bag, how many different
color combinations are possible?
A. 6
B. 12
C. 3
D. 9

Probability
78. Christina keeps her DVD collection in a plastic tub. The table shows the number of each type
of DVD in Christina's collection.
Christina's DVD Collection
Type of
DVD
Number of
DVDs
Sci-Fi 2
Action 3
Drama 8
Comedy 10
Romance 7
If two DVDs are chosen randomly one at a time, where the first DVD is replaced before the
second DVD is chosen, what is the theoretical probability that both DVDs chosen are from the
drama category?
A.
B.
C.
D.
Select & Interpret Graphs
79. One hundred students were asked how many hours of TV they watch per night. The results
are displayed in the graph below.

How many students watch more than 2 hours of television per night?
A. 18
B. 36
C. 38
D. 32
Central Tendency
80.
Game 1 2 3 4 5 6 7 8 9 10
Jets 10 10 13 21 10 14 10 42 28 12
Opponent 7 3 17 24 14 0 3 21 27 28
The chart above shows the football scores for the Jets this season. Which of the following
measures of central tendency would show the most typical score for the Jets' season?
A. median
B. mode
C. range
D. mean
Vertex-Edge Graphs
81. Which vertex is not connected to vertex L?
A. M
B. P
C. O
D. N

Surveys & Sampling
82. Dr. Watts wants to find out which type of television show is most popular among women
living in the United States between the ages of 30 and 35. He randomly selects 100 women living
in Texas between the ages of 30 and 35 for his survey. The results of his survey show that the
most popular type of show is a talk show, followed by soap operas, and syndicated reruns.
Therefore, he infers that the most popular type of show among women living in the United States
between the ages of 30 and 35 is a talk show.
Which of the following is the sample of Dr. Watts' study?
A. 100 randomly selected women living in Texas between the ages of 30 and 35
B. all people in the United States
C. women living in the United States between the ages of 30 and 35
D. 100 randomly selected women living in Oklahoma
Possible Outcomes
83. How many different playing orders (that is, who goes first, second, third, fourth) are there for
a game in which four people are playing?
A. 12
B. 48
C. 9
D. 24
Surveys & Sampling
84. Tad is the regional manager of a chain of grocery stores. He manages several stores and has
an office in one of the stores. He wants to find which brand of paper towels is most popular in
the stores he manages. He decides to ask every tenth customer who bought paper towels in the
store he has an office in which type of paper towel he or she bought.
Which of the following best describes the type of sample this created?
A. convenience sample
B. representative sample

C. random sample
D. unbiased sample
Central Tendency
85. What is the mean of the following set of numbers?
63 , 7.2, 9.6
8
A. 6.85
B. 7.2
C. 10.27
D. 3.2
Vertex-Edge Graphs
86. Which vertex is not connected to vertex 1?
A. vertex 4
B. vertex 3
C. vertex 5
D. vertex 2
Probability
87. Hadley is conducting an experiment in which she will spin the spinner below, record its
result, and then spin the spinner again.

What is the probability that the result of the spins is an even number followed by an odd
number?
A.
1
6
B.
1
16
C.
1
2
D.
1
4
Central Tendency
88. A drag race was held with 20 contestants. The best time was 7.4 seconds, and the worst time
was 10.3 seconds. Only half of the contestants advance to the final race. Which measure of
central tendency should be used to calculate the cutoff time for the final race?
A. median
B. mean
C. mode
D. range
Scatter Plots
89. David wondered if the temperature outside affects his gas mileage. He recorded the
temperature and his gas mileage over the last few months. His data is shown below.

What can he conclude from his data?
A. The hotter the temperature, the better his gas mileage.
B. There is no relationship between the temperature and his gas mileage.
C. The cooler the temperature, the better his gas mileage.
D. The hotter the temperature, the worse his gas mileage.
Probability
90. Trevor has twenty books on his bookshelf. There are 6 science fiction, 2 biographies, 8
mystery, and 4 Earth science books.
Trevor performed an experiment in which he randomly picked one book, recorded its type, and
then picked another book. After repeating this experiment several times, he made a table to
display his results.
Trevor's Book Experiment
Book Type
Combinations
Number of
Times Picked
Book Type
Combinations
Number of
Times Picked
science fiction
and biography 6
mystery and
Earth science 4
science fiction
and mystery 2
science fiction
and science fiction 13
science fiction
and Earth science 12
biography
and biography 16
biography
and mystery 3
mystery
and mystery 14
biography and
Earth science 8
Earth science
and Earth science 17
If two books are picked from the bookshelf one at a time, without replacement, which of the
following book type combinations has the same theoretical and experimental probability?
A. Earth science and Earth science
B. biography and Earth science
C. science fiction and biography
D. mystery and mystery
Select & Interpret Graphs
91. Which type of graph would best represent the grades of 30 students on a math test, so that
each individual grade can be seen?
A. line plot
B. circle graph
C. line graph
D. box-and-whisker plot
Scatter Plots
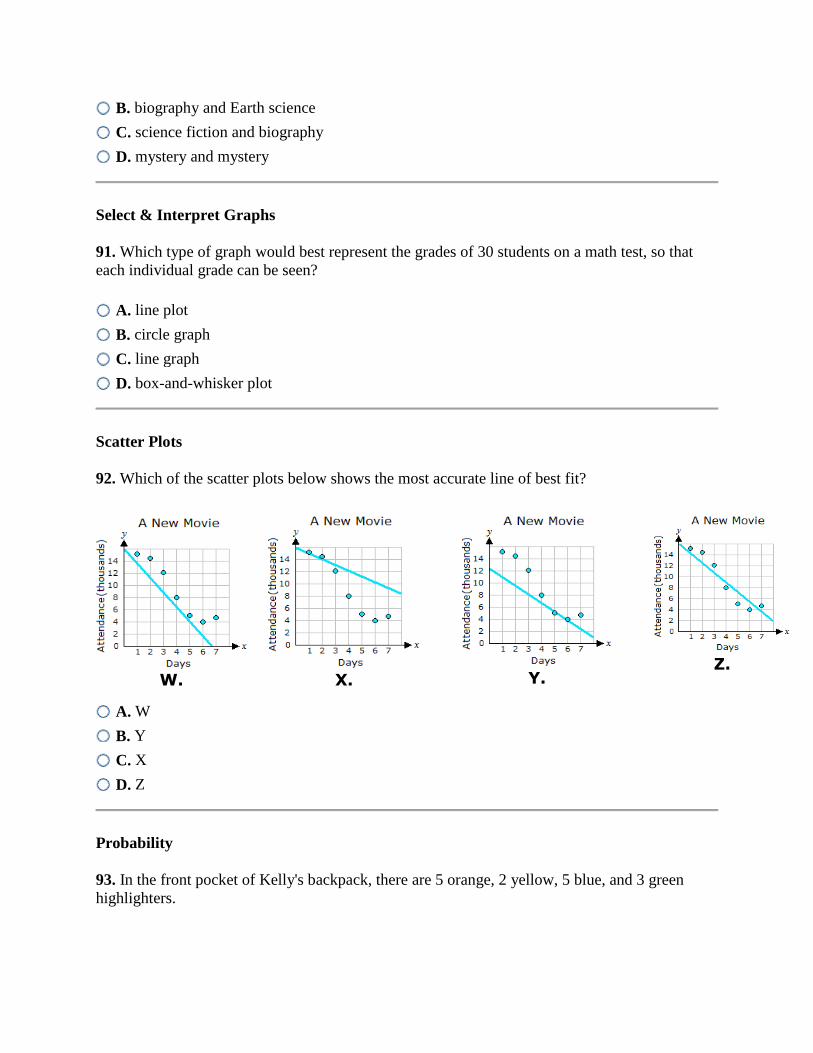
92. Which of the scatter plots below shows the most accurate line of best fit?
W.
X.
Y.
Z.
A. W
B. Y
C. X
D. Z
Probability
93. In the front pocket of Kelly's backpack, there are 5 orange, 2 yellow, 5 blue, and 3 green
highlighters.

If Kelly randomly selects a highlighter from her backpack pocket, what is the probability that it
will be blue?
A.
2
3
B.
1
3
C.
1
2
D.
1
15
Central Tendency
94. What is the mean of the following set of numbers?
6, 2, 4, 6, 12, 13, 8, 9
A. 7
B. 12
C. 7.5
D. 4
Probability
95. A class of 24 students is having a drawing. Each student's name is written on a piece of
paper, and then placed in a hat. One name is randomly drawn from the hat.
If there are 8 boys in the class, what is the approximate probability that the name drawn is a
girl's?
A.
B.

C.
D.
Central Tendency
96. What is the mean of the following set of numbers?
26, 18, 10, 14
A. 26
B. 10
C. 17
D. 16
Select & Interpret Graphs
97. Which graph type is best suited for displaying the total absences at a school each month?
A. line graph
B. box-and-whisker plot
C. bar graph
D. stem-and-leaf plot
Possible Outcomes
98. Cathy is making labels using five letters (of the 26 in the alphabet) for each label. No two
letters can be duplicated for any one label. What multiplication principle of counting is used to
determine how many possible labels can be made?
A. 26 × 25 × 24 × 23 × 22
B. 5 × 26 × 25 × 24 × 23 × 22
C. 26 × 5
D. 26 × 26 × 26 × 26 × 26
Scatter Plots

99. Which of the scatter plots below shows the most accurate line of best fit?
W.
X.
Y.
Z.
A. Z
B. Y
C. W
D. X
Probability
100. Colleen has an ice chest with 20 cans of soda in it. Four are cola, three are lemon-lime, and
the rest are grape. If she randomly pulls a can of soda out of the ice chest, what are the chances
that she gets a grape soda?
A. 20%
B. 65%
C. 40%
D. 60%
Answers
1. D
2. C
3. C
4. D
5. D
6. C
7. B
8. B

9. B
10. A
11. D
12. C
13. B
14. B
15. D
16. D
17. B
18. B
19. D
20. B
21. D
22. D
23. D
24. A
25. B
26. B
27. B
28. B
29. B
30. B
31. C
32. C
33. B
34. D
35. C
36. B
37. B
38. A
39. C
40. A
41. B
42. A
43. C
44. A
45. A
46. C
47. D
48. B
49. B
50. A
51. B
52. B
53. D
54. C

55. B
56. B
57. D
58. A
59. C
60. D
61. B
62. C
63. D
64. D
65. B
66. D
67. A
68. D
69. C
70. A
71. A
72. D
73. A
74. D
75. C
76. B
77. A
78. D
79. C
80. B
81. C
82. A
83. D
84. A
85. A
86. C
87. D
88. A
89. A
90. D
91. A
92. D
93. B
94. C
95. B
96. C
97. C
98. A
99. C
100. B