DATA ANALYSIS AND INTERPRETATION - …shodhganga.inflibnet.ac.in/bitstream/10603/6854/10/10...Study...
35
88 Chapter-IV DATA ANALYSIS AND INTERPRETATION After collecting data, the investigator analysed the data as it was difficult to explain the raw data because raw data gathered on certain tests have no meaning rather it is heap of certain facts or observation. Keeping in view the objectives of the study and their corresponding hypotheses, the data was statistically processed using appropriate design and technique. Hence, after the data has been collected this must be processed an analysed to draw proper inference. Statistics is a good tool in the hands of a research. It can help in attaining some objectives only if one is clear about the theoretical basis of the variables and their relationship so it is necessary to interpret the result obtained statistically. It is only then one can give meaning and direction to research. According to Good, Barr and Scates (1941), “The process of interpretation is essentially, one of stating what the results show? What they mean? What is their significance? What is the answer of the original problem? ” That is all the limitations of the data must enter into and become the part of interpretation of the result. Thus, the analysis of data means studying the tabulated material in order to determine inherent factors or meanings. It involves breaking down the existing complex factors into simpler parts and putting the parts together in new arrangement for the purpose of interpretation. As it is of much importance to get a sum correctly solved. It is also equally important to interpret it correctly. Interpretation is the most important step in the total research process. It calls for a critical examination of the results of one’s analysis in
Transcript of DATA ANALYSIS AND INTERPRETATION - …shodhganga.inflibnet.ac.in/bitstream/10603/6854/10/10...Study...

88
Chapter-IV
DATA ANALYSIS AND INTERPRETATION
After collecting data, the investigator analysed the data as it was difficult to
explain the raw data because raw data gathered on certain tests have no meaning
rather it is heap of certain facts or observation. Keeping in view the objectives of the
study and their corresponding hypotheses, the data was statistically processed using
appropriate design and technique. Hence, after the data has been collected this must
be processed an analysed to draw proper inference.
Statistics is a good tool in the hands of a research. It can help in attaining some
objectives only if one is clear about the theoretical basis of the variables and their
relationship so it is necessary to interpret the result obtained statistically. It is only
then one can give meaning and direction to research. According to Good, Barr and
Scates (1941), “The process of interpretation is essentially, one of stating what the
results show? What they mean? What is their significance? What is the answer of the
original problem? ” That is all the limitations of the data must enter into and become
the part of interpretation of the result.
Thus, the analysis of data means studying the tabulated material in order to
determine inherent factors or meanings. It involves breaking down the existing
complex factors into simpler parts and putting the parts together in new arrangement
for the purpose of interpretation.
As it is of much importance to get a sum correctly solved. It is also equally
important to interpret it correctly. Interpretation is the most important step in the total
research process. It calls for a critical examination of the results of one’s analysis in

89
the light of all limitations of data gathered. Thus analysis and interpretations of data
help researchers to attack the related problems with appropriate statistical techniques
to avoid the unnecessary labour. The data was analysed with the help of Mean, S.D.
Coefficient of Correlation and ‘t’ test as to find out the significance of difference
between the means of various groups taken at a time and also to find correlation
between variables.
SECTION A
4.1 THIS SECTION DEALS WITH RELATIONSHIP OF ACADEMIC
ACHIEVEMENT WITH STUDY HABITS, HOME ENVIRONMENT
AND SCHOOL ENVIRONMENT DIMENSIONS
4.2 Relationship Between Academic Achievement and Study Habits
Table 4.1
Relationship between academic achievement and study habits of scheduled caste
secondary school students.
Variable Coefficient of correlation Level of significance
Study Habits .068 NS
N=600
The Table 4.1 reveals that coefficient of correlation between academic
achievement and study habits of scheduled caste secondary school students is .068
which is positive and not significant even at 0.05 level of significance so the null
hypothesis “There is no significant relationship between study habits and academic
achievement of scheduled caste secondary school students” is retained. Thus it can be
interpreted that there is no significant relationship between academic achievement and
study habits of scheduled caste secondary school students. It can be concluded that
study habit is not one of the reasons which influence academic achievement of
scheduled caste secondary school students.
90
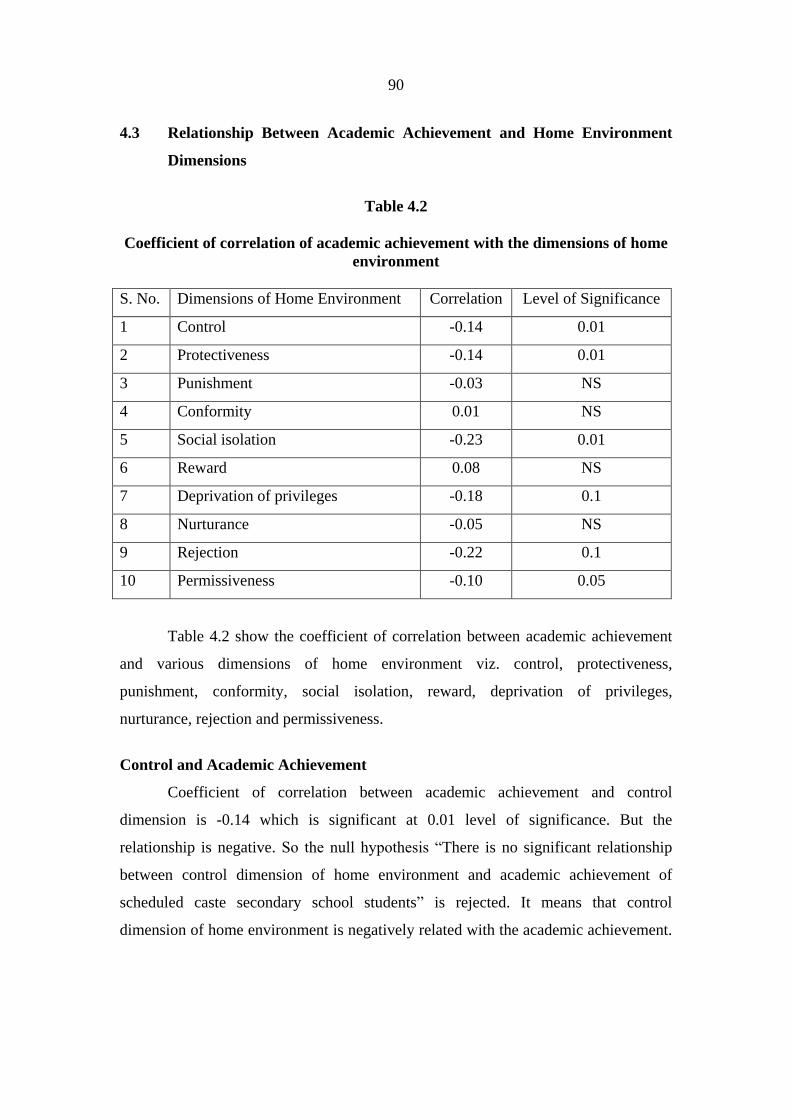
4.3 Relationship Between Academic Achievement and Home Environment
Dimensions
Table 4.2
Coefficient of correlation of academic achievement with the dimensions of home
environment
S. No. Dimensions of Home Environment Correlation Level of Significance
1 Control -0.14 0.01
2 Protectiveness -0.14 0.01
3 Punishment -0.03 NS
4 Conformity 0.01 NS
5 Social isolation -0.23 0.01
6 Reward 0.08 NS
7 Deprivation of privileges -0.18 0.1
8 Nurturance -0.05 NS
9 Rejection -0.22 0.1
10 Permissiveness -0.10 0.05
Table 4.2 show the coefficient of correlation between academic achievement
and various dimensions of home environment viz. control, protectiveness,
punishment, conformity, social isolation, reward, deprivation of privileges,
nurturance, rejection and permissiveness.
Control and Academic Achievement
Coefficient of correlation between academic achievement and control
dimension is -0.14 which is significant at 0.01 level of significance. But the
relationship is negative. So the null hypothesis “There is no significant relationship
between control dimension of home environment and academic achievement of
scheduled caste secondary school students” is rejected. It means that control
dimension of home environment is negatively related with the academic achievement.

91
It is concluded that higher the control of parents, lower is the academic achievement
of students.
Protectiveness and Academic Achievement
The results shown in Table 4.2 show that correlation between academic
achievement and protectiveness dimension of home environment is -0.14 which is
negatively significant at 0.01 level of significance. So the null hypothesis “There is no
significant relationship between protectiveness dimension of home environment and
academic achievement of scheduled caste secondary school students” is rejected. The
relationship between protectiveness and academic achievement is significant but
negative. It means that higher the protectiveness nature of parents, lower is the
academic achievement of students.
Punishment and Academic Achievement
The Table 4.2 reveals that coefficient of correlation between academic
achievement and punishment dimension of home environment is -0.03 which is
negative and not significant even at 0.05 level of significance. So the null hypothesis
“There is no significant relationship between punishment dimension of home
environment and academic achievement of scheduled caste secondary school
students” is retained. It means that punishment is negatively related to academic
achievement of scheduled caste secondary school students. But this relation is not
significant.
Conformity and Academic Achievement
The results of Table 4.2 show that correlation between conformity and
academic achievement is 0.01 which is positive and not significant even at 0.05 level
of significance. So the null hypothesis, “There is no significant relationship between
conformity dimension of home environment and academic achievement of scheduled
caste secondary school students” is not rejected. It can be concluded that demands to
work according to parents’ desires and acceptations have not significant relationship
with academic achievement of students.
Social Isolation and Academic Achievement
The Table 4.2 shows that correlation between social isolation and academic
achievement is -0.23 which is negative but significant at 0.1 level of significance. So

92
the null hypothesis, “There is no significant relationship between social isolation
dimension of home environment and academic achievement of scheduled caste
secondary school students” is rejected. It means that social isolation and academic
achievement of scheduled caste secondary school students are negatively correlated in
a significant way. It can be interpreted that higher the Social isolation, lower the
academic achievement.
Reward and Academic Achievement
The results of Table 4.2 show that correlation between reward and academic
achievement is 0.08 which is positive and not significant even at 0.05 level of
significance. So the null hypothesis, “There is no significant relationship between
reward dimension of home environment and academic achievement of scheduled
caste secondary school students” is retained. It can be interpreted that the reward has
not association with academic achievement. Instead of reward sometimes another
factors like self motivation, inspiration and self-guidance may influence academic
achievement.
Deprivation of Privileges and Academic Achievement
From the Table 4.2 it is observed that correlation between deprivation of
privileges and academic achievement is -0.18 which is significant at 0.01 level of
significance, but the relationship is negative. So the null hypothesis “There is no
significant relationship between deprivation of privileges dimension of home
environment and academic achievement of scheduled caste secondary school
students” is rejected. It indicates that deprivation of privileges by parents used as
some sort of punishment has negative significant relationship with academic
achievement. It implies that higher the deprivation of privileges, lesser is the
academic achievement.
Nurturance and Academic Achievement
Table 4.2 shows that coefficient of correlation between nurturance and
academic achievement is -0.05 which is negative and not significant even at 0.05 level
of significance. Hence, the null hypothesis, “There is no significant relationship
between nurturance dimension of home environment and academic achievement of

93
scheduled caste secondary school students” is retained. It can be interpreted that
nurturance has not significant relationship with academic achievement.
Rejection and Academic Achievement
Table 4.2 shows that correlation between rejection and Academic achievement
is -0.22 which is negative and significant at 0.01 level of significance. So null
hypothesis, “There is no significant relationship between rejection dimension of home
environment and academic achievement of scheduled caste secondary school
students” is rejected. It means that rejection behaviour in home environment is
negative related with academic achievement in a significant manner.
Permissiveness and Academic Achievement
Table 4.2 shows that correlation between permissiveness and Academic
achievement is -0.10 which is negative and significant at 0.05 level of significance.
So null hypothesis, “There is no significant relationship between permissiveness
dimension of home environment and academic achievement of scheduled caste
secondary school students” is rejected. It means that permissiveness in nature of
parents is negatively related with the academic achievement of students. It implies
that higher the permissiveness nature of parents, lesser is the academic achievement
4.4 Relationship between Academic Achievement and School Environment
Table 4.3
Correlation of dimensions of school environment with academic achievement
Dimensions Value of ‘r’ Level of significance
Creative Stimulation 0.04 NS
Cognitive Encouragement -0.08 NS
Acceptance 0.03 NS
Rejection -0.10 0.5
Control -0.07 NS
Permissiveness -0.02 NS
N=600

94
Creative Stimulation and Academic Achievement
The results in Table 4.3 show that correlation between creative stimulation and
academic achievement is 0.04 which is positive and not significant even at 0.05 level
of significance. So the null hypothesis, “There is no significant relationship between
creative stimulation dimension of school environment and academic achievement of
scheduled caste secondary school students” is not rejected. It means that creative
stimulation is positively related with academic achievement of students but it is not
significant. Only conditions and opportunity provided by teacher cannot affect
academic achievement. But right guidance corresponding for covering syllabus and
attaining good marks can move to the better results.
Cognitive Encouragement and Academic Achievement
The Table 4.3 shows that coefficient of correlation between cognitive
encouragement and academic achievement is -0.08 which is negative and not
significant even at 0.05 level of significance. So the null hypothesis “There is no
significant relationship between cognitive encouragement dimension of school
environment and academic achievement of scheduled caste secondary school
students” is retained. It means that creative stimulation is negatively related with
academic achievement of students but it is not significant. It implies that teacher’s
behavior of stimulating cognitive development of students by encouraging his actions
or behaviours, is not significantly related with academic achievement.
Acceptance and Academic Achievement
The Table 4.3 reveals that correlation between acceptance and academic
achievement is 0.03 which is not significant even at 0.05 level of significance. So the
null hypothesis “There is no significant relationship between acceptance dimension of
school environment and academic achievement of scheduled caste secondary school
students” is not rejected. It means that acceptance behaviour of teacher doesn’t always
affect the academic achievement of students. These two variables have indifferent or
negligible relationship.

95
Rejection and Academic Achievement
The results presented in Table 4.3 point out that correlation between rejection
and academic achievement is -0.10 which is negative and significant at 0.05 level of
significance. So the null hypothesis “There is no significant relationship between
rejection dimension of school environment and academic achievement of scheduled
caste secondary school students” is rejected. It means that rejection is negatively
related with academic achievement of scheduled caste students. It implies that higher
the rejection in behavior of teachers, lesser is the academic achievement of students.
Control and Academic Achievement
The results presented in Table 4.3 reveal that correlation between control and
academic achievement is -0.07 which is negative and not significant even at 0.05 level
of significance. So the null hypothesis, “There is no significant relationship between
control dimension of school environment and academic achievement of scheduled
caste secondary school students” is retained. It means that control is negatively related
with academic achievement of scheduled caste students but it is not significantly
related. Further it may be concluded that teacher’s autocratic or democratic behaviour
does not affect significantly performance of students.
Permissiveness and Academic Achievement
The Table 4.3 reveals that correlation between permissiveness and academic
achievement is -0.02 which is negative and not significant even at 0.05 level of
significance. So the null hypothesis, “There is no significant relationship between
permissiveness dimension of school environment and academic achievement of
scheduled caste secondary school students” is not rejected. Hence it can be interpreted
that permissiveness environment of school is not significantly related with academic
achievement.

96
4.5 Relationship between Academic Achievement and Study Habits of
Scheduled Caste Secondary School Boys
Table 4.4
Coefficient of correlation between academic achievement and study habits of
scheduled caste secondary school boys
Variable Coefficient of
Correlation
Level of significance
Study Habits 0.11 0.05
N=350
The Table 4.4 reveals that coefficient of correlation between study habits and
academic achievement of scheduled caste secondary school boys is 0.11 which is
significant at 0.05 level of significance. So the null hypothesis, “There is no
significant relationship between study habits and academic achievement of scheduled
caste secondary school boys” is rejected. It can be interpreted that academic
achievement has dependence on study habits. So it can be concluded that Study habits
have significant affect on academic achievement of scheduled caste boys. It implies
that higher the study habits, higher the academic achievement.
4.6 Relationship Between Academic Achievement and Study Habits of
Scheduled Caste Secondary School Girls
Table 4.5
Coefficient of correlation between academic achievement and study habits of
scheduled caste secondary school girls
Variable Coefficient of Correlation Level of significance
Study Habits 0.01 NS
N= 250
The Table 4.5 reveals that coefficient of correlation between study habits and
academic achievement of scheduled caste secondary school girls is 0.01 which is not

97
significant even at .05 level of significance. So the null hypothesis, “There is no
significant relationship between study habits and academic achievement of scheduled
caste secondary school girls” is retained. Hence it can be interpreted that academic
achievement has no dependence on study habits. So it can be concluded that study
habits is not only one factor which affect academic achievement of scheduled caste
girls there are other factors like environment, motivation and guidance which can be
resulted in good academic achievement.
4.7 Relationship between Academic Achievement and Home Environment of
Scheduled Caste Boys
Table 4.6
Coefficient of correlation between dimensions of home environment and
academic achievement of scheduled caste boys
S. No. Dimensions of home
Environment
Correlation Level of
Significance
1 Control -0.12 0.05
2 Protectiveness -0.12 0.05
3 Punishment 0.01 NS
4 Conformity 0.04 NS
5 Social Isolation -0.23 0.01
6 Reward 0.88 0.01
7 Deprivation Of Privileges -0.19 0.01
8 Nurturance -0.01 NS
9 Rejection -0.20 0.01
10 Permissiveness -0.08 NS
N=350
Control and Academic Achievement
It is revealed from Table 4.6 that coefficient of correlation between control
dimension of home environment and academic achievement of scheduled caste
secondary school boys is -0.12 which is negative and significant at 0.05 level of

98
significance. Hence the null hypothesis, “There is no significant relationship between
control dimension of home environment and academic achievement of scheduled
caste secondary school boys” is rejected. It implies that control imposed by parents is
significantly related with academic achievement and it is negative also. It means that
higher the control, lesser is the academic achievement.
Protectiveness and Academic Achievement
The Table 4.6 reveals that coefficient of correlation between protectiveness
dimension of home environment and academic achievement of scheduled caste
secondary school boys is -0.12 which is negative and significant at 0.05 level of
significance. So the null hypothesis “There is no significant relationship between
protectiveness dimension of home environment and academic achievement of
scheduled caste secondary school boys” is rejected. It implies that protectiveness
provided by parents affect academic achievement significantly and it is related
negatively also. It means that too much protectiveness nature of parents can also lead
to lower academic achievement.
Punishment and Academic Achievement
The Table 4.6 points out that coefficient of correlation between punishment
dimension of home environment and academic achievement of scheduled caste
secondary school boys is 0.01 which is positive and not significant even at 0.05 level
of significance. So the null hypothesis “There is no significant relationship between
punishment dimension of home environment and academic achievement of scheduled
caste secondary school boys” is retained. It can be interpreted that punishment nature
of parents and academic achievement are not significantly related. In others words,
punishment is not only reason for affecting academic achievement of boys.
Conformity and Academic Achievement
The Table 4.6 reveals that coefficient of correlation between conformity
dimension of home environment and academic achievement of scheduled caste
secondary school boys is 0.04 which is not significant even at 0.05 level of
significance. So the null hypothesis “There is no significant relationship between
conformity dimension of home environment and academic achievement of scheduled

99
caste secondary school boys” is retained. It can be interpreted that conformity nature
of parents and academic achievement are not significantly related.
Social Isolation and Academic Achievement
The results presented in Table 4.6 reveal that coefficient of correlation
between social isolation dimension of home environment and academic achievement
of scheduled caste secondary school boys is -0.23 which is negative and significant at
0.01 level of significance. So the null hypothesis “There is no significant relationship
between social isolation dimension of home environment and academic achievement
of scheduled caste secondary school boys” is rejected. It means that social isolation
and academic achievement are negatively related in a significant way. It further
implies that higher the social isolation as a form of punishment given by parents,
lower will be the academic achievement.
Reward and Academic Achievement
The Table 4.6 reveals that coefficient of correlation between reward
dimension of home environment and academic achievement of scheduled caste
secondary school boys is 0.88 which is significant at 0.01 level of significance. So the
null hypothesis “There is no significant relationship between reward dimension of
home environment and academic achievement of scheduled caste secondary school
boys” is rejected. It means that reward and academic achievement are related
positively in a significant way. It can be concluded that reward may be taken as
positive stimulation in increasing academic achievement.
Deprivation of Privileges and Academic Achievement
The result presented in Table 4.6 show that coefficient of correlation between
deprivation of privileges dimension of home environment and academic achievement
of scheduled caste secondary school boys is -0.19 which is negative and significant at
0.01 level of significance. So the null hypothesis “There is no significant relationship
between deprivation of privileges dimension of home environment and academic
achievement of scheduled caste secondary school boys” is rejected. It indicates that
deprivation of privileges by parents used as a form of punishment is negatively related

100
with academic achievement and it is significant also. It implies that higher the
deprivation, lesser is the academic achievement.
Nurturance and Academic Achievement
The results presented in Table 4.6 reveal that coefficient of correlation
between nurturance dimension of home environment and academic achievement of
scheduled caste secondary school boys is -0.01 which is negative and not significant
even at 0.05 level of significance. So the null hypothesis “There is no significant
relationship between nurturance dimension of home environment and academic
achievement of scheduled caste secondary school boys” is not rejected. It means that
nurturance by parents is negatively related with academic achievement and this
relationship is not significant.
Rejection and Academic Achievement
The results presented in Table 4.6 that coefficient of correlation between
rejection dimension of home environment and academic achievement of scheduled
caste secondary school boys is -0.20 which is negative and significant at 0.01 level of
significance. So the null hypothesis, “There is no significant relationship between
rejection dimension of home environment and academic achievement of scheduled
caste secondary school boys” is rejected. It can be concluded that rejection by parents
is negatively related with academic achievement, that is higher is the rejection by
parents, lesser is the academic achievement.
Permissiveness and Academic Achievement
The analysis of results of Table 4.6 show that coefficient of correlation
between permissiveness dimension of home environment and academic achievement
of scheduled caste secondary school boys is -0.08 which is negative and not
significant even at 0.05 level of significance. So the null hypothesis, “There is no
significant relationship between permissiveness dimension of home environment and
academic achievement of scheduled caste secondary school boys” is not rejected. It
can be concluded that permissiveness in behaviour by parents is negatively but not
significantly related with academic achievement.

101
4.8 Relationship between Academic Achievement and Home Environment of
Scheduled Caste Girls
Table 4.7
Coefficient of correlation between dimensions of home environment and
academic achievement of scheduled caste secondary school girls
S. No. Dimensions of Home
Environment
Correlation Level of
Significance
1 Control -0.16 0.05
2 Protectiveness -0.17 0.05
3 Punishment -0.07 NS
4 Conformity -0.16 0.05
5 Social Isolation -0.22 0.01
6 Reward 0.72 0.01
7 Deprivation of Privileges -0.15 0.05
8 Nurturance -0.10 NS
9 Rejection -0.24 0.01
10 Permissiveness -0.14 0.05
N = 250
Control and Academic Achievement
It is revealed from the Table 4.7 that coefficient of correlation between control
dimension of home environment and academic achievement of scheduled caste
secondary school girls is -0.16 which is negative and significant at 0.05 level of
significance. So the null hypothesis, “There is no significant relationship between
control dimension of home environment and academic achievement of scheduled
caste secondary school girls” is rejected. It implies that control imposed by parents is
significantly related with academic achievement and it is negative also. It means that
higher the control, lesser is the academic achievement.

102
Protectiveness and Academic Achievement
The Table 4.7 reveals that coefficient of correlation between protectiveness
dimension of home environment and academic achievement of scheduled caste
secondary school girls is -0.17 which is negative and significant at 0.05 level of
significance. So the null hypothesis, “There is no significant relationship between
protectiveness dimension of home environment and academic achievement of
scheduled caste secondary school girls” is rejected. Therefore the protectiveness is
significantly related with Academic achievement. The relationship is inverse. It can
be concluded that higher the protectiveness, lesser is the academic achievement.
Punishment and Academic Achievement
The Table 4.7 reveals that coefficient of correlation between punishment
dimension of home environment and academic achievement of scheduled caste
secondary school girls is -0.07 which is negative and not significant even at 0.05 level
of significance. So the null hypothesis, “There is no significant relationship between
punishment dimension of home environment and academic achievement of scheduled
caste secondary school girls” is retained. It can be interpreted that punishment nature
of parents and academic achievement are not significantly related. In others words
punishment dimension is not only reason for affecting academic achievement of girls.
Conformity and Academic Achievement
The Table 4.7 reveals that coefficient of correlation between conformity
dimension of home environment and academic achievement of scheduled caste
secondary school girls is -0.16 which is negative and significant at 0.05 level of
significance. So the null hypothesis, “There is no significant relationship between
conformity dimension of home environment and academic achievement of scheduled
caste secondary school girls” is rejected. It can be interpreted that less conformity in
behaviour of parents play significant role in enhancing academic performance.

103
Social Isolation and Academic Achievement
The results presented in Table 4.7 that coefficient of correlation between
social isolation dimension of home environment and academic achievement of
scheduled caste secondary school girls is -0.22 which is negative and significant at
0.01 level of significance. So the null hypothesis “There is no significant relationship
between social isolation dimension of home environment and academic achievement
of scheduled caste secondary school girls” is rejected. It means that social isolation
and academic achievement are negatively related in a significant way. It further
implies that higher the social isolation as a form of punishment given by parents,
lower will be the academic achievement.
Reward and Academic Achievement
The results presented in Table 4.7 show that coefficient of correlation between
reward dimension of home environment and academic achievement of scheduled
caste secondary school girls is 0.72 which is significant at 0.01 level of significance.
So the null hypothesis, “There is no significant relationship between reward
dimension of home environment and academic achievement of scheduled caste
secondary school girls” is rejected. It means that reward and academic achievement
are related in a significant way. It can be concluded that reward may be taken as
positive stimulation in increasing academic achievement. This relationship between
these two variables is high.
Deprivation of Privileges and Academic Achievement
The results presented in Table 4.7 show that coefficient of correlation between
deprivation dimension of home environment and academic achievement of scheduled
caste secondary school girls is -0.15 which is negative and significant at 0.05 level of
significance. So the null hypothesis “There is no significant relationship between
deprivation of privileges dimension of home environment and academic achievement
of scheduled caste secondary school girls” is rejected. It indicates that deprivation of
privileges by parents used as a form of punishment is negatively related with
academic achievement and is significant also. It implies that higher the deprivation,
lesser is the academic achievement.
104
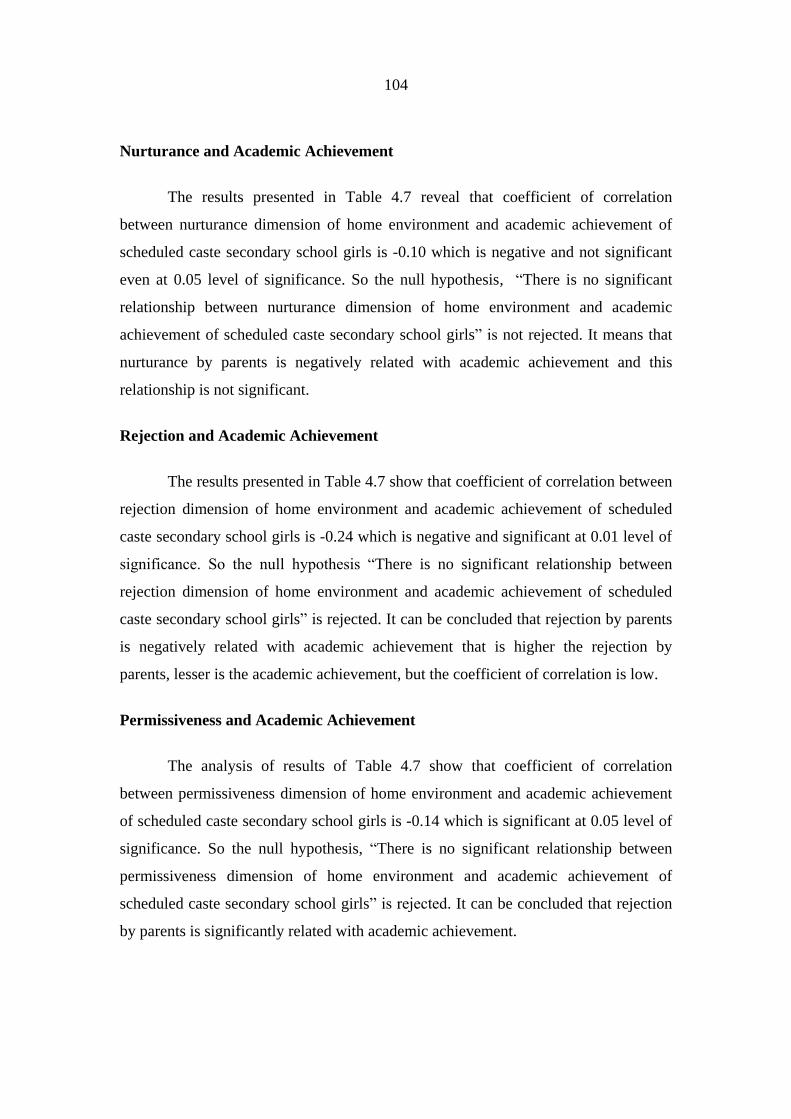
Nurturance and Academic Achievement
The results presented in Table 4.7 reveal that coefficient of correlation
between nurturance dimension of home environment and academic achievement of
scheduled caste secondary school girls is -0.10 which is negative and not significant
even at 0.05 level of significance. So the null hypothesis, “There is no significant
relationship between nurturance dimension of home environment and academic
achievement of scheduled caste secondary school girls” is not rejected. It means that
nurturance by parents is negatively related with academic achievement and this
relationship is not significant.
Rejection and Academic Achievement
The results presented in Table 4.7 show that coefficient of correlation between
rejection dimension of home environment and academic achievement of scheduled
caste secondary school girls is -0.24 which is negative and significant at 0.01 level of
significance. So the null hypothesis “There is no significant relationship between
rejection dimension of home environment and academic achievement of scheduled
caste secondary school girls” is rejected. It can be concluded that rejection by parents
is negatively related with academic achievement that is higher the rejection by
parents, lesser is the academic achievement, but the coefficient of correlation is low.
Permissiveness and Academic Achievement
The analysis of results of Table 4.7 show that coefficient of correlation
between permissiveness dimension of home environment and academic achievement
of scheduled caste secondary school girls is -0.14 which is significant at 0.05 level of
significance. So the null hypothesis, “There is no significant relationship between
permissiveness dimension of home environment and academic achievement of
scheduled caste secondary school girls” is rejected. It can be concluded that rejection
by parents is significantly related with academic achievement.

105
4.9 Relationship between Academic Achievement and School Environment of
Scheduled Caste Boys
Table 4.8
Coefficient of correlation between dimensions of School Environment and
academic achievement of scheduled caste secondary school boys
Dimensions of School
Environment
Correlation Level of significance
Creative Stimulation 0.64 0.01
Cognitive Encouragement 0.01 NS
Acceptance 0.05 NS
Rejection -0.10 NS
Control -0.09 NS
Permissiveness 0.01 NS
Creative Stimulation and Academic Achievement
The results in Table 4.8 show that correlation between creative stimulation and
academic achievement of scheduled caste boys is 0.64 which is significant at 0.01
level of significance. Hence the null hypothesis “There is no significant relationship
between creative stimulation dimension of school environment and academic
achievement of scheduled caste secondary school boys” is rejected. It indicates that
creative stimulation is positively related with academic achievement and it is
significant also. The coefficient of correlation is substantial or marked relationship.
Cognitive Encouragement and Academic Achievement
The results in Table 4.8 show that correlation between cognitive
encouragement and academic achievement of scheduled caste boys is 0.01 which not
significant even at 0.05 level of significance. So the null hypothesis “There is no
significant relationship between cognitive encouragement dimension of school
environment and academic achievement of scheduled caste secondary school boys” is
retained. Hence it can be interpreted that only cognitive encouragement is not one

106
factor that affect academic achievement but there are various other factors like
intelligence, I.Q. which may bring change in academic achievement.
Acceptance and Academic Achievement
The results presented in Table 4.8 show that correlation between acceptance
and academic achievement is 0.05 which is not significant even at 0.05 level of
significance. So the null hypothesis, “There is no significant relationship between
acceptance dimension of school environment and academic achievement of scheduled
caste secondary school boys” is retained. Therefore it can be concluded that
acceptance is not significantly related with academic achievement of scheduled caste
boys.
Rejection and Academic Achievement
The results presented in Table 4.8 point out that correlation between rejection
and academic achievement is -0.10 which is negative and not significant. So the null
hypothesis “There is no significant relationship between rejection dimension of school
environment and academic achievement of scheduled caste secondary school boys” is
not rejected. Therefore it can be concluded that rejection is negatively related with
academic achievement of scheduled caste boys. But this relation is not significant.
Control and Academic Achievement
The results presented in Table 4.8 reveal that correlation between control and
academic achievement is -0.09 which is negative and not significant. So the null
hypothesis “There is no significant relationship between control dimension of school
environment and academic achievement of scheduled caste secondary school boys” is
not rejected. It can be concluded that controlled behaviour of teachers has a reverse
effect on academic achievement of students. But this effect is not significantly related
with academic achievement.
Permissiveness and Academic Achievement
The results shown in Table 4.8 reveal that correlation between permissiveness
and academic achievement is 0.01 which is not significant. So the null hypothesis
“There is no significant relationship between permissiveness dimension of school
107
environment and academic achievement of scheduled caste secondary school boys” is
not rejected. It can be concluded that permissiveness behaviour of teachers has a
positive effect on academic achievement but this relationship is not significant.
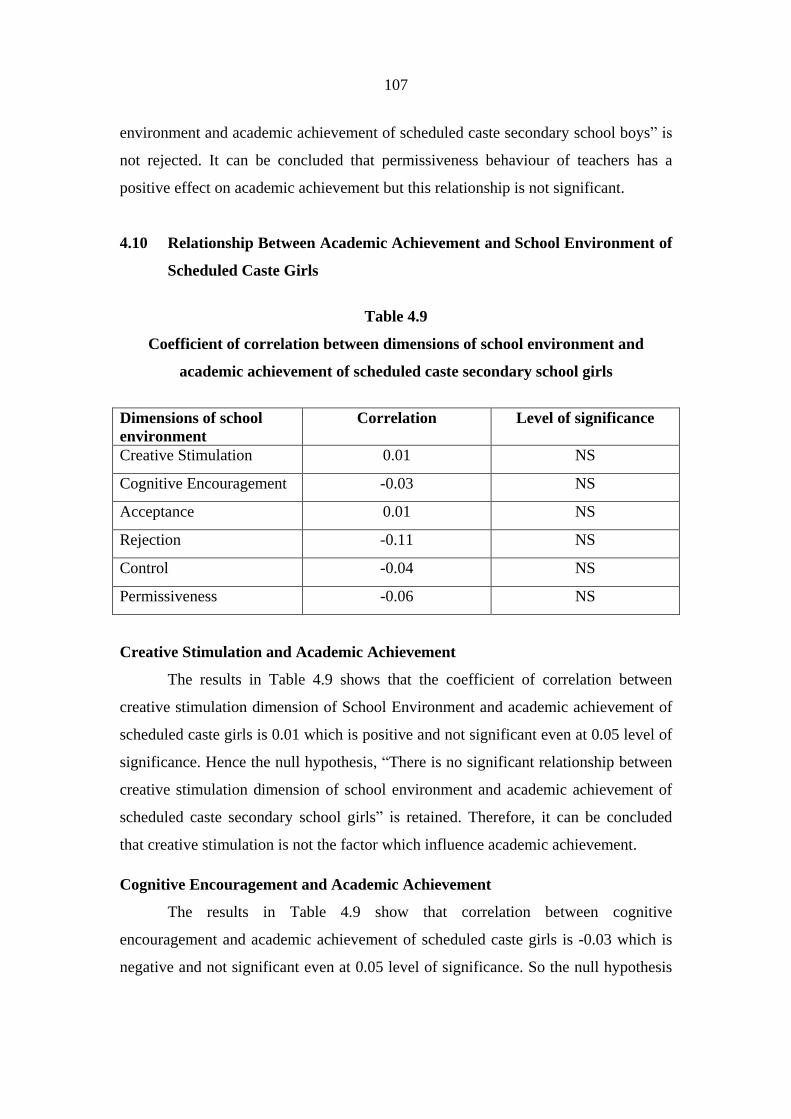
4.10 Relationship Between Academic Achievement and School Environment of
Scheduled Caste Girls
Table 4.9
Coefficient of correlation between dimensions of school environment and
academic achievement of scheduled caste secondary school girls
Dimensions of school
environment
Correlation Level of significance
Creative Stimulation 0.01 NS
Cognitive Encouragement -0.03 NS
Acceptance 0.01 NS
Rejection -0.11 NS
Control -0.04 NS
Permissiveness -0.06 NS
Creative Stimulation and Academic Achievement
The results in Table 4.9 shows that the coefficient of correlation between
creative stimulation dimension of School Environment and academic achievement of
scheduled caste girls is 0.01 which is positive and not significant even at 0.05 level of
significance. Hence the null hypothesis, “There is no significant relationship between
creative stimulation dimension of school environment and academic achievement of
scheduled caste secondary school girls” is retained. Therefore, it can be concluded
that creative stimulation is not the factor which influence academic achievement.
Cognitive Encouragement and Academic Achievement
The results in Table 4.9 show that correlation between cognitive
encouragement and academic achievement of scheduled caste girls is -0.03 which is
negative and not significant even at 0.05 level of significance. So the null hypothesis

108
“There is no significant relationship between cognitive encouragement dimension of
school environment and academic achievement of scheduled caste secondary school
girls” is retained. Therefore, it can be interpreted that only cognitive encouragement is
not one factor in affecting academic achievement but there are various other factors
like intelligence, knowledge, which may bring change in academic achievement.
Acceptance and Academic Achievement
The results of the Table 4.9 reveal that correlation between acceptance
dimension of school environment and academic achievement is 0.01 which is not
significant even at 0.05 level of significance. So the null hypothesis, “There is no
significant relationship between acceptance dimension of school environment and
academic achievement of scheduled caste secondary school girls” is retained.
Therefore it can be concluded that acceptance is not significantly related with
academic achievement of scheduled caste secondary school girls. The relationship is
negligible.
Rejection and Academic Achievement
The Table 4.9 shows that correlation between rejection dimension of School
environment and academic achievement of scheduled caste girls is -0.11 which is
negative and not significant. So the null hypothesis, “There is no significant
relationship between rejection dimension of school environment and academic
achievement of scheduled caste secondary school girls” is not rejected. Therefore it
can be concluded that rejection is negatively related with academic achievement of
scheduled caste girls and this relation is not significant.
Control and Academic Achievement
The results presented in Table 4.9 show that correlation between control
dimension of school environment and academic achievement is -0.04 which is
negative and not significant. So the null hypothesis, “There is no significant
relationship between control dimension of school environment and academic
achievement of scheduled caste secondary school girls” is not rejected. It can be
109
concluded that controlled features of teachers has a negative effect on academic
achievement of students but the relationship is not significant.
Permissiveness and Academic Achievement
The results shown in the Table 4.9 reveal that correlation between
permissiveness and academic achievement is -0.06 which is negative and not
significant. So the null hypothesis, “There is no significant relationship between
permissiveness dimension of school environment and academic achievement of
scheduled caste secondary school girls” is not rejected. It can be concluded that
permissiveness in behaviour of teachers has a negative effect on academic
achievement of girls and this effect is not significant.
SECTION : B
THIS SECTION DEALS WITH SIGNIFICANT DIFFERENCE IN MEAN OF
STUDY HABITS, HOME ENVIRONMENT AND SCHOOL ENVIRONMENT
DIMENSIONS OF SCHEDULED CASTE STUDENTS OF LOW AND HIGH
ACADEMIC ACHIEVEMENT.
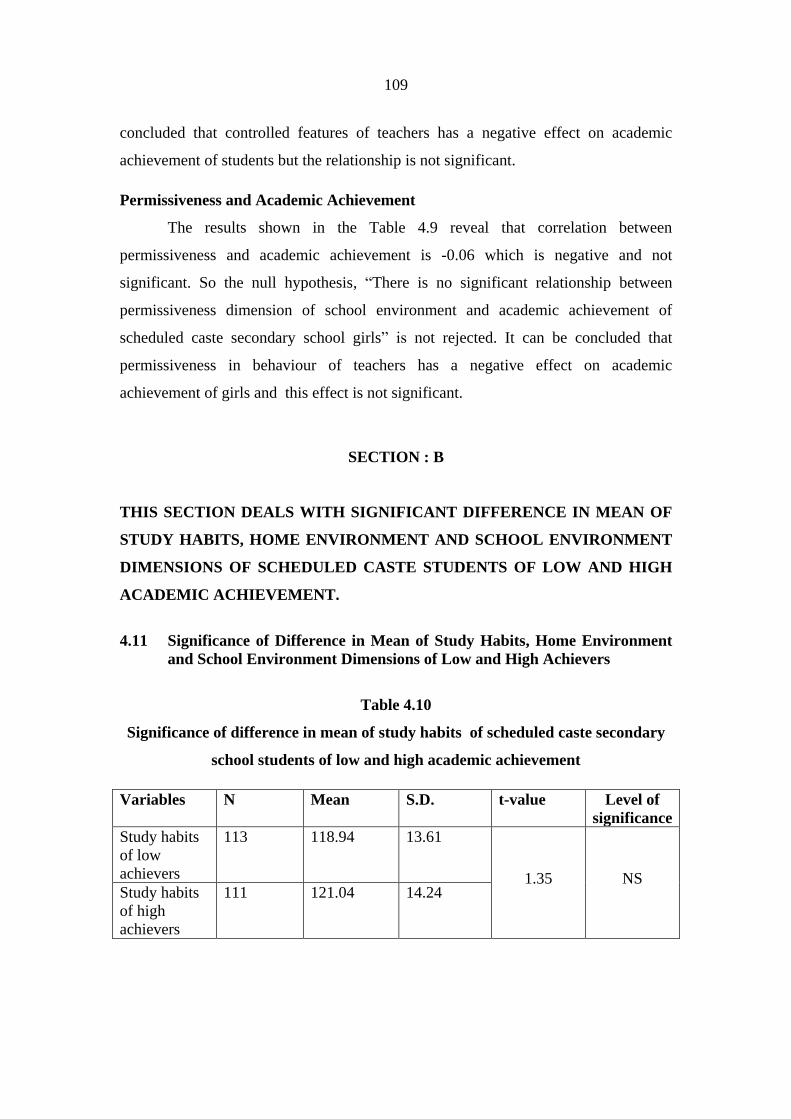
4.11 Significance of Difference in Mean of Study Habits, Home Environment
and School Environment Dimensions of Low and High Achievers
Table 4.10
Significance of difference in mean of study habits of scheduled caste secondary
school students of low and high academic achievement
Variables N Mean S.D. t-value Level of
significance
Study habits
of low
achievers
113 118.94 13.61
1.35 NS Study habits
of high
achievers
111 121.04 14.24

110
Table 4.10 shows that the ‘t’ value is 1.35 which is not significant even at 0.05
level of significance. So the null hypothesis. “There is no significant difference in
mean of study habits of scheduled castes secondary school students of low and high
academic achievement” is retained. This calculated difference is not real but it may be
due to chance factor. Thus it can be interpreted that there is no significant difference
in study habits of low and high academic achievement of scheduled caste secondary
school students.
Table 4.11
Significance of difference in mean of home environment dimensions of scheduled
caste students of low and high academic achievement
Dimensions of
Home
Environment
Academic
Achievement
Mean
S.D. t-value Level of
significance
Control Low
High
24.43
22.49
5.56
6.34 2.43 0.5
Protectiveness Low
High
28.27
25.97
4.73
5.18 3.46 0.01
Punishment Low
High
27.43
27.65
4.41
5.92 0.31 NS
Conformity Low
High
28.04
28.98
5.89
5.57 1.22 NS
Social
Isolation
Low
High
23.55
18.65
7.70
6.43 5.18 0.01
Reward Low
High
26.68
27.91
7.06
6.59 1.34 NS
Deprivation of
privileges
Low
High
23.17
19.52
8.10
7.03 3.59 0.01
Nurturance Low
High
24.17
24.01
5.33
5.35 0.22 NS
Rejection Low
High
20.56
16.40
7.28
7.17 4.29 0.01
Permissiveness Low
High
24.19
22.83
5.59
6.39 1.69 NS
N = Low achievers :-113
High achievers :-111

111
Control and Academic Achievement
The Table 4.11 reveals that the t-value of control dimension of home
environment of low and high academic achievement of scheduled caste secondary
school students is 2.43 which is significant at 0.5 level of significance. So the null
hypothesis, “There is no significant difference in mean of control dimension of home
environment of scheduled caste secondary school students of low and high academic
achievement” is rejected and this difference is real. The mean value of control
dimension of low achievers is more than the mean value of control dimension of high
achievers. It can be interpreted that low achievers are having more control by parents
than high achievers. This may be uneducated behaviour of parents. It can be
concluded that significant control may cause the low achievement.
Protectiveness and Academic Achievement
The Table 4.11 reveals that the t-value is 3.46 which is significant at 0.01 level
of significance. Thus null hypothesis, “There is no significant difference in mean of
protectiveness dimension of home environment of scheduled caste secondary school
students of low and high academic achievement” is rejected. Further the mean of
protectiveness dimension of low achiever is higher than the mean of protectiveness
dimension of high achievers. It can be concluded that students related to low
academic achievement were given more protective environment at home than student
of high academic achievement. Therefore, the significant protective behaviour of
home environment may cause low academic achievement.
Punishment and Academic Achievement
The Table 4.11 reveals that the t-value 0.31 which is not significant even at
0.05 level of significance. Therefore, the null hypothesis, “There is no significant
difference in mean of punishment dimension of home environment of scheduled caste
secondary school students of low and high academic achievement” is retained. This
difference may be due to chance factor.

112
Conformity and Academic Achievement
The results presented in Table 4.11 reveals that the t-value is 1.22 which is not
significant even at 0.5 level of significance. Hence the null hypothesis, “There is no
significant difference in mean of conformity dimension of home environment of
scheduled caste secondary school students of low and high academic achievement.” is
retained. It means that conformity is not significantly related with academic
achievement and it can be interpreted that some times parents directions, commands
and order does not affect significantly the performance of child. They are motivated
by self experience and self guidance.
Social Isolation and Academic Achievement
The Table 4.11 reveals that the t-value is 5.18 which is significant at 0.01 level
of significance. Hence the null hypothesis, “There is no significant difference in mean
of social isolation dimension of home environment of scheduled caste secondary
school students of low and high academic achievement” is rejected. Further analysis
of results shows that mean value of social isolation dimension of low achievers is
higher than mean value of social isolation dimension of high achievers. It further
implies that students belong to low academic achievement suffer more social isolation
and students related to high academic achievement suffer less social isolated
behaviour at home.
Reward and Academic Achievement
It is observed from Table 4.11 that the t-value is 1.34 which is not significant
even at 0.05 level of significance. Hence the null hypothesis, “There is no significant
difference in mean of reward dimension of home environment of scheduled caste
secondary school students of low and high academic achievement” is retained. It can
be interpreted that any type of reward whether it is material or symbolic in order to
increase or strengthen the probability of desired behaviours does not affect academic
achievement significantly.
Deprivation of Privileges and Academic Achievement
The results shown in Table 4.11 reveal that the t-value is 3.59 which is
significant at 0.01 level of significance. Hence the null hypothesis, “There is no

113
significant difference in mean of deprivation of privileges dimension of home
environment of scheduled caste secondary school students of low and high academic
achievement” is rejected. The further analysis of results shows that mean value of
deprivation of privileges of low achievers is higher than the mean value of deprivation
of privileges dimension of high achievers It implies that too much restriction can be
resulted in low academic achievement and vice-versa.
Nurturance and Academic Achievement
The results presented in Table 4.11 reveal that the t-value is 0.22 which is not
significant even at 0.05 level of significance. Hence the null hypothesis, “There is no
significant difference in mean of nurturance dimension of home environment of
scheduled caste secondary school students of low and high academic achievement” is
retained. Although the mean value of nurturance dimension of low achievers is
greater than the mean values of nurturance dimension of high achievers, but it points
out that in both cases, parents have equal emotional attachment with their children.
Rejection and Academic Achievement
The results shown in Table 4.11 reveal that the t-value is 4.29 which is
significant at 0.01 level of significance. Hence the null hypothesis, “There is no
significant difference in mean of rejection dimension of home environment of
scheduled caste secondary school students of low and high academic achievement” is
rejected. The further analysis of results shows that mean value of rejection dimension
of low achievers is higher than the mean value of rejection dimension of high
achievers. It implies that students who have more restriction were had low academic
achievement as compared to those students who had less restriction.
Permissiveness and Academic Achievement
The results presented in Table 4.11 reveal that the t-value is 1.69 which is not
significant even at 0.05 level of significance. Hence the null hypothesis, “There is no
significant difference in mean of permissiveness dimension of home environment of
scheduled caste secondary school students of low and high academic achievement” is
retained. Although, the mean value of permissiveness dimension of low achievers is
greater than the mean value of permissiveness dimension of high achievers, but more
114
freedom is given by parents in case of low achievers. But it is concluded that there is
no significant difference in low and high achievers regarding permissiveness
dimension of home environment.
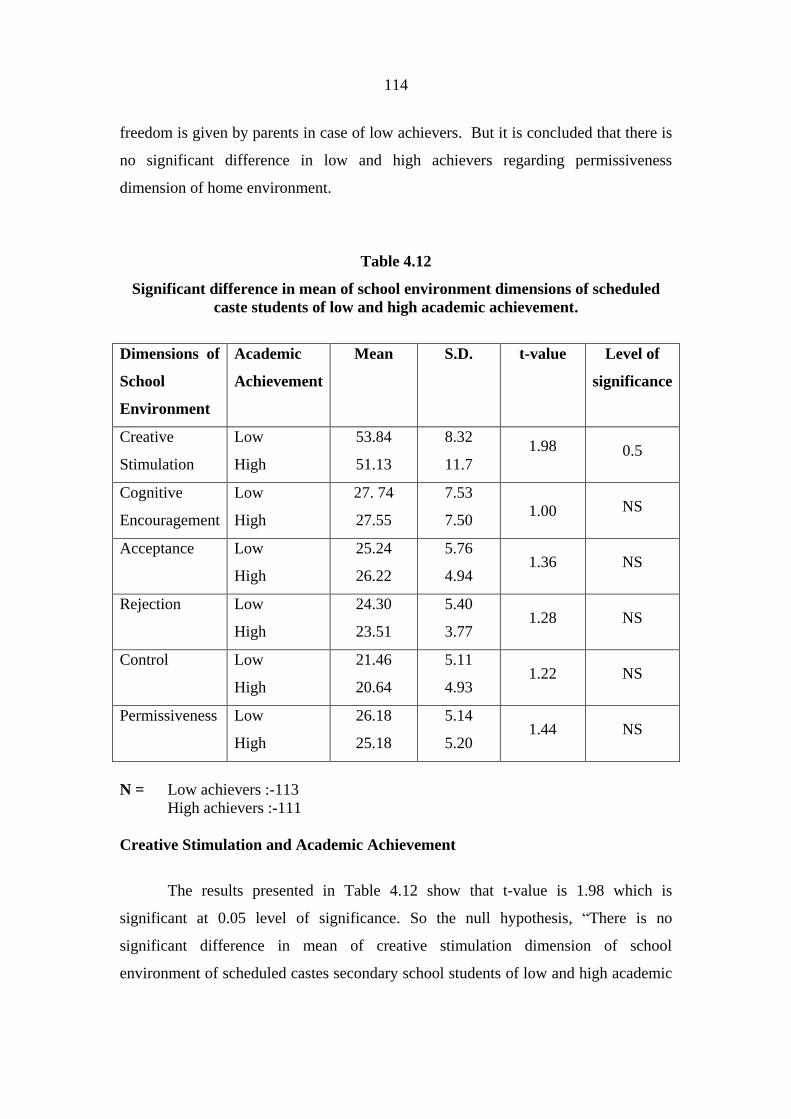
Table 4.12
Significant difference in mean of school environment dimensions of scheduled
caste students of low and high academic achievement.
Dimensions of
School
Environment
Academic
Achievement
Mean S.D. t-value Level of
significance
Creative
Stimulation
Low
High
53.84
51.13
8.32
11.7
1.98
0.5
Cognitive
Encouragement
Low
High
27. 74
27.55
7.53
7.50 1.00 NS
Acceptance Low
High
25.24
26.22
5.76
4.94 1.36 NS
Rejection Low
High
24.30
23.51
5.40
3.77 1.28 NS
Control Low
High
21.46
20.64
5.11
4.93 1.22 NS
Permissiveness Low
High
26.18
25.18
5.14
5.20 1.44 NS
N = Low achievers :-113
High achievers :-111
Creative Stimulation and Academic Achievement
The results presented in Table 4.12 show that t-value is 1.98 which is
significant at 0.05 level of significance. So the null hypothesis, “There is no
significant difference in mean of creative stimulation dimension of school
environment of scheduled castes secondary school students of low and high academic
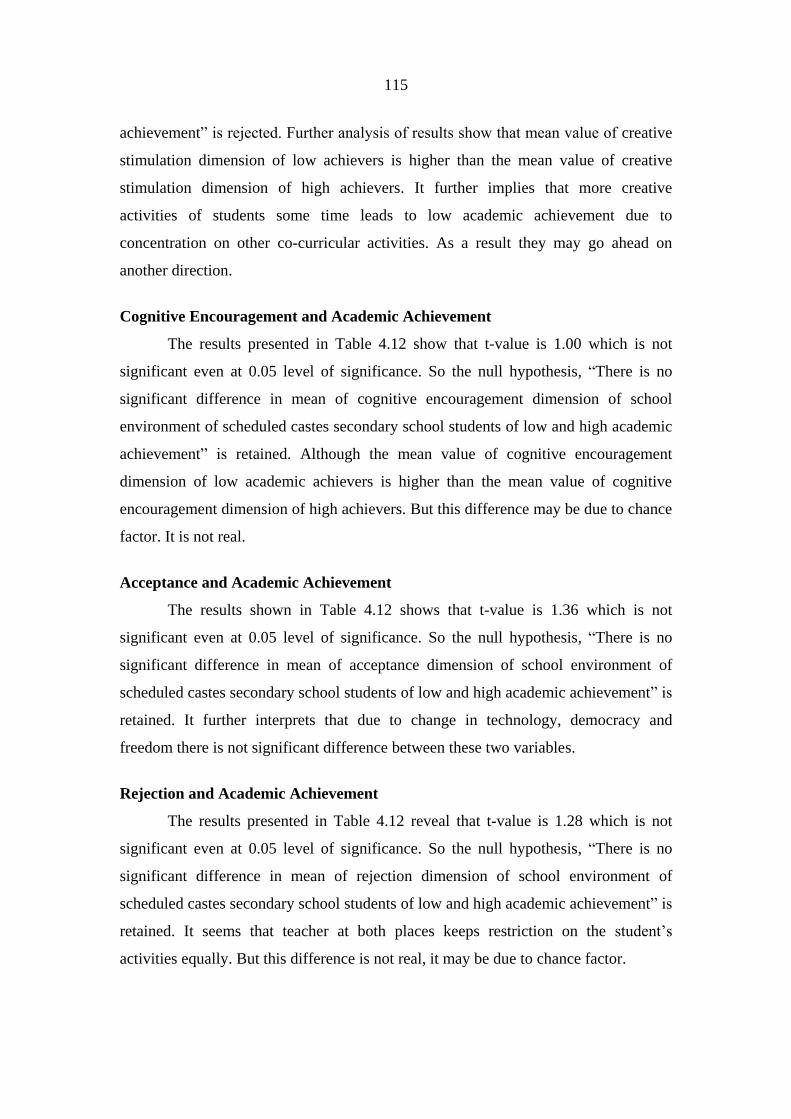
115
achievement” is rejected. Further analysis of results show that mean value of creative
stimulation dimension of low achievers is higher than the mean value of creative
stimulation dimension of high achievers. It further implies that more creative
activities of students some time leads to low academic achievement due to
concentration on other co-curricular activities. As a result they may go ahead on
another direction.
Cognitive Encouragement and Academic Achievement
The results presented in Table 4.12 show that t-value is 1.00 which is not
significant even at 0.05 level of significance. So the null hypothesis, “There is no
significant difference in mean of cognitive encouragement dimension of school
environment of scheduled castes secondary school students of low and high academic
achievement” is retained. Although the mean value of cognitive encouragement
dimension of low academic achievers is higher than the mean value of cognitive
encouragement dimension of high achievers. But this difference may be due to chance
factor. It is not real.
Acceptance and Academic Achievement
The results shown in Table 4.12 shows that t-value is 1.36 which is not
significant even at 0.05 level of significance. So the null hypothesis, “There is no
significant difference in mean of acceptance dimension of school environment of
scheduled castes secondary school students of low and high academic achievement” is
retained. It further interprets that due to change in technology, democracy and
freedom there is not significant difference between these two variables.
Rejection and Academic Achievement
The results presented in Table 4.12 reveal that t-value is 1.28 which is not
significant even at 0.05 level of significance. So the null hypothesis, “There is no
significant difference in mean of rejection dimension of school environment of
scheduled castes secondary school students of low and high academic achievement” is
retained. It seems that teacher at both places keeps restriction on the student’s
activities equally. But this difference is not real, it may be due to chance factor.
116
Control and Academic Achievement
The results presented in Table 4.12 shows that t-value is 1.22 which is not
significant even at 0.05 level of significance. So the null hypothesis, “There is no
significant difference in mean of control dimension of school environment of
scheduled castes secondary school students of low and high academic achievement” is
retained. But there is no significant difference in mean of control dimension of low
and high academic achievement of scheduled caste secondary school students. It
means that discipline and control is maintained equally at both level.
Permissiveness and Academic Achievement
The results presented in Table 4.12 show that t-value is 1.44 which is not
significant even at 0.05 level of significance. So the null hypothesis, “There is no
significant difference in mean of permissiveness dimension of school environment of
scheduled castes secondary school students of low and high academic achievement” is
retained. It may be due to the similar tendency of teachers to control the behaviour of
their students in both low and high achievement groups. It is evident that there is not
significant difference in mean of permissiveness dimension of low and high academic
achievement of scheduled caste students.
4.12 Significance of Difference in Mean of Study Habits, Home Environment
Dimensions and School Environment Dimensions of Scheduled Caste
Secondary School Boys and Girls.
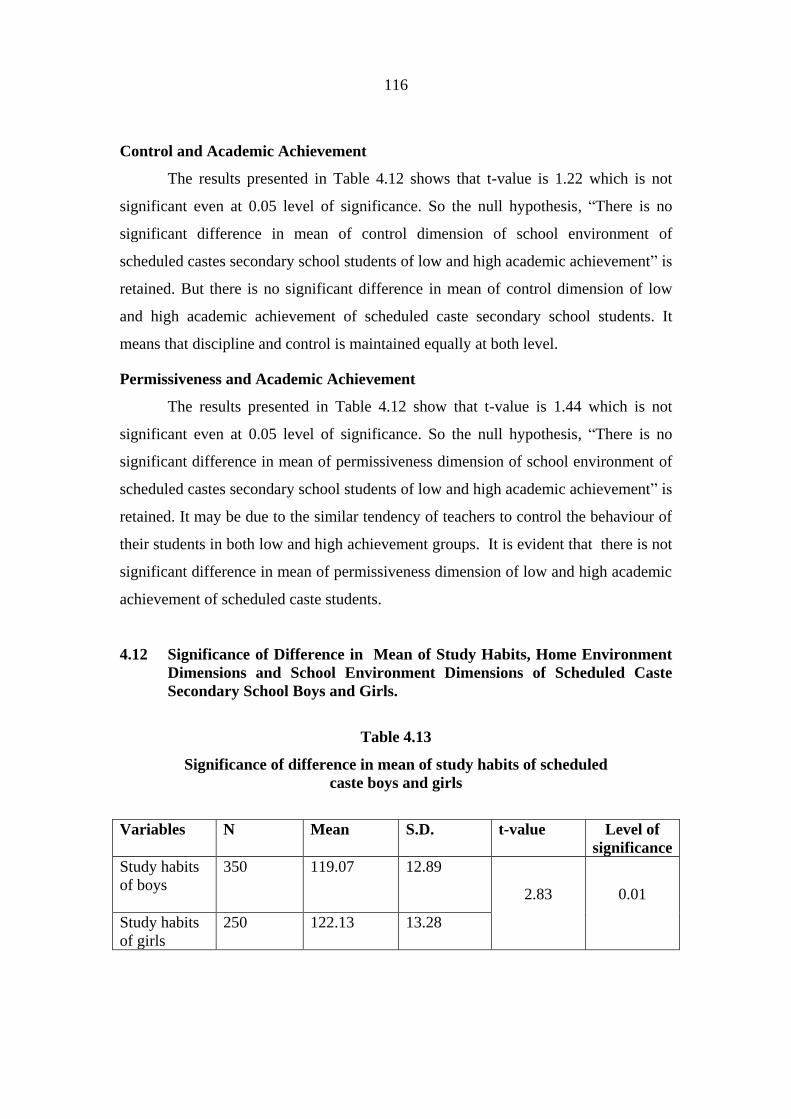
Table 4.13
Significance of difference in mean of study habits of scheduled
caste boys and girls
Variables N Mean S.D. t-value Level of
significance
Study habits
of boys
350 119.07 12.89
2.83
0.01
Study habits
of girls
250 122.13 13.28

117
The table 4.13 reveals that t-value is 2.83, which is significant at 0.01 level of
significance. Hence the null hypothesis, “There is no significant difference in mean of
study habits of scheduled castes secondary school boys and girls” is rejected. This
difference is real and not due to chance factor. It can be concluded that mean of girls
is higher than the mean of boys. Further girls have better study habits than boys.
Table 4.14
Significance of difference in mean of various home environment dimensions of
scheduled caste secondary school boys and girls
Dimensions of
Home
Environment
Sex Mean S.D. t-value Level of
significance
Control Boys
Girls
22.92
23.72
6.11
5.66 1.64 NS
Protectiveness Boys
Girls
26.60
26.89
5.06
5.02 0.68 NS
Punishment Boys
Girls
26.45
26.76
5.35
5.48 0.69 NS
Conformity Boys
Girls
27.70
28.39
6.05
5.89 0.13 NS
Social
Isolation
Boys
Girls
19.91
20.58
7.11
7.07 1.14 NS
Reward Boys
Girls
27.28
27.30
6.48
6.36 0.03 NS
Deprivation of
Privileges
Boys
Girls
20.38
20.74
7.20
7.17 0.60 NS
Nurturance Boys
Girls
23.75
24.03
5.70
5.65 0.99 NS
Rejection Boys
Girls
18.67
19.70
7.40
6.97 1.73 NS
Permissiveness Boys
Girls
22.42
22.84
6.02
5.79 0.81 NS
N=Boys-350
Girls-250
Control Environment of boys and girls
The results of Table 4.14 show that t-value is 1.64 which is not significant
even at 0.05 level of significance. Hence the null hypothesis, “There is no significant
difference in mean of control dimension of home environment of scheduled caste
secondary school boys and girls” is retained. Therefore, it can be interpreted that the

118
difference is not real and may be due to chance factor. Therefore, it can be concluded
that no significant difference exists in control dimension of home environment among
boys and girls.
Protectiveness Environment of boys and girls
The Table 4.14 reveals that t-value is 0.68 which is not significant even at 0.05
level of significance. Hence the null hypothesis, “There is no significant difference in
mean of protectiveness dimension of home environment of scheduled caste secondary
school boys and girls” is retained. Thus, it can be interpreted that boys and girls does
not have any significant difference in mean value of protectiveness dimension of boys
and girls.
Punishment Environment of boys and girls
The Table 4.14 points out that the t-value is 0.69 which is not significant even
at 0.05 level of significance. Hence the null hypothesis, “There is no significant
difference in mean of punishment dimension of home environment of scheduled caste
secondary school boys and girls” is retained. The obtained difference is not real but it
may be due to chance factor. It is concluded that punishment at home has not
significant difference among boys and girls.
Conformity Environment of boys and girls
The Table 4.14 reveals that t-value is 0.13, which is not significant even at
0.05 level of significance. Hence the null hypothesis, “There is no significant
difference in mean of conformity dimension of home environment of scheduled caste
secondary school boys and girls” is retained. Therefore, it can be interpreted that
conformity at home has not significant difference among boys and girls.
Social Isolation Environment of boys and girls
The Table 4.14 reveals that t-value is 1.14 which is not significant even at 0.05
level of significance. Therefore the null hypothesis, “There is no significant difference
in mean of social isolation dimension of home environment of scheduled caste
secondary school boys and girls” is retained. The obtained difference is not real but it
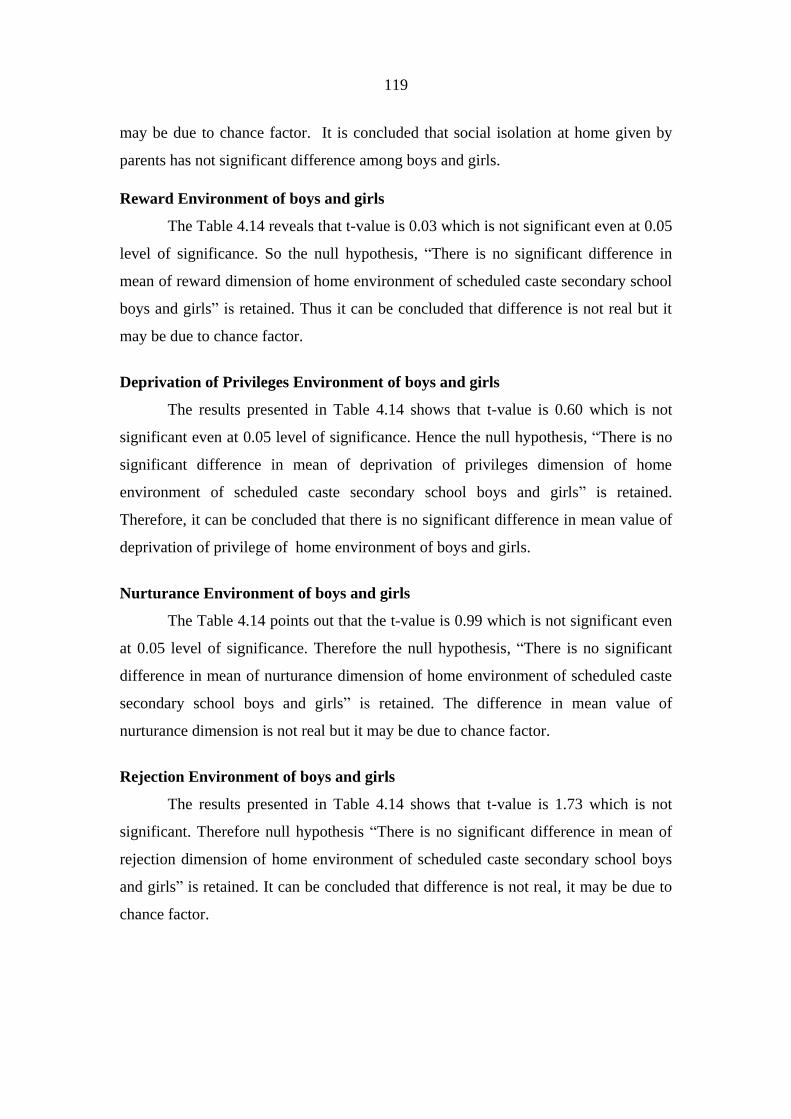
119
may be due to chance factor. It is concluded that social isolation at home given by
parents has not significant difference among boys and girls.
Reward Environment of boys and girls
The Table 4.14 reveals that t-value is 0.03 which is not significant even at 0.05
level of significance. So the null hypothesis, “There is no significant difference in
mean of reward dimension of home environment of scheduled caste secondary school
boys and girls” is retained. Thus it can be concluded that difference is not real but it
may be due to chance factor.
Deprivation of Privileges Environment of boys and girls
The results presented in Table 4.14 shows that t-value is 0.60 which is not
significant even at 0.05 level of significance. Hence the null hypothesis, “There is no
significant difference in mean of deprivation of privileges dimension of home
environment of scheduled caste secondary school boys and girls” is retained.
Therefore, it can be concluded that there is no significant difference in mean value of
deprivation of privilege of home environment of boys and girls.
Nurturance Environment of boys and girls
The Table 4.14 points out that the t-value is 0.99 which is not significant even
at 0.05 level of significance. Therefore the null hypothesis, “There is no significant
difference in mean of nurturance dimension of home environment of scheduled caste
secondary school boys and girls” is retained. The difference in mean value of
nurturance dimension is not real but it may be due to chance factor.
Rejection Environment of boys and girls
The results presented in Table 4.14 shows that t-value is 1.73 which is not
significant. Therefore null hypothesis “There is no significant difference in mean of
rejection dimension of home environment of scheduled caste secondary school boys
and girls” is retained. It can be concluded that difference is not real, it may be due to
chance factor.
120
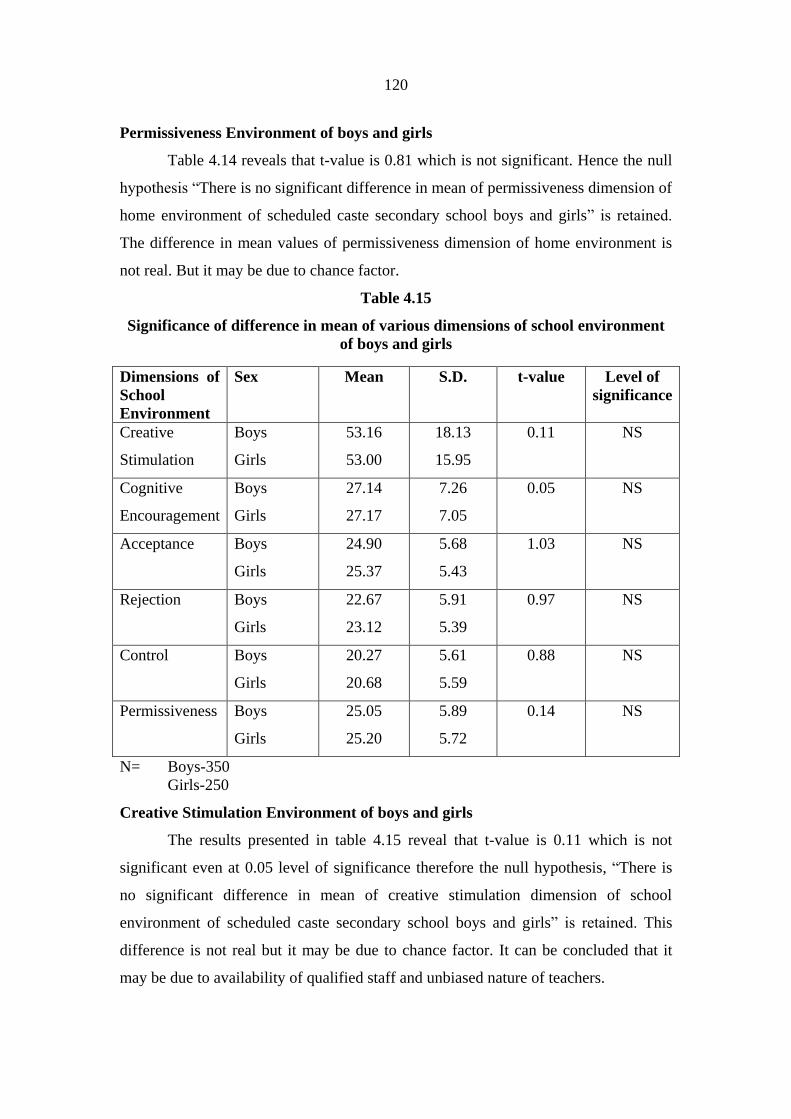
Permissiveness Environment of boys and girls
Table 4.14 reveals that t-value is 0.81 which is not significant. Hence the null
hypothesis “There is no significant difference in mean of permissiveness dimension of
home environment of scheduled caste secondary school boys and girls” is retained.
The difference in mean values of permissiveness dimension of home environment is
not real. But it may be due to chance factor.
Table 4.15
Significance of difference in mean of various dimensions of school environment
of boys and girls
Dimensions of
School
Environment
Sex Mean S.D. t-value Level of
significance
Creative
Stimulation
Boys
Girls
53.16
53.00
18.13
15.95
0.11
NS
Cognitive
Encouragement
Boys
Girls
27.14
27.17
7.26
7.05
0.05
NS
Acceptance Boys
Girls
24.90
25.37
5.68
5.43
1.03
NS
Rejection Boys
Girls
22.67
23.12
5.91
5.39
0.97
NS
Control Boys
Girls
20.27
20.68
5.61
5.59
0.88
NS
Permissiveness Boys
Girls
25.05
25.20
5.89
5.72
0.14
NS
N= Boys-350
Girls-250
Creative Stimulation Environment of boys and girls
The results presented in table 4.15 reveal that t-value is 0.11 which is not
significant even at 0.05 level of significance therefore the null hypothesis, “There is
no significant difference in mean of creative stimulation dimension of school
environment of scheduled caste secondary school boys and girls” is retained. This
difference is not real but it may be due to chance factor. It can be concluded that it
may be due to availability of qualified staff and unbiased nature of teachers.

121
Cognitive Encouragement Environment of boys and girls
The table 4.15 points out that t-value is 0.05 which is not significant even at
0.05 level of significance therefore the null hypothesis, “There is no significant
difference in mean of cognitive encouragement dimension of school environment of
scheduled caste secondary school boys and girls” is retained. Therefore, it can be
concluded that there is no significant difference in mean value of cognitive
encouragement dimension of school environment of scheduled caste secondary
school boys and girls.
Acceptance Environment of boys and girls
The Table 4.15 reveals that t-value is 1.03 which is not significant even at 0.05
level of significance. Therefore the null hypothesis, “There is no significant difference
in mean of acceptance dimension of school environment of scheduled caste secondary
school boys and girls” is retained. Therefore, it can be interpreted that there is no
significant difference in mean value of acceptance dimension of school environment
of scheduled caste secondary school boys and girls.
Rejection Environment of boys and girls
The results in Table 4.15 show that t-value is 0.97 which is not significant
even at 0.05 level of significance. Therefore the null hypothesis, “There is no
significant difference in mean of rejection dimension of school environment of
scheduled caste secondary school boys and girls” is retained. But this difference is not
real it may be due to chance factor. It seems that teacher at both places keeps
restriction on the student’s activities equally.
Control Environment of boys and girls
The results presented in table 4.15 point out that the t-value is 0.88 which is
not significant even at 0.05 level of significance. Therefore the null hypothesis,
“There is no significant difference in mean of control dimension of school
environment of scheduled caste secondary school boys and girls” is retained. It means
that discipline and control is maintained equally at both level. It is concluded that this
difference is not real, it may be due to chance factor.

122
Permissiveness Environment of boys and girls
The table 4.15 points out that t-value is 0.14 which is not significant even at
0.05 level of significance. Therefore the null hypothesis, “There is no significant
difference in mean of permissiveness dimension of school environment of scheduled
caste secondary school boys and girls” is retained. It may be due to the similar
tendency of teachers to control the behaviour of their students. It can be concluded
that there exist no significant difference in mean value of permissiveness dimension
of school environment of scheduled caste secondary school boys and girls.