Data, Algorithms, Fairness, and Justice
74
Data, Algorithms, Fairness, and Justice Cristopher Moore, Santa Fe Institute Complex Systems Summer School
Transcript of Data, Algorithms, Fairness, and Justice

Data, Algorithms, Fairness, and Justice
Cristopher Moore, Santa Fe Institute Complex Systems Summer School
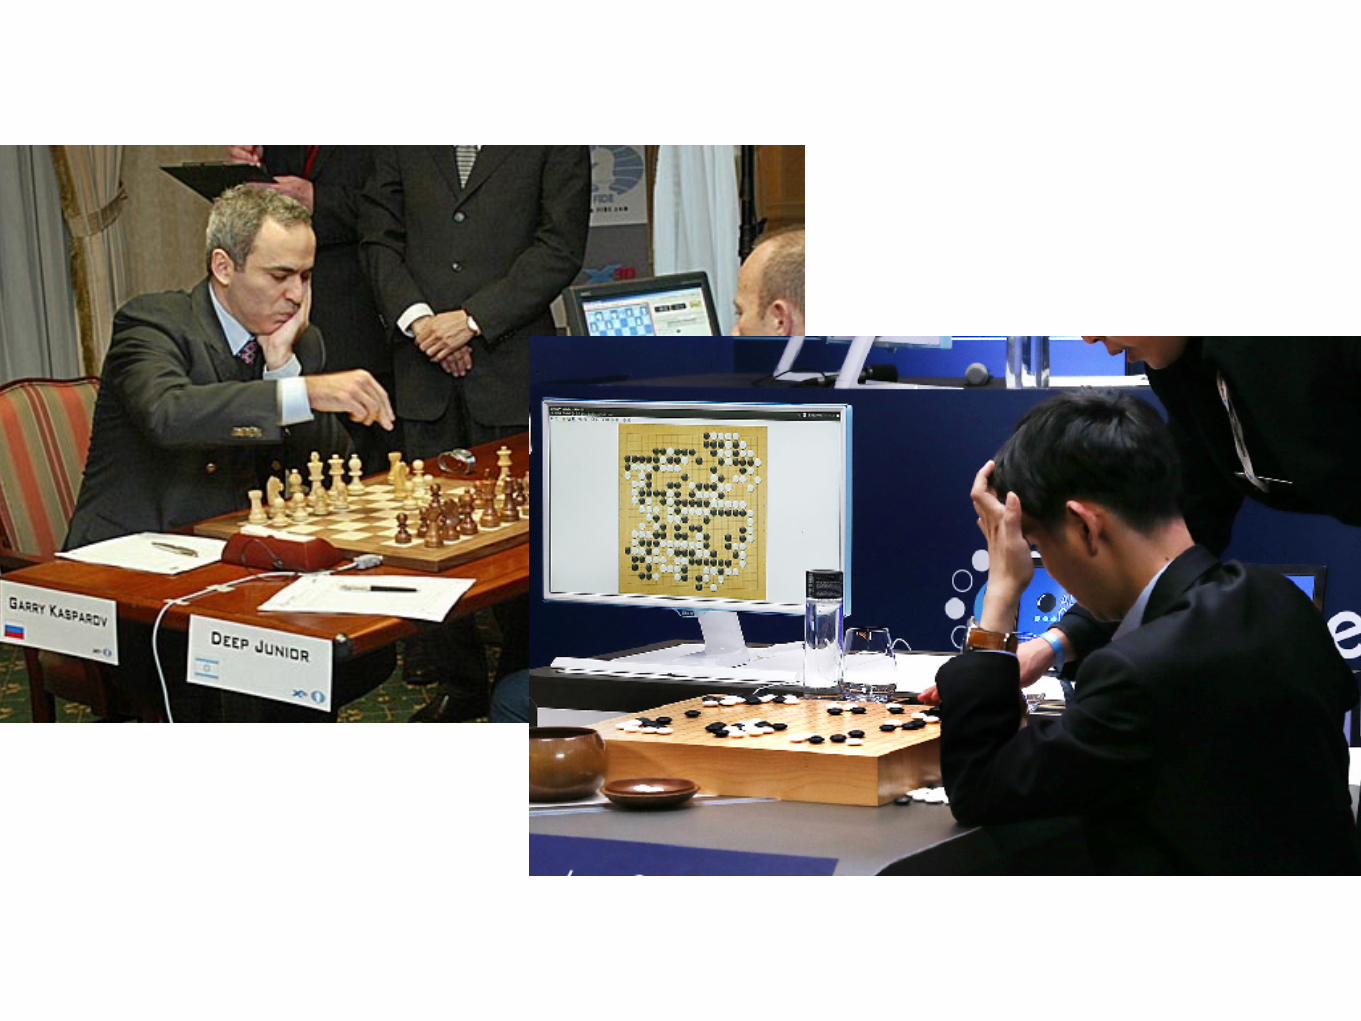


Algorithms in the Justice System

9/8/18, 2(35 PMWant Less-Biased Decisions? Use Algorithms.
Page 1 of 7https://hbr.org/2018/07/want-less-biased-decisions-use-algorithms
DECISION MAKING
Want Less-Biased Decisions?
Use Algorithms.by Alex P. Miller
JULY 26, 2018
ORLAGH MURPHY/GETTY IMAGES

On any given day, about 450,000 people in jail awaiting trial
More than 1/1,000 Americans, 70% of the jail population
Most on bail of $2,500 or less
Disproportionately Black and Hispanic
Costs $14 Billion per year
Disrupts families, marriages, jobs; can in fact increase crime
Hard to prepare defense: more guilty pleas, plea bargains
Wealthy can afford bail and be released
Pretrial Detention

“Allowing people who have neither been tried or convicted to languish in jail violates the spirit of the Constitution. Pretrial incarceration has become the penalty for poverty, for mental illness and for blackness.”
— Ritchie Torres, Bronx Councilman

“In our society, liberty is the norm, and detention prior to trial or without trial is the carefully limited exception”
— Chief Justice Rehnquist
“This case brings before the Court for the first time a statute in which Congress declares that a person innocent of any crime may be jailed indefinitely… if the Government shows to the satisfaction of a judge that the accused is likely to commit crimes… at any time in the future”
— Justice Thurgood Marshall’s dissent
Salerno v. United States (1987)

Anne Milgram, former New Jersey Attorney General
Big Data to the Rescue?


Gro
un
d tr
uth
What the algorithm thinkslo
w r
isk
hig
h r
isk
low risk high risk
or ?
false positives
false negatives

“It is better that ten guilty persons escape than that one innocent suffer.”
—William Blackstone
False Positives vs. False Negatives

“I'm more concerned with bad guys who got out and released than I am with a few that in fact were innocent.”
— Dick Cheney
False Positives vs. False Negatives
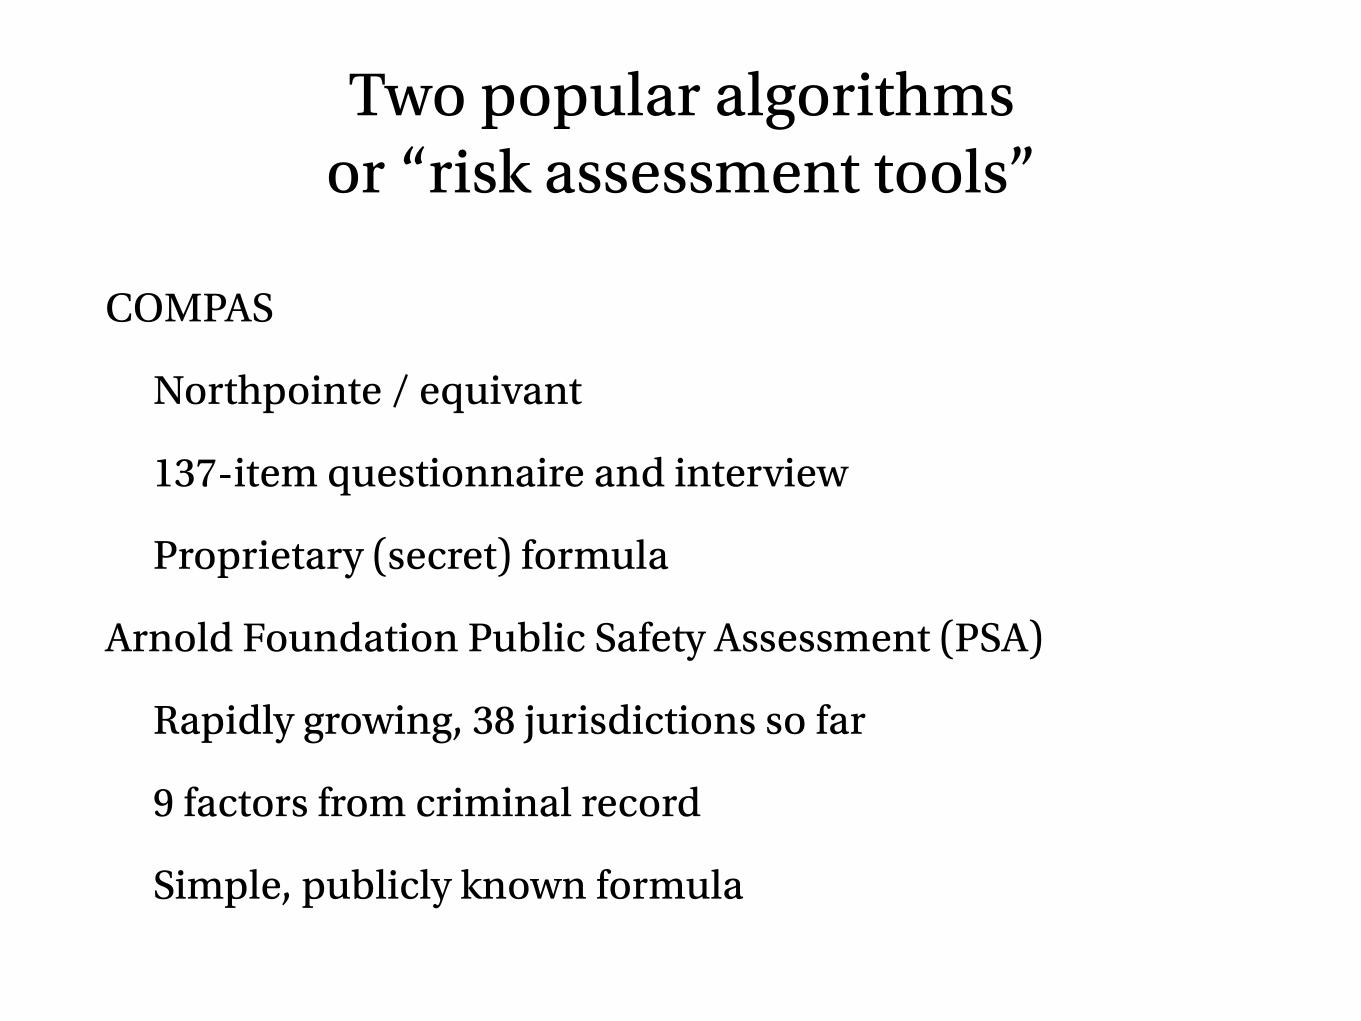
Two popular algorithms or “risk assessment tools”
COMPAS
Northpointe / equivant
137-item questionnaire and interview
Proprietary (secret) formula
Arnold Foundation Public Safety Assessment (PSA)
Rapidly growing, 38 jurisdictions so far
9 factors from criminal record
Simple, publicly known formula

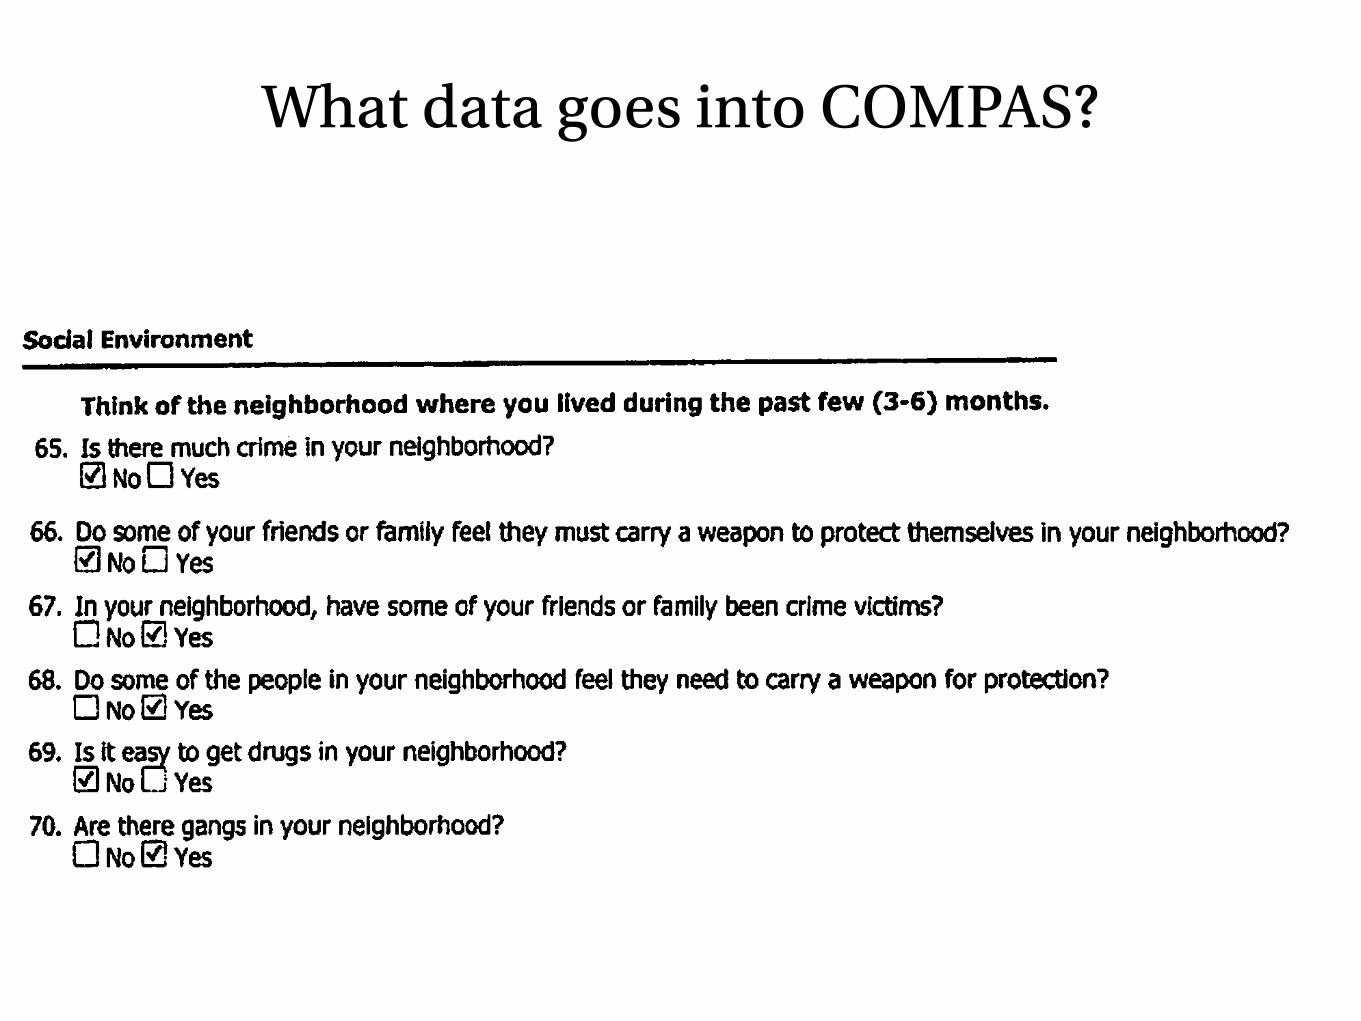
What data goes into COMPAS?

What data goes into COMPAS?

What data goes into COMPAS?

What data goes into COMPAS?
What data goes into COMPAS?

What data goes into COMPAS?
COMPAS doesn’t use race (it does use gender)
But it uses “proxies” that are correlated with race
Objections to COMPAS
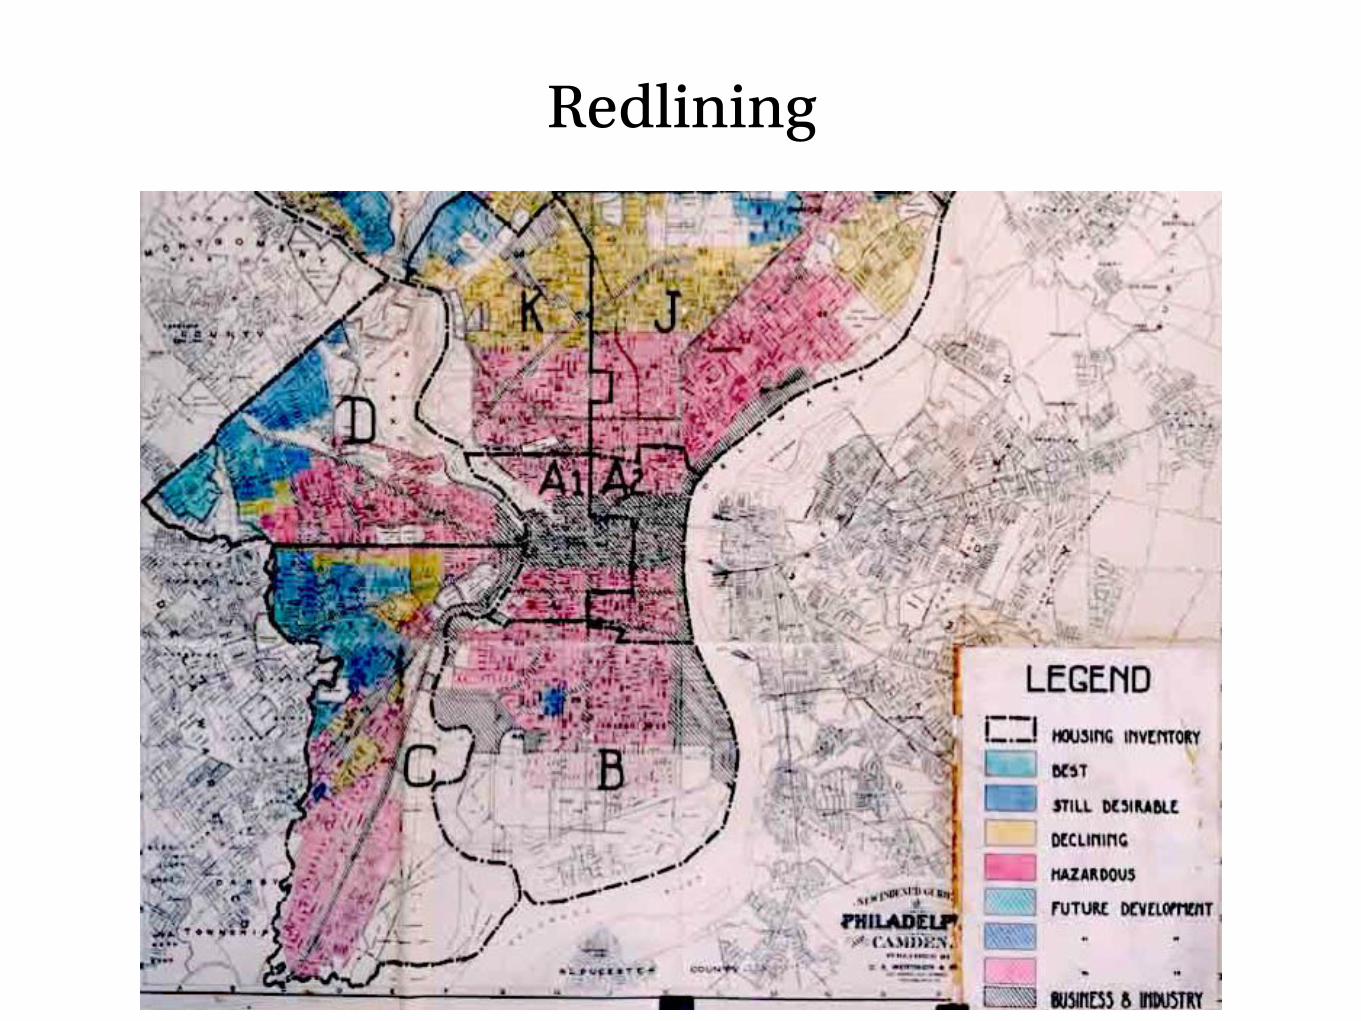
Redlining

COMPAS doesn’t use race (it does use gender)
But it uses “proxies” that are correlated with race
Past arrests: people of color are more likely to get arrested
“Environment” questions, over which you have no control
Employment questions, correlated with income
Juvenile record?
Drug treatment?
Proprietary formula—simple (logistic regression), but with unknown weights
Objections to COMPAS

What data goes into the Arnold PSA?
TM
www.arnoldfoundation.org
DEVELOPMENTLJAF created the PSA using the largest, most diverse set of pretrial records ever assembled—1.5 million cases from approximately 300 jurisdictions across the United States. Researchers analyzed the data and identified the nine factors that best predict whether a defendant will commit new criminal activity (NCA), commit new violent criminal activity (NVCA), or fail to appear (FTA) in court if released before trial.
RISK FACTORSThe table below outlines the nine factors and illustrates which factors are related to each of the pretrial outcomes—that is, which factors are used to predict NCA, NVCA, and FTA.
Note: Boxes where an “X” occurs indicate that the presence of a risk factor increases the likelihood of that outcome for a given defendant.
RELATIONSHIP BETWEEN RISK FACTORS AND PRETRIAL OUTCOMES
Risk Factor1. Age at current arrest
2. Current violent offense
Current violent offense & 20 years old or younger
3. Pending charge at the time of the offense
4. Prior misdemeanor conviction
5. Prior felony conviction
Prior conviction (misdemeanor or felony)
6. Prior violent conviction
7. Prior failure to appear in the past two years
8. Prior failure to appear older than two years
9. Prior sentence to incarceration
FTA
X
X
X
X
NCAX
X
X
X
X
X
X
NVCA
X
X
X
X
X
2
The PSA relies solely on the above nine variables. It does not rely on factors such as race, ethnicity, or geography.
FTA = Failure to Appear NCA = New Criminal Activity
NVCA = New Violent Criminal Activity

The Arnold PSA
Publicly known
Simple linear point system
Past convictions, not arrests
Does not use juvenile record
Uses age, but not gender, employment, education, or environment

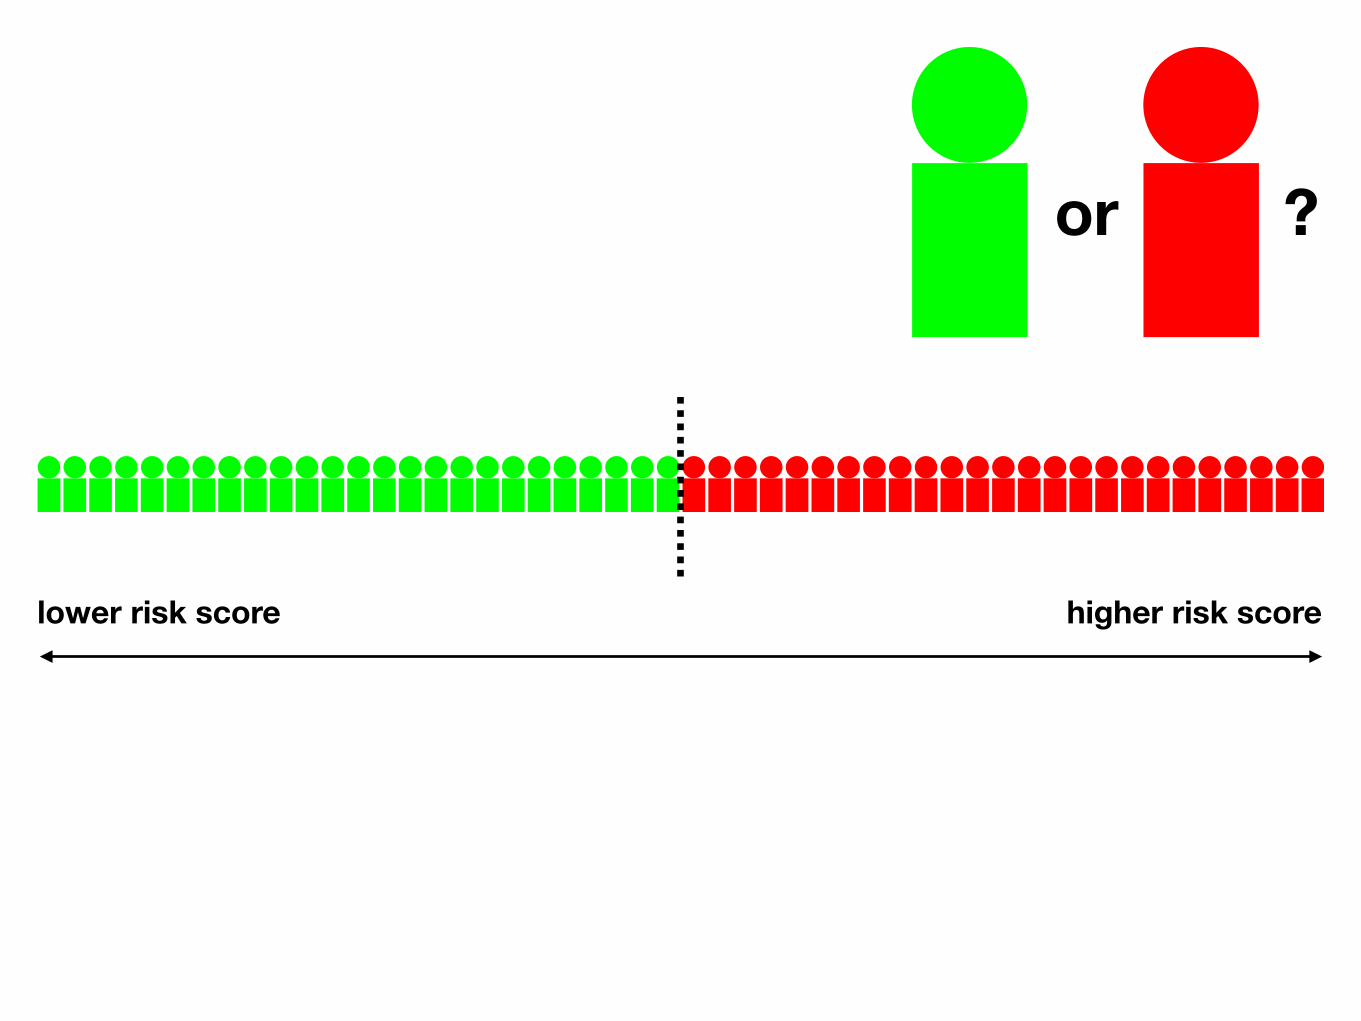
What does “accuracy” mean anyway?

or ?
lower risk score higher risk score
or ?
lower risk score higher risk score
or ?

or ?
lower risk score higher risk score
lower risk score higher risk score
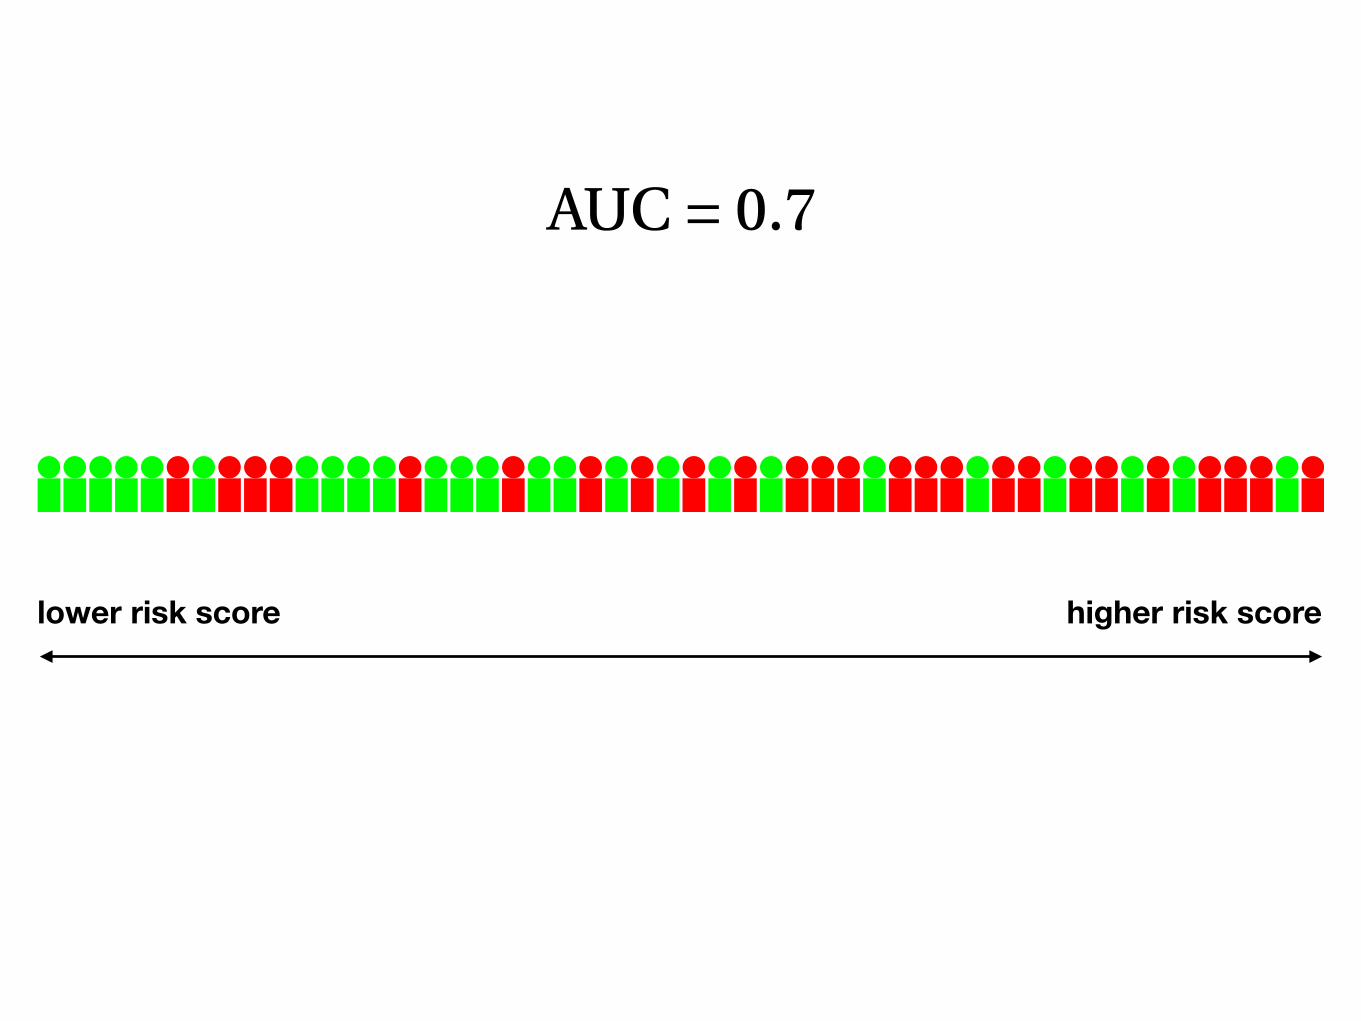
AUC = 0.7
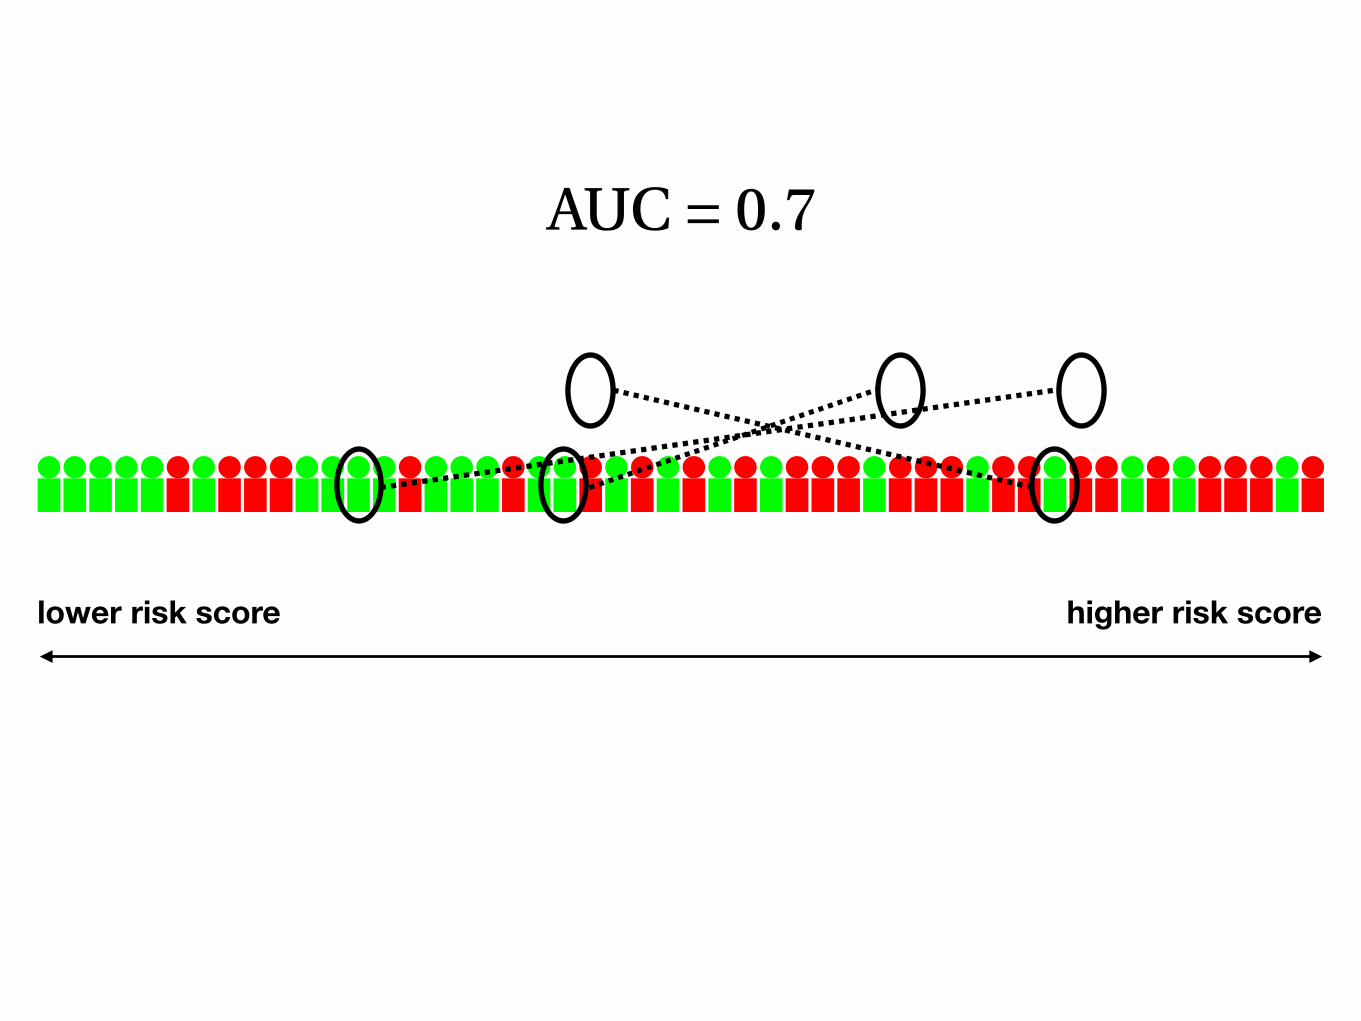
lower risk score higher risk score
AUC = 0.7
AUC=0.7
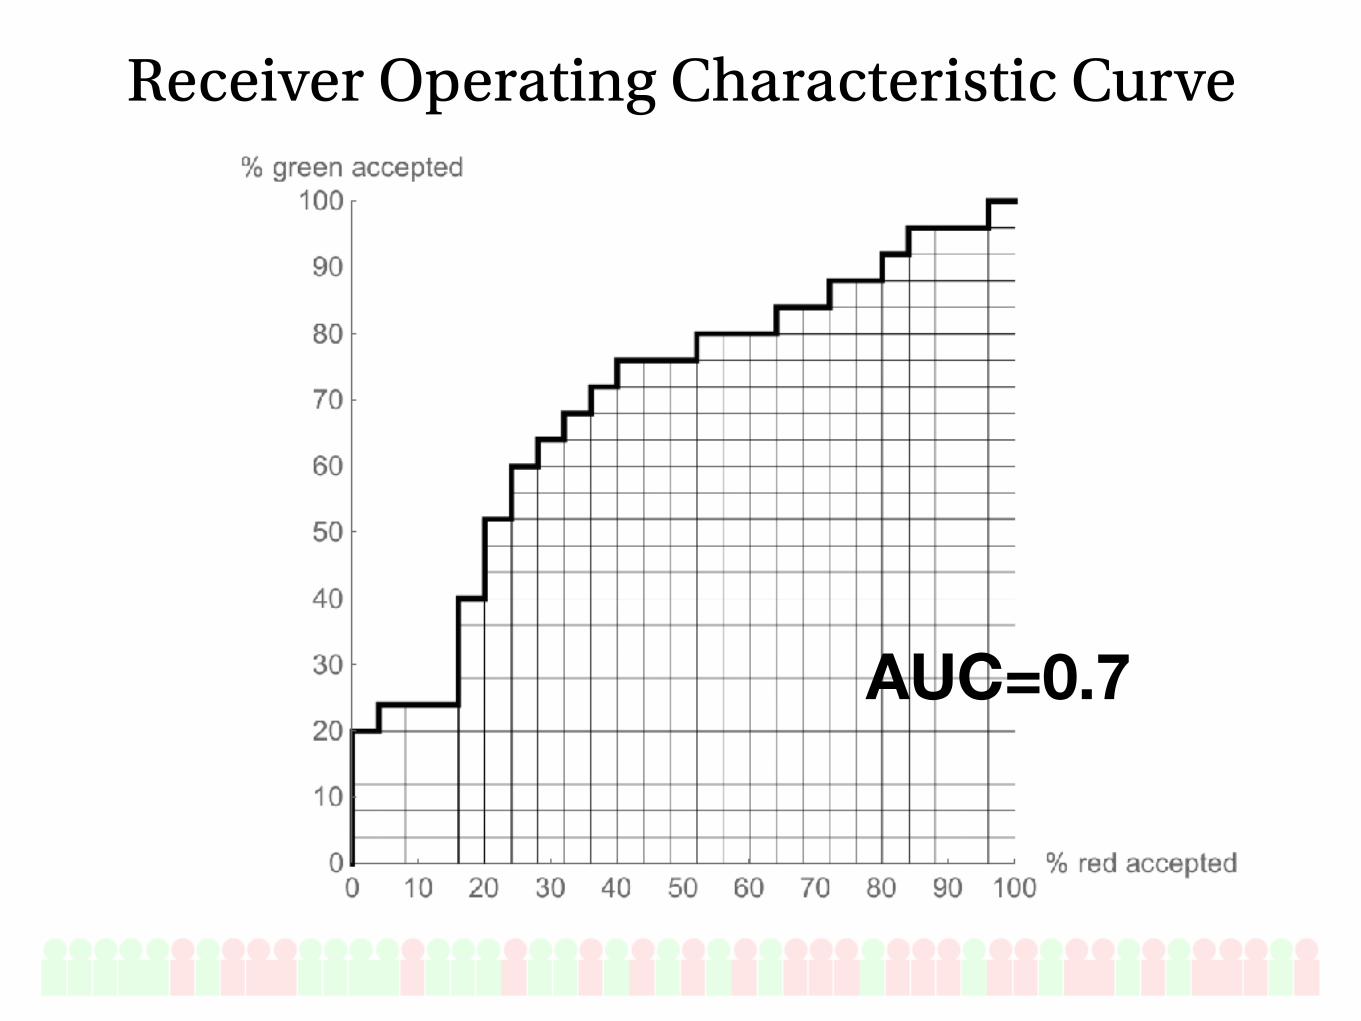
Receiver Operating Characteristic Curve

COMPAS: 0.69–0.71
Arnold PSA: 0.64–0.66
tradeoff for transparency?
Random people: 0.71
Low compared to medicine, other AI tasks
Not too bad for social science… people are hard to predict
AUCs in practice
contains individual demographic information, criminal history, theCOMPAS recidivism risk score, and each defendant’s arrest recordwithin a 2-year period following the COMPAS scoring. COMPASscores, ranging from 1 to 10, classify the risk of recidivism as low-risk(1 to 4), medium-risk (5 to 7), or high-risk (8 to 10).
Our algorithmic assessment was based on this full set of 7214defendants. Our human assessment was based on a random subsetof 1000 defendants, which was held fixed throughout all conditions.This subset yielded similar overall COMPAS accuracy, false-positiverate, and false-negative rate as the complete database (a positive pre-diction is one in which a defendant is predicted to recidivate; a neg-ative prediction is one in which they are predicted to not recidivate).The COMPAS accuracy for this subset of 1000 defendants was 65.2%.The average COMPAS accuracy on 10,000 random subsets of size1000 each was 65.4% with a 95% confidence interval of (62.6, 68.1).
Human assessmentA descriptive paragraph for each of 1000 defendants was generated:
The defendant is a [SEX] aged [AGE]. They have been chargedwith: [CRIME CHARGE]. This crime is classified as a [CRIMI-NALDEGREE]. They have been convicted of [NON-JUVENILEPRIORCOUNT]prior crimes. Theyhave [JUVENILE-FELONYCOUNT]juvenile felonychargesand[JUVENILE-MISDEMEANORCOUNT] juvenile misdemeanor charges on their record.
In a follow-up condition, the defendant’s race was included sothat the first line of the above paragraph read, “The defendant is a[RACE] [SEX] aged [AGE].”
There were a total of 63 unique criminal charges including armedrobbery, burglary, grand theft, prostitution, robbery, and sexual assault.The crime degree is either “misdemeanor” or “felony.” To ensure thatour participants understood the nature of each crime, the above para-graph was followed by a short description of each criminal charge:
[CRIME CHARGE]: [CRIME DESCRIPTION]
After reading the defendant description, participants were thenasked to respond either “yes” or “no” to the question “Do you think thisperson will commit another crime within 2 years?” The participants
were required to answer each question and could not change their re-sponse once it wasmade. After each answer, the participants were giventwo forms of feedback: whether their response was correct and theiraverage accuracy.
The 1000 defendants were randomly divided into 20 subsets of50 each. Each participant was randomly assigned to see one of these20 subsets. The participants saw the 50 defendants, one at a time, inrandom order. The participants were only allowed to complete a singlesubset of 50 defendants.
The participants were recruited through Amazon’s Mechanical Turk,an online crowdsourcingmarketplacewhere people are paid to perform awide variety of tasks (Institutional ReviewBoard guidelineswere followedfor all participants). Our task was titled “Predicting Crime” with the de-scription “Read a few sentences about an actual person andpredict if theywill commit a crime in the future.”The keywords for the task were “sur-vey, research, and criminal justice.”The participants were paid $1.00 forcompleting the task and a $5.00 bonus if their overall accuracy on thetask was greater than 65%. This bonus was intended to provide an in-centive for participants to pay close attention to the task. To filter outparticipants who were not paying close attention, three catch trialswere randomly added to the subset of 50 questions. These questionswere formatted to look like all other questions but had easily identi-fiable correct answers. A participant’s response was eliminated fromour analysis if any of these questions were answered incorrectly. Thecatch trial questions were (i) The state of California was the 31st stateto join the Union. California’s nickname is: The Golden State. Thestate capital is Sacramento. California is bordered by three other states.Los Angeles is California’s most populous city, which is the country’ssecond largest city after New York City. Does the state of Californiahave a nickname?; (ii) The first spaceflight that landed humans on theMoon was Apollo 11. These humans were: Neil Armstrong and BuzzAldrin. Armstrong was the first person to step onto the lunar surface.This landing occurred in 1969. They collected 47.5 pounds (21.59 kg)of lunar material to bring back to Earth. Did the first spaceflight thatlanded humans on theMoon carry Buzz Aldrin?; and (iii) The Earth isthe third planet from the Sun. The shape of Earth is approximatelyoblate spheroidal. It is the densest planet in the Solar System and thelargest of the four terrestrial planets. During one orbit around theSun, Earth rotates about its axis over 365 times. Earth is home to over7.4 billion humans. Is Earth the fifth planet from the Sun?
Table 2. Algorithmic predictions from 7214 defendants. Logistic regression with 7 features (A) (LR7), logistic regression with 2 features (B) (LR2), a nonlinearSVM with 7 features (C) (NL-SVM), and the commercial COMPAS software with 137 features (D) (COMPAS). The results in columns (A), (B), and (C) correspond tothe average testing accuracy over 1000 random 80%/20% training/testing splits. The values in the square brackets correspond to the 95% bootstrapped[columns (A), (B), and (C)] and binomial [column (D)] confidence intervals.
(A) LR7 (B) LR2 (C) NL-SVM (D) COMPAS
Accuracy (overall) 66.6% [64.4, 68.9] 66.8% [64.3, 69.2] 65.2% [63.0, 67.2] 65.4% [64.3, 66.5]
Accuracy (black) 66.7% [63.6, 69.6] 66.7% [63.5, 69.2] 64.3% [61.1, 67.7] 63.8% [62.2, 65.4]
Accuracy (white) 66.0% [62.6, 69.6] 66.4% [62.6, 70.1] 65.3% [61.4, 69.0] 67.0% [65.1, 68.9]
False positive (black) 42.9% [37.7, 48.0] 45.6% [39.9, 51.1] 31.6% [26.4, 36.7] 44.8% [42.7, 46.9]
False positive (white) 25.3% [20.1, 30.2] 25.3% [20.6, 30.5] 20.5% [16.1, 25.0] 23.5% [20.7, 26.5]
False negative (black) 24.2% [20.1, 28.2] 21.6% [17.5, 25.9] 39.6% [34.2, 45.0] 28.0% [25.7, 30.3]
False negative (white) 47.3% [40.8, 54.0] 46.1% [40.0, 52.7] 56.6% [50.3, 63.5] 47.7% [45.2, 50.2]
S C I ENCE ADVANCES | R E S EARCH ART I C L E
Dressel and Farid, Sci. Adv. 2018;4 : eaao5580 17 January 2018 4 of 5
on February 6, 2018http://advances.sciencem
ag.org/D
ownloaded from
RESEARCH METHODS Copyright © 2018The Authors, somerights reserved;exclusive licenseeAmerican Associationfor the Advancementof Science. No claim tooriginalU.S.GovernmentWorks. Distributedunder a CreativeCommons AttributionNonCommercialLicense 4.0 (CC BY-NC).
The accuracy, fairness, and limitsof predicting recidivismJulia Dressel and Hany Farid*
Algorithms for predicting recidivism are commonly used to assess a criminal defendant’s likelihood of committing acrime. These predictions are used in pretrial, parole, and sentencing decisions. Proponents of these systems argue thatbig data and advancedmachine learningmake these analyses more accurate and less biased than humans. We show,however, that the widely used commercial risk assessment software COMPAS is no more accurate or fair than predic-tions made by people with little or no criminal justice expertise. We further show that a simple linear predictorprovided with only two features is nearly equivalent to COMPAS with its 137 features.
INTRODUCTIONWe are the frequent subjects of predictive algorithms that determinemusic recommendations, product advertising, university admission,job placement, and bank loan qualification. In the criminal justice sys-tem, predictive algorithms have been used to predict where crimes willmost likely occur, who is most likely to commit a violent crime, who islikely to fail to appear at their court hearing, andwho is likely to reoffendat some point in the future (1).
One widely used criminal risk assessment tool, Correctional Of-fender Management Profiling for Alternative Sanctions (COMPAS;Northpointe, which rebranded itself to “equivant” in January 2017),has been used to assess more than 1 million offenders since it was de-veloped in 1998. The recidivism prediction component of COMPAS—the recidivism risk scale—has been in use since 2000. This softwarepredicts a defendant’s risk of committing a misdemeanor or felonywithin 2 years of assessment from 137 features about an individualand the individual’s past criminal record.
Although the data used by COMPAS do not include an individ-ual’s race, other aspects of the data may be correlated to race thatcan lead to racial disparities in the predictions. In May 2016, writingfor ProPublica, Angwin et al. (2) analyzed the efficacy of COMPAS onmore than 7000 individuals arrested in Broward County, Florida be-tween 2013 and 2014. This analysis indicated that the predictions wereunreliable and racially biased. COMPAS’s overall accuracy for whitedefendants is 67.0%, only slightly higher than its accuracy of 63.8% forblack defendants. The mistakes made by COMPAS, however, affectedblack and white defendants differently: Black defendants who did notrecidivate were incorrectly predicted to reoffend at a rate of 44.9%,nearly twice as high as their white counterparts at 23.5%; and whitedefendants who did recidivate were incorrectly predicted to not reof-fend at a rate of 47.7%, nearly twice as high as their black counterpartsat 28.0%. In other words, COMPAS scores appeared to favor whitedefendants over black defendants by underpredicting recidivism forwhite and overpredicting recidivism for black defendants.
In response to this analysis, Northpointe argued that the ProPublicaanalysis overlooked other more standard measures of fairness that theCOMPAS score satisfies (3) [see also the studies of Flores et al. (4) andKleinberg et al. (5)]. Specifically, it is argued that the COMPAS score isnot biased against blacks because the likelihood of recidivism amonghigh-risk offenders is the same regardless of race (predictive parity), it
can discriminate between recidivists and nonrecidivists equally well forwhite and black defendants asmeasuredwith the area under the curve ofthe receiver operating characteristic, AUC-ROC (accuracy equity), andthe likelihood of recidivism for any given score is the same regardless ofrace (calibration). The disagreement amounts to different definitions offairness. In an eloquent editorial, Corbett-Davies et al. (6) explain that itis impossible to simultaneously satisfy all of these definitions of fairnessbecause black defendants have a higher overall recidivism rate (in theBroward County data set, black defendants recidivate at a rate of 51%as compared with 39% for white defendants, similar to the nationalaverages).
While the debate over algorithmic fairness continues, we considerthe more fundamental question of whether these algorithms are anybetter than untrained humans at predicting recidivism in a fair and ac-curate way. We describe the results of a study that shows that peoplefrom a popular online crowdsourcingmarketplace—who, it can reason-ably be assumed, have little to no expertise in criminal justice—are asaccurate and fair as COMPAS at predicting recidivism. In addition, al-though Northpointe has not revealed the inner workings of their reci-divismprediction algorithm,we show that the accuracy of COMPASonone data set can be explained with a simple linear classifier. We alsoshow that although COMPAS uses 137 features to make a prediction,the same predictive accuracy can be achieved with only two features.We further show thatmore sophisticated classifiers do not improve pre-diction accuracy or fairness. Collectively, these results cast significantdoubt on the entire effort of algorithmic recidivism prediction.
RESULTSWe compare the overall accuracy and bias in human assessment withthe algorithmic assessment ofCOMPAS. Throughout, a positive predic-tion is one in which a defendant is predicted to recidivate, whereas anegative prediction is one in which they are predicted to not recidivate.Wemeasure overall accuracy as the rate at which a defendant is correctlypredicted to recidivate or not (that is, the combined true-positive andtrue-negative rates).We also report on false positives (a defendant is pre-dicted to recidivate but they do not) and false negatives (a defendant ispredicted to not recidivate but they do).
Human assessmentParticipants saw a short description of a defendant that included thedefendant’s sex, age, and previous criminal history, but not their race(see Materials and Methods). Participants predicted whether this per-son would recidivate within 2 years of their most recent crime.We used
6211 Sudikoff Laboratory, Department of Computer Science, Dartmouth College,Hanover, NH 03755, USA.*Corresponding author. Email: [email protected]
S C I ENCE ADVANCES | R E S EARCH ART I C L E
Dressel and Farid, Sci. Adv. 2018;4 : eaao5580 17 January 2018 1 of 5
on February 6, 2018http://advances.sciencem
ag.org/D
ownloaded from
DeMichele et al., The Public Safety Assessment: A Re-Validation and Assessment of Predictive Utility and Differential Prediction by Race and Gender in Kentucky
lower risk score higher risk score
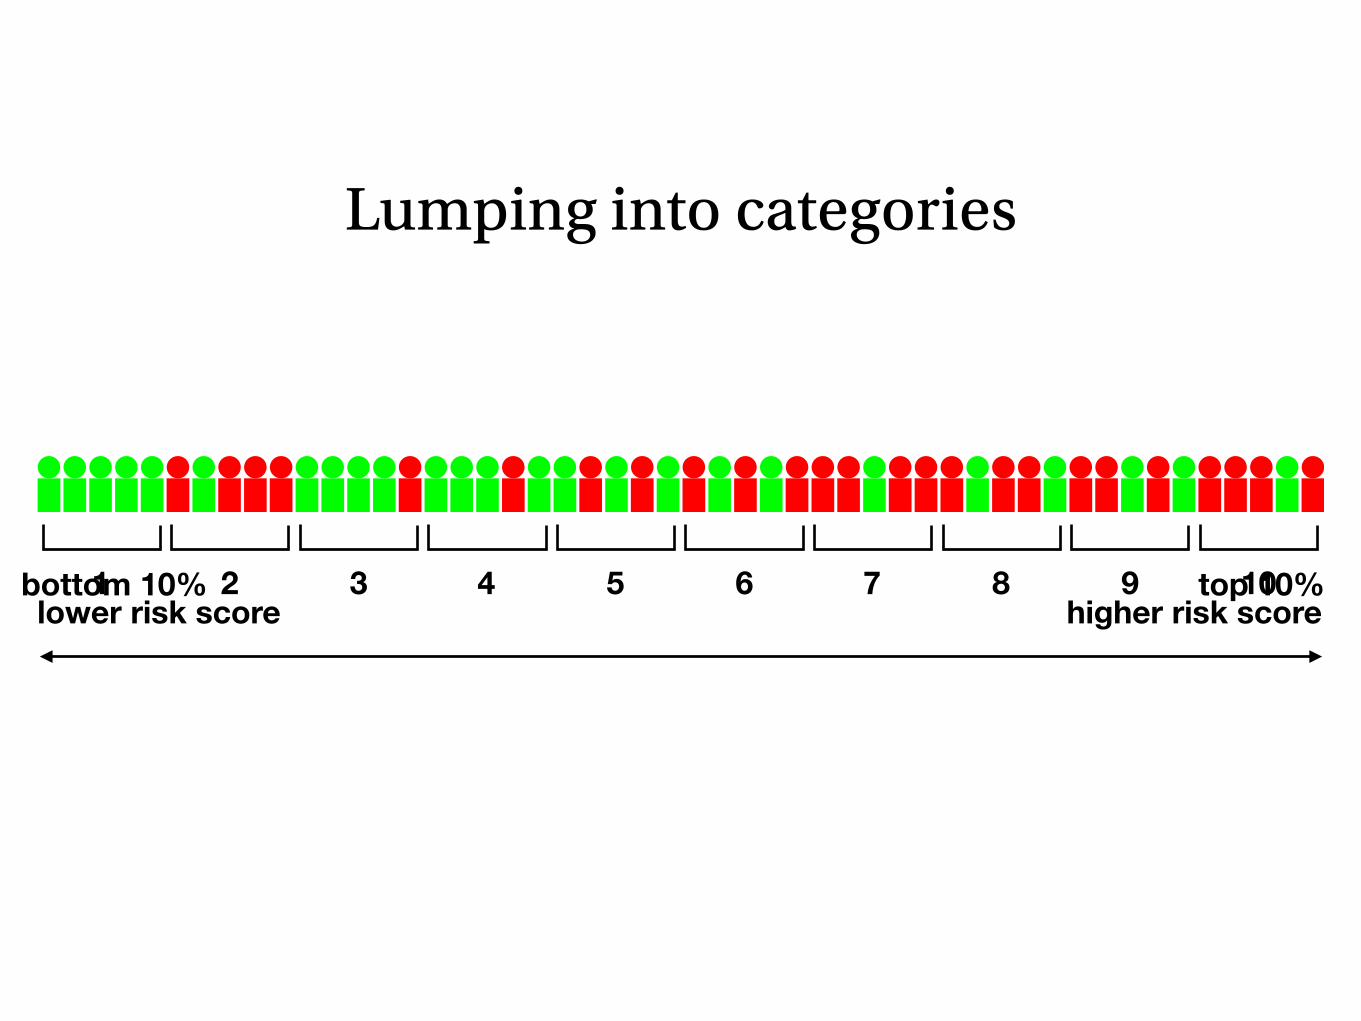
Lumping into categories
bottom 10% top 10%1 2 3 4 5 6 7 8 9 10
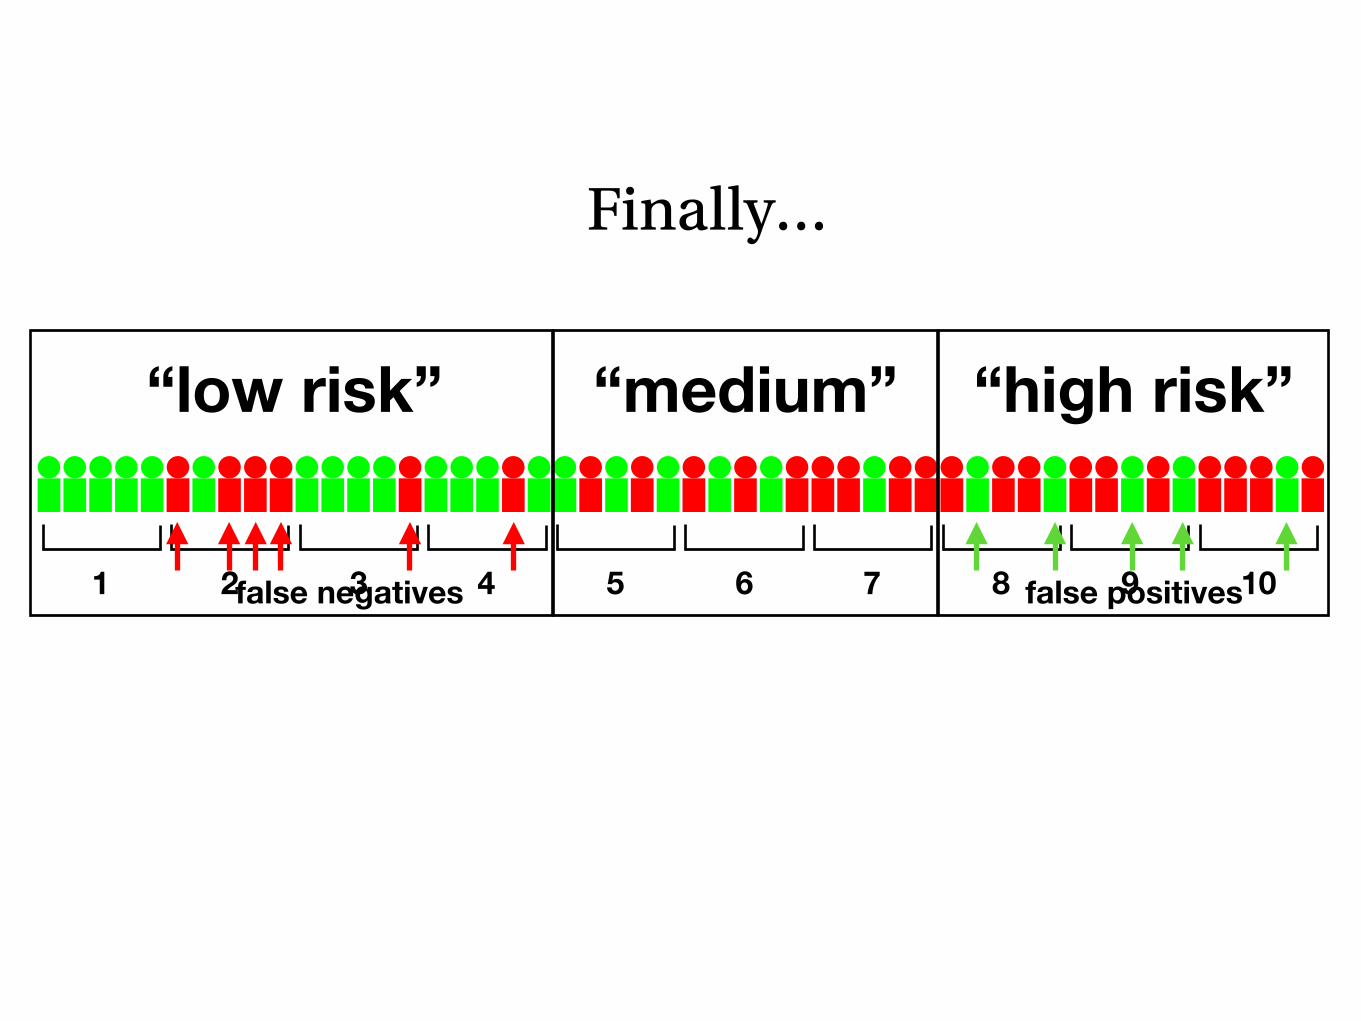
Finally…
1 2 3 4 5 6 7 8 9 10
“low risk” “medium” “high risk”
false positivesfalse negatives

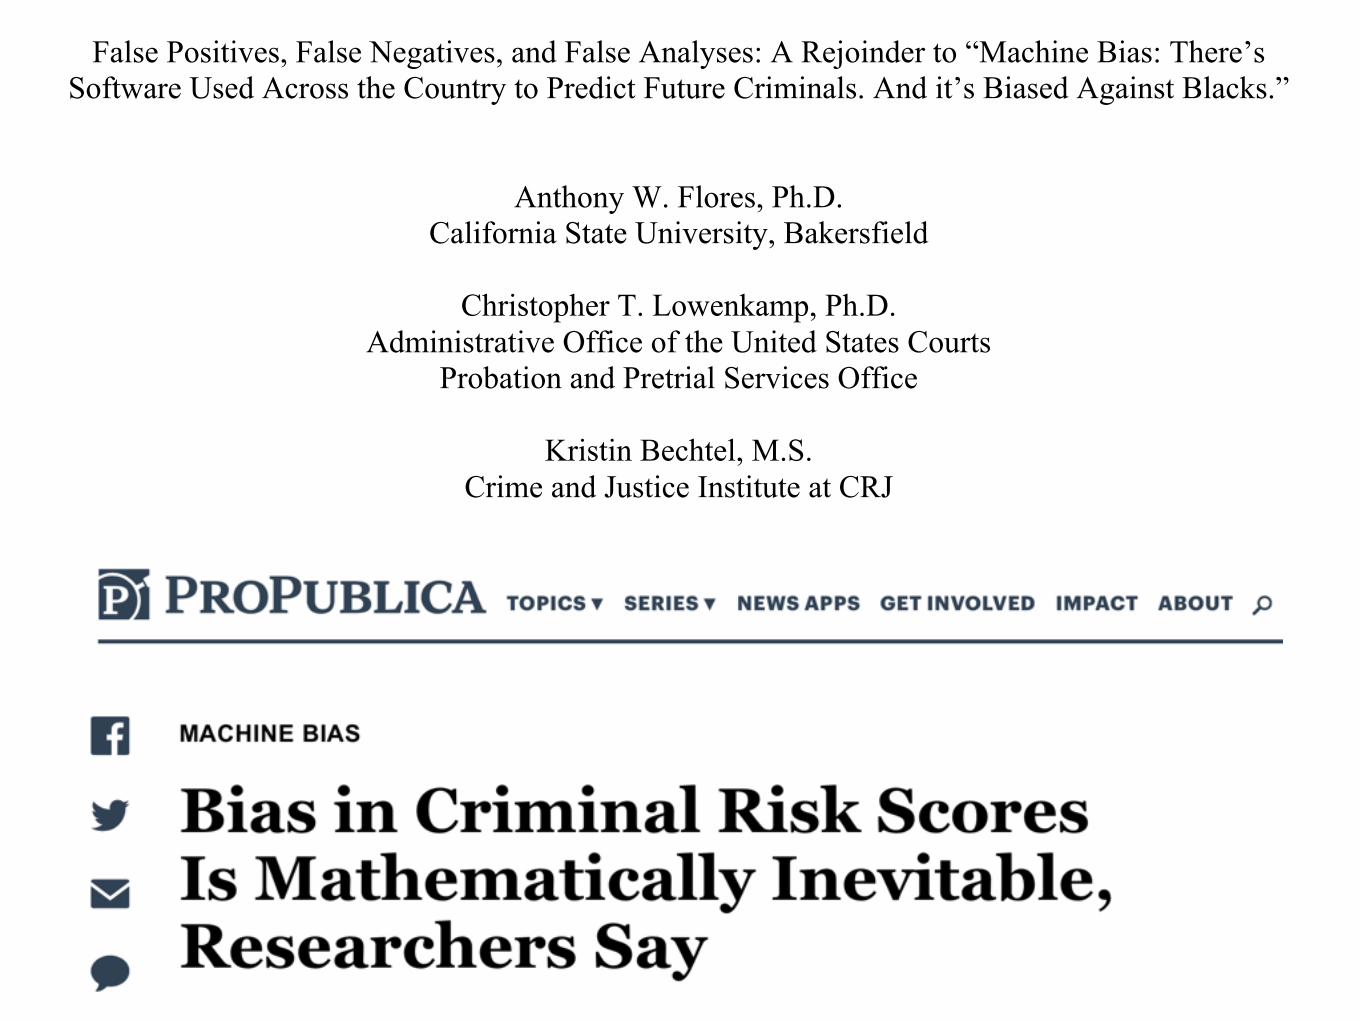
Fairness and the ProPublica Debate

1
False Positives, False Negatives, and False Analyses: A Rejoinder to “Machine Bias: There’s Software Used Across the Country to Predict Future Criminals. And it’s Biased Against Blacks.”
Anthony W. Flores, Ph.D. California State University, Bakersfield
Christopher T. Lowenkamp, Ph.D.
Administrative Office of the United States Courts Probation and Pretrial Services Office
Kristin Bechtel, M.S.
Crime and Justice Institute at CRJ
The authors wish to thank James Bonta, Francis Cullen, Edward Latessa, John Monahan, Ralph Serin, and Jennifer Skeem for their thoughtful comments and suggestions.


“low risk” “high risk”

“low risk” “high risk”

21/27=78% correct
“low risk” “high risk”

6/27=22% incorrect21/27=78% correct
“low risk” “high risk”
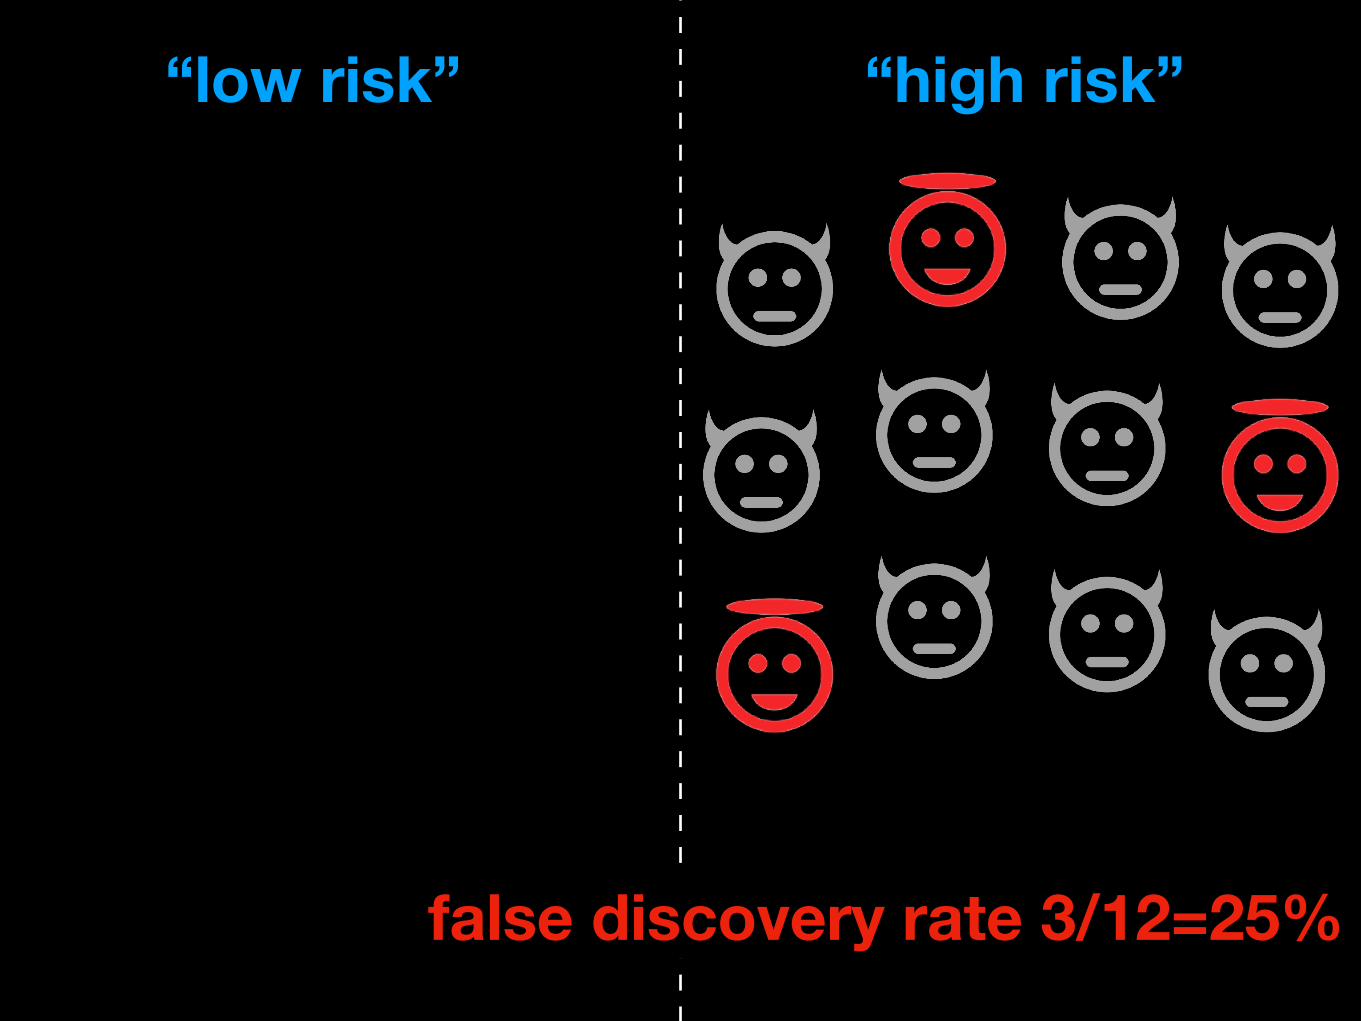
false discovery rate 3/12=25%
“low risk” “high risk”

false positive rate 3/15=20%
“low risk” “high risk”
false discovery rate 3/12=25%
“low risk” “high risk”
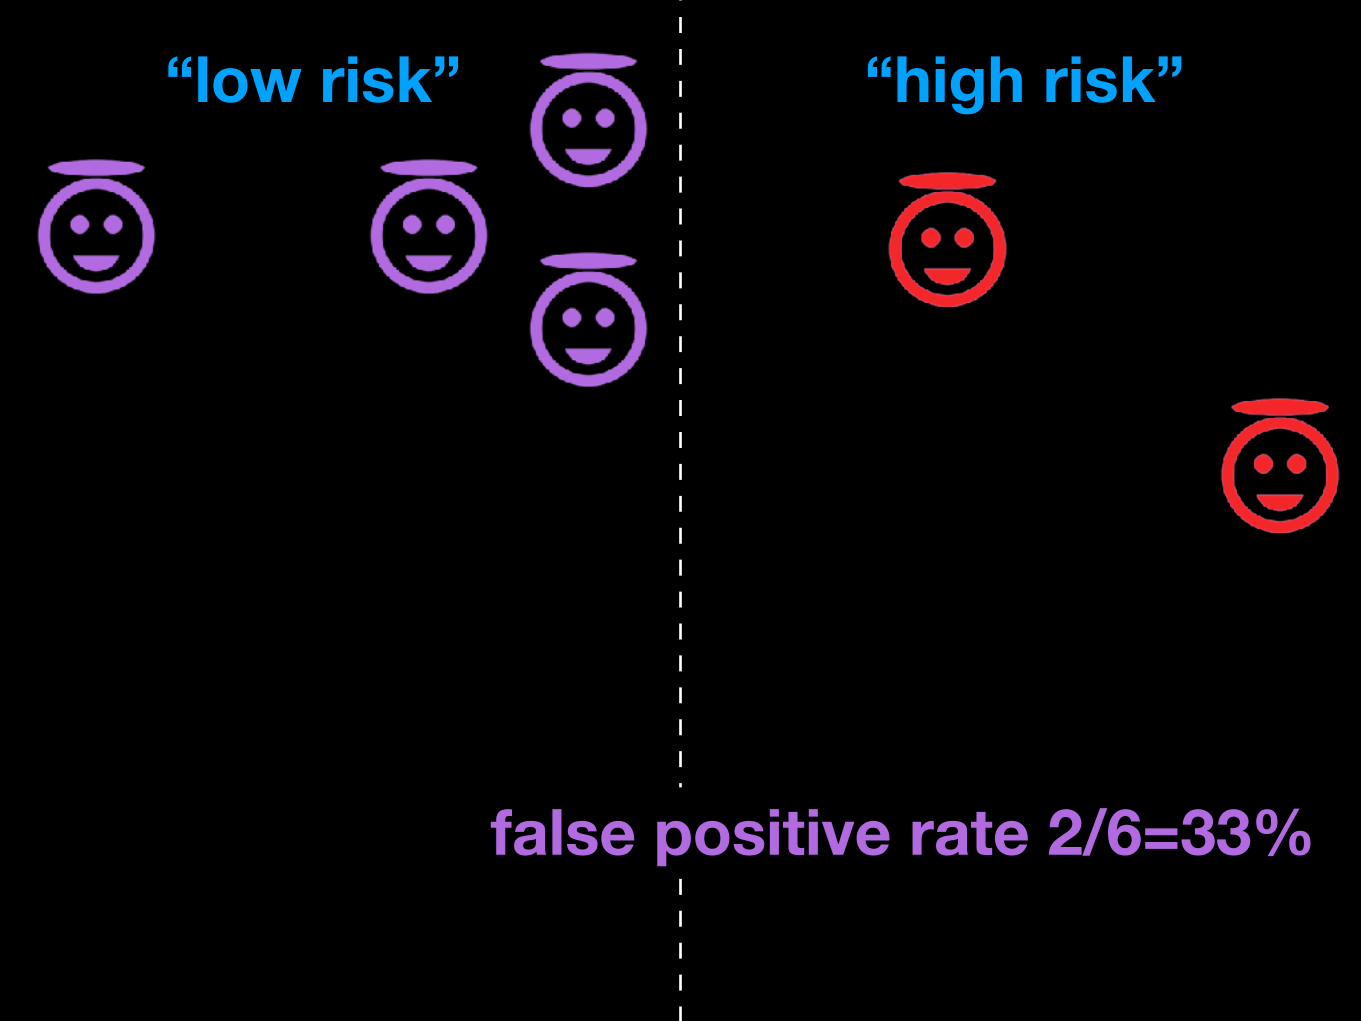
false positive rate 2/6=33%

false positive rate 2/6=33%
“low risk” “high risk”
false positive rate 1/9=11%

“low risk” “high risk”
false discovery rate 2/8=25%false discovery rate 1/4=25%
predictive parity

predictive parity
“low risk” “high risk”

predictive paritydisparate impact
“low risk” “high risk”

predictive paritydisparate impact
“low risk” “high risk”
Which definition of fairness is correct? It depends on your point of view…
Are you a judge or a defendant?

“low risk” “high risk”
Judge

Judge
“low risk”
Defendant
“high risk”
“low risk” “high risk”
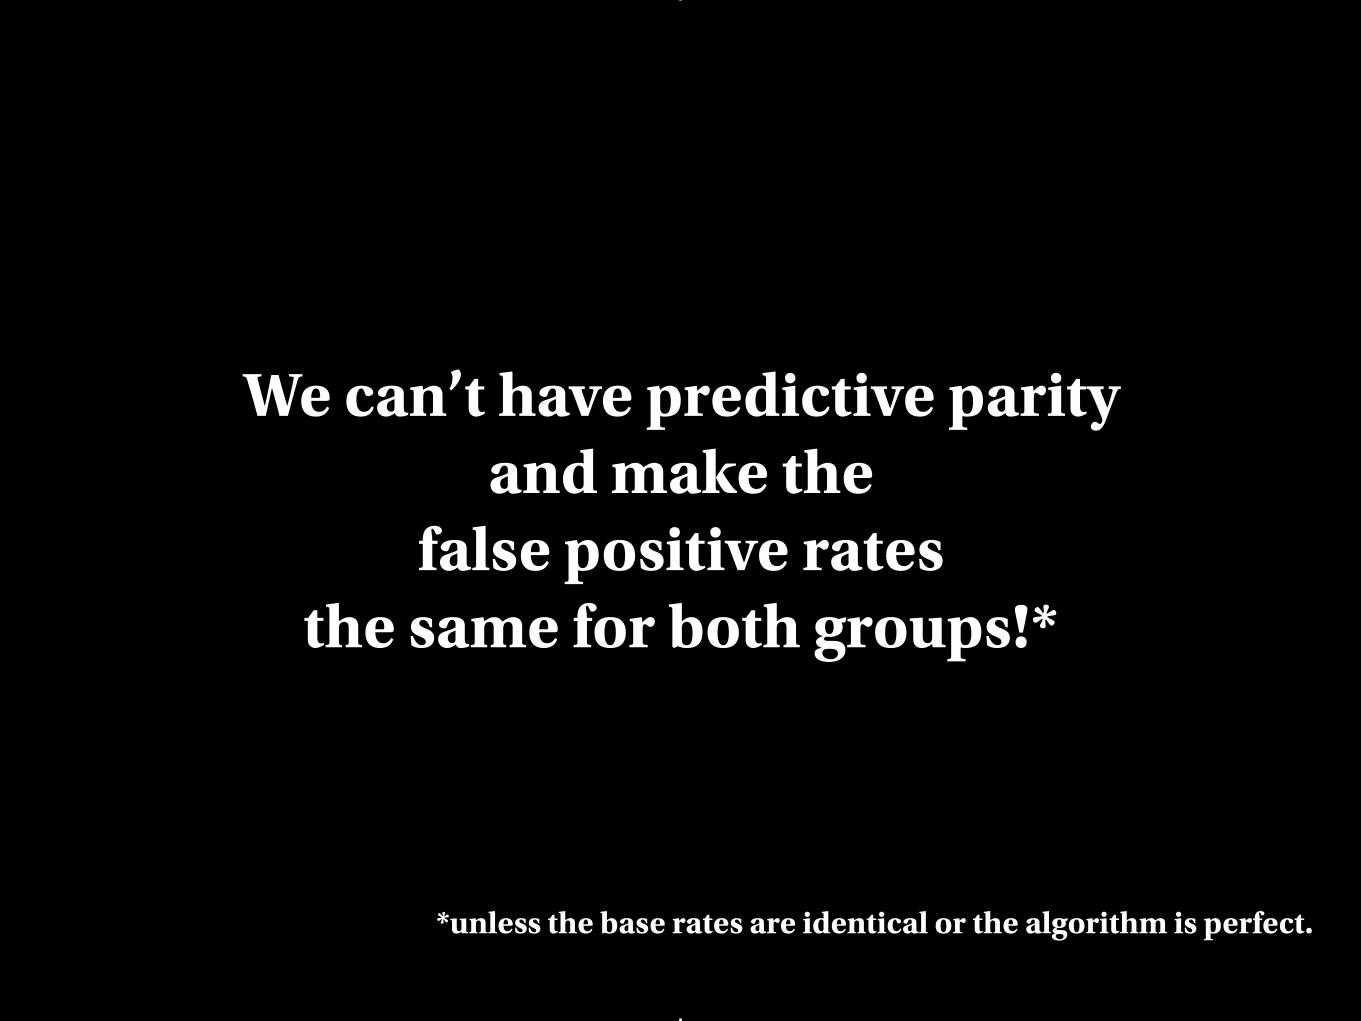
We can’t have predictive parity and make the
false positive rates the same for both groups!*
*unless the base rates are identical or the algorithm is perfect.

Where do we go from here?

Point #1: No Black Boxes
Should proprietary algorithms ever be used in the public sector?
Intellectual property is no excuse
Secrecy vs. security: voting machines
Need transparency throughout the pipeline:
How was the training data collected?
What kind of algorithm is it, and how was it trained?
Can anyone run it, reproduce it, explain it, or contest it?
Once it is deployed, how well does it work?
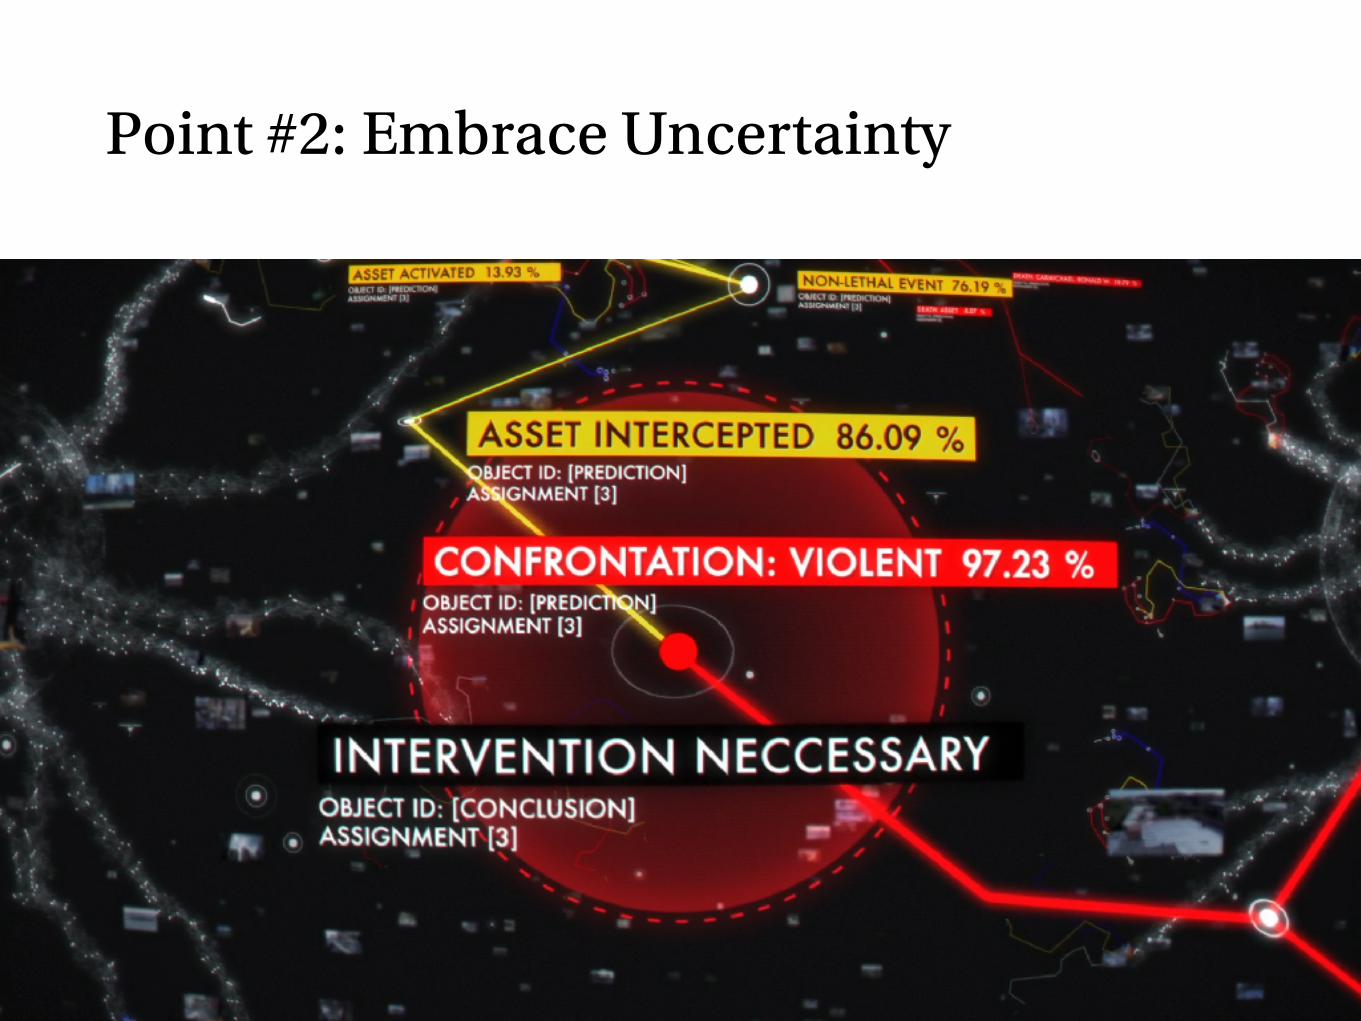
Point #2: Embrace Uncertainty

“In a sample in Kentucky from 2014-2015, 26% of defendants in this category were re-arrested before their trial,
and 3% were arrested for a violent offense. Studies of your local population are ongoing to see if
similar statistics hold locally”
should a judge see this:
Point #2: Embrace Uncertainty

Point #2: Embrace Uncertainty
or this:
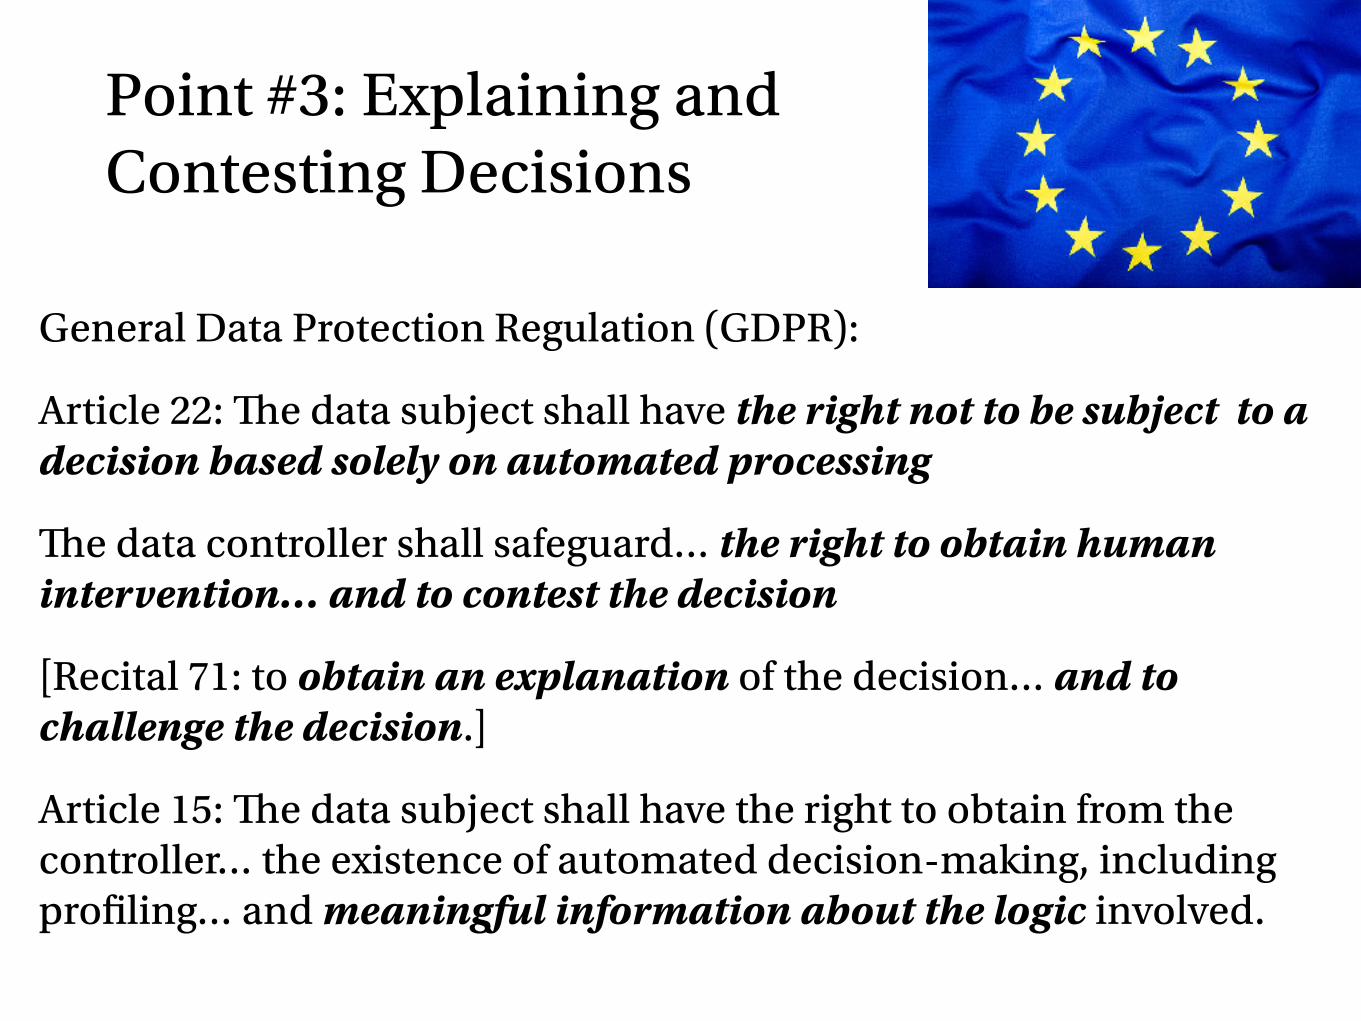
Point #3: Explaining and Contesting Decisions
General Data Protection Regulation (GDPR):
Article 22: The data subject shall have the right not to be subject to a decision based solely on automated processing
The data controller shall safeguard… the right to obtain human intervention… and to contest the decision
[Recital 71: to obtain an explanation of the decision… and to challenge the decision.]
Article 15: The data subject shall have the right to obtain from the controller… the existence of automated decision-making, including profiling… and meaningful information about the logic involved.

Not so clear for human decisions either…
Psychology: we make explanations up after the fact
Law: “preponderance of evidence”, “reasonable doubt”
But what is an explanation anyway?
DRAFT – Please ask permission before quoting 21 things—each assigned different point values.90 In a system like that, someone who comes up one point short could find himself with every factor listed as a “principal reason” for the denial. In one sense, this has to be correct because a positive change in any factor at all would change the outcome. But in another sense, choosing arbitrarily among equivalently valid reasons runs counter to the injunction to give specific and actionable notice.
Taylor also described a real system from that era, complex in all the various ways described in Part I: nonlinear, nonmonotonic, discontinuous, and multidimensional:
[A]pplicants who have lived at their present address for less than six months are awarded 39 points, a level which they could not reach again until they had maintained the same residence for seven and one-half years. Furthermore, applicants who have been residents for between six months and 1 year 5 months (30 points) are considered more creditworthy than those who have been residents for between 1 and 1/2 years and 3 years 5 months (27 points).91
If the creditor tried to explain simply, it would leave information out, but if the creditor were to explain in complete detail how the system worked, it would likely overwhelm a credit applicant. This is an equivalent problem to simply disclosing how a model works under the banner of transparency; access to the model is not the same as understanding.92 The Federal Reserve Board recognized this problem, observing that although all the principal reasons must be disclosed, “disclosure of more than four reasons is not likely to be helpful to the applicant.”93 The difficulty is that there will be situations where complexity cannot be avoided in a faithful representation of the scoring system, and listing factors alone will fail to accurately explain the decision, especially when limited to four.94 It is worth noting that modern credit systems appear not to be based on such complex models,95 likely due
90 Id. at 105-107. 91 Id. at 123. 92 See Ananny & Crawford, supra note 22, at 7 (“Transparency can intentionally
occlude.”) 93 12 C.F.R. Pt. 1002, Supp. I Para. 9(b)(2) (“Official Interpretations”). FCRA later
codified the same limitation. 15 U.S.C. 1681g(f)(1)(C). 94 The document also states that the “specific reasons . . . must relate to and accurately
describe the factors actually considered or scored by a creditor,” “[a] creditor need not describe how or why a factor adversely affected an applicant, and “[i]f a creditor bases the . . . adverse action on a credit scoring system, the reasons disclosed must relate only to those factors actually scored in the system.” Id.
95 Patrick Hall, Wen Phan & SriSatish Ambati, Ideas on Interpreting Machine Learning, O’REILLY (Mar 15, 2017), https://www.oreilly.com/ideas/ideas-on-interpreting-machine-learning

(a) Husky classified as wolf (b) Explanation
Figure 11: Raw data and explanation of a badmodel’s prediction in the “Husky vs Wolf” task.
Before After
Trusted the bad model 10 out of 27 3 out of 27Snow as a potential feature 12 out of 27 25 out of 27
Table 2: “Husky vs Wolf” experiment results.
to work well in the real world, (2) why, and (3) how dothey think the algorithm is able to distinguish between thesephotos of wolves and huskies. After getting these responses,we show the same images with the associated explanations,such as in Figure 11b, and ask the same questions.
Since this task requires some familiarity with the notion ofspurious correlations and generalization, the set of subjectsfor this experiment were graduate students who have taken atleast one graduate machine learning course. After gatheringthe responses, we had 3 independent evaluators read theirreasoning and determine if each subject mentioned snow,background, or equivalent as a feature the model may beusing. We pick the majority to decide whether the subjectwas correct about the insight, and report these numbersbefore and after showing the explanations in Table 2.Before observing the explanations, more than a third
trusted the classifier, and a little less than half mentionedthe snow pattern as something the neural network was using– although all speculated on other patterns. After examiningthe explanations, however, almost all of the subjects identi-fied the correct insight, with much more certainty that it wasa determining factor. Further, the trust in the classifier alsodropped substantially. Although our sample size is small,this experiment demonstrates the utility of explaining indi-vidual predictions for getting insights into classifiers knowingwhen not to trust them and why.
7. RELATED WORKThe problems with relying on validation set accuracy as
the primary measure of trust have been well studied. Practi-tioners consistently overestimate their model’s accuracy [20],propagate feedback loops [23], or fail to notice data leaks [14].In order to address these issues, researchers have proposedtools like Gestalt [21] and Modeltracker [1], which help usersnavigate individual instances. These tools are complemen-tary to LIME in terms of explaining models, since they donot address the problem of explaining individual predictions.Further, our submodular pick procedure can be incorporatedin such tools to aid users in navigating larger datasets.Some recent work aims to anticipate failures in machine
learning, specifically for vision tasks [3, 29]. Letting usersknow when the systems are likely to fail can lead to anincrease in trust, by avoiding “silly mistakes” [8]. Thesesolutions either require additional annotations and featureengineering that is specific to vision tasks or do not provideinsight into why a decision should not be trusted. Further-more, they assume that the current evaluation metrics arereliable, which may not be the case if problems such as dataleakage are present. Other recent work [11] focuses on ex-posing users to di↵erent kinds of mistakes (our pick step).Interestingly, the subjects in their study did not notice theserious problems in the 20 newsgroups data even after look-ing at many mistakes, suggesting that examining raw datais not su�cient. Note that Groce et al. [11] are not alone inthis regard, many researchers in the field have unwittinglypublished classifiers that would not generalize for this task.Using LIME, we show that even non-experts are able toidentify these irregularities when explanations are present.Further, LIME can complement these existing systems, andallow users to assess trust even when a prediction seems“correct” but is made for the wrong reasons.
Recognizing the utility of explanations in assessing trust,many have proposed using interpretable models [27], espe-cially for the medical domain [6, 17, 26]. While such modelsmay be appropriate for some domains, they may not applyequally well to others (e.g. a supersparse linear model [26]with 5� 10 features is unsuitable for text applications). In-terpretability, in these cases, comes at the cost of flexibility,accuracy, or e�ciency. For text, EluciDebug [16] is a fullhuman-in-the-loop system that shares many of our goals(interpretability, faithfulness, etc). However, they focus onan already interpretable model (Naive Bayes). In computervision, systems that rely on object detection to producecandidate alignments [13] or attention [28] are able to pro-duce explanations for their predictions. These are, however,constrained to specific neural network architectures or inca-pable of detecting “non object” parts of the images. Here wefocus on general, model-agnostic explanations that can beapplied to any classifier or regressor that is appropriate forthe domain - even ones that are yet to be proposed.
A common approach to model-agnostic explanation is learn-ing a potentially interpretable model on the predictions ofthe original model [2, 7, 22]. Having the explanation be agradient vector [2] captures a similar locality intuition tothat of LIME. However, interpreting the coe�cients on thegradient is di�cult, particularly for confident predictions(where gradient is near zero). Further, these explanations ap-proximate the original model globally, thus maintaining localfidelity becomes a significant challenge, as our experimentsdemonstrate. In contrast, LIME solves the much more feasi-ble task of finding a model that approximates the originalmodel locally. The idea of perturbing inputs for explanationshas been explored before [24], where the authors focus onlearning a specific contribution model, as opposed to ourgeneral framework. None of these approaches explicitly takecognitive limitations into account, and thus may producenon-interpretable explanations, such as a gradients or linearmodels with thousands of non-zero weights. The problembecomes worse if the original features are nonsensical tohumans (e.g. word embeddings). In contrast, LIME incor-porates interpretability both in the optimization and in ournotion of interpretable representation, such that domain andtask specific interpretability criteria can be accommodated.
Figure 3: Toy example to present intuition for LIME.The black-box model’s complex decision function f
(unknown to LIME) is represented by the blue/pinkbackground, which cannot be approximated well bya linear model. The bold red cross is the instancebeing explained. LIME samples instances, gets pre-dictions using f , and weighs them by the proximityto the instance being explained (represented hereby size). The dashed line is the learned explanationthat is locally (but not globally) faithful.
distance function D (e.g. cosine distance for text, L2 distancefor images) with width �.
L(f, g,⇡x
) =X
z,z
02Z
⇡
x
(z)�f(z)� g(z0)
�2(2)
For text classification, we ensure that the explanation isinterpretable by letting the interpretable representation bea bag of words, and by setting a limit K on the number ofwords, i.e. ⌦(g) = 11[kw
g
k0 > K]. Potentially, K can beadapted to be as big as the user can handle, or we couldhave di↵erent values of K for di↵erent instances. In thispaper we use a constant value for K, leaving the explorationof di↵erent values to future work. We use the same ⌦ forimage classification, using “super-pixels” (computed usingany standard algorithm) instead of words, such that theinterpretable representation of an image is a binary vectorwhere 1 indicates the original super-pixel and 0 indicates agrayed out super-pixel. This particular choice of ⌦ makesdirectly solving Eq. (1) intractable, but we approximate it byfirst selecting K features with Lasso (using the regularizationpath [9]) and then learning the weights via least squares (aprocedure we call K-LASSO in Algorithm 1). Since Algo-rithm 1 produces an explanation for an individual prediction,its complexity does not depend on the size of the dataset,but instead on time to compute f(x) and on the numberof samples N . In practice, explaining random forests with1000 trees using scikit-learn (http://scikit-learn.org) on alaptop with N = 5000 takes under 3 seconds without anyoptimizations such as using gpus or parallelization. Explain-ing each prediction of the Inception network [25] for imageclassification takes around 10 minutes.Any choice of interpretable representations and G will
have some inherent drawbacks. First, while the underlyingmodel can be treated as a black-box, certain interpretablerepresentations will not be powerful enough to explain certainbehaviors. For example, a model that predicts sepia-tonedimages to be retro cannot be explained by presence of absenceof super pixels. Second, our choice of G (sparse linear models)means that if the underlying model is highly non-linear evenin the locality of the prediction, there may not be a faithfulexplanation. However, we can estimate the faithfulness of
Algorithm 1 Sparse Linear Explanations using LIME
Require: Classifier f , Number of samples NRequire: Instance x, and its interpretable version x
0
Require: Similarity kernel ⇡x
, Length of explanation K
Z {}
for i 2 {1, 2, 3, ..., N} doz
0i
sample around(x0)Z Z [ hz
0i
, f(zi
),⇡x
(zi
)iend forw K-Lasso(Z,K) . with z
0i
as features, f(z) as targetreturn w
the explanation on Z, and present this information to theuser. This estimate of faithfulness can also be used forselecting an appropriate family of explanations from a set ofmultiple interpretable model classes, thus adapting to thegiven dataset and the classifier. We leave such explorationfor future work, as linear explanations work quite well formultiple black-box models in our experiments.
3.5 Example 1: Text classification with SVMsIn Figure 2 (right side), we explain the predictions of asupport vector machine with RBF kernel trained on uni-grams to di↵erentiate “Christianity” from “Atheism” (on asubset of the 20 newsgroup dataset). Although this classifierachieves 94% held-out accuracy, and one would be temptedto trust it based on this, the explanation for an instanceshows that predictions are made for quite arbitrary reasons(words “Posting”, “Host”, and “Re” have no connection toeither Christianity or Atheism). The word “Posting” appearsin 22% of examples in the training set, 99% of them in theclass “Atheism”. Even if headers are removed, proper namesof prolific posters in the original newsgroups are selected bythe classifier, which would also not generalize.After getting such insights from explanations, it is clear
that this dataset has serious issues (which are not evidentjust by studying the raw data or predictions), and that thisclassifier, or held-out evaluation, cannot be trusted. It is alsoclear what the problems are, and the steps that can be takento fix these issues and train a more trustworthy classifier.
3.6 Example 2: Deep networks for imagesWhen using sparse linear explanations for image classifiers,one may wish to just highlight the super-pixels with posi-tive weight towards a specific class, as they give intuitionas to why the model would think that class may be present.We explain the prediction of Google’s pre-trained Inceptionneural network [25] in this fashion on an arbitrary image(Figure 4a). Figures 4b, 4c, 4d show the superpixels expla-nations for the top 3 predicted classes (with the rest of theimage grayed out), having set K = 10. What the neuralnetwork picks up on for each of the classes is quite naturalto humans - Figure 4b in particular provides insight as towhy acoustic guitar was predicted to be electric: due to thefretboard. This kind of explanation enhances trust in theclassifier (even if the top predicted class is wrong), as it showsthat it is not acting in an unreasonable manner.
Counterfactual explanations: What if the input were different?
“Why Should I Trust You?”
Explaining the Predictions of Any Classifier
Marco Tulio Ribeiro
University of Washington
Seattle, WA 98105, USA
Sameer Singh
University of Washington
Seattle, WA 98105, USA
Carlos Guestrin
University of Washington
Seattle, WA 98105, USA
ABSTRACTDespite widespread adoption, machine learning models re-main mostly black boxes. Understanding the reasons behindpredictions is, however, quite important in assessing trust,which is fundamental if one plans to take action based on aprediction, or when choosing whether to deploy a new model.Such understanding also provides insights into the model,which can be used to transform an untrustworthy model orprediction into a trustworthy one.
In this work, we propose LIME, a novel explanation tech-nique that explains the predictions of any classifier in an in-terpretable and faithful manner, by learning an interpretablemodel locally around the prediction. We also propose amethod to explain models by presenting representative indi-vidual predictions and their explanations in a non-redundantway, framing the task as a submodular optimization prob-lem. We demonstrate the flexibility of these methods byexplaining di↵erent models for text (e.g. random forests)and image classification (e.g. neural networks). We show theutility of explanations via novel experiments, both simulatedand with human subjects, on various scenarios that requiretrust: deciding if one should trust a prediction, choosingbetween models, improving an untrustworthy classifier, andidentifying why a classifier should not be trusted.
1. INTRODUCTIONMachine learning is at the core of many recent advances inscience and technology. Unfortunately, the important roleof humans is an oft-overlooked aspect in the field. Whetherhumans are directly using machine learning classifiers as tools,or are deploying models within other products, a vital concernremains: if the users do not trust a model or a prediction,
they will not use it. It is important to di↵erentiate betweentwo di↵erent (but related) definitions of trust: (1) trusting a
prediction, i.e. whether a user trusts an individual predictionsu�ciently to take some action based on it, and (2) trustinga model, i.e. whether the user trusts a model to behave inreasonable ways if deployed. Both are directly impacted by
Permission to make digital or hard copies of all or part of this work for personal orclassroom use is granted without fee provided that copies are not made or distributedfor profit or commercial advantage and that copies bear this notice and the full citationon the first page. Copyrights for components of this work owned by others than theauthor(s) must be honored. Abstracting with credit is permitted. To copy otherwise, orrepublish, to post on servers or to redistribute to lists, requires prior specific permissionand/or a fee. Request permissions from [email protected].
KDD 2016 San Francisco, CA, USA
c� 2016 Copyright held by the owner/author(s). Publication rights licensed to ACM.ISBN 978-1-4503-4232-2/16/08. . . $15.00
DOI: http://dx.doi.org/10.1145/2939672.2939778
how much the human understands a model’s behaviour, asopposed to seeing it as a black box.
Determining trust in individual predictions is an importantproblem when the model is used for decision making. Whenusing machine learning for medical diagnosis [6] or terrorismdetection, for example, predictions cannot be acted upon onblind faith, as the consequences may be catastrophic.
Apart from trusting individual predictions, there is also aneed to evaluate the model as a whole before deploying it “inthe wild”. To make this decision, users need to be confidentthat the model will perform well on real-world data, accordingto the metrics of interest. Currently, models are evaluatedusing accuracy metrics on an available validation dataset.However, real-world data is often significantly di↵erent, andfurther, the evaluation metric may not be indicative of theproduct’s goal. Inspecting individual predictions and theirexplanations is a worthwhile solution, in addition to suchmetrics. In this case, it is important to aid users by suggestingwhich instances to inspect, especially for large datasets.
In this paper, we propose providing explanations for indi-vidual predictions as a solution to the “trusting a prediction”problem, and selecting multiple such predictions (and expla-nations) as a solution to the “trusting the model” problem.Our main contributions are summarized as follows.
• LIME, an algorithm that can explain the predictions of anyclassifier or regressor in a faithful way, by approximatingit locally with an interpretable model.
• SP-LIME, a method that selects a set of representativeinstances with explanations to address the “trusting themodel” problem, via submodular optimization.
• Comprehensive evaluation with simulated and human sub-jects, where we measure the impact of explanations ontrust and associated tasks. In our experiments, non-expertsusing LIME are able to pick which classifier from a pairgeneralizes better in the real world. Further, they are ableto greatly improve an untrustworthy classifier trained on20 newsgroups, by doing feature engineering using LIME.We also show how understanding the predictions of a neu-ral network on images helps practitioners know when andwhy they should not trust a model.
2. THE CASE FOR EXPLANATIONSBy“explaining a prediction”, we mean presenting textual or
visual artifacts that provide qualitative understanding of therelationship between the instance’s components (e.g. wordsin text, patches in an image) and the model’s prediction. Weargue that explaining predictions is an important aspect in
arX
iv:1
602.
0493
8v3
[cs.L
G]
9 A
ug 2
016
(a) Husky classified as wolf (b) Explanation
Figure 11: Raw data and explanation of a badmodel’s prediction in the “Husky vs Wolf” task.
Before After
Trusted the bad model 10 out of 27 3 out of 27Snow as a potential feature 12 out of 27 25 out of 27
Table 2: “Husky vs Wolf” experiment results.
to work well in the real world, (2) why, and (3) how dothey think the algorithm is able to distinguish between thesephotos of wolves and huskies. After getting these responses,we show the same images with the associated explanations,such as in Figure 11b, and ask the same questions.
Since this task requires some familiarity with the notion ofspurious correlations and generalization, the set of subjectsfor this experiment were graduate students who have taken atleast one graduate machine learning course. After gatheringthe responses, we had 3 independent evaluators read theirreasoning and determine if each subject mentioned snow,background, or equivalent as a feature the model may beusing. We pick the majority to decide whether the subjectwas correct about the insight, and report these numbersbefore and after showing the explanations in Table 2.Before observing the explanations, more than a third
trusted the classifier, and a little less than half mentionedthe snow pattern as something the neural network was using– although all speculated on other patterns. After examiningthe explanations, however, almost all of the subjects identi-fied the correct insight, with much more certainty that it wasa determining factor. Further, the trust in the classifier alsodropped substantially. Although our sample size is small,this experiment demonstrates the utility of explaining indi-vidual predictions for getting insights into classifiers knowingwhen not to trust them and why.
7. RELATED WORKThe problems with relying on validation set accuracy as
the primary measure of trust have been well studied. Practi-tioners consistently overestimate their model’s accuracy [20],propagate feedback loops [23], or fail to notice data leaks [14].In order to address these issues, researchers have proposedtools like Gestalt [21] and Modeltracker [1], which help usersnavigate individual instances. These tools are complemen-tary to LIME in terms of explaining models, since they donot address the problem of explaining individual predictions.Further, our submodular pick procedure can be incorporatedin such tools to aid users in navigating larger datasets.Some recent work aims to anticipate failures in machine
learning, specifically for vision tasks [3, 29]. Letting usersknow when the systems are likely to fail can lead to anincrease in trust, by avoiding “silly mistakes” [8]. Thesesolutions either require additional annotations and featureengineering that is specific to vision tasks or do not provideinsight into why a decision should not be trusted. Further-more, they assume that the current evaluation metrics arereliable, which may not be the case if problems such as dataleakage are present. Other recent work [11] focuses on ex-posing users to di↵erent kinds of mistakes (our pick step).Interestingly, the subjects in their study did not notice theserious problems in the 20 newsgroups data even after look-ing at many mistakes, suggesting that examining raw datais not su�cient. Note that Groce et al. [11] are not alone inthis regard, many researchers in the field have unwittinglypublished classifiers that would not generalize for this task.Using LIME, we show that even non-experts are able toidentify these irregularities when explanations are present.Further, LIME can complement these existing systems, andallow users to assess trust even when a prediction seems“correct” but is made for the wrong reasons.
Recognizing the utility of explanations in assessing trust,many have proposed using interpretable models [27], espe-cially for the medical domain [6, 17, 26]. While such modelsmay be appropriate for some domains, they may not applyequally well to others (e.g. a supersparse linear model [26]with 5� 10 features is unsuitable for text applications). In-terpretability, in these cases, comes at the cost of flexibility,accuracy, or e�ciency. For text, EluciDebug [16] is a fullhuman-in-the-loop system that shares many of our goals(interpretability, faithfulness, etc). However, they focus onan already interpretable model (Naive Bayes). In computervision, systems that rely on object detection to producecandidate alignments [13] or attention [28] are able to pro-duce explanations for their predictions. These are, however,constrained to specific neural network architectures or inca-pable of detecting “non object” parts of the images. Here wefocus on general, model-agnostic explanations that can beapplied to any classifier or regressor that is appropriate forthe domain - even ones that are yet to be proposed.
A common approach to model-agnostic explanation is learn-ing a potentially interpretable model on the predictions ofthe original model [2, 7, 22]. Having the explanation be agradient vector [2] captures a similar locality intuition tothat of LIME. However, interpreting the coe�cients on thegradient is di�cult, particularly for confident predictions(where gradient is near zero). Further, these explanations ap-proximate the original model globally, thus maintaining localfidelity becomes a significant challenge, as our experimentsdemonstrate. In contrast, LIME solves the much more feasi-ble task of finding a model that approximates the originalmodel locally. The idea of perturbing inputs for explanationshas been explored before [24], where the authors focus onlearning a specific contribution model, as opposed to ourgeneral framework. None of these approaches explicitly takecognitive limitations into account, and thus may producenon-interpretable explanations, such as a gradients or linearmodels with thousands of non-zero weights. The problembecomes worse if the original features are nonsensical tohumans (e.g. word embeddings). In contrast, LIME incor-porates interpretability both in the optimization and in ournotion of interpretable representation, such that domain andtask specific interpretability criteria can be accommodated.
Requires black-box access

Fourth, the court determines whether the defendant is charged with a No Early Release Act (NERA) crimenot addressed in step three. If so, the level of recommended conditions increases one level (from ROR torelease with PML 1; from PML 1 to PML 2 and so forth). If not, the preliminary recommendation is thefinal recommendation.28
Regardless of the risk assessment score or recommended release outcome, defense counsel should usethe statistics regarding public safety rates and court appearance rates to the client’s advantage. Explainingto a judge that an individual who scores two out of six on each scale has an 81% chance of returning tocourt and a 75% chance of staying out of trouble is more effective than simply pointing out the defendant’sPSA scores. For example, if a client scores a three on the Failure to Appear scale, defense counsel shouldargue, “Based on Mr. Smith’s PSA score alone, he has a predicted 75% court appearance rate.” That soundsmore persuasive than saying “Your honor, even though Mr. Smith scored a three, which is a moderaterisk level, the court appearance rate for that category is 75%.”
But as should be plainly apparent, the factors used to arrive at the PSA risk scores are derived from limitedsources. Where the PSA relies exclusively on administrative data such as the charge, the defendant’scriminal history, and the defendant’s court appearance history, defense attorneys must present courtswith a host of other information that might convince a judge that a defendant’s PSA scores do not reflectthe true extent of the defendant’s risk (or lack thereof). Note that just as defenders will argue that factsnot contained in the PSA should be considered to support their clients’ release, prosecutors may arguethat factors not contemplated by the PSA, such as petty disorderly persons convictions, ordinanceviolations, juvenile adjudications, and FTAs for those court events, counsel against release.
The new statutes grant strong deference to the recommendations of the Pretrial Services Program, andjudges may depart from the recommendation, but have to explain their reasons for doing so.29 Latersections of this Manual provide guidance for defense attorneys about getting appropriate informationfrom their clients and presenting that information persuasively to the court.
11
28. Id. at 34.29. N.J.S.A. 2A:16223 provides, “If the court enters an order that is contrary to a recommendation made in a risk assessment when determining a
method of release or setting release conditions, the court shall provide an explanation in the document that authorizes the eligible defendant’s release.”Judges may be hesitant, therefore, to depart from Pretrial Services recommendations, either due to fear of being held responsible for a defendant’smisconduct if they release on lesser conditions than recommended, or desire to avoid additional paperwork.
NCA 1 NCA 2 NCA 3 NCA 4 NCA 5 NCA 6
FTA 1
FTA 2
FTA 3
FTA 4
FTA 5
FTA 6
Marie VanNostrand, I!"#$%&'"($! "$ ")* P&+,(' S-.*"/ A00*001*!" -!% D*'(0($! M-2(!3 F#-1*4$#2: N*4 J*#0*/ (on file with the authors).Reforma5ed for this report.
ROR11.8% of popula!on
ROR7.7% of popula!on
ROR6.9% of popula!on
PML 111.7% of popula!on
PML 18.8% of popula!on
PML 11.5% of popula!on
PML 10.6% of popula!on
PML 12.0% of popula!on
PML 26.4% of popula!on
PML 26.0% of popula!on
PML 23.5% of popula!on
PML 20.4% of popula!on
PML 20.0% of popula!on
PML 30.1% of popula!on
PML 32.9% of popula!on
PML 34.8% of popula!on
PML 32.0% of popula!on
PML 3 + EM/HD2.4% of popula!on
Release Not Recommended
0.3% of popula!on
Release Not Recommended
1.8% of popula!on
Release Not Recommended
1.5% of popula!on
Release Not Recommended
0.9% of popula!on
Release Not Recommended
0.5% of popula!on
Release Not Recommended
0.1% of popula!on
ROR0.5% of popula!on
Point #4: Science and Politics “Decision making framework” turns scores into actions; chosen by District Attorney, Police Chiefs, Public Defenders…
But politicians might tweak framework, algorithm, or definitions (Santa Cruz, New Jersey lawsuit)
In the 80s Congress overrode sentencing reform: crack cocaine
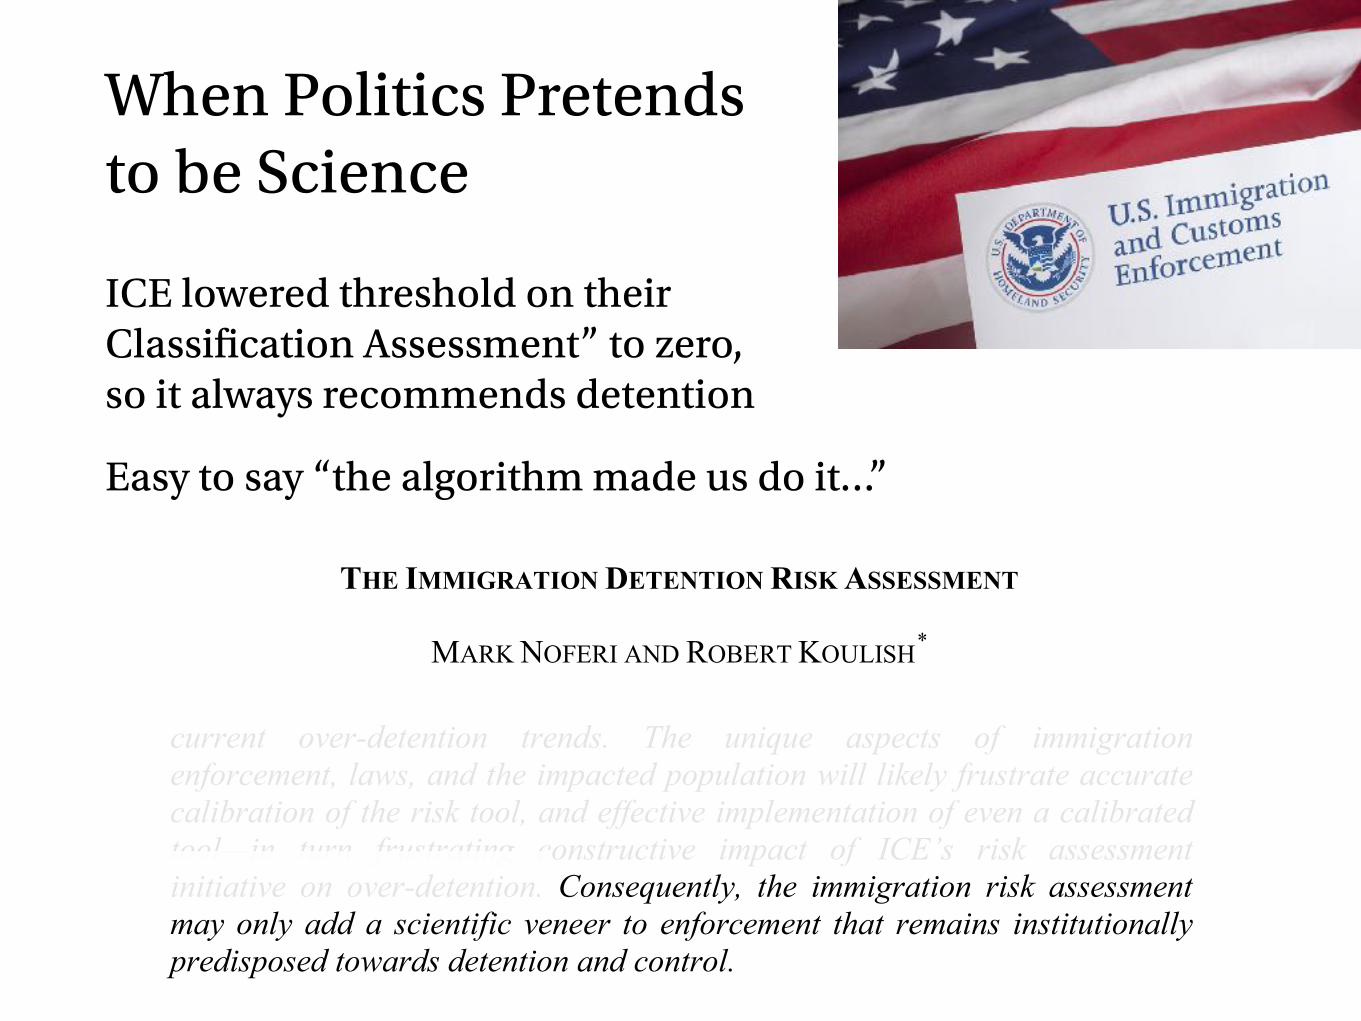
ICE lowered threshold on their “Risk Classification Assessment” to zero, so it always recommends detention
Easy to say “the algorithm made us do it…”
When Politics Pretends to be Science
Electronic copy available at: http://ssrn.com/abstract=2635652
DRAFT – Please do not cite without permission
45
THE IMMIGRATION DETENTION RISK ASSESSMENT
MARK NOFERI AND ROBERT KOULISH*
ABSTRACT
In early 2013, U.S. Immigration and Customs Enforcement (“ICE”)
deployed nationwide a new automated risk assessment tool to help determine whether to detain or release noncitizens pending their deportation proceedings. Adapted from similar evidence-based criminal justice reforms that have reduced pretrial detention, ICE’s initiative now represents the largest pre-hearing risk assessment experiment in U.S. history—potentially impacting over 400,000 individuals per year. However, to date little information has been released regarding the risk assessment algorithm, processes, and outcomes.
This article provides the first comprehensive examination of ICE’s risk assessment initiative, based on public access to ICE methodology and outcomes as a result of Freedom of Information Act requests. This article argues that immigration risk assessment in its current form will not reduce current over-detention trends. The unique aspects of immigration enforcement, laws, and the impacted population will likely frustrate accurate calibration of the risk tool, and effective implementation of even a calibrated tool—in turn frustrating constructive impact of ICE’s risk assessment initiative on over-detention. Consequently, the immigration risk assessment may only add a scientific veneer to enforcement that remains institutionally predisposed towards detention and control.
Additionally, this article argues that even if more accurate, evidence-based immigration detention were achieved under a future risk assessment regime, it would nonetheless likely be accompanied by several disadvantages. Particularly, risk assessment could facilitate a transition from mass detention to mass supervision of an even wider net of supervisees, by justifying lesser deprivations of liberty such as electronic supervision.
* Mark Noferi, Enforcement Fellow, American Immigration Council ([email protected]), J.D., Stanford Law School, B.A., Boston College; Robert Koulish, Research Associate Professor, University of Maryland’s Department of Government and Politics, Director of MLAW Programs (UMD’s Law and Society Program); Lecturer of Law at Carey School of Law ([email protected]), Ph.D., University of Wisconsin-Madison. Mr. Noferi acknowledges research assistants Setenay Akdag, Leslie Bailey, Mary Bruch, Sara Fraser, Beile Lindner, Rebecca McBride, Jonathan Myers, Alexandra Olsen, Elana Rodman, Alex O’Sullivan-Pierce, and Tobias Schad. Professor Koulish acknowledges research assistants Jose M. Cabezas, Michael Rosenberg, Paul Stern, Enzo Ferrogiaro, and Felipe Westhelle. We both acknowledge the provision of documents by the American Immigration Council (and specifically thank Beth Werlin, Melissa Crow and Emily Creighton), the University of Minnesota Law School’s Center for New Americans for collaboration and support (specifically Ben Casper, Linus Chan, Kate Evans, and Meghan Heesch), and the helpful comments of Jamie Lonzagel, Margaret Hu, and Allegra McLeod (the members of the 2014 Law and Society panel on risk assessment), as well as those of Ingrid Eagly, César Cuauhtémoc García Hernández, Cecelia Klingele, and Peter Margulies.

Point #5: Don’t Predict the Future, Change It
If we train algorithms on biased decisions, they will learn these biases, but give them a sheen of objectivity
“Tech-washing”
Algorithms should help us overcome our cognitive weaknesses, not encode them

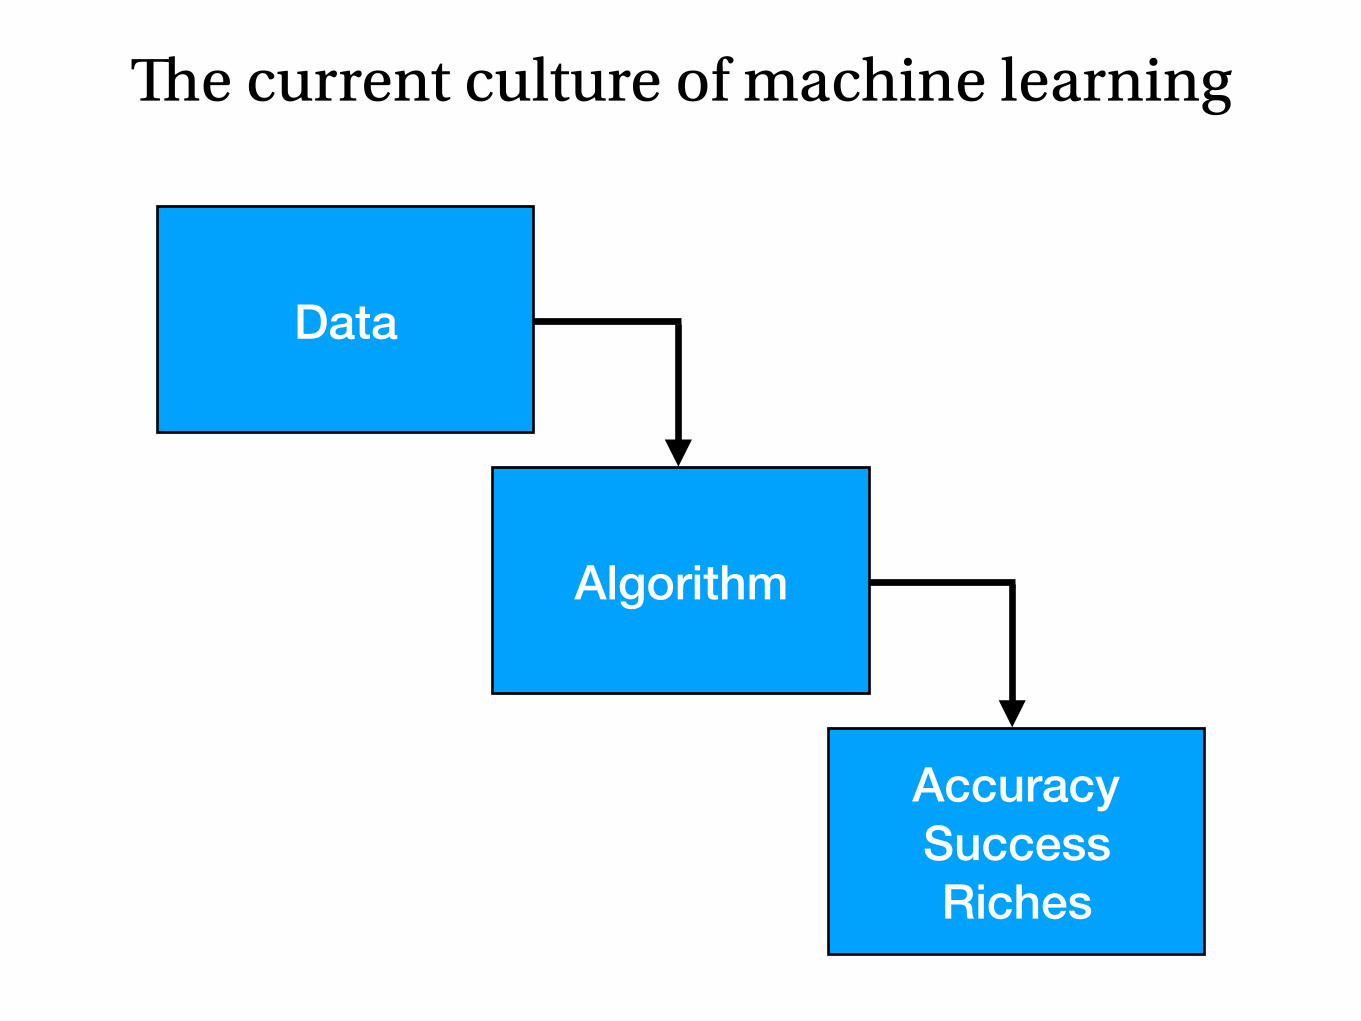
The current culture of machine learning
Accuracy Success Riches
Algorithm
Data
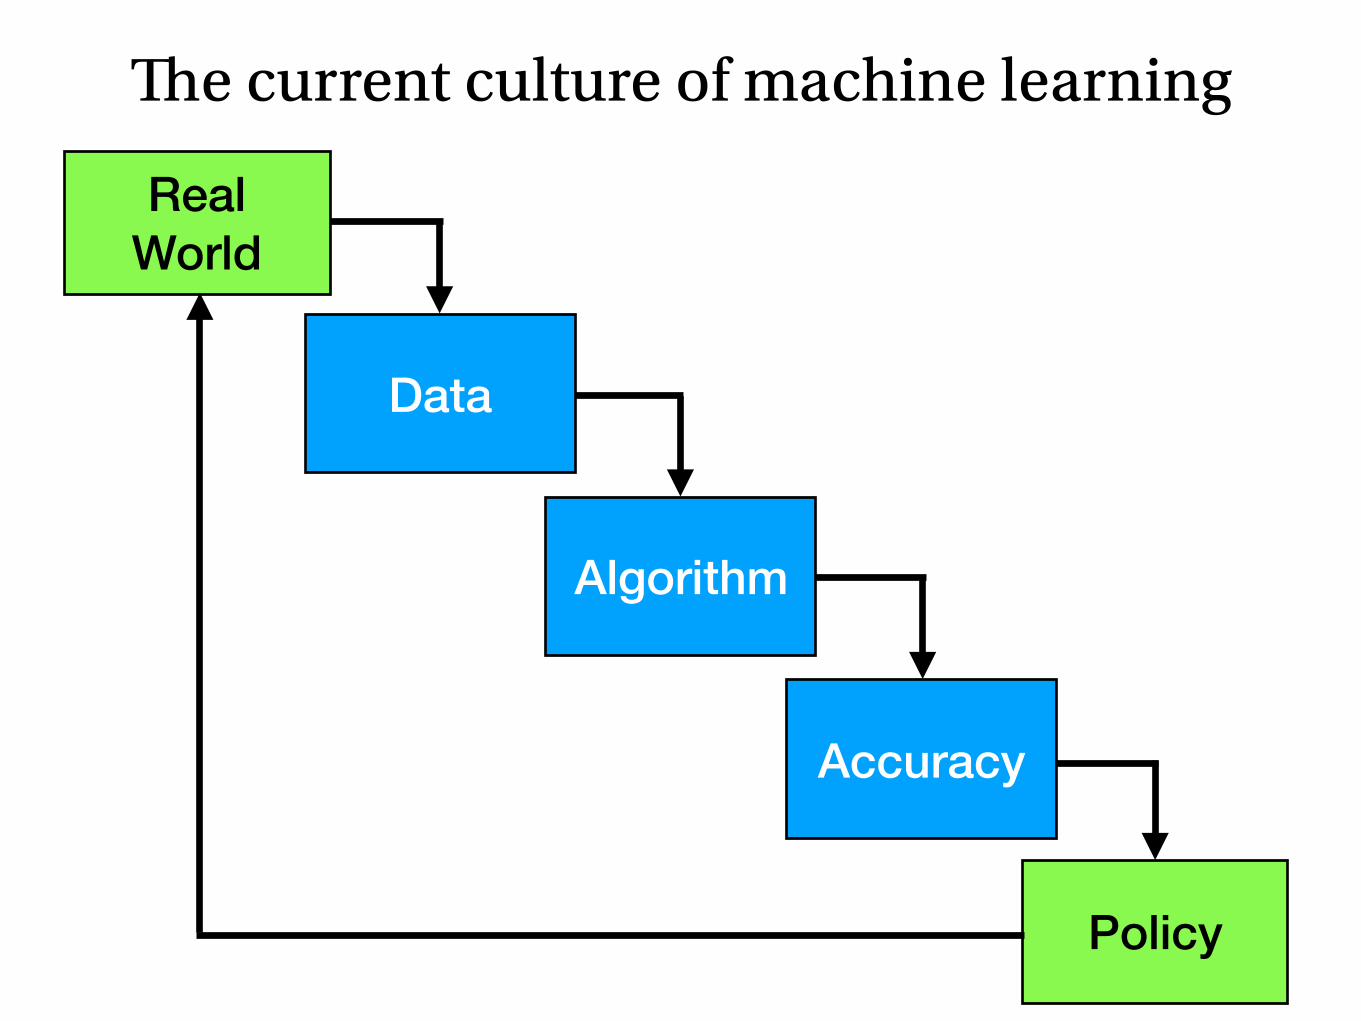
The current culture of machine learning
Policy
Accuracy
Algorithm
Data
Real World

Don’t reproduce the statistics of the past:
Make a better future