Data Acquisition for Flight Tests using Handheld GPS and Electronic Flight Instrument System
39
Data Acquisition for Flight Tests using Handheld GPS and Electronic Flight Instrument System A Senior Project presented to the Faculty of the Aerospace Engineering Department California Polytechnic State University, San Luis Obispo In Partial Fulfillment Of the Requirements for the Degree Bachelor of Science By Christopher Michael Gocha June, 2012 © 2012 Christopher Michael Gocha
Transcript of Data Acquisition for Flight Tests using Handheld GPS and Electronic Flight Instrument System

Data Acquisition for Flight Tests using Handheld GPS and Electronic Flight Instrument System
A Senior Project
presented to
the Faculty of the Aerospace Engineering Department
California Polytechnic State University, San Luis Obispo
In Partial Fulfillment
Of the Requirements for the Degree
Bachelor of Science
By
Christopher Michael Gocha
June, 2012
© 2012 Christopher Michael Gocha

Data Acquisition for Flight Tests using Handheld GPS and
Electronic Flight Instrument System
Christopher M. Gocha1
California Polytechnic State University, San Luis Obispo, CA, 93407
This paper addresses the data acquisition system designed in order to gather flight test
data for two different aircraft for the AERO flight test class at Cal Poly San Luis Obispo. It
summarizes the system, data acquisition devices, methods used, data comparison and
validation, and step-by-step procedures to properly gather data for reduction and analysis.
Also, the paper gives examples of initial data reduction processes and analysis. It provides a
simple MATLAB code that allows data to be extracted from a handheld GPS as well as a
procedure to gather data from a black box recorder in Cal Poly’s RV 7 aircraft. It also
explains the use of Google Earth in presenting flight data. Lastly, it investigates the use of
Smartphone sensors to gather data and explains why it is not viable solution.
I. Introduction
HE challenge of using GPS to gather flight test data is its poor data rate limitation and the inability to determine
the attitude of the aircraft. The GPS is limited to 1 Hz which brings problems with maneuvers that require a much
higher sampling rate. It is also limited to only giving a position and ground speed rather than attitude or acceleration
which most flight test maneuvers require. This paper attempts to solve these problems with these limitations.
Most modern flight tests use highly accurate inertial navigation system (INS) combined with GPS to solve the
navigation solution. Roll, pitch, and yaw rates as well as acceleration in X, Y, and Z are integrated over time to get
accurate attitude and position of the aircraft. With the GPS, the solution can be updated using a Kalman filter to rid
drifting errors within the inertial sensors. The data recording system is also more likely to be able to gather data at a
much higher rate. Because of the limitation of not being able to acquire a sophisticated system, a simple system
using a handheld GPS is developed. In addition to the handheld device, the system includes the use of a black box
recorder that is able to gather attitude data but is still limited to the same 1 Hz data rate.
1 Student, Aerospace Engineering, 1 Grand Ave San Luis Obispo CA, 93407.
T
II. Data Acquisition Devices and Integration
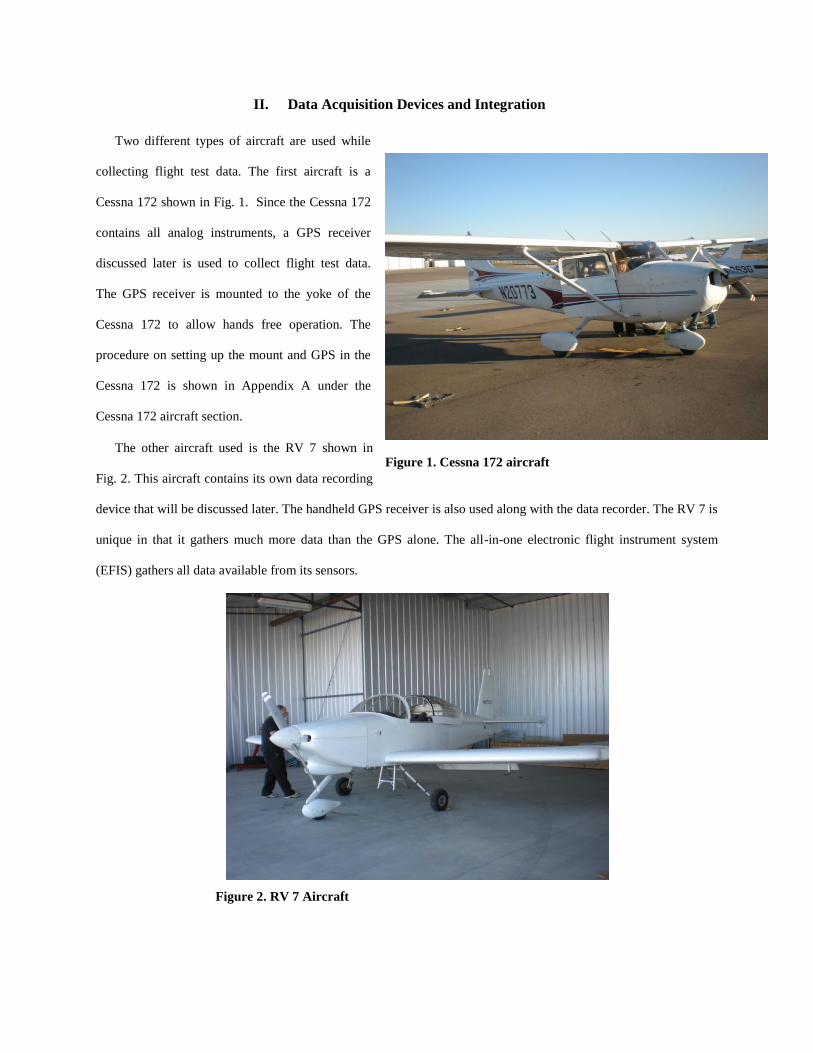
Two different types of aircraft are used while
collecting flight test data. The first aircraft is a
Cessna 172 shown in Fig. 1. Since the Cessna 172
contains all analog instruments, a GPS receiver
discussed later is used to collect flight test data.
The GPS receiver is mounted to the yoke of the
Cessna 172 to allow hands free operation. The
procedure on setting up the mount and GPS in the
Cessna 172 is shown in Appendix A under the
Cessna 172 aircraft section.
The other aircraft used is the RV 7 shown in
Fig. 2. This aircraft contains its own data recording
device that will be discussed later. The handheld GPS receiver is also used along with the data recorder. The RV 7 is
unique in that it gathers much more data than the GPS alone. The all-in-one electronic flight instrument system
(EFIS) gathers all data available from its sensors.
Figure 2. RV 7 Aircraft
Figure 1. Cessna 172 aircraft

The GPS used is Aviation quality Garmin
GPSMAP 495 as shown in Fig. 3. The 12 channel
GPS receiver is able to track locations over a period of
time. This feature allows one the ability to gather
flight test data, extract it from the device, and
subsequently save it onto a computer. The GPS has a
removable antenna, and a USB cable that allows the
device to interface with the computer. The extendable
antenna can replace the stock antenna to extend the
receiver to a visible location. The receiver contains
multiple functions and uses to allow pilots to correctly
navigate. Most functions are not used for the purpose
of gathering flight test data and will not be explained in detail. Refer to Appendix A for a step-by-step procedure on
how to gather data using the GPSMAP 495. The GPS receiver can be used in both the Cessna 172 and the RV 7.
The EFIS used for the RV 7 aircraft is the MGL Stratomaster Enigma system similar to what is shown in Fig. 4.
This system automatically records flights
and saves them to an external SD data card.
This card can be placed into a computer
and recorded flights can be extracted. This
system has the added benefit of recording
much more data than a handheld GPS. The
system has its own GPS receiver and
several other systems that are useful for
flight tests. The EFIS contains an Attitude
Heading Reference System (AHRS) that
gathers information on bank, pitch, and
yaw angle of the aircraft. It also gathers
Figure 3. Garmin GPSMAP 495
Figure 4. MGL Stratomaster Enigma EFIS system

useful air data such as Baro altitude, vertical speed, and true airspeed. All
this data is also limited to the same 1 Hz data rate. See Appendix B for a full
detailed procedure on how to use the EFIS in the RV 7 to extract data.
The last method to acquire data is the use of a Smartphone. Most modern
Smartphone’s contain accelerometers, rate gyros, magnetometer, and a GPS
receiver. Some free applications allow access to these sensors and record it
to a text file. The particular Smartphone used for this data acquisition system
is a Motorola Atrix 4G similar to that shown in Fig. 5 loaded with a free data
recording application. This device is desirable since it is able to record at a
much higher rate between 1 and 10 Hz. Additionally, the interface is simple
and easy to transfer to a computer. But this method of data collection comes
with many challenges. The device is sensitive to placement and must be
mounted and strapped down to the aircraft. Also, it needs to be aligned to the
aircraft’s centerline and placed where it is able to receive GPS signal. The engine adds additional noise to the data
from vibration and from magnetic interference. All these must be considered and addressed if this method is to be
used properly.
III. Post Flight Data Extraction Methods
The following section describes the file input/output process, file formats, example outputs, as well as an
overview of a developed MATLAB code that reads in Garmin GPS text file data and the use of Google Earth for
data presentation.
A. GPS data extraction using MATLAB
One of the main challenges in extracting data from the GPSMAP 495 is organizing the data into a readable and
easily presentable format. MATLAB is an excellent tool that is able to not only post-process the data, but also has
the ability to filter through complicated text file formats. A MATLAB function was developed to eliminate this
problem of a non-standard text file that contains many characters and header lines. Figure 6 shows an example of the
Garmin GPSMAP output text. The MATLAB function developed is easy to use and requires only one input to the
function. The input must be a character string of the exact file name of the GPS text file including the file extension.
Figure 5. Motorola Atrix 4G
Smartphone

The output of the function is all the numeric data presented in the text file organized in a data structure by their
respected names. MATLAB data structures are used to eliminate the need for having multiple outputs to the
function, allowing the user to only require
one output. It is recommended to learn how
to use MATLAB data structures prior to
using this function. An example of the
MATLAB syntax to call this function is
shown,
DATA =
importmygps('GPS_text.txt');,
and the output “DATA” is the data structure
which contains multiple variable fields.
Double-clicking on the “DATA” variable in
MATLAB will open the variable editor and
allow the user to see the available fields. An
example of the variables available for use is
shown in Fig. 7. To access a field in the data structure, the user can simply use the syntax, DATA.lon, to gather all
longitudes recorded during the flight test. Most of the fields within the data structure are self explanatory. Important
to note that all units are English Standard (ft, mi, etc.) and all
units are presented in the text file. The “length” field is the
distance traveled in the given time interval (usually 1
second). The “speed” field is the average speed in that 1
second time frame. Several time variables are presented. The
“legtime” field is the time interval and is, for the most part,
always 1 second. The “inctime” field sums the previous
times to an array of time elapsed. Lastly, “serialtime” is the
standard time recorded from a datum and incorporates the
date within the time keeping process. This is useful for data
Figure 6. Garmin GPSMAP 495 example text file
Figure 7. MATLAB's variable editor of data
available from the Garmin GPSMAP 495
lineup with other devices and will be shown later. Refer to MATLAB’s help documentation to explain serial time in
detail as well as using data structures. The developed MATLAB function “importmygps.m” is shown in Appendix C
and can be copied and pasted into MATLAB to run the function.
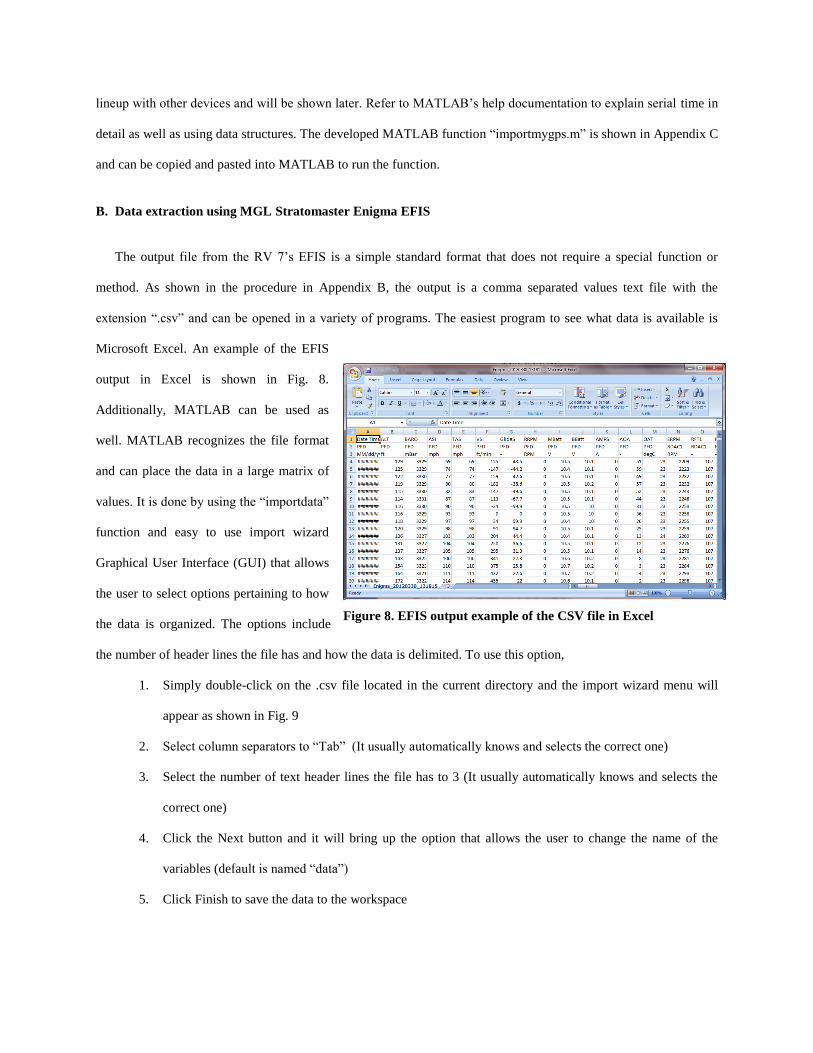
B. Data extraction using MGL Stratomaster Enigma EFIS
The output file from the RV 7’s EFIS is a simple standard format that does not require a special function or
method. As shown in the procedure in Appendix B, the output is a comma separated values text file with the
extension “.csv” and can be opened in a variety of programs. The easiest program to see what data is available is
Microsoft Excel. An example of the EFIS
output in Excel is shown in Fig. 8.
Additionally, MATLAB can be used as
well. MATLAB recognizes the file format
and can place the data in a large matrix of
values. It is done by using the “importdata”
function and easy to use import wizard
Graphical User Interface (GUI) that allows
the user to select options pertaining to how
the data is organized. The options include
the number of header lines the file has and how the data is delimited. To use this option,
1. Simply double-click on the .csv file located in the current directory and the import wizard menu will
appear as shown in Fig. 9
2. Select column separators to “Tab” (It usually automatically knows and selects the correct one)
3. Select the number of text header lines the file has to 3 (It usually automatically knows and selects the
correct one)
4. Click the Next button and it will bring up the option that allows the user to change the name of the
variables (default is named “data”)
5. Click Finish to save the data to the workspace
Figure 8. EFIS output example of the CSV file in Excel

C. Data presentation using Google Earth
The use of Google Earth to present the recorded flight is a powerful tool that allows the user to observe problems
during the flight, identify outliers in the GPS data, and mark points in the flight path of where maneuvers occurred.
This, along with a video recording, provides a complete summary of the flight test.
Google Earth accepts two file types. The Garmin Database file with the extension “.gdb” and Google Earth files
with the extension “.kml” which both can be opened and displayed. As mentioned before, the Garmin GPSMAP 495
outputs Garmin Database files. The EFIS can save Google Earth files directly through the use of the Enigma Black
Box Viewer as shown in Appendix B. The limitation of using Google Earth files is that the speed information does
not get saved to the track like Garmin Database files. It is recommended to use the .gdb file to present the data
within Google Earth.
IV. Flight Test Results
After investigating the process for collecting data and loading the results onto the computer, the procedure is
performed on the system and is tested in both aircraft. Multiple tests were conducted and the data verified with the
predicted flight path and were compared against each device used. This section outlines the results from those tests.
Figure 9. Example of importing CSV files into MATLAB

A. RV 7 Flight Test Using Garmin GPSMAP 495 and Smartphone
The first flight test conducted in the RV 7 was a simple taxi and takeoff and land while remaining in the pattern.
The GPSMAP 495 and the Smartphone sensors were used for this flight. First, the data from the Garmin GPS is
presented using Google Earth and is shown in Fig. 10. An elevation profile can be created and shown in Google
Earth. This allows the user to investigate the profile to insure that no outliers exist that may have been caused by
poor GPS signal. Speed and altitude information are displayed in the elevation profile in Google Earth.
The next step is a comparison of the GPS receivers in the Smartphone and Garmin devices. Since the antennas
are placed at different locations in the aircraft, a slight difference between the two receivers is expected. The latitude
and longitude from both devices is plotted on top for comparison and shown in Fig. 11. The Garmin GPS tracked the
path correctly without any problems. The Smartphone’s receiver had major trouble tracking when the aircraft
engaged in a turn. Since the antenna in the Smartphone is located internally, when the aircraft banks the wing of the
aircraft blocks a portion of the sky and disrupts the GPS signal. Because of these problems, it is recommended that
the Smartphone is placed carefully within the aircraft in order to mitigate this problem.
Figure 10. Google Earth presentation of RV 7 flight test while flying one traffic pattern
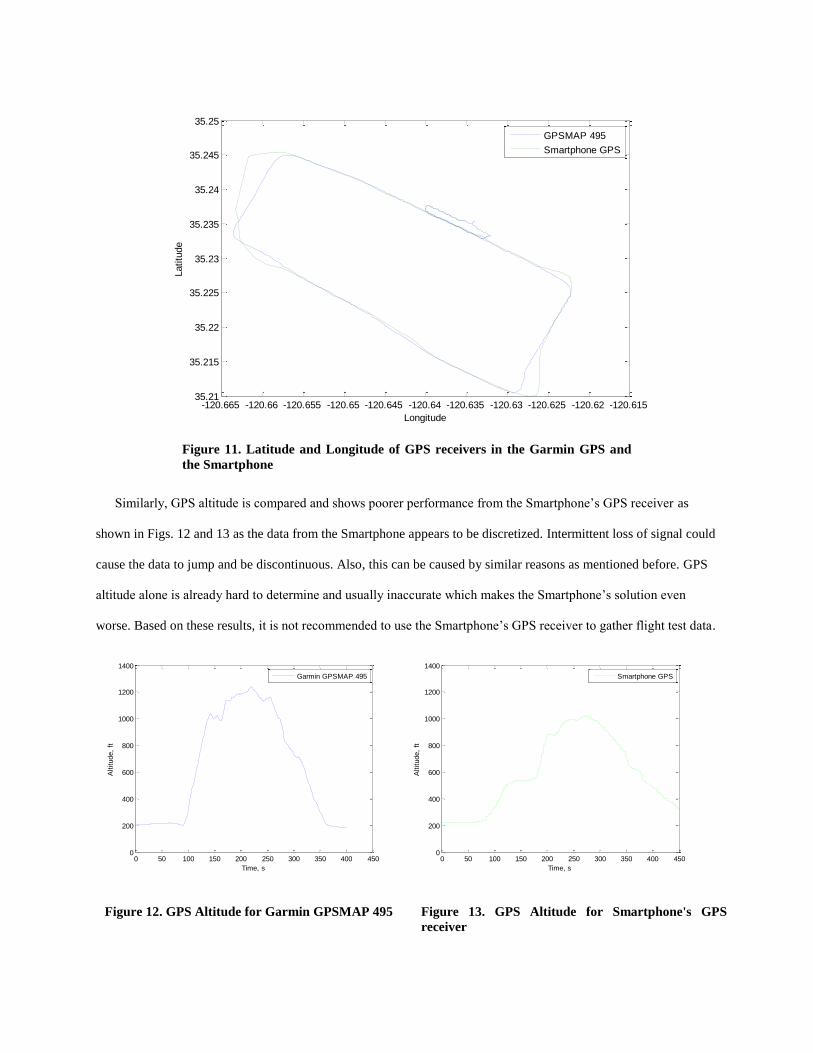
Similarly, GPS altitude is compared and shows poorer performance from the Smartphone’s GPS receiver as
shown in Figs. 12 and 13 as the data from the Smartphone appears to be discretized. Intermittent loss of signal could
cause the data to jump and be discontinuous. Also, this can be caused by similar reasons as mentioned before. GPS
altitude alone is already hard to determine and usually inaccurate which makes the Smartphone’s solution even
worse. Based on these results, it is not recommended to use the Smartphone’s GPS receiver to gather flight test data.
-120.665 -120.66 -120.655 -120.65 -120.645 -120.64 -120.635 -120.63 -120.625 -120.62 -120.61535.21
35.215
35.22
35.225
35.23
35.235
35.24
35.245
35.25
Longitude
Latitu
de
GPSMAP 495
Smartphone GPS
0 50 100 150 200 250 300 350 400 4500
200
400
600
800
1000
1200
1400
Altitude,
ft
Time, s
Garmin GPSMAP 495
0 50 100 150 200 250 300 350 400 4500
200
400
600
800
1000
1200
1400
Time, s
Altitude,
ft
Smartphone GPS
Figure 11. Latitude and Longitude of GPS receivers in the Garmin GPS and
the Smartphone
Figure 12. GPS Altitude for Garmin GPSMAP 495 Figure 13. GPS Altitude for Smartphone's GPS
receiver

Along with the GPS receiver, the Smartphone recorded information from the accelerometers and magnetometers
to gather inertial data at a 10 Hz data rate. The results of the accelerometer data from the same flight are shown in
Fig. 14. The results show extreme noisy data that is unacceptable. The worst noise occurs in the vertical
acceleration. Although the average of the vertical acceleration occurs around 10 m/s and is expected since it was
mostly a 1G flight, the sensor was not able to gain steady measurements within the flight. Engine vibration and
unsteady flight conditions could create this range of accelerations. Likely the cause is the poor accelerometers
themselves. Smartphone accelerometers are not designed for this type of task but rather to run simple applications to
determine basic orientation of the device.
Similarly, the orientation sensors
(magnetometers) are recorded on the
Smartphone device. The results from the
magnetometers on the same flight pattern
are shown in Fig. 15. The data shows
very noisy and undeterminable results.
The orientation in the x-direction, which
is similar to the magnetic heading, had a
lot of interference during the first 100
seconds of the flight. It is expected that
during the first 100 seconds, the
orientation in x should be runway heading
which is around 290 degrees. The results
show the orientation around north,
jumping between 5 degrees and 355
degrees.
0 100 200 300 400 500 600-5
0
5
10
15
20
Time, s
Accele
ration,
m/s
2
acc-x
acc-y
acc-z
Figure 14. Accelerometer Data from flight test on Smartphone
Device
Figure 15. Magnetometer Data from flight test on Smartphone
Device
0 100 200 300 400 500 600-50
0
50
100
150
200
250
300
350
400
Time, s
Orienta
tion,
degre
es
orien-x
orien-y
orien-z

B. RV 7 Flight test Comparing Garmin GPSMAP 495 and EFIS
During this flight, three traffic patterns are conducted at San Luis Obispo Regional airport. The data is collected
using the RV 7 aircraft. Both the Garmin GPSMAP 495 and EFIS recorder are used. The data is recorded and
displayed again using Google Earth as shown in Fig. 16.
The GPS receivers on both the handheld
GPS and the EFIS are compared and verified.
Latitude and Longitude are plotted
simultaneously for comparison. The results are
shown in Fig. 17. Both devices track the flight
quite well. The results from the EFIS GPS and
Garmin are almost exactly the same. The slight
differences between the two sets are due to
antenna position. The Garmin GPS’s antenna
is located on the windshield and to the right
Figure 16. Google Earth presentation of RV 7 flight test while flying 3 traffic patterns
-120.68 -120.67 -120.66 -120.65 -120.64 -120.63 -120.62 -120.6135.2
35.205
35.21
35.215
35.22
35.225
35.23
35.235
35.24
35.245
35.25
Longitude
Latitu
de
Garmin GPSMAP 495
EFIS GPS
Figure 17. Latitude and Longitude of GPS receivers in the Garmin
GPS and the EFIS

as shown in the procedure in Appendix A. The EFIS GPS’s antenna is located along the centerline and on top of the
dashboard of the aircraft. Although the distance between these two antennas is less than 3 feet, it can cause a small
difference in the data. Unlike the Smartphone’s GPS receiver, the EFIS GPS receiver is much more accurate and
similar to the Garmin GPSMAP 495. Based on these results, it is recommended to use both to gather flight test data.
In order to line up the two data sets, serial time is used from the time stamps given from both methods. The
results from this, using longitude, are shown in Fig. 18. It shows that the data does not match up with time. The
cause of this could be that Garmin GPSMAP 495 does not take daylight savings time into consideration so the
difference between the two are approximately 1 hour. In order to match up the data, this difference in time needs to
be added or subtracted and then readjusted to line up. Once this is achieved, data lineup is possible. It is found that
the exact difference between the EFIS GPS and the Garmin GPS is 1 hour 3 minutes and 37 seconds. This difference
is converted into serial time and re-plotted. Figure 19 shows the new adjustment between the two data sets.
The benefits of the EFIS recorder are that it is able to gather attitude data such as bank, pitch, and yaw angle
from the AHRS. Form the same traffic pattern, this information is sub plotted and investigated as shown in Fig. 20.
The results from this plotting are expected. Bank angle is correctly recorded as the RV 7 turns. The turns are
performed at 2G and shown in the bottom subplot. The headings match runway heading, at or around 290 degrees,
beginning at initial takeoff and through the 3 patterns unlike the Smartphone data. Pitch angle follows the pattern as
well during all takeoffs and landings. Problems arose initially with the data because the AHRS was multiplying the
7.349 7.349 7.349 7.349 7.349 7.349 7.349 7.349 7.349
x 105
-120.68
-120.67
-120.66
-120.65
-120.64
-120.63
-120.62
-120.61
Serial Time, s
Longitude
EFIS GPS
Garmin GPSMAP 495
7.349 7.349 7.349 7.349 7.349 7.349 7.349
x 105
-120.68
-120.67
-120.66
-120.65
-120.64
-120.63
-120.62
-120.61
Serial Time, s
Longitude
EFIS GPS
Garmin GPSMAP 495
Figure 18. Time mismatch between EFIS GPS receiver
and Garmin GPS
Figure 19. Time adjusted correctly between EFIS
GPS receiver and Garmin GPS
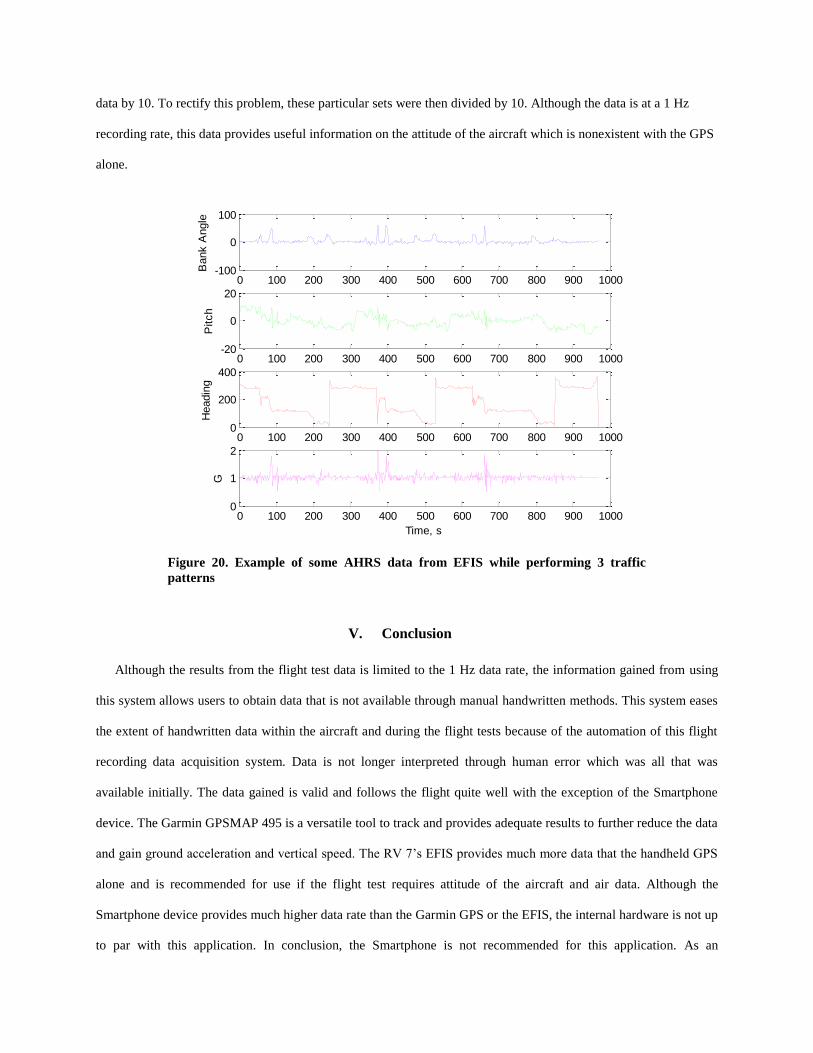
data by 10. To rectify this problem, these particular sets were then divided by 10. Although the data is at a 1 Hz
recording rate, this data provides useful information on the attitude of the aircraft which is nonexistent with the GPS
alone.
V. Conclusion
Although the results from the flight test data is limited to the 1 Hz data rate, the information gained from using
this system allows users to obtain data that is not available through manual handwritten methods. This system eases
the extent of handwritten data within the aircraft and during the flight tests because of the automation of this flight
recording data acquisition system. Data is not longer interpreted through human error which was all that was
available initially. The data gained is valid and follows the flight quite well with the exception of the Smartphone
device. The Garmin GPSMAP 495 is a versatile tool to track and provides adequate results to further reduce the data
and gain ground acceleration and vertical speed. The RV 7’s EFIS provides much more data that the handheld GPS
alone and is recommended for use if the flight test requires attitude of the aircraft and air data. Although the
Smartphone device provides much higher data rate than the Garmin GPS or the EFIS, the internal hardware is not up
to par with this application. In conclusion, the Smartphone is not recommended for this application. As an
0 100 200 300 400 500 600 700 800 900 1000-100
0
100B
ank A
ngle
0 100 200 300 400 500 600 700 800 900 1000-20
0
20
Pitch
0 100 200 300 400 500 600 700 800 900 10000
200
400
Headin
g
0 100 200 300 400 500 600 700 800 900 10000
1
2
G
Time, s
Figure 20. Example of some AHRS data from EFIS while performing 3 traffic
patterns

improvement, a more sophisticated recording system can be acquired to improve the 1 Hz limitation. Future
suggestions would continue with this work and provide data interpolation and filtering to get differentiable values.
Appendix
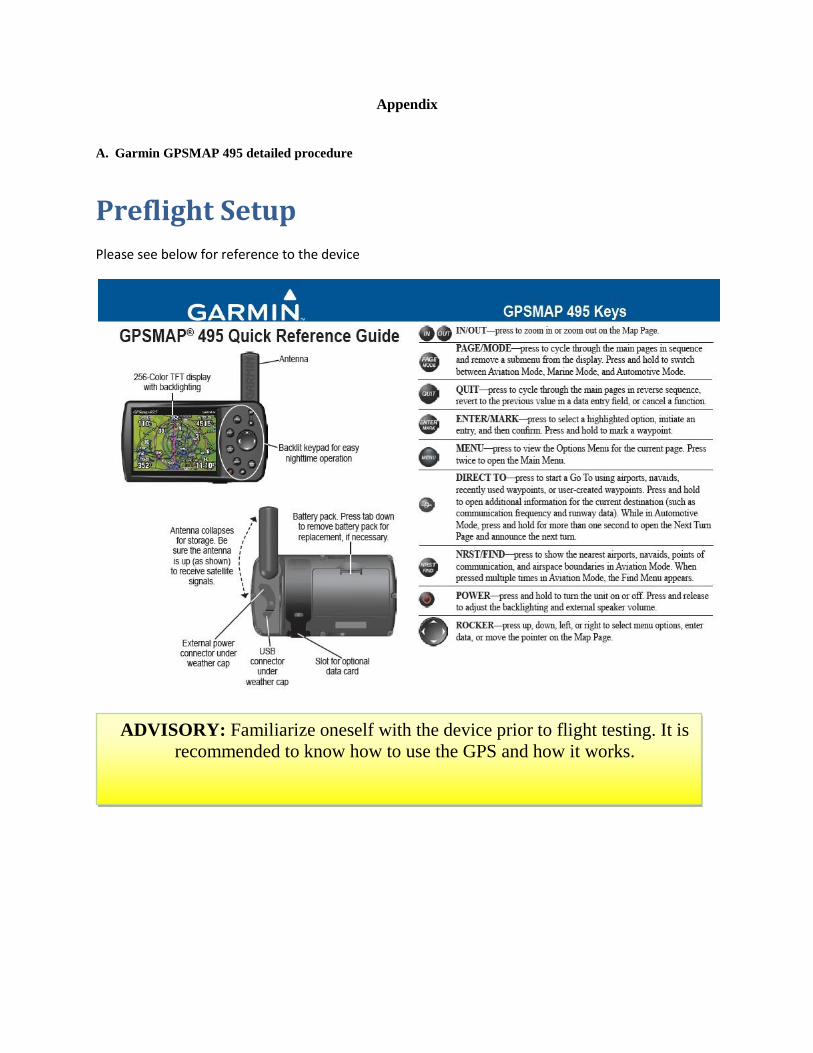
A. Garmin GPSMAP 495 detailed procedure
Preflight Setup
Please see below for reference to the device
ADVISORY: Familiarize oneself with the device prior to flight testing. It is
recommended to know how to use the GPS and how it works.

External Antenna Setup
Due to limited signal strength of the GPS, an external antenna is essential in order to get proper
signal. It is highly suggested that you use this in every flight. The external antenna is shown
below:
1. Turn the GPS onto the battery side and place the antenna
between the 7 and 8 o’clock position
2. Insure the small plastic tab, located near the pivot, is shown
to allow the antenna to be removed as shown below
CAUTION: Do not turn GPS on until instructed to do so. This could cause
GPS to search for an active signal when signal is obstructed, and results in
longer time to get a lock-on. It is recommended to know how to use GPS
simulation mode. Refer to GPS documentation GPS simulation

3. Carefully pull the antenna up until antenna is removed
4. Attach external antenna to the GPS by attaching the external
antenna connector onto the antenna stub on the GPS
5. Rotate slightly until it fits all the way in
6. Then rotate clockwise to lock into place as shown below
Plastic tab

Preflight Data Setup and GPS Start Up
To ensure the correct data is recorded, clear the active track log from the GPS.
1. Turn the GPS on by pressing and holding the power button
until the device beeps
2. Accept the Warning page by simply pressing the enter button
3. The GPS page is shown now; navigate 4 pages down via
Rocker to the Tracks page
4. Navigate to the right and down via Rocker button to the
“Clear” onscreen option and press enter Note: The Active Track Memory Used should read 0%
CAUTION: Ensure oneself outside when turning GPS device on and the
external antenna is attached. Turning the GPS on in the hanger is not
advised and will cause GPS to take much longer to get a satellite lock-on.

RV 7: In Aircraft Operations
The following procedure will occur while in the RV 7 aircraft
prior to takeoff. Ensure that the aircraft is outside the hanger
and is visible for GPS satellites to lock on.
Things that you will need:
Dash mount adapter for the GPS
small end

Begin Data Collection Procedure
Before you strap in:
1. Open glove box
2. Carefully place GPS onto dash mount adapter by hooking the
small end of the dash mount adapter first then sliding large
end around the GPS until it clicks: see picture above
3. Locate Garmin dash mount in glove box as shown below
4. Slide the device from right to left on the Garmin dash mount
until it clicks
5. Ensure the device is visible and secure in place as shown
below
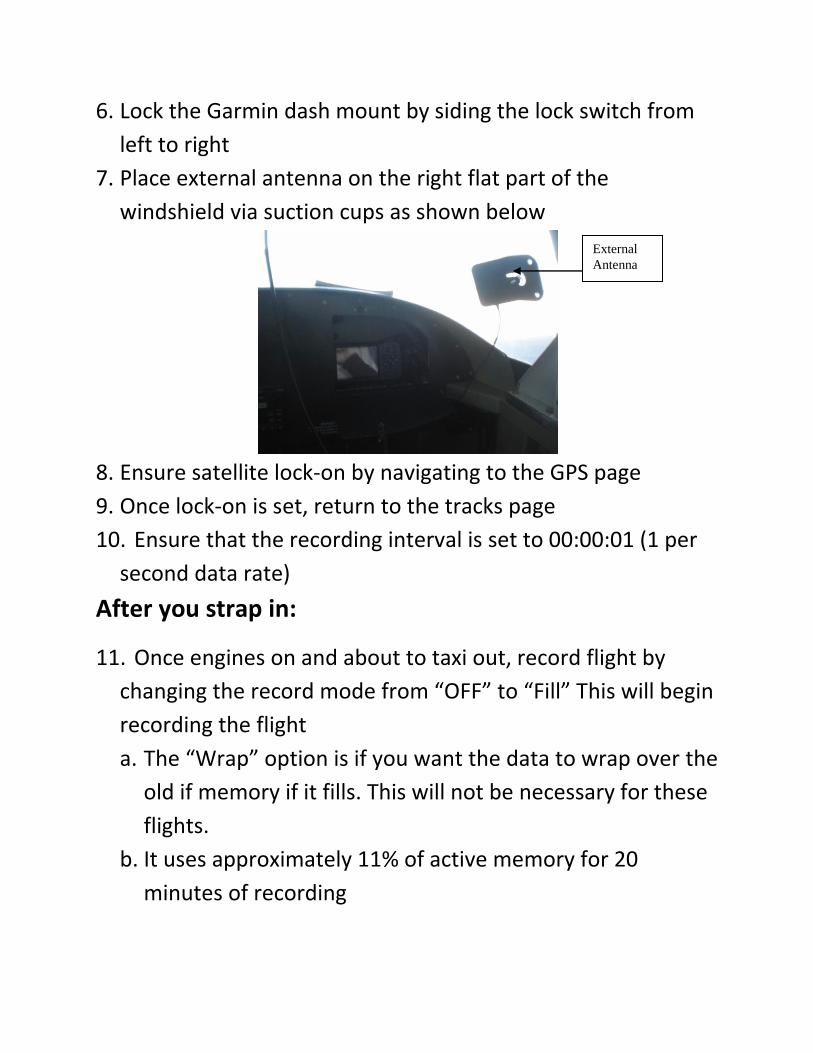
6. Lock the Garmin dash mount by siding the lock switch from
left to right
7. Place external antenna on the right flat part of the
windshield via suction cups as shown below
8. Ensure satellite lock-on by navigating to the GPS page
9. Once lock-on is set, return to the tracks page
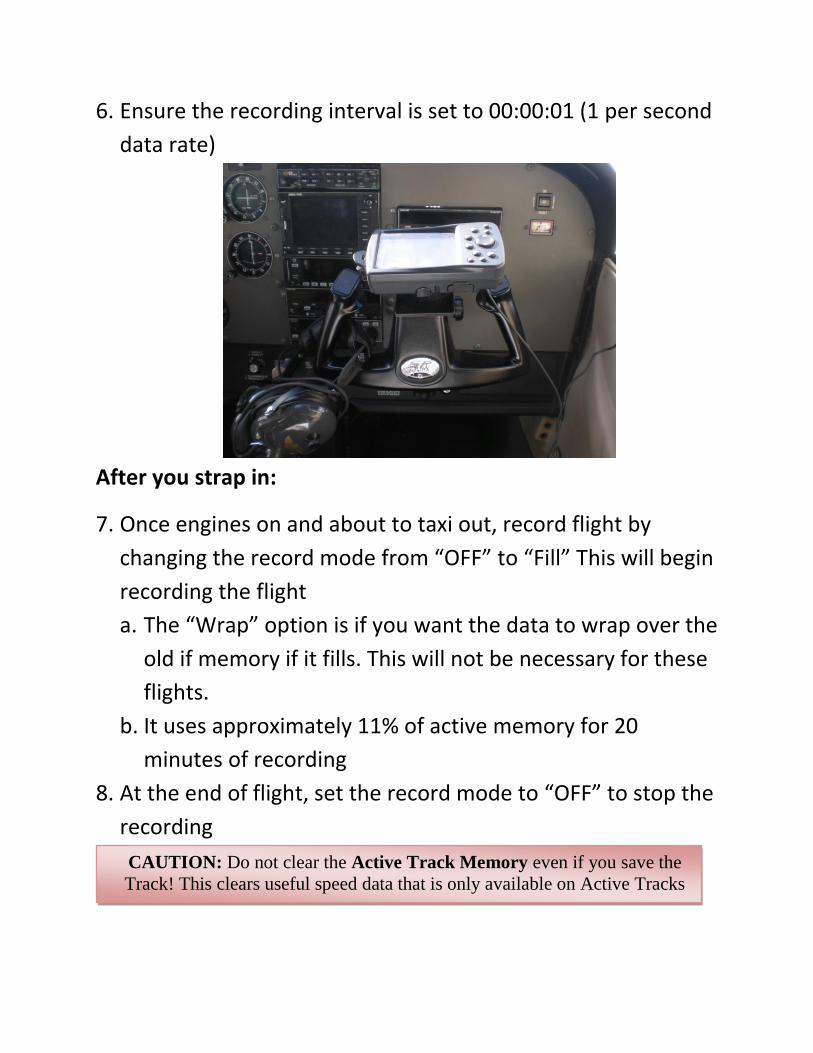
10. Ensure that the recording interval is set to 00:00:01 (1 per
second data rate)
After you strap in:
11. Once engines on and about to taxi out, record flight by
changing the record mode from “OFF” to “Fill” This will begin
recording the flight
a. The “Wrap” option is if you want the data to wrap over the
old if memory if it fills. This will not be necessary for these
flights.
b. It uses approximately 11% of active memory for 20
minutes of recording
External
Antenna

12. At the end of flight, set the record mode to “OFF” to stop
the recording
CAUTION: Do not clear the Active Track Memory even if you save the
Track! This clears useful speed data that is only available on Active Tracks

Post-flight Operations
1. Very carefully remove external antenna from window
2. Unlock GPS from the Garmin dash mount located in the glove
box
3. Push and hold down on release tab and slide the GPS to the
right to remove
CAUTION: Do not pull on external antenna to remove as it may break.
Remove by de-suctioning the suction cups
Release tab

Cessna 172: In Aircraft Operations
The following procedure will occur while in the Cessna 172 aircraft prior to takeoff.
Things that you will need:
Yoke mount for the GPS
CAUTION: Ensure oneself outside when turning GPS device on and the
external antenna is attached. Turning the GPS on in the hanger is not
advised and will cause GPS to take much longer to get a satellite lock-on.

Begin Data Collection Procedure
Before you strap in:
1. Attach yoke mount to the yoke of the Cessna 172 as shown
below
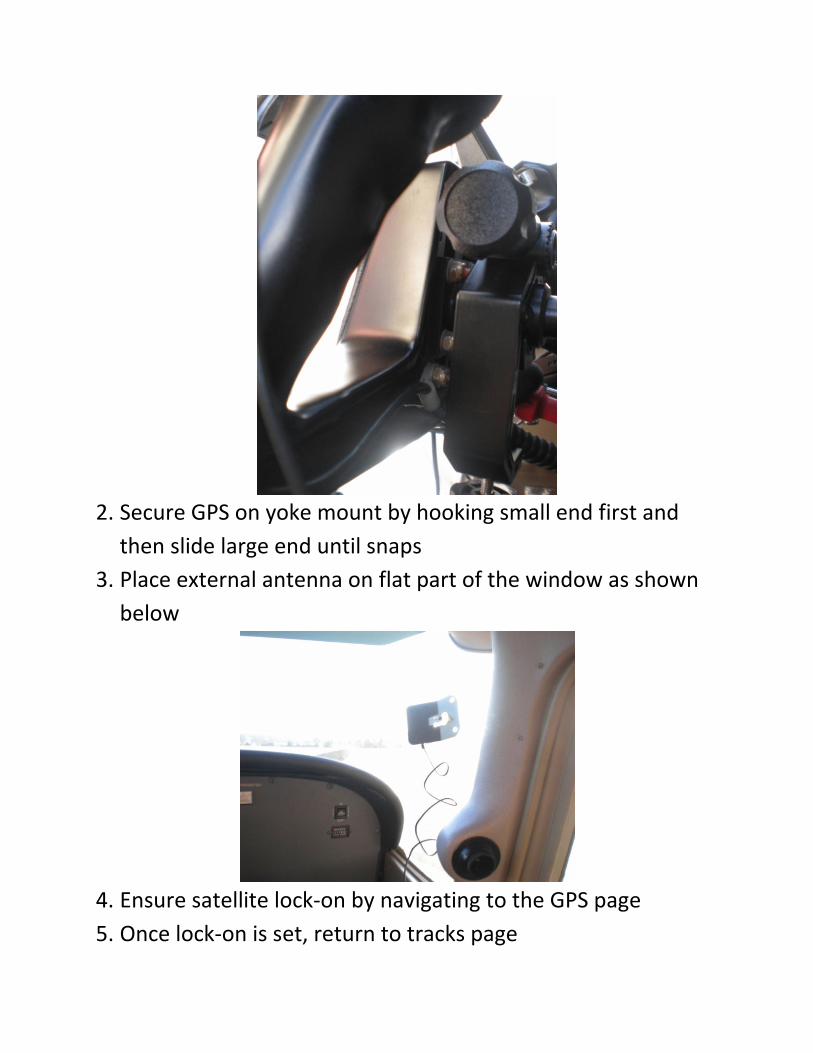
2. Secure GPS on yoke mount by hooking small end first and
then slide large end until snaps
3. Place external antenna on flat part of the window as shown
below
4. Ensure satellite lock-on by navigating to the GPS page
5. Once lock-on is set, return to tracks page
6. Ensure the recording interval is set to 00:00:01 (1 per second
data rate)
After you strap in:
7. Once engines on and about to taxi out, record flight by
changing the record mode from “OFF” to “Fill” This will begin
recording the flight
a. The “Wrap” option is if you want the data to wrap over the
old if memory if it fills. This will not be necessary for these
flights.
b. It uses approximately 11% of active memory for 20
minutes of recording
8. At the end of flight, set the record mode to “OFF” to stop the
recording
CAUTION: Do not clear the Active Track Memory even if you save the
Track! This clears useful speed data that is only available on Active Tracks

Post-flight Operations
1. Very carefully remove external antenna from window
2. Remove yoke mount
Data Recovery and Acquisition
Obtain data from the GPS device as soon as possible to ensure no loss of data. It is suggested that you
obtain data within the hanger and send data to yourself.
1. Connect the GPS to the USB cord and connect GPS to
the flight test computer
CAUTION: Do not pull on external antenna to remove as it may break.
Remove by de-suctioning suction cups

2. Open MapSource program located on the Desktop
3. Under Transfer menu, click on “receive from device”
4. Ensure GPSmap 495 is shown under “Device” and “Tracks” is
selected and click on “Receive.” GPS will beep when
complete. See image below.

5. Save two files: a Garmin database file (.gdb) and a text file
(.txt)
B. EFIS RV 7 detailed procedure
MGL Stratomaster Enigma EFIS Overview
All RV 7 flights are automatically recorded to the removable flash SD memory data card. The flight is
recorded as soon as the engine RPM reaches 2,000. It stops when it drops below 2,000 for a period of
time.
Garmin
Database File
.gdb
Text File .txt
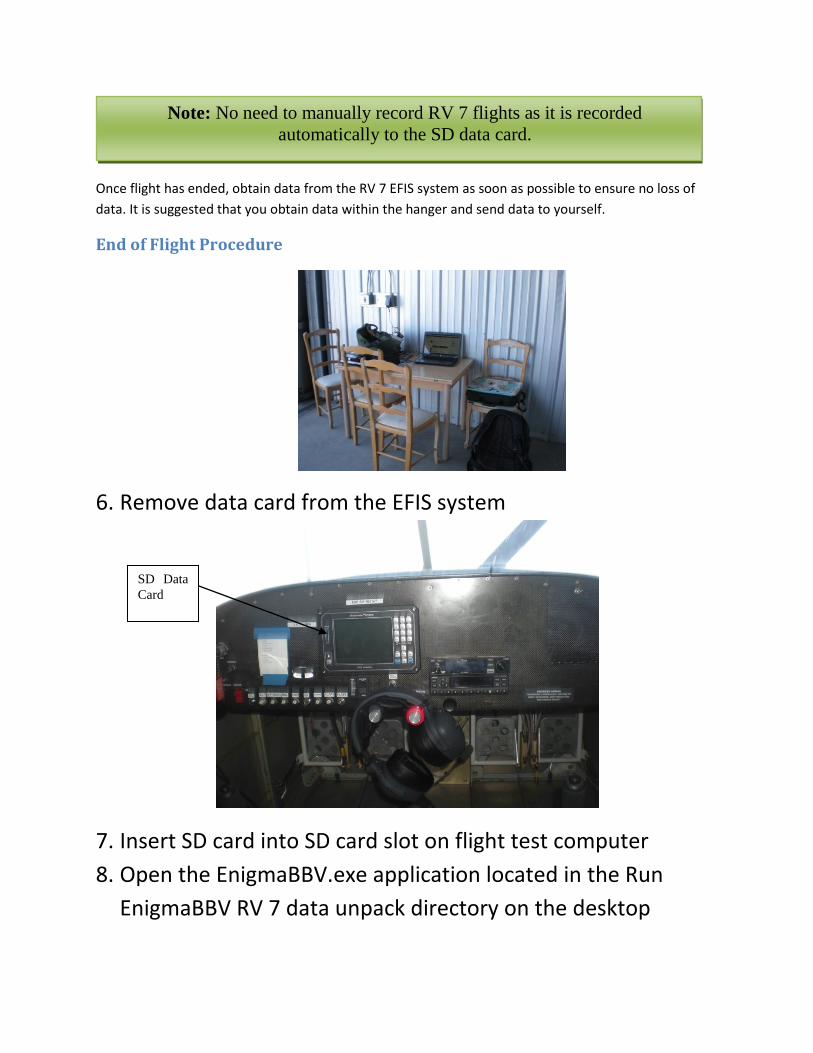
Once flight has ended, obtain data from the RV 7 EFIS system as soon as possible to ensure no loss of
data. It is suggested that you obtain data within the hanger and send data to yourself.
End of Flight Procedure
6. Remove data card from the EFIS system
7. Insert SD card into SD card slot on flight test computer
8. Open the EnigmaBBV.exe application located in the Run
EnigmaBBV RV 7 data unpack directory on the desktop
Note: No need to manually record RV 7 flights as it is recorded
automatically to the SD data card.
SD Data
Card

9. Once the Enigma Black Box Viewer is open, unpack REC file
10. Load Enigma Data Recording File

11. Change the directory to the SD Card (H:)
12. Select the Enigma REC file in the SD Card directory

13. The Flights Found in Enigma Data File list will become
populated and select your flight by date and time
14. Select KML (Google Earth) from the Output File Format
dropdown menu and save the selected

15. Repeat steps 8 and 9 for and save CSV (comma delimited)
file
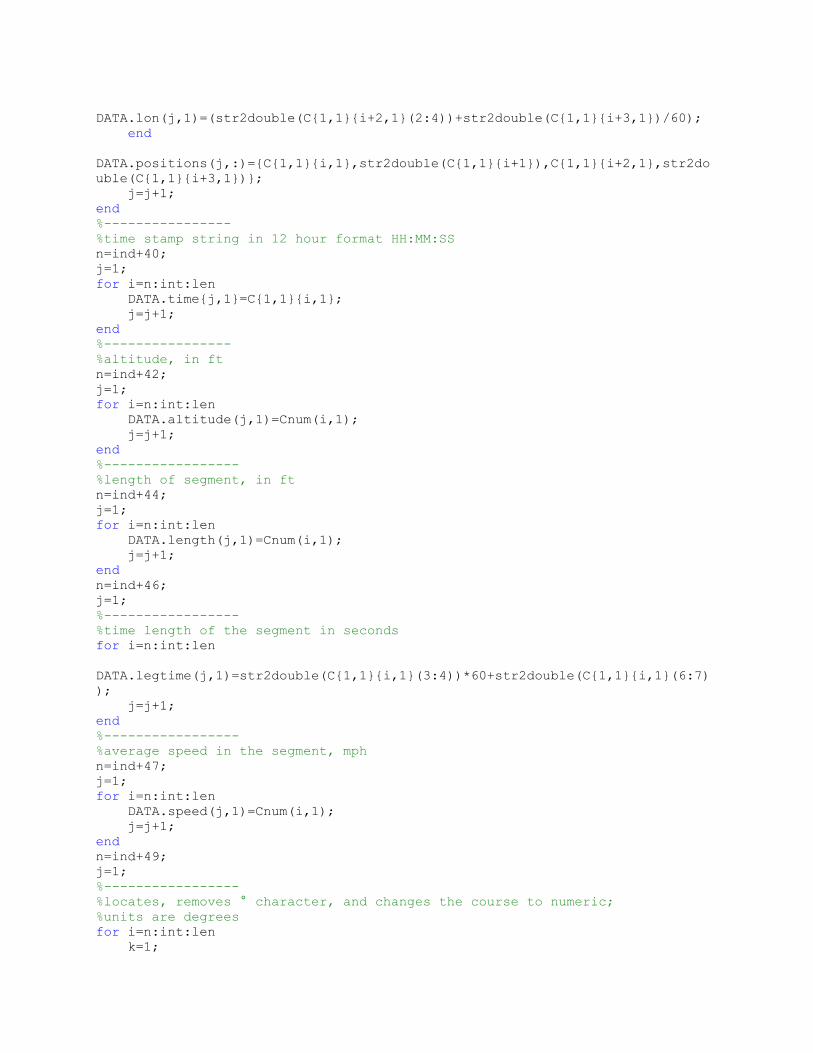
C. MATLAB code for GPS text file

function DATA = importmygps(txt_file) %CHRISTOPHER GOCHA %UPDATED Feb 6, 2012 %MATLAB FUNCTION FILE THAT IMPORTS THE GPS TEXT FILE TO SYBOLIC AND NUMERIC
DATA %FOR FURTHER PROCESSING %QUESTIONS? [email protected] ; %YOU MAY CHANGE THE CODE IF YOU WISH
file=fopen(txt_file); %<----Opens text file C=textscan(file, '%s'); %reads in the file; creats a cell array of strings Cnum=str2double(C{1,1}); %converts strings into numbers if possible len=length(C{1,1}); %---------------- %this loop indicates where the active log starts in the file for i=1:len if strcmp(C{1,1}{i,1},'ACTIVE') ind=i; break; end end %----------------- %stores basic information about the log into the data structure DATA.date=C{1,1}{ind+2,1}; DATA.startime{1,1}=C{1,1}{ind+3,1}; DATA.testlength{1,1}=C{1,1}{ind+5,1}; %ft DATA.totaldistance(1,1)=Cnum(ind+6,1); % mi DATA.avgspeed(1,1)=Cnum(ind+8); % mph %----------------- %indicates the headers of the gps data for i=1:5 DATA.headers{1,i}=C{1,1}{ind+10+i,1}; end j=6; for i=7:2:13 DATA.headers{1,j}=C{1,1}{ind+10+i,1}; j=j+1; end %----------------- %the next series of loops gathers further information and stores data %----------------- %obtains position lat and long in cell array format j=1; int=17; n=ind+35; for i=n:int:len if strcmp(C{1,1}{i,1}(1),'N')
DATA.lat(j,1)=str2double(C{1,1}{i,1}(2:3))+str2double(C{1,1}{i+1})/60; else DATA.lat(j,1)=-
(str2double(C{1,1}{i,1}(2:3))+str2double(C{1,1}{i+1})/60); end if strcmp(C{1,1}{i+2,1}(1),'W') DATA.lon(j,1)=-
(str2double(C{1,1}{i+2,1}(2:4))+str2double(C{1,1}{i+3,1})/60); else
DATA.lon(j,1)=(str2double(C{1,1}{i+2,1}(2:4))+str2double(C{1,1}{i+3,1})/60); end
DATA.positions(j,:)={C{1,1}{i,1},str2double(C{1,1}{i+1}),C{1,1}{i+2,1},str2do
uble(C{1,1}{i+3,1})}; j=j+1; end %---------------- %time stamp string in 12 hour format HH:MM:SS n=ind+40; j=1; for i=n:int:len DATA.time{j,1}=C{1,1}{i,1}; j=j+1; end %---------------- %altitude, in ft n=ind+42; j=1; for i=n:int:len DATA.altitude(j,1)=Cnum(i,1); j=j+1; end %----------------- %length of segment, in ft n=ind+44; j=1; for i=n:int:len DATA.length(j,1)=Cnum(i,1); j=j+1; end n=ind+46; j=1; %----------------- %time length of the segment in seconds for i=n:int:len
DATA.legtime(j,1)=str2double(C{1,1}{i,1}(3:4))*60+str2double(C{1,1}{i,1}(6:7)
); j=j+1; end %----------------- %average speed in the segment, mph n=ind+47; j=1; for i=n:int:len DATA.speed(j,1)=Cnum(i,1); j=j+1; end n=ind+49; j=1; %----------------- %locates, removes ° character, and changes the course to numeric; %units are degrees for i=n:int:len k=1;

temp=' '; while ~strcmp(C{1,1}{i,1}(1,k),'°') temp(1,k)=C{1,1}{i,1}(1,k); k=k+1; end DATA.course(j,1)=str2double(temp); j=j+1; end %------------------ %This loop sums the individual segment times and indicates the time after %the log began in seconds,time 0 - test time DATA.inctime(1,1)=DATA.legtime(1,1); for i=2:length(DATA.time) DATA.inctime(i,1)=DATA.inctime(i-1,1)+DATA.legtime(i,1); end %------------------ %Creating a serial time vector d=date; for i=1:length(DATA.time) DATA.serialtime(i,1)=datenum(DATA.date)+(datenum(DATA.time{i,1})-
datenum(sprintf('1/1/%s',d(8:11)))); end fclose(file); clear C Cnum ans i ind int j len n file temp k