DATA ACQUISITION AND PROCESSING REPORT...Data Acquisition and Processing Report Project...
35
U.S. DEPARTMENT OF COMMERCE NATIONAL OCEANIC AND ATMOSPHERIC ADMINISTRATION NATIONAL OCEAN SERVICE DATA ACQUISITION AND PROCESSING REPORT Type of Survey Hydrographic Project OPR-C308-KR-13 Contract No DG133C-08-CQ-0006 Task Order No T0009 Time Frame July 2013 LOCALITY State New Jersey General Locality New Jersey Coast and Vicinity 2014 CHIEF OF PARTY Jonathan L. Dasler, David Evans and Associates, Inc. LIBRARY & ARCHIVES DATE
Transcript of DATA ACQUISITION AND PROCESSING REPORT...Data Acquisition and Processing Report Project...
U.S. DEPARTMENT OF COMMERCE NATIONAL OCEANIC AND ATMOSPHERIC ADMINISTRATION NATIONAL OCEAN SERVICE
DATA ACQUISITION AND PROCESSING REPORT
Type of Survey HydrographicProject OPR-C308-KR-13Contract No DG133C-08-CQ-0006Task Order No T0009Time Frame July 2013
LOCALITY
State New Jersey
General Locality New Jersey Coast and Vicinity
2014
CHIEF OF PARTY
Jonathan L. Dasler, David Evans and Associates, Inc.
LIBRARY & ARCHIVES
DATE

OPR-C308-KR-13 New Jersey Coast and Vicinity, NJ July 2013 Data Acquisition and Processing Report Field Unit: David Evans and Associates, Inc.
i
TABLE OF CONTENTS
INTRODUCTION......................................................................................................................... 1
A. EQUIPMENT ........................................................................................................................... 1A1. Survey Vessel .......................................................................................................................3A2. Side Scan Sonar Systems .....................................................................................................3A3. Single Beam System .............................................................................................................4A4. Multibeam System ................................................................................................................4A5. Position, Heading and Motion Reference Systems ..............................................................4A6. Sound Speed Measurement Systems ....................................................................................5A7. Acquisition and Processing System......................................................................................6A8. Survey Methodology ............................................................................................................7
A8.a Mobilization ...................................................................................................................... 7A8.b Survey Coverage ............................................................................................................... 7A8.c Side Scan Sonar Operations .............................................................................................. 7A8.d Single beam Sonar Operations .......................................................................................... 9A8.e Multibeam Sonar Operations ............................................................................................ 9A8.f Bottom Sampling ............................................................................................................. 10
A9. Quality Assurance ..............................................................................................................10
B. QUALITY CONTROL .......................................................................................................... 11B1. Data Acquisition .................................................................................................................11
B1.a Side Scan Sonar ............................................................................................................... 11B1.b Single beam ..................................................................................................................... 12B1.c Multibeam ....................................................................................................................... 12
B2. Methodology Used to Maintain Data Integrity ...................................................................12B2.a HIPS Conversion ............................................................................................................. 14B2.b Vessel Files ...................................................................................................................... 14B2.c Static Draft ...................................................................................................................... 17B2.d Sound Velocity ................................................................................................................. 17
B3. Bathymetric Data Processing ..............................................................................................17B4. GPS Post-processing ...........................................................................................................19B5. Final Bathymetric Processing .............................................................................................19B6. Side Scan Processing ..........................................................................................................20
C. CORRECTIONS TO ECHO SOUNDINGS ....................................................................... 20C1. Static Draft ..........................................................................................................................20C2. Dynamic Draft ....................................................................................................................21C3. Bar Check Comparisons .....................................................................................................21C4. Heave, Roll and Pitch Corrections......................................................................................21

OPR-C308-KR-13 New Jersey Coast and Vicinity, NJ July 2013 Data Acquisition and Processing Report Field Unit: David Evans and Associates, Inc.
ii
C5. Patch Tests ..........................................................................................................................22C6. Tide and Water Level Corrections ......................................................................................22C7. Sound Velocity Correction .................................................................................................23
D. APPROVAL SHEET ............................................................................................................. 23
E. TABLE OF ACRONYMS ..................................................................................................... 25
List of Figures Figure 1. R/V Chinook .................................................................................................................... 3Figure 2. Side Scan Sonar Range Scale Use by Survey ................................................................. 8Figure 3. Side Scan Sonar Mosaic Overlaid with Multibeam and Sonar Contacts ...................... 11Figure 4. Flowchart of Data Acquisition and Processing Pipeline ............................................... 13
List of Tables Table 1. R/V Chinook Hardware .................................................................................................... 2Table 2. Acquisition and Processing Software ............................................................................... 6Table 3. Typical Reson 8101 Sonar Settings ................................................................................ 10Table 4. HIPS Vessel Files ........................................................................................................... 14Table 5. Hydrographic Vessel File TPU Values ........................................................................... 16Table 6. TPU Values for Tide and Sound Speed .......................................................................... 17
List of Appendices Appendix I - Vessel Reports Appendix II - Echosounder ReportsAppendix III - Position and Attitude Systems Reports Appendix IV - Sound Speed Sensor ReportAppendix V - CARIS SIPS Side Scan Processing Guidance

OPR-C308-KR-13 New Jersey Coast and Vicinity, NJ July 2013 Data Acquisition and Processing Report Field Unit: David Evans and Associates, Inc.
1
Data Acquisition and Processing Report Project OPR-C308-KR-13
Locality: New Jersey Coast and Vicinity, NJ July 2013
R/V ChinookDavid Evans and Associates, Inc.
Chief of Party: Jonathan L. Dasler, PE, PLS, CH
INTRODUCTIONThis report applies to surveys H12596, H12597, H12598, and H12599 located along the New Jersey coast and vicinity. These contract surveys were performed under OPR-C308-KR-13 as specified in the Statement of Work (June 20, 2013) and Hydrographic Survey Project Instructions (June 27, 2013). All survey methods meet or exceed requirements as defined in the National Ocean Service (NOS) Hydrographic Surveys Specifications and Deliverables (HSSD)(April 2013).
The Hydrographic Survey Project Instructions reference the 2012 HSSD, however the OPR-C308-KR-13 surveys were performed using the 2013 HSSD. This modification was approved by Hydrographic Surveys Division (HSD) staff.
The survey consisted of 200 percent side scan sonar coverage with concurrent single beam in all waters 4 meters and deeper; and 100 percent side scan sonar coverage with concurrent single beam in depths between 2 meters and 4 meters in waters inside the polygon DEA_2m_region.shp provided by HSD staff. The survey polygon depicted in the Project Reference File (PRF) OPR-C308-KR-13_PRF.000, which was included with the Hydrographic Survey Project Instructions,was used to define the limits for each survey. There are areas in shallow water with breaking waves were coverage was limited due to safety considerations. These areas are identified in the Descriptive Report for the survey. Automated Wreck and Obstruction Information System (AWOIS) items identified by side scan sonar and all significant side scan sonar contacts were investigated with a multibeam sonar with data acquired to meet object detection coverage requirements for multibeam surveys. The locations of bottom samples have been determined by using the side scan sonar mosaics as directed by the OPR-C308-KR-13 Hydrographic Survey Project Instructions.
A. EQUIPMENT For this project David Evans and Associates, Inc. (DEA) implemented a state-of-the-art data acquisition system on board the Research Vessel (R/V) Chinook in accordance with National Oceanic and Atmospheric Administration (NOAA) standards and modern remote sensing techniques. Operational systems used to acquire survey data and redundant systems that provided confidence checks are described in detail in this section and are listed in Table 1.

OPR-C308-KR-13 New Jersey Coast and Vicinity, NJ July 2013 Data Acquisition and Processing Report Field Unit: David Evans and Associates, Inc.
2
Table 1. R/V Chinook Hardware
Instrument Manufacturer Model Serial No. FunctionSide Scan Sonar
Deck Unit EdgeTech 701-DL 35324 Topside side scan interface and digital sensors.
Towfish EdgeTech 4200-HF 4200-HFL 4200-HF 4200-HF
42627 Bow tow 38461 Stern tow 43188 Stern tow 46437 Stern tow
300/600 kHz side scan towfish for seafloor imaging.
Side Scan Sonar Cable Counter
Cable Counter Measurement Technology Northwest
LCI-90 0350 Continuous digital output of deployed side scan tow cable length for layback calculations.
Multibeam Echosounder
Sonar RESONSeaBat 8101-ER, Firmware: 1.08-C215
3507003 Multibeam sonar, using 101 beams at 240kHz.
Deck Unit RESON 81-P, Firmware: 2.09-E34D 8002024 Multibeam sonar processor.
Single beam Echosounder
Echosounder Odom Echotrac CV-100 26020 Topside single beam sonar interface.
Transducer Odom SMBB200-9 Single beam sonar transducer. Sound Speed
Sound Speed Profiler AML Oceanographic SV Plus V2
Housing: 003591 Sensor: 200847
7/17/13- 01/25/14 and 02/18/14 to DARP preparation primary sound speed profiler.
Sound Speed Profiler AML Oceanographic SV Plus V2
Housing: 003592 Sensor: 140295
1/26/14 to 02/17/14 primary sound speed profiler. 02/18/14 to DAPR preparation secondary sound speed profiler.
Sound Speed Profiler Sea-Bird Electronics, Inc.
SBE 19-03 SeaCAT 1919847-2691 7/17/2013- 01/25/14
Secondary sound speed profiler. Navigation
Deck Unit Applanix POS MV 320 V4, Firmware: 5.03 3083 Integrated Differential Global
Positioning System (DGPS) and inertial reference system for position, heading, heave, roll and pitch data.
IMU Applanix POS MV V4 898
Starboard Antenna Trimble Zephyr Model 1 60073610 Port Antenna Trimble Zephyr Model 1 60080535
DGPS Receiver Trimble DSM132 0224093932 Secondary positioning system with integrated DGPS radio. Beacon Sandy Hook 286 kHz or Moriches, NY, 293 kHz. DGPS Antenna Trimble 33580-00 0220361419
DGPS Beacon Receiver CSI Wireless MBX-3S 0716-1600-
0009 Differential radio for POS/MV primary position system. Beacon Sandy Hook, 286 kHz or Moriches, NY, 293 kHz. DGPS Beacon
Antenna CSI Wireless MD MGL-3 0716-3582-0008

OPR-C308-KR-13 New Jersey Coast and Vicinity, NJ July 2013 Data Acquisition and Processing Report Field Unit: David Evans and Associates, Inc.
3
A1. Survey Vessel The R/V Chinook, which is owned and operated by Zephyr Marine (Figure 1), was the survey vessel for the project.
Figure 1. R/V Chinook
The R/V Chinook, hull identification number IAR28CATJ607, is a 28-foot trailerable aluminum catamaran with a 10.5-foot beam and a draft of 2 feet. The vessel is equipped with twin 250 HP outboard motors, a 12-foot pilot house, a hull-mounted single beam transducer, stern mount A-frame, a side scan sonar bow mount for shallow water operations and data acquisition stations. This survey required specialized deployment of the side scan sonar from the bow of the vessel for sonar imaging in shallow water.
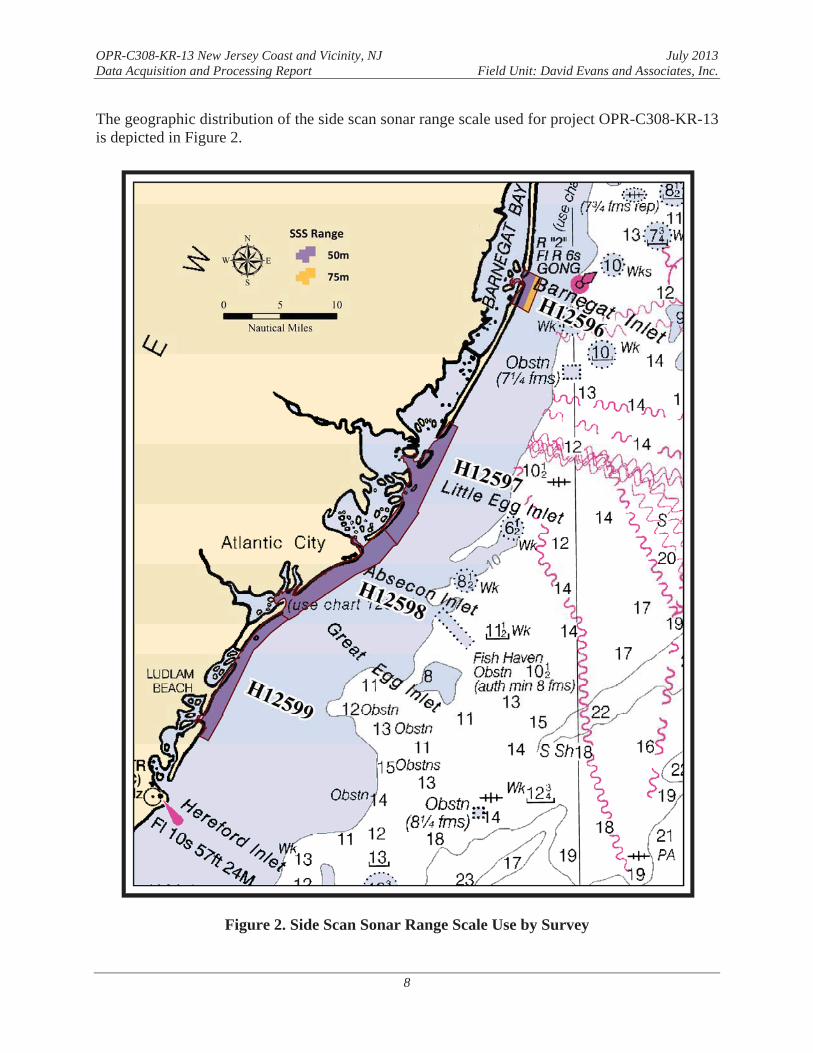
A2. Side Scan Sonar Systems Side scan sonar imagery was acquired with an Edgetech 4200-HF or Edgetech 4200 HFL (300/600 kHz) dual frequency side scan sonar. The sonar was operating in high-frequency, high-speed mode at 600 kHz for data collected out to 50-meter range and low-Frequency, high-speed mode at 300 kHz for data collected out to 75-meter range.
Odd numbered preplanned Hypack survey lines were used to make up the 100 percent coverage while the even numbered lines made up the 200 percent coverage. Side scan sonar imagery was logged as Triton eXtended Triton Format (XTF) (16 bit, 2048 pixels/channel) in Triton Isis SS-Logger. In addition to the imagery, vessel heading, pitch, roll, position, towfish depth and altitude, and computed towfish position from layback calculations were also recorded to the XTF. The side scan sonar was either deployed from the stern A-frame where an LCI-90 Cable

OPR-C308-KR-13 New Jersey Coast and Vicinity, NJ July 2013 Data Acquisition and Processing Report Field Unit: David Evans and Associates, Inc.
4
Payout Meter along with measured tow point offsets and towfish depth were used by SS-Logger to compute layback, or the bow where a fixed forward layback was entered into SS-Logger manually.
Side scan sonar SN38461 and SN42627 were deployed at the start of the project. Sonar SN38461 was damaged on DN250 (9/7/2013) and shipped back to the manufacture. Replacement sonar SN43188 was received on DN342 (12/8/2013). New side scan sonar SN46437 was deployed in the field on DN026 (01/26/2014).
To confirm adequate target resolution at the outer limits of the selected range, confidence checks were conducted on a daily basis during acquisition and noted in the acquisition logs. In deteriorating conditions, confidence checks were performed more frequently to confirm detection of features at the outer range limits.
A3. Single Beam System An Odom CV100 with a 4-degree transducer and 200 kHz operating frequency was deployed on the R/V Chinook. The transducer was hull-mounted amidships on the starboard sponson. The echosounder was operated concurrently with the side scan sonar during survey operations. All single beam data were logged in HYPACK (RAW) and HYPACK digital echogram (BIN) file formats.
Draft checks were observed twice daily (beginning and end of day) to monitor vessel loading and fuel consumption. Weekly bar checks were performed to ensure that the sonars were functioning properly and static draft was accurately documented. Odom and Hypack software was used to perform the tests and the bar check was digitally recorded in HYPACK.
A4. Multibeam System The R/V Chinook was equipped with a Reson SeaBat 8101 extended range multibeam sonar and was used during feature investigations of side scan sonar contacts. The multibeam echosounder was pole-mounted, which facilitated easy removal from the water when not in use. Range adjustments were made during acquisition as dictated by changes in water depth. Hypack HYSWEEP was used to acquire multibeam data in Hypack Hysweep file format (HSX) and multibeam backscatter in Hypack 81X format. The Reson 8101 series operates at 240 kHz producing a 150-degree swath of 101 uniform beams with a beam width of 1.5 degrees x 1.5 degrees.
A5. Position, Heading and Motion Reference Systems The survey vessel was outfitted with an Applanix Position and Orientation System for Marine Vessels (POS/MV) 320 version 4 with Differential Global Positioning System (DGPS) and inertial reference system, which was used to measure attitude, heading, heave, and position. The system was comprised of an Inertial Motion Unit (IMU), dual frequency (L1/L2) Global Positioning System (GPS) antennas, and a data processor.
OPR-C308-KR-13 New Jersey Coast and Vicinity, NJ July 2013 Data Acquisition and Processing Report Field Unit: David Evans and Associates, Inc.
5
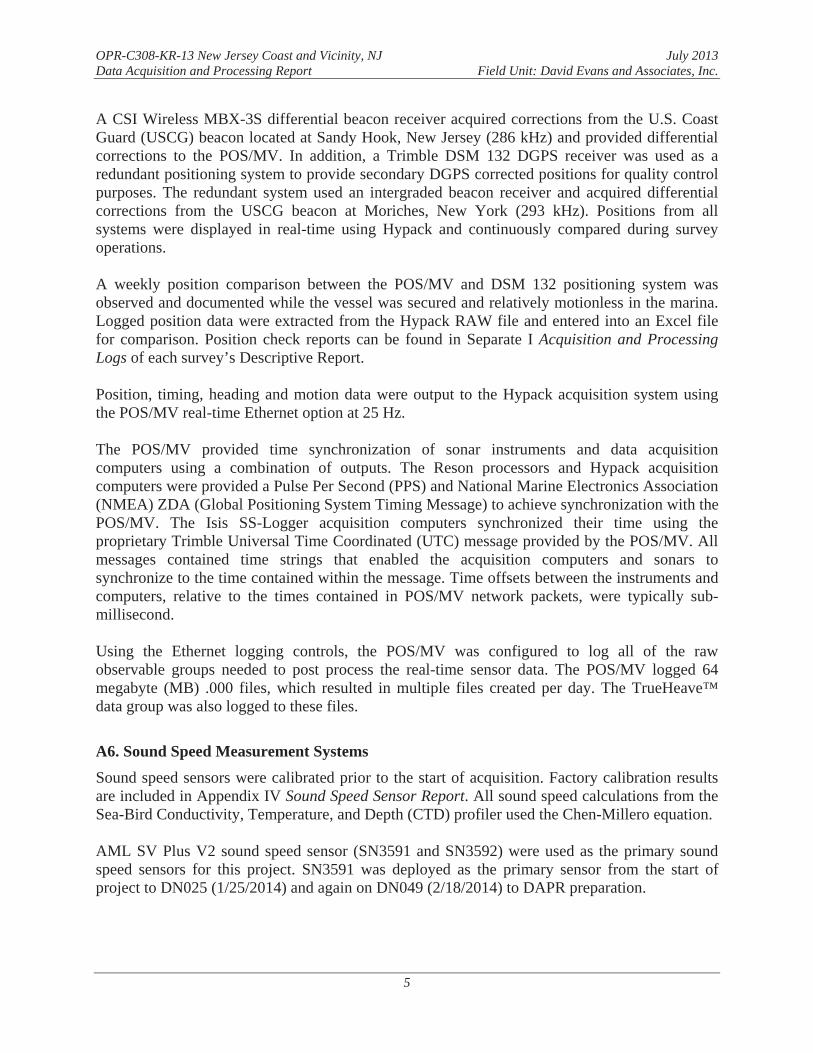
A CSI Wireless MBX-3S differential beacon receiver acquired corrections from the U.S. Coast Guard (USCG) beacon located at Sandy Hook, New Jersey (286 kHz) and provided differential corrections to the POS/MV. In addition, a Trimble DSM 132 DGPS receiver was used as a redundant positioning system to provide secondary DGPS corrected positions for quality control purposes. The redundant system used an intergraded beacon receiver and acquired differential corrections from the USCG beacon at Moriches, New York (293 kHz). Positions from all systems were displayed in real-time using Hypack and continuously compared during survey operations.
A weekly position comparison between the POS/MV and DSM 132 positioning system was observed and documented while the vessel was secured and relatively motionless in the marina. Logged position data were extracted from the Hypack RAW file and entered into an Excel file for comparison. Position check reports can be found in Separate I Acquisition and Processing Logs of each survey’s Descriptive Report.
Position, timing, heading and motion data were output to the Hypack acquisition system using the POS/MV real-time Ethernet option at 25 Hz.
The POS/MV provided time synchronization of sonar instruments and data acquisition computers using a combination of outputs. The Reson processors and Hypack acquisition computers were provided a Pulse Per Second (PPS) and National Marine Electronics Association (NMEA) ZDA (Global Positioning System Timing Message) to achieve synchronization with the POS/MV. The Isis SS-Logger acquisition computers synchronized their time using the proprietary Trimble Universal Time Coordinated (UTC) message provided by the POS/MV. All messages contained time strings that enabled the acquisition computers and sonars to synchronize to the time contained within the message. Time offsets between the instruments and computers, relative to the times contained in POS/MV network packets, were typically sub-millisecond.
Using the Ethernet logging controls, the POS/MV was configured to log all of the raw observable groups needed to post process the real-time sensor data. The POS/MV logged 64 megabyte (MB) .000 files, which resulted in multiple files created per day. The TrueHeave™ data group was also logged to these files.
A6. Sound Speed Measurement Systems Sound speed sensors were calibrated prior to the start of acquisition. Factory calibration results are included in Appendix IV Sound Speed Sensor Report. All sound speed calculations from the Sea-Bird Conductivity, Temperature, and Depth (CTD) profiler used the Chen-Millero equation.
AML SV Plus V2 sound speed sensor (SN3591 and SN3592) were used as the primary sound speed sensors for this project. SN3591 was deployed as the primary sensor from the start of project to DN025 (1/25/2014) and again on DN049 (2/18/2014) to DAPR preparation.

OPR-C308-KR-13 New Jersey Coast and Vicinity, NJ July 2013 Data Acquisition and Processing Report Field Unit: David Evans and Associates, Inc.
6
A Seabird SBE 19-03 SeaCAT SN2691 was used as the secondary sound speed sensor until DN025 (1/25/2014) when it was replaced by the AML SV Plus V2 SN3591 as the secondary sensor. The Sea-Bird had connectivity issues and was shipped back to manufacture for repairs and calibration on DN030 (1/30/2014).
A7. Acquisition and Processing System An acquisition station was custom-installed and integrated on the R/V Chinook by DEA and consisted of a Triton Isis SS-Logger side scan sonar data acquisition computer, Hypack Hysweep single beam and multibeam acquisition and navigation computer and an additional computer for digital logs and general administration. During acquisition, data were logged locally on each acquisition computer and then transferred to the field office using an external hard drive at the completion of each survey day. Backup of the data was performed in the field office prior to internet transfer to DEA’s Vancouver, WA office, where additional backup, processing and creation of deliverables was performed. The software and version numbers used throughout the survey are listed in Table 2.
Table 2. Acquisition and Processing Software
Name Manufacturer Version InstallationDate
Acquisition Hypack Hypack, Inc. 13.0.0.6 7/11/2013 Hypack Survey Hypack, Inc. 13.0.9.21 7/11/2013Hysweep Hypack, Inc. 13.0.9.21 7/11/2013Isis SS-Logger Triton Imaging, Inc. 7.3.623.51 7/11/2013Discover 4200-MP Edgetech 8.05 7/11/2013LineLog David Evans and Associates, Inc. 1.0.6 7/11/2013MV-POSView Applanix Corporation 5.1.0.2 7/11/2013SeaTerm Sea-Bird Electronics, Inc. 1.59 7/11/2013SBE Processing Sea-Bird Electronics, Inc. 7.21g 7/11/2013Processing HIPS CARIS 64-bit 7.1.1 SP1 HF1 7/11/2013Notebook CARIS 64-bit 3.1 SP1 HF1 7/11/2013Bathy DataBASE CARIS 64-bit 4.0 7/11/2013ArcGlobe ESRI 10.1 SP1 7/11/2013Isis Triton Imaging, Inc. 7.2.118.331 7/11/2013TargetPro Triton Imaging, Inc. 2.8.118.331 7/11/2013SonarWiz5 Chesapeake Technology, Inc 5.006.0034 7/11/2013Photoshop Adobe 10.0 7/11/2013SVP Convert David Evans and Associates 0.2.4 7/11/2013Other Microsoft Office Suite Microsoft 2007 7/11/2013Beyond Compare Beyond Compare 3.3.8 7/11/2013
OPR-C308-KR-13 New Jersey Coast and Vicinity, NJ July 2013 Data Acquisition and Processing Report Field Unit: David Evans and Associates, Inc.
7
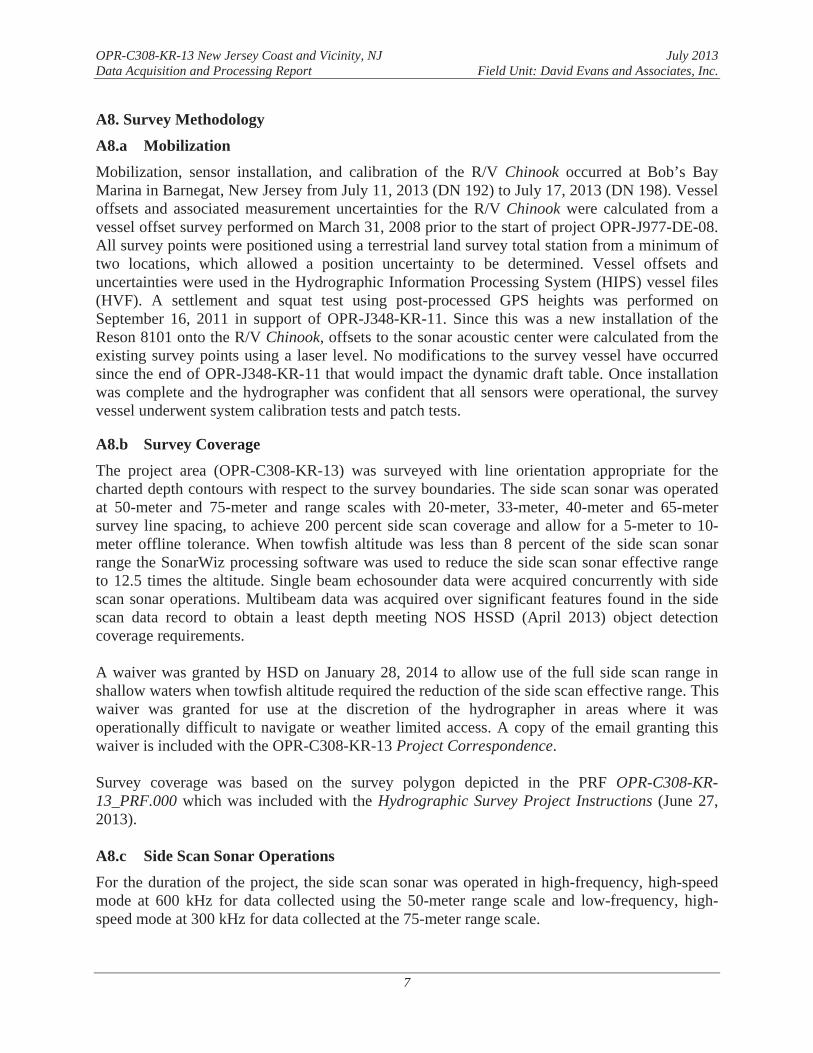
A8. Survey Methodology A8.a Mobilization Mobilization, sensor installation, and calibration of the R/V Chinook occurred at Bob’s Bay Marina in Barnegat, New Jersey from July 11, 2013 (DN 192) to July 17, 2013 (DN 198). Vessel offsets and associated measurement uncertainties for the R/V Chinook were calculated from a vessel offset survey performed on March 31, 2008 prior to the start of project OPR-J977-DE-08. All survey points were positioned using a terrestrial land survey total station from a minimum of two locations, which allowed a position uncertainty to be determined. Vessel offsets and uncertainties were used in the Hydrographic Information Processing System (HIPS) vessel files (HVF). A settlement and squat test using post-processed GPS heights was performed on September 16, 2011 in support of OPR-J348-KR-11. Since this was a new installation of the Reson 8101 onto the R/V Chinook, offsets to the sonar acoustic center were calculated from the existing survey points using a laser level. No modifications to the survey vessel have occurred since the end of OPR-J348-KR-11 that would impact the dynamic draft table. Once installation was complete and the hydrographer was confident that all sensors were operational, the survey vessel underwent system calibration tests and patch tests.
A8.b Survey Coverage The project area (OPR-C308-KR-13) was surveyed with line orientation appropriate for the charted depth contours with respect to the survey boundaries. The side scan sonar was operated at 50-meter and 75-meter and range scales with 20-meter, 33-meter, 40-meter and 65-meter survey line spacing, to achieve 200 percent side scan coverage and allow for a 5-meter to 10-meter offline tolerance. When towfish altitude was less than 8 percent of the side scan sonar range the SonarWiz processing software was used to reduce the side scan sonar effective range to 12.5 times the altitude. Single beam echosounder data were acquired concurrently with side scan sonar operations. Multibeam data was acquired over significant features found in the side scan data record to obtain a least depth meeting NOS HSSD (April 2013) object detection coverage requirements.
A waiver was granted by HSD on January 28, 2014 to allow use of the full side scan range in shallow waters when towfish altitude required the reduction of the side scan effective range. This waiver was granted for use at the discretion of the hydrographer in areas where it was operationally difficult to navigate or weather limited access. A copy of the email granting this waiver is included with the OPR-C308-KR-13 Project Correspondence.
Survey coverage was based on the survey polygon depicted in the PRF OPR-C308-KR-13_PRF.000 which was included with the Hydrographic Survey Project Instructions (June 27, 2013).
A8.c Side Scan Sonar Operations For the duration of the project, the side scan sonar was operated in high-frequency, high-speed mode at 600 kHz for data collected using the 50-meter range scale and low-frequency, high-speed mode at 300 kHz for data collected at the 75-meter range scale.
OPR-C308-KR-13 New Jersey Coast and Vicinity, NJ July 2013 Data Acquisition and Processing Report Field Unit: David Evans and Associates, Inc.
8
The geographic distribution of the side scan sonar range scale used for project OPR-C308-KR-13 is depicted in Figure 2.
Figure 2. Side Scan Sonar Range Scale Use by Survey

OPR-C308-KR-13 New Jersey Coast and Vicinity, NJ July 2013 Data Acquisition and Processing Report Field Unit: David Evans and Associates, Inc.
9
The EdgeTech 4200 series sonar has a ping rate of 30 Hz at 50-meter range and 20 Hz at 75-meter range, while operating in the high speed mode. High speed mode makes use of the optional Multi-Pulse (MP) technology, which places two sound pulses in the water at a time rather than the traditional one pulse, and allows for tow speeds upwards of 9 knots. In accordance with the NOS HSSD (April 2013), vessel speed was monitored to allow for the acquisition of a minimum of three pings per meter. The side scan was towed from either the bow or stern of the R/V Chinook during acquisition. The side scan sonar operator was assigned the task of analyzing the digital sonogram and keeping the towfish height within specification by adjusting cable out. The operator also called out contacts and daily confidence checks, which were entered into the digital acquisition log by the single beam operator/log keeper. When weather or sea conditions degraded side scan sonar imagery, operations were suspended. All acquisition occurred during daylight hours with the vessel leaving port in the morning and returning in the evening.
For areas requiring 200 percent side scan sonar coverage, the coverage was obtained by using Technique 2 listed under Section 6.1.1 of the NOS HSSD (April 2013). This technique allows for two separate 100 percent coverages by running splits between the first coverage to obtain the second coverage. In addition, the side scan sonar operator monitored both towfish height and coverage displays in a concerted effort to maintain an altitude of 8 percent to 20 percent of the range above the bottom and to achieve the desired coverage. In extreme shallow water this was not always possible and the effective range was reduced when the towfish altitude dropped below 8 percent of the side scan sonar range.
A8.d Single beam Sonar Operations Single beam sonar operations occurred concurrently with side scan sonar acquisition. The sonar operator monitored the single beam echosounder digital echogram, which was displayed and logged on the Hypack acquisition computer. A traditional paper trace was not recorded during this survey as the full water column return was digitally recorded.
A8.e Multibeam Sonar Operations Multibeam investigations occurred after the required side scan coverage was achieved and a list of the most significant contacts requiring investigations was compiled. The list of contacts was compiled after examining parameters such as contact height, level of significance, depth of the contact, navigational significance, and potential of being marine debris.
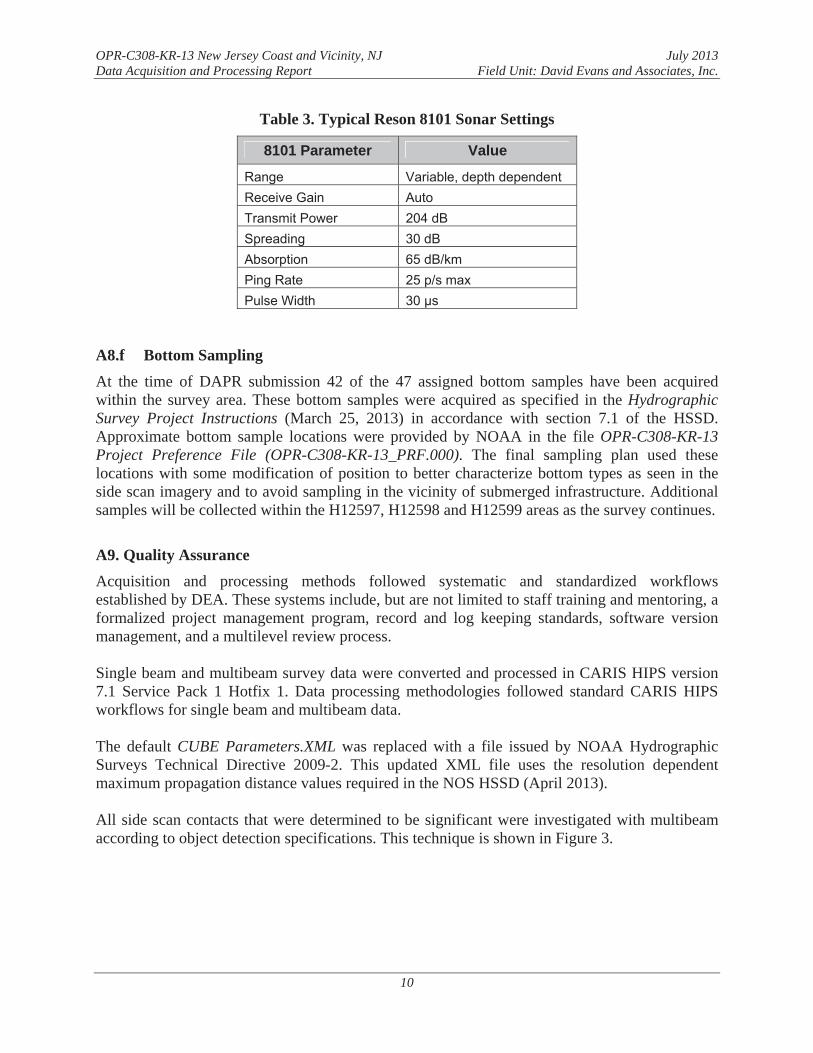
The multibeam sonar was pole-mounted on the starboard side of the R/V Chinook and operated at a recorded ping rate max of 25 Hz during all data acquisition. The multibeam sonar was able to meet the object detection requirement of detection of a 1 meter cube in depths of 20 meters or less and detection of objects equal to 5 percent of depth in water deeper than 20 meters. The multibeam sonar was operated at different range scales throughout the survey by adjusting the depth range to obtain the best coverage in varying depths of water. Table 3 lists the typical 8101 sonar settings for the survey.
OPR-C308-KR-13 New Jersey Coast and Vicinity, NJ July 2013 Data Acquisition and Processing Report Field Unit: David Evans and Associates, Inc.
10
Table 3. Typical Reson 8101 Sonar Settings
8101 Parameter Value
Range Variable, depth dependent Receive Gain Auto Transmit Power 204 dB Spreading 30 dB Absorption 65 dB/km Ping Rate 25 p/s max Pulse Width 30 μs
A8.f Bottom Sampling At the time of DAPR submission 42 of the 47 assigned bottom samples have been acquired within the survey area. These bottom samples were acquired as specified in the HydrographicSurvey Project Instructions (March 25, 2013) in accordance with section 7.1 of the HSSD. Approximate bottom sample locations were provided by NOAA in the file OPR-C308-KR-13Project Preference File (OPR-C308-KR-13_PRF.000). The final sampling plan used these locations with some modification of position to better characterize bottom types as seen in the side scan imagery and to avoid sampling in the vicinity of submerged infrastructure. Additional samples will be collected within the H12597, H12598 and H12599 areas as the survey continues.
A9. Quality Assurance Acquisition and processing methods followed systematic and standardized workflows established by DEA. These systems include, but are not limited to staff training and mentoring, a formalized project management program, record and log keeping standards, software version management, and a multilevel review process.
Single beam and multibeam survey data were converted and processed in CARIS HIPS version 7.1 Service Pack 1 Hotfix 1. Data processing methodologies followed standard CARIS HIPS workflows for single beam and multibeam data.
The default CUBE Parameters.XML was replaced with a file issued by NOAA Hydrographic Surveys Technical Directive 2009-2. This updated XML file uses the resolution dependent maximum propagation distance values required in the NOS HSSD (April 2013).
All side scan contacts that were determined to be significant were investigated with multibeam according to object detection specifications. This technique is shown in Figure 3.

OPR-C308-KR-13 New Jersey Coast and Vicinity, NJ July 2013 Data Acquisition and Processing Report Field Unit: David Evans and Associates, Inc.
11
Figure 3. Side Scan Sonar Mosaic Overlaid with Multibeam and Sonar Contacts
B. QUALITY CONTROL
B1. Data Acquisition
B1.a Side Scan Sonar Triton Isis SS-Logger acquisition software was used to record side scan sonar data in XTF format. Adjustments to towfish height were made during data acquisition as necessary and logged in Isis SS-Logger to meet specifications and provide the best image quality possible. Changes to cable out values, sensor settings, offset configurations, data quality and contacts were recorded in the daily acquisition log. Typical windows for monitoring raw sensor information included a waterfall display for the sonar imagery, tow fish motions, cable out and layback, sonar signal voltage display and I/O port monitor. Data were displayed on a 30-inch LCD flat panel monitor mounted vertically at the acquisition station. The large format display allowed for increased time to analyze online contacts. Contacts were selected in real-time and during post-processing. Additionally, vessel speed was adjusted in accordance with the NOS HSSD (April2013) to meet the required along track coverage requirements.
To aid in the consistency of contact identification, a table was posted at the side scan acquisition station listing slant range and towfish altitude to determine minimum shadow heights for 1 meter contacts at 50-meter and 75-meter ranges. Contacts were classified as significant if their estimated height was 1 meter or greater in waters shallower than 20 meters; and 10 percent of
Area of Contact Development
208-114624-S

OPR-C308-KR-13 New Jersey Coast and Vicinity, NJ July 2013 Data Acquisition and Processing Report Field Unit: David Evans and Associates, Inc.
12
water depth in waters deeper than 20 meters. Efforts to maintain towfish altitude at 8 percent to 20 percent of the range was tasked to the side scan operator who also controlled the winch operation. The operator could view the towfish altitude above the seafloor on the Isis SS-Logger display and adjust cable-out accordingly, to maintain the towfish at the required height. At times environmental conditions and or shallow waters forced the operator to fly the fish under 8 percent of the side scan range scale. In these instances effective side scan sonar range was reduced to 12.5 times the towfish altitude. Digital cable out values were confirmed by stopping pay out of the tow cable when 10-meter marks on the cable were at the top of the block sheave. Using this method, the cable-out meter was calibrated each day prior to deployment and continuously during tow operations.
B1.b Single beam Odom CV100 single beam echosounder data were acquired on the R/V Chinook throughout side scan sonar operations. All single beam data were recorded in HYPACK RAW format. A digital echogram and sonar signal voltage were displayed in HYPACK and recorded in the HYPACK BIN format.
B1.c Multibeam Multibeam echosounder data were collected to develop side scan contacts deemed navigationally significant. In several instances the multibeam head was rotated 15 degrees towards starboard to enable data collection along steep banks adjacent to the shoreline where it not possible to acquire singe beam data. Multibeam data were acquired in HYPACK Hysweep HSX format. Adjustments to the sonar, including changes in range, power and gain were made as necessary, in order to acquire the best bathymetric data quality. Additionally, vessel speed was adjusted in accordance with the NOS HSSD (April 2013) to meet the required along track coverage. Typical windows for monitoring raw sensor information included timing synchronization, vessel motion, number of satellites, HDOP and PDOP. Raw attitude and nadir depth was also recorded in HYPACK RAW format, as a supplementary backup. Multibeam backscatter was logged in Hypack 81X format. Data were processed periodically in CARIS HIPS to evaluate backscatter quality but the processed data is not included with the deliverables.
The HYPACK acquisition station operator monitored and tuned the multibeam sonar, tracked vessel navigation and maintained the digital line log. Operators monitored primary and secondary navigation systems to verify quality position data were acquired at all times.
B2. Methodology Used to Maintain Data Integrity The acquisition systems and survey protocols were designed with some redundancy to demonstrate that the required accuracy was being achieved during the survey and provide a backup to the primary systems. Data integrity was monitored throughout the survey through system comparisons. Two positioning systems were used to provide real-time monitoring of position data. Position confidence checks, single beam and multibeam bar checks, and sound speed comparison checks were conducted weekly to confirm required accuracy was being maintained. Weekly comparison checks were performed by comparing profiles from the primary and secondary sound speed sensors that were acquired concurrently. Sound speed profiles were

OPR-C308-KR-13 New Jersey Coast and Vicinity, NJ July 2013 Data Acquisition and Processing Report Field Unit: David Evans and Associates, Inc.
13
computed for each of the sensors and compared to confirm instrumentation was functioning within survey tolerances.
A flow diagram of the data acquisition and processing pipeline is presented in Figure 4. This diagram graphically illustrates the data pipeline and processing workflow from acquisition to delivery.
Figure 4. Flowchart of Data Acquisition and Processing Pipeline

OPR-C308-KR-13 New Jersey Coast and Vicinity, NJ July 2013 Data Acquisition and Processing Report Field Unit: David Evans and Associates, Inc.
14
B2.a HIPS Conversion Single beam and multibeam data were converted from RAW and HSX format to Caris HDCS format using the HYPACK conversion wizard. HIPS ground coordinates (UTM NAD 83 18N) were selected in the Conversion Wizard dialogue.
When converting single beam data, the device number field for navigation was set to 0 POS/MV since both navigation systems are recorded in the RAW files. When converting multibeam data, the device numbers fields were left blank since there were no duplicate sensors logged in the HSX files. No data were rejected based on quality flags during conversion.
The CARIS output window was reviewed for failures during conversion.
B2.b Vessel Files The HIPS vessel files listed in Table 4 contain all offsets and system biases for the survey vessel and its systems, as well as error estimates for latency, sensor offset measurements, attitude and navigation measurements, and draft measurements.
A side scan sonar vessel file was created to facilitate the review of side scan sonar data in CARIS SIPS by the processing branch. The side scan sonar vessel file was not used during data processing. Instructions for conversion of side scan data into CARIS HIPS using the vessel file are included in Appendix V CARIS SIPS Side Scan Processing Guidance of this document.
Table 4. HIPS Vessel Files
HIPS Vessel File HIPSConverter Sonar Type
OPR-C308-KR-13_VBES_CH Hypack 7.1.1.0 Single beam
OPR-C308-KR-13_MBES_CH Hypack 7.1.1.0 Multibeam
OPR-C308-KR-13_MBES_CH_PATCH Hypack 7.1.1.0 Multibeam
OPR-C308-KR-13_SSS_CH_with_forward_layback N/A Side scan
OPR-C308-KR-13_SSS_CH_without_forward_layback N/A Side scan
Sensor offsets values for the R/V Chinook were calculated prior to the start of project OPR-J977-DE-08. Dynamic draft (settlement and squat) correctors were computed during project OPR-J348-KR-11. Sensor offsets were calculated from the vessel survey and dynamic draft values were calculated through the use of post-processed GPS observations. Prior to starting the OPR-C308-KR-13 project new offsets to the sonar acoustic center were calculated using a laser level to account for a modification to the multibeam mount. Draft (water line) was measured and
OPR-C308-KR-13 New Jersey Coast and Vicinity, NJ July 2013 Data Acquisition and Processing Report Field Unit: David Evans and Associates, Inc.
15
entered daily from draft marks on the port and starboard side of the vessel’s hull. In the morning and evening, port and starboard draft readings were averaged to obtain the vessel draft. Draft changes relative to the vessel reference point were entered into the multibeam vessel configuration file. These corrections are listed in tabular and graphical format in Appendix I Vessel Reports.
Best estimates for total propagated uncertainty (TPU) values were entered into the vessel files based on current knowledge of the TPU/CUBE processing model. The manufacturers’ published values were entered into the static sensor accuracy fields. Other values were either calculated or estimated. Navigation and transducer separation distances from the motion sensor were computed relative to the phase center, vice the top hat, of the motion sensor therefore the vessel file standard deviation offsets will not exactly match the sensor offset values. TPU values for the R/V Chinook are listed in Table 5.

OPR-C308-KR-13 New Jersey Coast and Vicinity, NJ July 2013 Data Acquisition and Processing Report Field Unit: David Evans and Associates, Inc.
16
Table 5. Hydrographic Vessel File TPU Values Manufacturer Accuracy Values for Total Propagation
Uncertainty Computation HIPS Vessel File (HVF)*
Motion Sensor POS/MVPosition System 1 POS/MV Model 320 V 4 Position System 2 DSM132
Gyro - Heading Gyro (°) 0.020 Heave Heave % Amplitude 5.000 Heave (m) 0.050 Roll and Pitch Roll (°) 0.020 Pitch (°) 0.020 Navigation Position Navigation (m) 1.00 Latency Timing Trans (s) 0.005 Nav Timing (s) 0.005 Gyro Timing (s) 0.005 Heave Timing (s) 0.005 Pitch Timing (s) 0.005 Roll Timing (s) 0.005 Measurement Offset X (m) 0.009 Offset Y (m) 0.005 Offset Z (m) 0.008 Speed Vessel Speed (m/s) 0.030 Draft and Loading Loading 0.010 Draft (m) 0.010 Delta Draft (m) 0.026
Physical Alignment Errors* Alignment MRU align Stdev gyro 0.263
MRU align roll/pitch 0.102
*All values given as 1 sigma.

OPR-C308-KR-13 New Jersey Coast and Vicinity, NJ July 2013 Data Acquisition and Processing Report Field Unit: David Evans and Associates, Inc.
17
A tide uncertainty consisting of both measurement and zoning errors was provided via email (Re:Tide File) from CO-OPS and HSD staff on July 22, 2013. A copy of this email is included in OPR-C308-KR-13 Project Correspondence. The total tide uncertainty was entered in the HIPS Tide Value Zoning field during TPU computation. Sound speed and tide TPU values are listed in Table 6.
Table 6. TPU Values for Tide and Sound Speed
Total Propagation Uncertainty Computation in CARIS HIPS
Tide Values Uncertainty (m)
Tide Value Measured 0.000 Tide Value Zoning (H12596) 0.122 Tide Value Zoning (H12597) 0.097 Tide Value Zoning (H12598) 0.097 Tide Value Zoning (H12599) 0.097
Sound Speed Values Uncertainty (m/s)Sound Speed Measured 2.00 Surface Sound Speed 0.500
B2.c Static Draft Static draft marks were surveyed and painted on the port and starboard sides of the R/V Chinook.Port and starboard draft readings were averaged to obtain the draft in relation to the reference point at the center of the vessel. During survey operations, vessel draft was observed at the beginning and end of daily survey operations to compute average draft for the day. This provided an accurate draft reading during survey operations with the majority of the fuel load being burned during transit to and from the survey area. The start and end of day draft values for port and starboard were calculated daily, averaged, and entered into the “Waterline Height” field in the HVF.
B2.d Sound Velocity Sound speed profiles were applied to each line using the nearest in distance within time (one hour for MBES and two hours for SBES) option in the Caris Sound Velocity Profiler (SVP) correct routine. During mainscheme acquisition, profiles were taken at frequent intervals through manual deployment of the AML SV Plus V2 or Sea-Bird SBE 19. Profiles were also taken at each multibeam investigation location.
B3. Bathymetric Data Processing Multibeam data processing followed the standard HIPS workflow for CUBE editing except that the hypothesis surface was not edited. Instead, fliers influencing the CUBE surface were rejected and critical soundings not incorporated in the CUBE surface were designated. Single beam data were edited prior to application of any correctors to allow registration between soundings and the
OPR-C308-KR-13 New Jersey Coast and Vicinity, NJ July 2013 Data Acquisition and Processing Report Field Unit: David Evans and Associates, Inc.
18
digital echogram stored in Hypack BIN format. Unlike the CUBE workflow used during multibeam processing, all single beam fliers were rejected during processing.
Below is the list of correctors and filters applied to the bathymetric data in HIPS. Several of the steps are interim processes (such as the water levels) and were re-applied as needed. The TPU was re-computed for the single beam and multibeam data as needed to reflect changes in the correctors.
Apply true heaveLoad zoned tide Apply daily concatenated sound speed profiles
“Nearest in distance within time 1 or 2 hours” MergeCompute TPU via values listed in Tables 5 and 6 Filters applied based on the following criteria:
Single beam o Reject by depth, Minimum 0.100m
Multibeam o Reject soundings with poor quality flags (0) o Reject by swath width 45/45 (or 45/90 under special circumstances when
adjacent to shoreline) Data reviewed and fliers removed in Single beam Editor, Swath Editor and/or Subset EditorAdd data to field sheet:
“CUBE” weighted surface of appropriate resolution for water depth o International Hydrographic Organization (IHO) S-44 Order 1 o Density & Local Disambiguation method o Advanced configuration using the 2009 NOAA field unit parameters
of the appropriate resolution surface Review CUBE surface and child layers with tiles with reference surface on
One field sheet was created to correspond to each survey. CUBE surfaces were created over the entire survey area using grid-resolution thresholds and resolution dependent maximum propagation distances for complete coverage surveys as specified in the NOS HSSD (April2013). CUBE surfaces using object detection resolution were created over each multibeam investigation of a significant side scan sonar contact. Survey coverage was specifically reviewed to confirm there were no holidays spanning the entire survey swath greater than three nodes or data gaps over significant contacts. The HIPS density layer of each multibeam grid was reviewed to confirm that all multibeam investigations over significant features had either a designated sounding from a nadir beam, or the node overlying the least depth had a density of at least five soundings.
Single beam data were edited and reviewed in the HIPS Single Beam Editor. The digital echogram stored in Hypack BIN format was displayed in the background during editing. Soundings were edited prior to the application of correctors such as sound velocity profiles in

OPR-C308-KR-13 New Jersey Coast and Vicinity, NJ July 2013 Data Acquisition and Processing Report Field Unit: David Evans and Associates, Inc.
19
order for digitized depths and the digital echogram to correctly register in the single beam editor view.
Multibeam data were reviewed in HIPS 2D subset with the CUBE reference surface visible. Soundings rejected by quality filters were displayed during editing, and any feature removed by a filter was manually re-accepted. Fliers making the CUBE surface shoaler than expected by more than the allowable IHO Order One vertical error were rejected. Designated soundings were used as necessary in order to force the finalized depth surface through reliable shoaler soundings when the difference between the surface and sounding was more than one-half the maximum allowable IHO Order one vertical error. Subset tiles were used to track the progress of processing activities. In addition, data processors reviewed sounding data and CUBE surfaces for excessive motion artifacts or systematic biases. All crosslines were manually reviewed for high internal consistency between the datasets and comparison statistics were also computed using the HIPS QC Report tool.
Contacts derived from the daily cursor logs were displayed in the background in HIPS as a drawing exchange format (DXF) file and reviewed were applicable for multibeam coverage and significance. Designated soundings were created to denote the least depth of each significant feature.
B4. GPS Post-processing
Post-processing of GPS and inertial data was used to aid in the determination of alignment offsets for some patch tests where the use of DGPS navigation made it difficult to accurately resolve alignment angles.
Applanix POSPac MMS software was used to create a post-processed navigation solution included new position, height, heading and attitude measurements in Smoothed Best Estimate of Trajectory (SBET) format. The SBET file was applied to the patch test data using the HIPS Load Navigation/Attitude Data tool during patch test processing and analysis.
B5. Final Bathymetric Processing Upon the completion of editing single beam and multibeam data in HIPS, finalized CUBE grids were generated using the “greater of the two” option for the final uncertainty value. Selected soundings and contours were generated from the surfaces and used for chart comparison purposes, but are not included with the deliverables.
Designated soundings were used as a starting point for S-57 feature creation. Designated soundings that were determined to be obstructions, rocks, wrecks, or other significant features were imported into the S-57 feature files and attributed. S-57 objects were created for all new and incorrectly charted baring features.
All features were created using the NOAA Profile object catalogue which references the NOAA Extended Attributes defined in the NOS HSSD (April 2013). The NOAA extended attribute files

OPR-C308-KR-13 New Jersey Coast and Vicinity, NJ July 2013 Data Acquisition and Processing Report Field Unit: David Evans and Associates, Inc.
20
were received by email from the Contracting Officer’s Representative (COR) on June 6, 2013. All mandatory feature attributes have been populated. In addition, the pictures attribute has been used to provide multibeam and side scan screen shots of features. The feature file also includes meta-object M_COVR.
B6. Side Scan Processing After acquisition, the XTF fish navigation was overwritten by the ship navigation using Triton Inc. software. The side scan bottom track was then reviewed in Chesapeake Technologies SonarWiz and loss of bottom or incorrect bottom track areas were re-digitized. The newly bottom tracked files were exported to XTF and two independent reviews were performed in Triton Isis and TargetPro to identify significant contacts. Contacts in depths less than or equal to 20 meters were classified as significant, if their estimated height was at least one meter. In depths greater than 20 meters, contacts with heights greater than 10 percent of the depth were classified as significant. In most cases side scan contacts were determined to be significant if the measured height was within 25 centimeters of the significant height requirement to allow for contact measurement error. Also contacts with minimal shadow heights were classified as significant if there were areas deemed to be critical to navigation, or if they appeared to be mounds or other geologic structures, which cast little or no shadow.
Sonar contacts were processed using Triton TargetPro software. Management of side scan sonar contacts was accomplished by utilizing an in-house utility created for contact tracking and meeting the requirements of the NOS HSSD (April 2013). The database was maintained and stored in Microsoft Access using the .MDB file format. Contacts were added into the database on a daily basis upon completion of the side scan review and contact identification. The use of the .MDB format allowed direct geographic display of contacts and spatial queries within ESRI ArcGIS, where contacts were correlated and compared to the chart and other survey data.
Side scan mosaics were created using Trition Imaging, Inc. Isis and DelphMap. Bottom track and layback were previously processed and reviewed in Chesapeake Technologies SonarWiz. Signal processing was performed during the mosaic creation in order to improve the overall appearance of the final images. User defined time varied gain curves were developed to enhance the mosaic. Georeferenced mosaics were generated in Tagged Image File Format (TIF) with an associated world file (TWF) at 1-meter resolution for each 100 percent survey coverage.
C. CORRECTIONS TO ECHO SOUNDINGS
C1. Static Draft With the vessel out of the water, markings were surveyed and painted on the hull of the R/VChinook providing a means to monitor vessel draft. Static draft readings from the port and starboard side were recorded at the start and end of each survey day. The start and end of day draft values for the sonar were calculated from the average of the port and starboard draft readings. The average draft value best approximates the true draft value during acquisition due to loading changes from fuel consumption during transit to and from the survey area at the start and

OPR-C308-KR-13 New Jersey Coast and Vicinity, NJ July 2013 Data Acquisition and Processing Report Field Unit: David Evans and Associates, Inc.
21
end of each day. Ultimately, the daily draft values were used to calculate daily draft relative the HIPS reference point which was entered into the waterline field in the Caris HVF files.
C2. Dynamic Draft A settlement and squat test using RTK GPS observations was performed on September 16, 2011 during project OPR-J348-KR-11. No modifications which would impact the settlement and squat curves were made after the tests were performed. Results from these tests are included in Appendix I Vessel Reports.
The settlement and squat values were obtained by computing three-minute GPS height averages at different ship speeds, measured in knots and revolutions per minute (RPM) during transects. Transect were run twice at each RPM interval with the second transect run at a heading, opposite of the first.
After running a series of 1000 RPM transects, ship speeds at increments of 200 RPMs were observed from 1,000 RPM to 3,000 RPM with additional transects run at 4,000 RPM. GPS heights were recorded at 1 Hz. With the vessel at rest, static RTK height observations were recorded between each RPM interval in order to have a baseline GPS height value not affected by tide changes during the test. Three-minute running averages of GPS height were calculated to remove any heave bias from the calculations. Each transect was run for approximately three minutes resulting in one average GPS height measurement per transect. Dynamic draft correctors were then calculated from the difference between the GPS height and an interpolated static GPS height (to account for changing tide) at the time of the average height value. The average speed for each RPM interval and the average dynamic draft corrector were entered into the HIPS vessel file.
C3. Bar Check ComparisonsWeekly bar checks were performed to confirm that the single beam and multibeam sonars were functioning properly and static draft was accurately documented. A 2-foot circular metal plate, attached to three wires, with a mushroom anchor attached to its bottom for stability, was used for the multibeam bar check. A flat metal bar 0.40 feet wide with metal chains attached to either end was constructed to bar check the single beam. Marks were placed on each bar check device at 3 meters. The marks were checked periodically with a measuring tape.
The individual bar check devices were lowered to 3 meters depth below the water surface, a point above the natural bottom, where it could be clearly ensonified. The depth of the bar was compared to the depth of the bar reported by the sonars. Observations were recorded in a comparison log. Tabulated bar check comparisons may be found in the Weekly Bar Check logs included in Appendix II Echosounder Reports.
C4. Heave, Roll and Pitch CorrectionsAn Applanix POS/MV 320 v4 integrated dual frequency GPS and inertial reference system was used for the motion sensor for this survey. The POS/MV 320 is a 6-degree of freedom motion unit, with a stated accuracy of 0.05-meter or 5 percent for heave, 0.01 degrees for roll and pitch

OPR-C308-KR-13 New Jersey Coast and Vicinity, NJ July 2013 Data Acquisition and Processing Report Field Unit: David Evans and Associates, Inc.
22
and heading. Real-time displays of the vessel motion accuracy were monitored throughout the survey with the MV-POSView controller program. If any of the vessel motion accuracy degraded to greater than 0.05 degrees root mean square (RMS), survey operations would be suspended until the inertial unit was able to regain the higher degree of accuracy. Manufacturer reported accuracies as published on the Caris HIPS TPU website (http://www.caris.com/tpu/)were entered into the HVF and used for TPU computations.
Schematics of the vessel and sensor set-up for the R/V Chinook are located in Appendix I VesselReports.
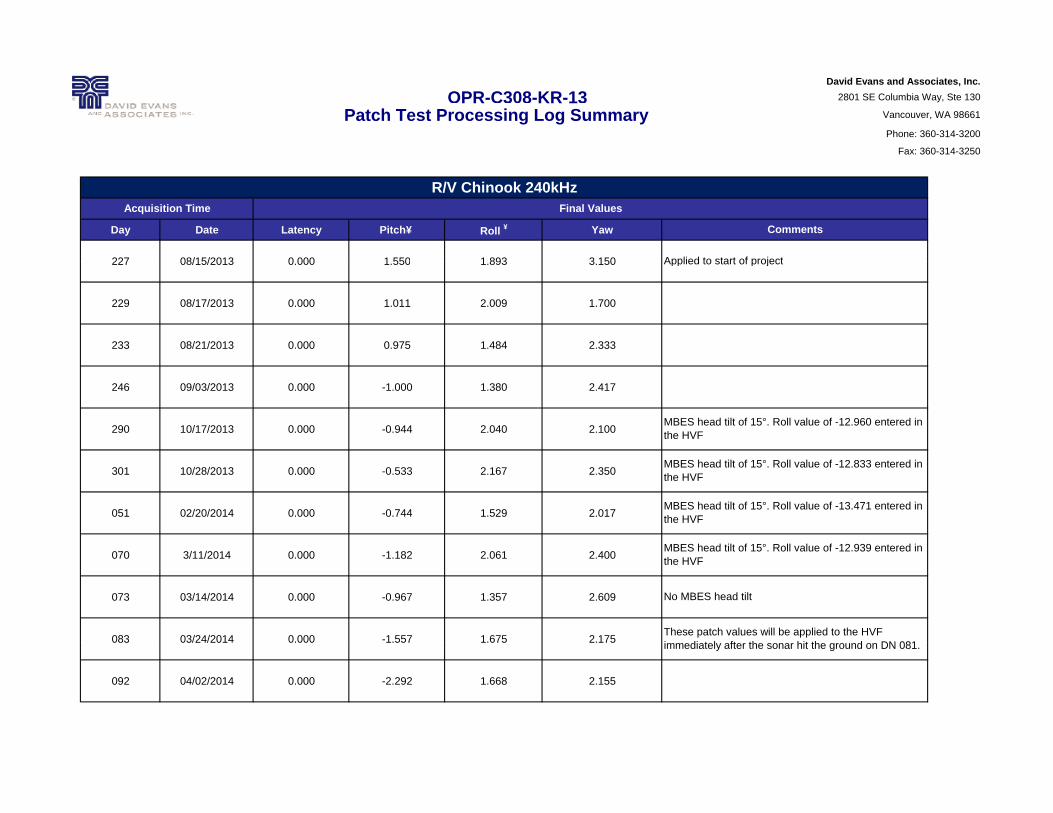
C5. Patch Tests Multibeam patch tests were conducted for the R/V Chinook to measure alignment offsets between the IMU sensor and the multibeam transducer and to determine time delays between the time-tagged sensor data. Multiple patch tests were performed throughout the project to verify the adequacy of the system biases. Patch tests were performed periodically throughout the project including at the beginning of the project, after any system replacement, and at the end of the project. Each patch test consisted of a series of lines run in a specific pattern, which were then used in pairs to analyze roll, pitch and heading alignment bias angles.
A precise timing latency test was performed by running a single line over a flat bottom with induced vessel motion. The line was then opened in the HIPS calibration editor (after applying tide and SVP corrections) and a small along-track slice of data was evaluated in the outer swath of the line for motion artifacts. Incremental changes to the roll time offset were made to evaluate the performance of the precise timing setup and to determine if a latency correction was needed. No latency was found in the system.
Roll alignment was determined by evaluating the reciprocal lines run over a flat bottom used for the latency test. The pitch tests consisted of set of reciprocal lines located on a steep slope or over a submerged feature. The yaw error was determined by running parallel lines over the same area as the pitch tests. All lines were run at approximately 3 knots to 6 knots. Patch tests were run in the local survey area. Selected pairs of lines were then analyzed in HIPS Calibration editor to measure the angular sensor bias values. Visual inspection of the data confirmed each adjustment. In general, two sets of lines were run and analyzed for each of the mounting biases with the second set used to confirm the results of the data.
Sonar offsets and alignment angles computed during patch tests were entered into the HVF. Sonar roll and pitch values were entered in HVF SVP1 entry rather than the Swath1 in order for the HIPS Sound Velocity tool to work correctly.
C6. Tide and Water Level Corrections The primary water level station for this project was Atlantic City, New Jersey (8534720). The HSD provided HIPS Zone Definition File (ZDF) was revised with permission from HSD staff and renamed C308KR2013CORP_rev to denote the revision. This revision required moving the inshore limit of zone SA18 in order to fully encompass the survey area. This file was used to

OPR-C308-KR-13 New Jersey Coast and Vicinity, NJ July 2013 Data Acquisition and Processing Report Field Unit: David Evans and Associates, Inc.
23
apply zoned tides to the bathymetric data. The primary station experienced no down time during periods of hydrographic survey.
In November 2013 NOAA’s Center for Operational Oceanographic Products and Services (CO-OPS) adjusted all verified water levels for station 8534720 by 1.2 centimeters. All tides applied to this project include this adjustment. A copy of the email verifying the change is included in OPR-C308-KR-13 Project Correspondence.
C7. Sound Velocity Correction Manual sound velocity casts were taken approximately every 90 minutes throughout each survey day with the first cast of the day acquired onsite prior the start of daily survey operations.
A sound speed cast was taken by lowering the AML SV Plus V2 or SeaBird SBE 19 sensor to the bottom while the vessel was holding station. A HYPACK target was taken to record the time and position of the cast which would later be entered into the HIPS sound velocity file. The sampling period was increased if large changes in sound speed were observed between casts. During concurrent single beam and side scan acquisition, casts were taken more frequently if refraction artifacts were visible in the side scan sonar record. During multibeam item investigations, casts were taken in the vicinity of each investigation.
Weekly checks were completed to verify pressure sensor and SV instrument performance. Corrections for the speed of sound through the water column were computed for each sensor. Sound speed profiles were imported and overlaid for comparison into an Excel file. All comparisons were well within survey specification. Weekly check results are included in Separate II Sound Speed Data Summary of the Descriptive Reports.
The sound speed correction was applied to each line using the nearest in distance within time (one hour for MBES and two hours for SBES) option in the HIPS SVP correct routine. All casts were concatenated into a HIPS SVP file for each survey day. Time, position, depth, and sound speed for each profile were included in the HIPS file.
D. APPROVAL SHEET The letter of approval for this report follows on the next page.

2801 SE Columbia Way, Ste. 130, Vancouver Washington 98661 Telephone: 360.314.3200 Facsimile: 360.314.3250
LETTER OF APPROVAL
OPR-C308-KR-13 DATA ACQUISITION AND PROCESSING REPORT
This report and the accompanying data are respectfully submitted.
Field operations contributing to the accomplishment of OPR-C308-KR-13 were conducted under my direct supervision with frequent personal checks of progress and adequacy. This report and associated data have been closely reviewed and are considered complete and adequate as per the OPR-C308-KR-13 Statement of Work (June 20, 2013) and Hydrographic Survey Project Instructions (June 27, 2013).
_____________________________________________Jonathan L. Dasler, PE (OR), PLS (OR,CA)
NSPS/THSOA Certified Hydrographer Chief of Party
_____________________________________________Jason Creech
Lead Hydrographer
David Evans and Associates, Inc. July 2013
Digitally signed by Jon Dasler DN: cn=Jon Dasler, o=David Evans and Associates, Inc., ou=Marine Services Division, [email protected], c=US Date: 2014.03.14 11:19:36 -07'00'
Digitally signed by Jason Creech DN: cn=Jason Creech, o=David Evans and Associates, Inc., ou=Marine Services Division, [email protected], c=US Date: 2014.03.14 11:20:07 -07'00'

OPR-C308-KR-13 New Jersey Coast and Vicinity, NJ July 2013 Data Acquisition and Processing Report Field Unit: David Evans and Associates, Inc.
25
E. TABLE OF ACRONYMS AML Applied Microsystems, Ltd AWOIS Automated Wreck and Obstruction Information System CO-OPS Center for Operational Oceanographic Products and Services COR Contracting Officer’s Representative CTD Conductivity, Temperature, Depth CUBE Combined Uncertainty and Bathymetry EstimatorDEA David Evans and Associates, Inc. DGPS Differential Global Positioning System DN Day Number DXF Drawing Exchange FormatFP Feature Pack GPS Global Positioning System HIPS Hydrographic Information Processing System HSD Hydrographic Surveys Division HSSD Hydrographic Survey Specifications and Deliverables HSX Hypack Hysweep File Format HVF HIPS Vessel FileIHO International Hydrographic Organization IMU Inertial Motion Unit MB Megabyte MP Multi Pulse MVP Moving Vessel Profiler NMEA National Marine Electronics Association NOAA National Oceanic and Atmospheric Administration NOS National Ocean Service NWLON National Water Level Observation Network POS/MV Position and Orientation System for Marine Vessels PPS Pulse per Second PRF Project Reference File R/V Research Vessel RMS Root Mean Square RPM Revolutions per Minute SBET Smoothed Best Estimate of Trajectory SSS Side Scan Sonar SVP Sound Velocity ProfilerTIF Tagged Image File Format TPU Total Propagated Uncertainty TWF TIF World File USCG U.S. Coast Guard UTC Universal Time Coordinated XTF Extended Triton Format ZDA Global Positioning System Timing Message ZDF Zone Definition File

APPENDIX II
ECHOSOUNDER REPORTS
David Evans and Associates, Inc.
OPR-C308-KR-13 2801 SE Columbia Way, Ste 130
Patch Test Processing Log Summary Vancouver, WA 98661
Phone: 360-314-3200
Fax: 360-314-3250
Day Date Latency Pitch¥ Roll ¥ Yaw
227 08/15/2013 0 000 1 550 1 893 3 150
Acquisition Time
Applied to start of project
Final Values
R/V Chinook 240kHz
Comments
227 08/15/2013 0.000 1.550 1.893 3.150
229 08/17/2013 0.000 1.011 2.009 1.700
233 08/21/2013 0.000 0.975 1.484 2.333
Applied to start of project
246 09/03/2013 0.000 -1.000 1.380 2.417
290 10/17/2013 0.000 -0.944 2.040 2.100MBES head tilt of 15°. Roll value of -12.960 entered in the HVF
301 10/28/2013 0.000 -0.533 2.167 2.350
051 02/20/2014 0.000 -0.744 1.529 2.017MBES head tilt of 15°. Roll value of -13.471 entered in the HVF
MBES head tilt of 15° Roll value of 12 939 entered in
MBES head tilt of 15°. Roll value of -12.833 entered in the HVF
070 3/11/2014 0.000 -1.182 2.061 2.400
073 03/14/2014 0.000 -0.967 1.357 2.609
083 03/24/2014 0.000 -1.557 1.675 2.175These patch values will be applied to the HVF i di t l ft th hit th d DN 081
MBES head tilt of 15 . Roll value of -12.939 entered in the HVF
No MBES head tilt
083 03/24/2014 0.000 1.557 1.675 2.175
092 04/02/2014 0.000 -2.292 1.668 2.155
immediately after the sonar hit the ground on DN 081.

David Evans and Associates, Inc.
OPR-C308-KR-13 2801 SE Columbia Way, Ste 130
Patch Test Processing Log Summary Vancouver, WA 98661
Phone: 360-314-3200
Fax: 360-314-3250
Day Date Latency Pitch¥ Roll ¥ Yaw
Acquisition Time Final Values
R/V Chinook 240kHz
Comments
109 04/19/2014 0 000 -1 875 1 720 2 200109 04/19/2014 0.000 -1.875 1.720 2.200
127 5/7/2014 0.000 -1.980 1.708 2.067
128 05/08/2014 0.000 -1.350 1.730 1.970
MBES head tilt of 15°. Roll value of -13.257 entered in the HVF
MBES head tilt of 15°. Roll value of -13.270 entered in the HVF
¥Pitch and Roll entered into Caris HIPS vessel file SVP sensor as discussed in OPR-C308-KR-13 Data Acquisition and Processing Report
T t l P t d U t i tFinal Values
0.263
0.102MRU Align StdDev Roll/Pitch
Field
MRU Align StdDev Gyro
Total Propagated UncertaintySource
Standard deviation of all yaw alignment values from DN227 to DN301
Averaged standard deviation of all roll and pitch alignment values from DN227 to DN301

David Evans and Associates, Inc.
2801 SE Columbia Way, Ste 130
Vancouver, WA 98661
Phone: 360-314-3200Fax: 360-314-3250
Week of Day No. Line Name Bar Depth (m)
Raw Multibeam Depth (m)
Waterline Correction (m) + dwn
Port Vessel
Draft (m)
Starboard Vessel Draft
(m)
Average Vessel Draft
(m)
Roll (+ Port Up)
Degrees
Roll Corrector
(m)
Pitch (+ Bow Up)
Degrees
Pitch Corrector
(m)
Measured Average SV
(m/s)
SV Corrected Raw Depth
(m)
Corrected Depth (m)
Difference (m)
07/14/2013 198 2013CH1982114 3.000 2.960 -0.035 0.480 0.590 0.535 1.701 0.039 0.046 0.001 1528.0 2.960 3.035 0.035
07/21/2013 206 2013CH2061130 3.000 2.420 -0.025 0.480 0.570 0.525 1.200 0.005 0.522 0.011 1528.0 2.465 3.029 0.029
07/28/2013 210 2013CH2101449 3.000 2.470 -0.020 0.500 0.540 0.520 0.868 0.027 0.460 0.007 1526.7 2.514 3.050 0.050
08/04/2013 No Field Operations08/11/2013 225 2013CH2252222 3.000 2.480 -0.015 0.480 0.550 0.515 1.680 0.038 0.526 0.013 1526.70 2.524 3.067 0.067
08/18/2013 No Field Operations08/25/2013 238 2013CH2381249 3.000 2.440 -0.030 0.480 0.580 0.530 0.850 0.019 0.990 0.024 1523.20 2.478 3.041 0.041
09/01/2013 247 2013CH2472058 3.000 2.430 -0.035 0.480 0.590 0.535 2.086 0.048 0.961 0.024 1522.40 2.466 3.052 0.052
09/08/2013 253 2013CH2531359 3.000 2.440 -0.020 0.470 0.570 0.520 1.919 0.044 0.819 0.020 1520.3 2.473 3.047 0.047
09/15/2013 260 2013CH2601303 3.000 2.460 -0.010 0.470 0.550 0.510 1.366 0.031 0.831 0.021 1511.1 2.478 3.030 0.030
09/22/2013 266 2013CH2661553 3.000 2.440 -0.020 0.460 0.580 0.520 0.912 0.021 0.725 0.018 1512.7 2.461 3.009 0.009
09/29/2013 272 2013CH2721146 3.000 2.450 -0.020 0.480 0.560 0.520 1.697 0.039 0.676 0.017 1513.2 2.472 3.037 0.037
10/06/2013* No Field Operations10/13/2013 288 2013CH2881340 3.000 2.480 -0.025 0.530 0.520 0.525 0.736 0.000 1.027 0.000 1507.0 2.492 3.049 0.049
10/20/2013 293 2013CH2931321 3.000 2.480 -0.005 0.480 0.530 0.505 0.770 0.018 0.840 0.021 1508.5 2.494 3.037 0.037
10/2 /2013 304 2013CH3041848 3 000 2 460 0 01 0 4 0 0 60 0 1 1 842 0 042 0 42 0 018 1499 0 2 4 8 3 034 0 034
OPR-C308-KR-13R/V Chinook WEEKLY VBES BAR CHECKS
10/27/2013 304 2013CH3041848 3.000 2.460 -0.015 0.470 0.560 0.515 1.842 0.042 0.742 0.018 1499.0 2.458 3.034 0.034
11/03/2013 308 2013CH30819096 3.000 2.480 -0.005 0.490 0.520 0.505 0.689 0.016 0.794 0.020 1496.0 2.473 3.014 0.014
11/10/2013 318 2013CH3182042 3.000 2.480 -0.020 0.490 0.550 0.520 1.486 0.034 1.279 0.032 1476.9 2.442 3.027 0.027
11/17/2013 No Field Operations11/24/2013 No Field Operations12/01/2013 337 2013CH3371612 3.000 2.530 -0.020 0.490 0.550 0.520 0.074 0.002 0.021 0.021 1473.5 2.485 3.028 0.028
12/08/2013 345 2013CH3451350 3.000 2.530 -0.020 0.500 0.540 0.520 -0.100 -0.002 0.025 0.025 1468.0 2.476 3.018 0.018
12/15/2013 351 2013CH3511311 3.000 2.520 -0.015 0.490 0.540 0.515 -0.250 -0.006 0.006 0.006 1470.3 2.470 2.986 -0.014
01/12/2014 14 2014CH0141531 3.000 2.520 -0.015 0.480 0.550 0.515 0.775 0.018 0.010 0.010 1463.6 2.459 3.001 0.001
01/19/2014 20 2014CH0201525 3.000 2.530 -0.035 0.490 0.580 0.535 1.044 0.024 0.018 0.018 1459.9 2.462 3.039 0.039
01/26/2014 26 2014CH0262008 3.000 2.560 -0.020 0.480 0.560 0.520 1.847 0.042 0.007 0.007 1445.0 2.466 3.036 0.036
02/02/2014 33 2014CH0332019 3.000 2.470 -0.030 0.480 0.580 0.530 1.218 0.028 0.012 0.012 1454.5 2.395 2.964 -0.036
02/09/2014 46 2014CH0461311 3.000 2.560 -0.015 0.490 0.540 0.270 0.067 0.002 0.011 0.011 1453.6 2.481 3.008 0.008
02/23/2014¥ 55 2014CH0552008 3.000 2.570 -0.010 0.470 0.550 0.275 0.176 0.004 0.010 0.010 1459.7 2.501 3.025 0.025

David Evans and Associates, Inc.
2801 SE Columbia Way, Ste 130
Vancouver, WA 98661
Phone: 360-314-3200Fax: 360-314-3250
Week of Day No. Line Name Bar Depth (m)
Raw Multibeam Depth (m)
Waterline Correction (m) + dwn
Port Vessel
Draft (m)
Starboard Vessel Draft
(m)
Average Vessel Draft
(m)
Roll (+ Port Up)
Degrees
Roll Corrector
(m)
Pitch (+ Bow Up)
Degrees
Pitch Corrector
(m)
Measured Average SV
(m/s)
SV Corrected Raw Depth
(m)
Corrected Depth (m)
Difference (m)
OPR-C308-KR-13R/V Chinook WEEKLY VBES BAR CHECKS
02/23/2014 60 2014CH0601128 3.000 2.580 0.000 0.460 0.540 0.270 -0.081 -0.002 0.020 0.020 1452.3 2.498 3.016 0.016
03/02/2014 65 2014CH0651633 3.000 2.580 -0.010 0.450 0.570 0.285 0.519 0.012 0.013 0.013 1450.4 2.495 3.029 0.029
03/09/2014 73 2014CH0731144 3.000 2.570 -0.025 0.490 0.560 0.525 0.313 0.007 0.611 0.015 1454.2 2.492 3.039 0.039
03/16/2014 77 2014CH0771356 3.000 2.540 -0.020 0.470 0.570 0.520 1.737 0.040 -0.095 -0.002 1455.3 2.464 3.022 0.022
03/23/2014 82 2014CH0821611 3.000 2.520 -0.020 0.470 0.570 0.520 1.421 0.032 0.418 0.010 1465.5 2.462 3.025 0.025
03/30/2014 93 2014CH0901420 3.000 2.530 -0.020 0.490 0.550 0.520 1.337 0.031 0.532 0.013 1464.6 2.470 3.034 0.034
04/06/2014 97 2014CH0972111 3.000 2.550 0.002 0.460 0.535 0.498 0.699 0.016 0.525 0.013 1477.1 2.511 3.037 0.037
04/13/2014 104 2014CH1041416 3.000 2.490 -0.018 0.480 0.555 0.518 0.998 0.023 0.360 0.009 1485.8 2.466 3.016 0.016
04/20/2014 110 2014CH1101156 3.000 2.540 -0.020 0.520 0.520 0.520 -0.130 -0.003 0.327 0.008 1481.5 2.509 3.034 0.034
04/27/2014 No Field Operations05/04/2014 127 2014CH1271211 3.000 2.490 -0.035 0.480 0.590 0.535 -0.072 -0.002 0.706 0.017 1495.2 2.482 3.033 0.033
05/04/2014 129 2014CH1292127 3.000 2.500 -0.010 0.480 0.540 0.510 0.125 0.003 0.870 0.022 1501.6 2.503 3.037 0.037
0.028
0.019
* No weekly checks conducted for the week of 10/06/2013; only one day of survey operations for the week.
Standard Deviation
Mean
¥ There are nine days between system checks for the weeks of 02/09/2014 and 02/23/2014.

David Evans and Associates, Inc.
2801 SE Columbia Way, Ste 130
Vancouver, WA 98661
Phone: 360-314-3200Fax: 360-314-3250
Week of Day No. Line Name Bar Depth (m)
Raw Multibeam Depth (m)
Waterline Correction (m) + dwn
Port Vessel
Draft (m)
Starboard Vessel Draft
(m)
Average Vessel Draft
(m)
Roll (+ Port Up)
Degrees
Roll Corrector
(m)
Pitch (+ Bow Up)
Degrees
Pitch Corrector
(m)
Measured Average SV
(m/s)
SV Corrected Raw Depth
(m)
Corrected Depth (m)
Difference (m)
07/21/2013 206 2013CH2061112 3.000 1.720 -0.250 0.480 0.570 0.525 1.692 0.050 0.394 0.008 1500.0 1.720 2.978 -0.022
07/28/2013 210 2013CH2101515 3.000 1.760 -0.020 0.500 0.540 0.520 1.927 0.057 0.339 0.007 1526.0 1.791 3.049 0.049
08/04/2013 No Field Operations08/11/2013 225 2013CH2252238 3.000 1.780 -0.015 0.480 0.550 0.515 1.693 0.050 -0.054 -0.001 1526.7 1.812 3.050 0.050
08/18/2013 235 2013CH2351838 3.000 1.770 -0.020 0.480 0.560 0.520 1.586 0.047 0.800 0.016 1523.0 1.797 3.055 0.055
08/25/2013 238 2013CH2381308 3.000 1.770 -0.030 0.480 0.580 0.530 2.147 0.063 0.504 0.010 1523.0 1.797 3.075 0.075
09/01/2013 247 2013CH2472122 3.000 1.760 -0.035 0.480 0.590 0.535 2.292 0.067 0.648 0.013 1522.4 1.786 3.077 0.077
09/08/2013 253 2013CH2531434 3.000 1.760 -0.020 0.470 0.570 0.520 1.580 0.046 0.850 0.017 1522.2 1.786 3.045 0.045
09/15/2013 260 2013CH2601319 3.000 1.780 -0.010 0.470 0.550 0.510 0.740 0.022 0.660 0.013 1510.8 1.793 3.013 0.013
09/22/2013 266 2013CH2661622 3.000 1.730 -0.020 0.460 0.580 0.520 1.710 0.050 0.820 0.016 1512.7 1.745 3.006 0.006
09/29/2013 272 2013CH2721212 3.000 1.790 -0.020 0.480 0.560 0.520 0.336 0.010 0.660 0.013 1513.2 1.806 3.024 0.024
10/06/2013* No Field Operations10/13/2013 288 2013CH2881357 3.000 1.790 -0.025 0.530 0.520 0.525 0.200 0.006 0.600 0.012 1517.0 1.810 3.028 0.028
10/20/2013 293 2013CH2931357 3.000 1.780 -0.005 0.480 0.530 0.505 0.870 0.026 0.510 0.010 1508.7 1.790 3.006 0.006
10/27/2013 304 2013CH3041750 3.000 1.770 -0.015 0.470 0.560 0.515 1.580 0.046 0.470 0.009 1498.0 1.768 3.014 0.014
11/03/2013 308 2013CH3081921 3 000 1 0 0 00 0 490 0 20 0 0 1 180 0 03 0 320 0 006 1496 0 1 6 2 986 0 014
OPR-C308-KR-13R/V Chinook WEEKLY MBES BAR CHECKS
11/03/2013 308 2013CH3081921 3.000 1.770 -0.005 0.490 0.520 0.505 1.180 0.035 0.320 0.006 1496.0 1.765 2.986 -0.014
11/10/2013 318 2013CH3182114 3.000 1.760 -0.020 0.490 0.550 0.520 1.880 0.055 0.710 0.014 1476.9 1.733 2.997 -0.003
11/17/2013 No Field Operations11/24/2013 No Field Operations12/01/2013 337 2013CH3371650 3.000 1.810 -0.020 0.490 0.550 0.520 0.760 0.022 0.830 0.017 1473.4 1.778 3.012 0.012
12/08/2013 345 2013CH3451410 3.000 1.820 -0.020 0.500 0.540 0.520 1.320 0.039 0.470 0.009 1468.0 1.781 3.024 0.024
12/15/2013 351 2013CH3511343 3.000 1.820 -0.015 0.490 0.540 0.515 0.599 0.018 0.030 0.001 1470.4 1.784 2.992 -0.008
12/22/2013 No Field Operations12/29/2013 No Field Operations01/05/2014 No Field Operations01/12/2014 14 2014CH0141604 3.000 1.820 -0.015 0.480 0.550 0.515 1.180 0.035 0.100 0.002 1463.0 1.775 3.002 0.002
01/19/2014 20 2014CH0201549 3.000 1.780 -0.035 0.490 0.580 0.535 1.140 0.034 -0.180 -0.004 1459.9 1.732 2.972 -0.028
01/26/2014 26 2014CH0262053 3.000 1.780 -0.020 0.480 0.560 0.520 1.980 0.058 0.210 0.004 1445.0 1.715 2.972 -0.028
02/02/2014 33 2014CH0332035 3.000 1.820 -0.030 0.480 0.580 0.530 1.530 0.045 0.460 0.009 1454.5 1.765 3.024 0.024
02/09/2014 46 2014CH0461355 3.000 1.810 -0.015 0.490 0.540 0.515 0.630 0.019 0.330 0.007 1453.4 1.754 2.969 -0.031
02/23/2014¥ 55 2014CH0552056A 3.000 1.790 -0.010 0.470 0.550 0.510 1.200 0.035 0.280 0.006 1459.2 1.741 2.967 -0.033
02/23/2014 60 2014CH0601151 3.000 1.850 0.000 0.460 0.540 0.500 0.160 0.005 0.520 0.010 1452.3 1.791 2.981 -0.019

David Evans and Associates, Inc.
2801 SE Columbia Way, Ste 130
Vancouver, WA 98661
Phone: 360-314-3200Fax: 360-314-3250
Week of Day No. Line Name Bar Depth (m)
Raw Multibeam Depth (m)
Waterline Correction (m) + dwn
Port Vessel
Draft (m)
Starboard Vessel Draft
(m)
Average Vessel Draft
(m)
Roll (+ Port Up)
Degrees
Roll Corrector
(m)
Pitch (+ Bow Up)
Degrees
Pitch Corrector
(m)
Measured Average SV
(m/s)
SV Corrected Raw Depth
(m)
Corrected Depth (m)
Difference (m)
OPR-C308-KR-13R/V Chinook WEEKLY MBES BAR CHECKS
03/02/2014 65 2014CH0651659 3.000 1.850 -0.010 0.450 0.570 0.510 0.360 0.011 0.280 0.006 1450.4 1.789 2.990 -0.010
03/09/2014 73 2014CH0731220 3.000 1.850 -0.025 0.490 0.560 0.525 0.300 0.009 0.210 0.004 1454.1 1.793 3.006 0.006
03/16/2014 77 2014CH0771422 3.000 1.830 -0.020 0.470 0.570 0.520 2.070 0.061 0.090 0.002 1455.4 1.776 3.033 0.033
03/23/2014 82 2014CH0822015 3.000 1.800 -0.020 0.470 0.570 0.520 1.570 0.046 0.280 0.006 1465.5 1.759 3.005 0.005
03/30/2014 90 2014CH0901435 3.000 1.830 -0.020 0.490 0.550 0.520 0.580 0.017 0.270 0.005 1464.6 1.787 3.004 0.004
04/06/2014 97 2014CH0972123A 3.000 1.850 0.002 0.460 0.535 0.498 0.480 0.014 0.350 0.007 1477.1 1.822 3.015 0.015
04/13/2014 104 2014CH1041432 3.000 1.770 -0.018 0.480 0.555 0.518 0.980 0.029 0.150 0.003 1485.8 1.753 2.978 -0.022
04/20/2014 110 2014CH1101213 3.000 1.820 -0.020 0.520 0.520 0.520 -0.040 -0.001 0.430 0.009 1485.5 1.802 3.005 0.005
04/27/2014 No Field Operations05/04/2014 127 2014CH1271249 3.000 1.820 -0.035 0.480 0.590 0.535 0.340 0.010 0.070 0.001 1495.2 1.814 3.036 0.036
05/04/2014 129 2014CH1292149 3.000 1.830 -0.010 0.480 0.540 0.510 0.190 0.006 0.570 0.011 1501.6 1.832 3.034 0.034
0.0120.029
* No weekly checks conducted for the week of 10/06/2013; only one day of survey operations for the week.¥ There are nine days between system checks for the weeks of 02/09/2014 and 02/23/2014.
Standard DeviationMean