Data Acquisition and Processing Report Acquisition and Processing Report NOAA Ship Rainier (s221)...
34
U.S. DEPARTMENT OF COMMERCE NATIONAL OCEANIC AND ATMOSPHERIC ADMINISTRATION NATIONAL OCEAN SERVICE Data Acquisition and Processing Report LOCALITY CHIEF OF PARTY LIBRARY and ARCHIVES Type of Survey Project No. Time Frame State General Locality 2009 Hydrographic OPR-N395-RA-09 April - May 2009 Washington Central Puget Sound Captain Donald W. Haines, NOAA DATE
Transcript of Data Acquisition and Processing Report Acquisition and Processing Report NOAA Ship Rainier (s221)...

U.S. DEPARTMENT OF COMMERCENATIONAL OCEANIC AND ATMOSPHERIC ADMINISTRATION
NATIONAL OCEAN SERVICE
Data Acquisition and Processing Report
LOCALITY
CHIEF OF PARTY
LIBRARY and ARCHIVES
Type of Survey
Project No.
Time Frame
State
General Locality
2009
Hydrographic
OPR-N395-RA-09
April - May 2009
Washington
Central Puget Sound
Captain Donald W. Haines, NOAA
DATE

Data Acquisition and Processing Report NOAA Ship Rainier (s221)
OPR-N395-RA-09 Central Puget Sound, Washington
Hydrographic Survey Project Instructions dated March 10, 2008 Chief of Party: Captain Donald W. Haines, NOAA
A. EQUIPMENT This Data Acquisition and Processing Report describes both the survey equipment used and the standard methods for acquisition applied to the equipment used. Not necessarily all equipment described within this report was used during data acquisition for all sheets of this project. Data were acquired by the following Rainier survey launches: Hull Number Vessel type 1101 29 foot Jensen jet drive survey launch 1103 28 foot Munson jet drive work boat
2801 28 foot Jensen survey launch 2802 28 foot Jensen survey launch 2803 28 foot Jensen survey launch 2804 28 foot Jensen survey launch
Vessels 1101, 2801, 2802, 2803 and 2804 are used to acquire shallow-water multibeam (SWMB) data and sound velocity profiles. Vessels 1103 was used to collect vertical-beam echosounder (VBES) data and detached positions (DPs). Vessel 2802 was also used to collect both hull-mounted and towed side-scan-sonar (SSS) data. No unusual vessel configurations or problems were encountered on this project. Vessel descriptions and offset measurements are included in the 2009 NOAA Ship Rainier Hydrographic Readiness Review Package. Five different categories of echosounder systems were utilized for project OPR-N395-RA-09. The individual system(s) chosen for use in a given area were decided at the discretion of the Hydrographer using the guidance stated in the Hydrographic Survey Project Instructions, the Hydrographic Surveys Specifications and Deliverables Manual (HSSDM), and the Field Procedures Manual, and depended upon the limitations of each system, the bottom topography, the water depth, and the ability of the platform vessel to safely navigate the area. These systems are described in the following section. A complete description of all echosounder systems, positioning, and attitude sensors in addition to a complete inventory and list of serial numbers is located in the 2009 NOAA Ship Rainier Hydrographic Readiness Review Package. Sounding Equipment: 1. RESON 8125 Launch Shallow Water Multibeam (SWMB) Vessel 1101 is equipped with a hull-mounted Reson SeaBat 8125, with Option 033, Angle-Independent Imagery. The SeaBat 8125 is a 455 kHz multibeam system that uses high frequency focused near-field beam forming to measure relative water depths across a 120 swath, consisting of 240 individual 0.5 x 1.0 beams. This system is capable of operating in depths from 4 meters to 60 meters, with varying range scale values dependent upon the depth of water and across-track slope. Surface sound velocity was measured using an Odom Digibar Pro, model db1200, velocimeter and digitally input into the Seabat 8125 during acquisition.

OPR-N395-RA-09 Data Acquisition and Processing Report April 2009
2
In order to simplify SWMB surveying in the near-shore areas, the SeaBat 8125 was mounted with a 30° angle looking towards starboard. In this configuration, 1101 could be run along the 30-foot contour parallel to shore during periods of high tide and produce near 100% SWMB coverage between the 8 and 4 meter depth curves. Under certain conditions depths up to the 0-meter curve were obtained. 2. RESON 7125 Launch Shallow Water Multibeam (SWMB) Vessels 2801, 2802, 2803 and 2804 are equipped with a hull-mounted Reson SeaBat 7125-B, which is a dual frequency (200/400 kHz), high-resolution multibeam echo sounder system for shallow-water depths. The recommended maximum range at 200kHz is 500m resulting in a theoretical 220 m depth limit for full swath coverage. The 400kHz setting maximum range is 200m resulting in a theoretical 87m depth limit for full swath coverage. The transducer assembly consists of single flat-faced receiver array and two projectors, one for each frequency. These systems included the optional Reson SVP 71 surface sound velocity probe. The SeaBat 7125 measures relative water depths across a 128 swath in both high and low frequency. Beamforming is conducted in either equi-angle or equidistant mode. Equidistant mode is useful to produce soundings at a uniform distance apart across the entire swath-width of a ping at the cost of less sounding density near nadir. Equi-angle mode is good for maximum ensonification of the bottom directly under the launch at the cost of sparse sounding density in the outer beams. Rainier launches typically collect data in equidistant mode unless running development lines directly over a feature of interest. In the 200kHz mode the system has a beamwidth of 1° x 2° and in the 400kHz mode has a beamwidth of ½° x 1°. At 200kHz, the SeaBat 7125 generates 128 or 256 bathymetry soundings per ping. At 400kHz, the system generates 256 or 512 bathymetry soundings per ping. Typical settings used aboard Rainier are 256 sounding, equidistant in LF mode and 512 sounding, equidistant in HF mode. Vessel 2804 (RA-6) has suffered from an as yet unexplained degraded performance of her newly purchased Reson SeaBat 7125 system. Rainier personnel observed that this particular Reson SeaBat 7125 acquired much noisier data and required higher power and gain settings as compared to otherwise identical systems installed on her sister launches. These problems were confirmed by Reson representative Justing Friesner who was aboard the ship on 4/21/09 to train Rainier personnel. Mr. Friesner recommended sending RA-6's 7125 system back to Reson for further testing and this was done so at the conclusion of data acquisition for project OPR-N395-RA-09. 3. Knudsen 320M Vertical Beam Echosounder (VBES) Vessel 1103 is equipped with a Knudsen Engineering Limited 320M, which is a dual frequency (100 kHz, 24 kHz) digital recording vertical-beam echo sounder with an analog paper record. The beam widths for the high and low frequency are 7 (conical) and 25 by 40 (rectangular) respectively. Soundings were acquired in meters for both frequencies, with the high frequency sounding recorded as the primary frequency in the acquisition software (Hypack). The low frequency was often disabled in shallow water because it distorted the echosounder trace. VBES data acquisition is typically restricted to the confirmation or disproval of charted features. If an offshore feature is in need of disproval, a VBES star pattern is run over the charted position. If this star-pattern search reveals safe enough depths, a SWMB equipped launch may be sent in to complete the investigation. If the area is deemed too hazardous to risk a SWMB transducer, the results of the VBES search may be used for charting based on their own merit. VBES data may also be acquired over some

OPR-N395-RA-09 Data Acquisition and Processing Report April 2009
3
offshore reefs and shoals which are inaccessible to MBES-equipped boats, in depths generally ranging from 0 to 10 meters. 4. Lead Line During shoreline verification, lead lines were used to acquire depths over rocks and other features too shallow to acquire soundings using echo sounders. Rainier personnel calibrated lead lines in January 2009. Calibration reports are included in the 2009 NOAA Ship Rainier Hydrographic Readiness Review Package. Side Scan Sonar: 1. Klein 3000 Side Scan Sonar (SSS) Vessel 2802 tows the Klein 3000 sonar system which consist of a towfish, towcable, a transceiver/processor unit (TPU), and a PC for system control, data logging, and data viewing. A new transducer design allows simultaneous dual frequency operation at 132 kHz and 445 kHz. Superior imagery is produced due to the incorporation of high resolution circuitry recently developed for the Klein 5000 multi-beam focused sonar. Fifteen different range scales are available, varying between 25 to 1,000 meters. Beams are formed 40 degrees wide on the vertical and 0.7 degrees at 132 kHz (0.21 degrees at 445 kHz) on the horizontal. Vessel 2802 is also equipped with a A.G.O. Environmental Electronics CSW-8 Portable Electric Winch equipped with an optional powered level wind. The reel is spooled with approximately 200 meters of 0.322” armored Rochester cable. The tow cable at the winch is connected to a deck cable through a Klein supplied slip ring assembly mounted coaxially on the winch. Cable-out is controlled remotely near the acquisition station and is monitored with a 3ps Inc. SD41 cable counter. This sensor measures the side scan towfish cable out by counting the number of revolutions of the towing block on the A-frame. The length of cable deployed is computed automatically and output via serial message directly into the Klein TPU.

OPR-N395-RA-09 Data Acquisition and Processing Report April 2009
4
Figure 1 The CSW-8 portable electric winch, towing block, and A-frame
as mounted on RA-5 (2802) for towed SSS operations. 2. Klein 5500 The Klein 5500 sonar system consists of a towfish, a transceiver/processor unit, and a PC for system control, data logging, and data viewing. The Klein 5500 simultaneously forms multiple dynamically focused beams per side for every ping. This beam-forming method overcomes the along track resolution and towing speed limitations of traditional side scan sonar systems. Vessel 2802 was equipped with a removable hull-mounted sled to which the Klein 5500 SSS towfish was attached. The Klein 5500 sonar system tow fish operates at a frequency of 455 kHz with two transducer arrays (port & starboard). Each Klein 5500 transducer simultaneously forms five dynamically focused beams per side, allowing increased resolution along track (20–36 cm) and across track (7.5-30cm) dependant upon range scale. This hull-mounted configuration eliminates offset, layback, and heading errors associated with a towed system, thereby increasing the positioning accuracy of the processed imagery. An added benefit of this configuration is its ability to avoid entanglement with crab trap floats or other private buoys in addition to operating in and around tight quarters (ex: piers and/or piles) as compared to a towed configuration.

OPR-N395-RA-09 Data Acquisition and Processing Report April 2009
5
3. Multibeam Echosounder Backscatter Option 033 of the Reson 8125 SWMB system used aboard 1101 provides angle-independent imagery similar to fixed-mount side scan sonar (SSS). The Reson 7125 systems aboard 2801, 2802, 2803 and 2804 also collected angle-independent pseudo SSS imagery. This SSS imagery is primarily used during processing of the multibeam sounding data to aid in determining whether anomalous soundings are true features or noise. It generally does not have sufficient resolution for small object detection, but the shape of objects and their strength of return can greatly increase the confidence in processing results. Current guidance from the Field Procedures Manual calls for field units to acquire and submit multibeam backscatter data in snippet mode whenever feasible. Reson “snippets” imagery are recorded at acquisition and are present in the raw data, but not processed or analyzed. Snippet data contains the amplitude data of each individual sonar beam in a swath, but there are problems, well-documented in the hydrographic literature, that reduces the efficacy of processing these data. Due to a combination of increased RAW data file sizes when logging “snippet” data, space limitations with Rainier's current data storage, stability issues with the Reson 7125, and increases in storage use (due to the greater data logging rates of the 7125 and full PosPac data), all Reson “snippets” logging was disabled for all data acquired for project OPR-N395-RA-09. Positioning Equipment: 1. Trimble DSM-212L Vessel 1103 is equipped with a Trimble DSM212L GPS receiver. The DSM212L is an integrated 12-channel GPS receiver and dual-channel DGPS beacon receiver. The beacon receiver can simultaneously monitor two independent U.S. Coast Guard (USCG) DGPS beacons. There are three modes: Auto-Range, which locks onto the beacon nearest the vessel; Auto-Power, which locks onto the beacon with the greatest signal strength; and Manual, which allows the user to select the desired beacon. Additionally, the DSM212L can accept differential correctors (RTCM messages) from an external source such as a user-established DGPS reference station. The DSM212L was configured in the manual mode to use only correctors from the nearest USCG beacon, to go off-line if the age of DGPS correctors exceeded 20 seconds, and to exclude satellites with an altitude below 8 degrees. The following parameters were spot checked at any sign of trouble through Trimble’s TSIPTalker software to ensure position data quality:
number of satellites used in the solution horizontal dilution of precision (HDOP) latency of correctors beacon signal strength
2. Applanix POS MV 320 Vessels 1101, 2801, 2802, 2803 and 2804 are equipped with TSS POS/MV 320 (version 4) Position and Orientation Sensors to measure and calculate position. The POS/MV is a GPS-aided inertial navigation system, which provides a blended position solution derived from both an Inertial Motion Unit (IMU) and an integrated GPS receiver. The IMU and GPS receiver are complementary sensors, and data from one are used to filter and constrain errors from the other. This inter-dependence results in higher position accuracy and fewer errors than either system could produce by itself. Position accuracy is displayed in real time by the POS/MV software and was monitored to ensure that positioning accuracy requirements as outlined in the NOS Hydrographic Surveys Specifications and Deliverables were not exceeded. In addition, the POS/MV software displays HDOP and number of satellites used in position computation. Data acquisition was generally halted when an HDOP of 2.5 was exceeded or the number of satellites available dropped below

OPR-N395-RA-09 Data Acquisition and Processing Report April 2009
6
four. However, because positional accuracy can be maintained by the POS/MV through short GPS outages with the help of the IMU, data acquisition was not halted during short periods of time when the HDOP and number of satellites used exceeded stated parameters. Attitude Measurement Equipment: 1. TSS MAHRS Vessel 1103 is equipped with a TSS MAHRS Surface Product (Meridian Attitude and Heading Reference System). Using an orthogonal array of three linear accelerometers and three angular rate systems, the MAHRS computes heave, pitch and roll values. The MAHRS has an internal gyroscope which applies dynamic tuning and the effects of gravity and earth rotation to provide a true north reference. Due to the physical properties of a north-seeking gyrocompass, accuracy is dependant upon the operation latitude and the vessel dynamics. To optimize performance, the MAHRS uses information input from the launch’s Trimble GPS to apply both latitude and vessel speed correctors. The MAHRS has a dynamic heading accuracy less than 0.1 and a static error less than 0.5. The roll and pitch resolution is 0.1 with an accuracy of 0.03 at less that 5 of roll and 0.5 for greater than 5 of roll. The heave resolution is one centimeter, with an accuracy of 5 centimeters or 5% of the range, whichever is the greater. 2. Applanix POS MV Rainier launches (1101, 2801, 2802, 2803 and 2804) are equipped with TSS POS/MV Model 320 version 4 Position and Orientation System – Marine Vessel (POS/MV) sensors, which provide accurate navigation and attitude data to correct for the effects of heave, pitch, roll and heading. The POS generates attitude data in three axes (roll, pitch and heading) to an accuracy of 0.05 or better. Heave measurements supplied by the POS/MV maintain an accuracy of 5% of the measured vertical displacement for movements that have a period of up to 20 seconds. The Heave Bandwidth filter was configured with a damping coefficient of 0.707. The cutoff period of the high pass filter was determined by estimating the swell period encountered on the survey grounds. These values ranged from 8 s (flat water) to 20 s (long period ocean swell), with values of 8 or 12 s typical. Applanix “TrueHeave” values were also recorded. The TrueHeave algorithm uses a delayed filtering technique to eliminate many of the artifacts present in real time heave data. The TrueHeave data were applied to Reson bathymetry in CARIS HIPS post processing. Full PosPac data were also recorded on vessels 1101, 2801, 2802, 2803 and 2804. These data are used to post process POS MV data to produce superior position and attitude data and can be used to produce a Post-Processed Kinematic (PPK) GPS solution, although PPK was not used on this survey. Software: All multibeam launches (1101, 2801, 2802, 2803 and 2804) recorded Reson shallow-water multibeam (SWMB) echosounder data, along with position and attitude data from the POS/MV using HYPACK, Inc.’s HYSWEEP®, an optional add-on module to HYPACK® 2009 hydrographic survey software. Data was logged in the ASCII (HSX Format) which includes full support for HYSWEEP survey features. All SWMB data were processed using the CARIS Hydrographic Information Processing System (HIPS) and Hydrographic Data Cleaning System (HDCS) software version 6.1 for the Microsoft Windows environment. All VBES data were acquired using HYPACK Inc.’s HYPACK® 2009 in the “RAW” format. VBES data were processed using CARIS HIPS for the Microsoft Windows environment.

OPR-N395-RA-09 Data Acquisition and Processing Report April 2009
7
Sound velocity profiles were computed from raw pressure, temperature, and conductivity measurements using the program VelociWin, supplied by the NOS Hydrographic Systems and Technology Programs N/CS11 (HSTP). A complete list of software and versions is included in the 2009 NOAA Ship Rainier Hydrographic Readiness Review Package. Software updates were applied throughout the project to improve productivity and data quality. As software patches became available, they were tested by the Field Operations Officer, Chief Survey Technician, or other designated crew member. If tests resulted in satisfactory performance, the updates were installed on all affected workstations and tracked in a version control spreadsheet. B. DATA PROCESSING AND QUALITY CONTROL Project Management Overview Rainier’s data processing and quality control procedures are described in detail in the flow diagrams included in Appendix I. Roles, responsibilities, and the generalized project accomplishment procedure are summarized in this section.
Project Planning Project Instructions received from Hydrographic Surveys Division (HSD) are reviewed by the Chief of Party (Commanding Officer), Field Operations Officer (FOO), and Chief Survey Technician (CST). Preliminary questions are addressed to HSD/OPS for clarification. The FOO then develops survey limits for each assigned sheet, and in consultation with the CO and CST, assigns each survey to a sheet team. The sheet team is composed of as many as three people: The Survey Manager has responsibility for completion of the survey, including planning, data acquisition and processing, quality control, and creation of deliverables. Depending on the complexity of the survey, the Survey Manager is typically a commissioned officer, survey technician, or physical scientist with 6 months to 2 years experience. Survey Assistants and/or Survey Mentors may also be assigned if required. Survey Mentors are assigned to particularly difficult survey areas or in the case of a less experienced Survey Manager. Mentors serve as intermediaries between the survey manager and the FOO, advising the Manager on survey planning and reviewing data and deliverables. Mentors generally have at least a year and a half of experience, and have demonstrated proficiency as Survey Managers themselves. Survey Assistants are junior commissioned or civilian personnel with less than one year’s experience. They assist the Survey Manager with planning and data processing, and receive training from the Manager and Mentor. Notwithstanding the delegation of this authority to junior personnel, the FOO remains responsible to the Chief of Party for efficient, accurate, and thorough completion of all projects assigned to Rainier. The Sheet Team reviews the Project Instructions, all other relevant guidance1, and all available prior survey and source data. Prior survey bathymetry, if available, is used as a guide for planning survey lines to achieve the coverage required by the letter instructions. If shoreline verification is required for the survey, prior source data (Remote Sensing Division source, prior hydrographic survey data, LIDAR if available, and charted items) are compiled and deconflicted. The resulting survey data acquisition plan is reviewed by the FOO prior to implementation.
1 “NOS Hydrographic Surveys Specifications and Deliverables”, “OCS Field Procedures Manual”, and Hydrographic Surveys Technical Directives.

OPR-N395-RA-09 Data Acquisition and Processing Report April 2009
8
Data Acquisition Field operations are planned by the FOO to utilize the appropriate platforms and sensors to meet the requirements of the survey team’s acquisition plan. In the case of launch-based hydrography, actual data acquisition and field quality control is accomplished by a qualified Launch Team. At a minimum, this team will include a Coxswain (Person-In-Charge) and Hydrographer-In-Charge (HIC). The Coxswain is a member of the ship’s crew who has met all requirements of coxswain certification for the vessel in use, and has been qualified by the Commanding Officer (CO) in consultation with the Chief Boatswain. The coxswain is responsible for the safe operation of the launch and the safety of the embarked personnel and equipment. The Hydrographer-In-Charge is a member of the ship’s crew who has met the requirements for HIC qualification for the surveying techniques to be employed, and has been so qualified by the FOO in consultation with the CST and Chief of Party. The HIC is responsible for directing survey operations and operating survey equipment to efficiently complete the vessel’s assigned mission and ensure data quality. Both Coxswains and HICs will generally have at least one year’s experience prior to qualification for these positions. Additional qualified Launch Crewmembers may be assigned to a vessel as required for training purposes and/or to assist the HIC and Coxswain with survey operations.2 Each survey day begins and ends with a short meeting of personnel involved in that day’s operations. Prior to deploying launches, the Commanding Officer and FOO brief the launch crews to ensure that they are aware of all safety issues, operational considerations, and mission for the day. The launch HICs are debriefed by the FOO in the evening to provide a first hand account of the day’s activities, any unusual features discovered, and any problems with data acquisition or launch systems. Data Processing Initial data processing at the end of each survey day is the responsibility of the Night Processing Team, or launch crew if no night processing team is assigned. The Night Processing Team is typically composed of two crewmembers, one with at least a year’s experience, and one junior member in training. Daily processing produces a preliminary product in which all gross data problems have been identified and/or removed, and thus can be used by the Survey Team to plan the next day’s operations. The Night Processors complete a data pass down log to inform the survey manager and FOO of any notable features or systematic problems in the day’s data. Final data processing and analysis is the responsibility of the Survey Team. While “ping-by-ping” data editing is not required, the Team will review the survey in its entirety to ensure that the final products reflect observed conditions to the standards set by the relevant OCS guidance. Bathymetric surfaces are reviewed with the best available correctors applied to ensure that all data quality problems are identified and resolved if possible, and all submerged features are accurately represented. Shoreline verification (if applicable) and feature data are reviewed in the context of this bathymetry. Survey documentation (including the Descriptive Report) is generated in conjunction with this review process. Review and Quality Control While quality control reviews are present throughout survey planning, data acquisition, and data processing, the final, complete review is accomplished once acquisition is complete and preliminary deliverables have been produced. Draft survey products are first reviewed by the Survey Mentor (if assigned) to check that Rainier standard practice has been followed, all applicable guidance has been observed, and all products meet specifications. Draft surveys are then forwarded to the CST and FOO for data review. The CST’s review focuses on features and shoreline verification (if applicable), while the FOO’s review focuses on bathymetric products. Feedback is passed back to the Manager, who makes the required changes. This process is repeated until the FOO is satisfied that all products are
2 For more information on personnel qualification standards, see NOAA Administrative Order 217-103, NMAO Small Boat Policy, and Rainier Standing Orders.

OPR-N395-RA-09 Data Acquisition and Processing Report April 2009
9
ready for review by the Chief of Party (CO). The CO reviews all products for consistency with ship and Coast Survey policy, and may also review constituent data to ensure data quality. The CO’s comments are passed back through the FOO to the Survey Manager as necessary to address any issues encountered. Finally, once the survey is finalized, the data products are packaged by the CST for submittal to OCS.
Multibeam Echosounder Data Shallow water multibeam data were monitored in real-time using the 2-D and 3-D data display windows in the on-screen display for the Reson SeaBat 8125. The Reson 7K Control Center online bathymetry data display was monitored in real-time for the Reson SeaBat 7125-B. Adjustable user parameters common for Reson systems are range scale, power, gain, and pulse width. These parameters were adjusted as necessary to ensure the best bathymetric data quality. Additionally, vessel speed was adjusted as necessary, and in accordance with the NOS Specifications and Deliverables and Draft Standing Project Instructions, to ensure the required along-track coverage for object detection. Rainier’s primary bathymetric data review and quality control tool is the CARIS CUBE (Combined Uncertainty and Bathymetry Estimator) surface as implemented in HIPS version 6.1. The CUBE algorithm generates a surface consisting of multiple hypotheses that represent the possible depths at any given position. The CUBE surface is a grid of estimation nodes where depth values are computed based on the horizontal and vertical uncertainty of each contributing sounding as follows:
Soundings with a low vertical uncertainty are given more influence than soundings with high vertical uncertainty
Soundings with a low horizontal uncertainty are given more influence than soundings with a high horizontal uncertainty.
Soundings close to the node are given a greater weight than soundings further away from the node.
As soundings are propagated to a node, a hypothesis representing a possible depth value is developed for the node. If a sounding's value is not significantly different from the previous sounding then the same or modified hypothesis is used. If the value does change significantly, a new hypothesis is created. A node can contain more than one hypothesis. As node-to-node hypotheses are combined into multiple surfaces through methodical processing, a final surface that is the best representation of the bathymetry is created. Any individual sounding’s uncertainty, or Total Propagated Error (TPE), is derived from the assumed uncertainty in the echosounder measurement itself, as well as the contributing correctors from sound speed, water levels, position, and attitude. TPE values for tide and sound velocity must be entered for each vessel during TPE computation (see table #1). Tide values measured uncertainty value is the RSS of the error estimates associated with each six minute
tidal value. Tide values zoning is typically provided in the Tide Requirements report for each project at the 95%
confidence level, and includes the estimated gauge measurement error, tidal datum computation error, and tidal zoning error. In the case of project OPR-N395-RA-09, which uses the Tidal Constituent And Residual Interpolator (TCARI) to calculate tides, the tide component error estimation is not applicable. TCARI automatically calculates the error associated with water level interpolation and incorporates it into the residual/harmonic solutions and is included in the Total Propagated Error (TPE) for each survey.
Sound speed value measured error ranges from 0.5 to 4 m/s, dependent on temporal/spatial variability. Although Hydrographic Surveys Technical Directive 2007-2 recommends a value of 4 m/s when 1 cast is

OPR-N395-RA-09 Data Acquisition and Processing Report April 2009
10
taken every 4-hours, Rainier experience in the field suggests that a value of 0.5 m/s better models this error.
Sound speed value surface in this project area for flat face transducers ranges between 0.15 m/s and 0.3 m/s and is derived from manufacturer specifications depending on what unit is used to generate these values. The flat faced Reson 8125 on vessel 1101 is 0.3 m/s due to use of the Odom Digibar Pro. The flat face Reson 7125 transducers on vessels 2801 2802, 2803 and 2804 use a value of 0.15 m/s due to use of Reson SVP 71 fixed-mount sound velocity probe. The Knudsen VBES on vessel 1103, which has no real time sound speed correctors at the transducer face, use a value of 0.0 m/s.
Vessel Tide values measured
Tide values zoning
Sound speed values
measured
Sound speed values surface
1101_Reson8125 0.01 n/a 0.50 0.00 1103_Singlebeam 0.01 n/a 0.50 0.30 2801_Reson7125 0.01 n/a 0.50 0.15 2802_Reson7125 0.01 n/a 0.50 0.15 2803_Reson7125 0.01 n/a 0.50 0.15 2804_Reson7125 0.01 n/a 0.50 0.15
Table 1 (TPE Values for Tide and Sound Velocity) High Caris TPE Values from Tilted 8125 data Launch 1101's (RA-1) Reson 8125 sonar head is tilted 30 deg to starboard to allow for more efficient and complete multibeam coverage in the near-shore area. However due to this configuration, the outer beams on the starboard side of the swath have extremely high Total Propagated Error (TPE) values when calculated by Caris HIPS. Especially in beams 235-240, TPE values from 2 to 10 m have been observed, typically in less than 8 m of water depth. Although expected to be higher due to a more oblique angle and beam spreading, the TPE values as calculated by Caris exceed the Hydrographer's expectations. Figure #2 shows an uncertainty model calculated by Dr. Brian Calder from UNH for a tilted Reson 8125 system at a variety of seafloor slopes. Based on standard use of the system collecting near-shore data while running parallel to the shoreline, the slopes typically encountered are rarely less than 10 degrees. It is Rainier’s opinion that these high TPE values are due to Caris' model of TPE calculation and do not reflect the quality of these soundings. A Caris HelpDesk Ticket (00802013) has been opened to address this issue. Please note that all Rainier submitted CUBE surfaces are finalized using the "Greater of the Two" of standard deviation and TPE as per the Field Procedures Manual section 4.2.6. Because the TPE of the soundings involved are so high, the resulting surface error values are also high - higher than would usually be acceptable. These inshore, outer-beam data have been thoroughly reviewed by Rainier personnel and using the near shore surfaces to update the charts irrespective of the surface error is recommended.

OPR-N395-RA-09 Data Acquisition and Processing Report April 2009
11
Figure 2 A graph showing the effect of seafloor slope on vertical uncertainty at 95% CI vs. beam
number for a Reson 8125 system tilted 30 degrees with a 10m nadir depth. [source, Dr. Brian Calder]
All other error estimates are read from the Hydrographic Vessel File (HVF) and Device Model file. The HVF contains all offsets and system biases for the survey vessel and its systems, as well as error estimates for latency, sensor offset measurements, attitude and navigation measurements, and draft measurements. In addition, the HVF specifies which type of sonar system the vessel is using, referencing the appropriate entry from the Device Model file. The exact behavior of CUBE is determined by the values set in the CUBE parameters file, a xml file which can be selected by the user in the CARIS Tools Options Environment tab. The Hydrographic Surveys Division (HSD) has created and provided a customized CUBE parameters file with new CUBE parameters that are required for each grid resolution (CUBEParams_NOAA.xml). During the creation of CUBE surfaces the user is given the option to select parameter configurations based upon surface resolution which have been tuned to optimize the performance of the CUBE algorithm (HSTD 2009-2). Table #2 illustrates how the advanced options configuration is manipulated based on the grid resolution of the CUBE surface being generated. Following acquisition, multibeam sonar data were processed using the CARIS HIPS and SIPS Batch Processor. The batch processor runs a user defined script which accomplishes the following standard tasks without user intervention:
1. Convert the “raw” Reson data to the HDCS data format. 2. If necessary parse PosPac data using HIPS “Load attitude and nav” tool (only if navigation or
attitude data is missing or corrupt in the RAW data). 3. Load predicted tides. 4. Load and apply sound velocity files. 5. “Merge” data to apply position, attitude, vessel offsets, and dynamic draft correctors to bathymetry
and compute the corrected depth and position of each sounding. 6. Compute TPE. 7. Filter data according to the following criteria:
Reject soundings with poor quality flags, (0 for Reson).

OPR-N395-RA-09 Data Acquisition and Processing Report April 2009
12
Reject soundings with TPE greater than the horizontal and vertical error limits specified in the NOS Hydrographic Surveys Specifications and Deliverables:
Horizontal Error > ±(5m + 5% of depth)
Vertical Error 22 dba , where “a” and “b” are defined as
Depth range Depth a Depth b
0-100m 0.500 0.013 Greater that 100m 1.000 0.023
8. Add data to a temporary boat-day field sheet for each sheet on which that boat acquired data.
Field Sheet naming convention: Hxxxxx_<vessel>_<DN> (e.g., H12345_1006_DN123) Base surface are created in accordance with the depth ranges set forth in table #2. Multiple surfaces of differing resolutions may be created dependant upon the range of depth
encountered during that particular boat day. Boat-day field sheets are kept as small as possible since CARIS allocates memory for any
empty space which slows down processing. Field sheets are created big enough to cover the full extents of the MBES swaths of the day’s data, but not bigger than necessary.
Depth Range
Filtering CUBE Surface
Resolution BASE surface Advanced Options Configuration
0 – 23 m 1.0 m NOAA_1m 20 – 52 m 2.0 m NOAA_2m
46 – 115 m 4.0 m NOAA_4m 103 – 350 m 8.0 m NOAA_8m
350 m + 16.0 m NOAA_16m Table 2 Depth range vs. CUBE surface resolution
(as required for Complete Multibeam Coverage as per HTD 2009-2)
Practical experience aboard Rainier suggested that CUBE surfaces generated with these resolutions and depth ranges (see Table 2, above) are sufficient for “complete coverage” surveys that are required to detect 2 x 2 x 2 m objects from 0 to 20 m. Higher resolution surfaces would burden the processing pipeline with resolutions so high that they are neither supported by the actual data nor practical in terms of computational time or file size. These depth range resolutions were officially adopted on a fleet-wide basis by the Hydrographic Surveys Technical Directive 2009-2 (CUBE Parameters). Still unresolved problems with the CARIS multiple resolution algorithm results in poor junctions at the resolution steps but the built in overlap of ~15% of the depth (i.e., +/-7%) appears to yield usable results for cleaning and planning purposes. It has been the experience aboard Rainier that different fieldsheets that cover the same dataset may produce widely different CUBE surfaces. Thus a set of data which has been cleaned to remove all fliers for one fieldsheet may produce an entirely different set of fliers for a different fieldsheet that covers the same area. This problem only gets worse when multiple surfaces of differing resolutions are involved for each fieldsheet. In an effort to eliminate this problem, cube surface resolution values of 1, 2, 4, 8 and 16 meters were chosen. Since these resolution values are even multiples, all of the surfaces produced for a given fieldsheet will have the nodes of all surfaces co-located. Although this approach helps to curb the flier problem within a single fieldsheet, multiple overlapping fieldsheets may still cause problems since one fieldsheets co-located nodes will probably not match the exact same geographic position as an adjacent fieldsheets nodes. This problem is solved if the easting and northing of the northwest corner of all fieldsheets created is evenly divisible by 16. Caris HIPS uses the northwest

OPR-N395-RA-09 Data Acquisition and Processing Report April 2009
13
corner to initiate the nodes of a field sheet. Unfortunately, HIPS won't let you set this directly but indirectly this can be accomplished by editing both the easting and northing to be multiples of 16 in both the southwest and northeast corners during field sheet creation. This process is facilitated by the use of the Base 16 Calculator program written by PS Grant Froelich. This program takes an entered Input Coordinate and then generates an Output Coordinate that is evenly divisible by 16. These Output Coordinates are then used to create the CARIS fieldsheet boundaries. Rainier strongly advises that any new fieldsheets created further down the processing pipeline follow this procedure to minimize the appearance of new fliers. The following options are selected when CUBE surfaces were created:
Surface Type – CUBE IHO S-44 Order – Order 1 Include status – check Accepted, Examined and Outstanding Disambiguation method - Density & Locale (this method selects the hypothesis that contains
greatest number of soundings and is also consistent with neighboring nodes). Advanced Configuration – As per table #2 and dependant upon the surface resolution.
Preliminary data cleaning is performed on single resolution surfaces (1, 2, 4, 8 and 16 m, as required – using table #2 for guidance) for each boat/day field sheet. Each surface is masked to the appropriate depth range for its resolution using the attribute filter found in the “properties” of the depth layer. The Attribute Filter is enabled by selecting the check box. The filter is set by checking on the button and changing the expression to read “Depth >X AND Depth <Y” where X= min depth for the resolution and Y= max depth for the resolution. E.g. a 2 m resolution surface would get the expression: Depth >20 AND Depth <52. Preliminary data cleaning is performed daily using the Boat-Day CUBE surface as a guide for "directed editing". Typically the night processing crew only cleans out the most blatant of fliers and blow-outs, leaving the final cleaning to the sheet manager. Depth, Standard Deviation, Hypothesis Strength and Hypothesis Count models derived from the boat-day surface are viewed with appropriate vertical exaggeration and a variety of sun illumination angles to highlight potential problem areas. Based on this analysis the most appropriate cleaning method is selected as follows:
Subset Mode is the default tool selected due to its ability to quickly compare large numbers of soundings with adjacent or overlapping data for confirmation or rejection. Subset mode also excels with the assessment of possible features, disagreement between overlapping lines, and crossline comparison. The image designer can be used to visually enhance patterns and anomalies in CUBE surfaces, especially the standard deviation CUBE surface.
Swath Editor is useful for burst noise, multipath, and other "gross fliers" which are specific to a particular line or lines, and most easily removed in this mode. Additionally, when it was felt that the quality of the data was reduced due to environmental conditions such as rough seas or extreme variance in sound velocity, data were filtered on a line by line basis to a lesser swath width to ensure data quality.
Both modes (but particularly Swath Editor) are used as a training aid to help novices learn how the various sonars operate, and provide feedback to the acquisition process.
With the advent of CUBE-based processing, it has become possible to adjust the final bathymetric surface directly by selecting the correct hypothesis to use. Although this method is available, it is standard practice on Rainier to clean soundings in the traditional method until the CUBE algorithm selects the correct hypothesis. Once all the data from all launches is clean, it is added to the affected “constant maintenance” CUBE surfaces. These “constant maintenance” CUBE surfaces are a group of fieldsheets tiled in such a way as to keep the CUBE surfaces small enough for rapid computation. These CUBE surfaces use the HSD mandated

OPR-N395-RA-09 Data Acquisition and Processing Report April 2009
14
set of grid depth-resolution ranges (see Table #2 above) and are used to ensure bottom coverage and plan additional lines. In addition these “constant maintenance” CUBE surfaces are used to compare adjacent lines and crosslines, for systematic errors such as tide or sound velocity errors, sensor error, sonar errors (consistent bad beams), vessel configuration problems, and noise. Any irregular patterns or problems are reported immediately to the FOO and the survey manager so that remedies can be found and applied before more data are acquired. Each sheet manager is responsible for setting up the constant maintenance field sheets. There will be approximately 6 to 8 for each survey sheet, named sequentially. (e.g. “H12345_A”, “H12345_B”, etc.) A coarse 8m resolution “Launch” BASE surface may also be maintained for use in the survey launches during data acquisition. The 8m resolution was selected to maintain smaller, easily transportable GeoTiff files.
Naming convention is Hxxxxx_LaunchSafety_8m. The surface is created as a single resolution CUBE surface at 8m resolution. The CUBE surface is colored using a standardized custom Rainier generated CARIS Colour Range
table (see table #3). The color pallet selected is intended to aid swift navigation over previously survey areas in addition
to highlighting shallow areas.
Depth Range COLOR -10 – 0 m Tan 0 – 2 m Red 2 – 4 m Yellow 4 – 8 m Green
8 – 20 m Teal 20 – 350 m Blue
Table 3 Depth range vs. COLOR in use for launch safety DTMs Final review of the “constant maintenance” CUBE Surface is left to the Mentor or experience survey manager who inspects areas with questionable shaded depth models and/or high standard deviation to ensure that no actual features were cleaned out. The use of large tiles is encouraged to track coverage of problems areas. On occasion, the resolution of the CUBE surface may not be sufficient to capture the high point of a bathy feature. In less than 20m of water, any feature where the most probable accurate sounding was shoaler than the CUBE surface by greater than one half the allowable error under IHO S-44 Order 1 was considered inadequately captured by the CUBE surface. In greater than 20m of water, this allowable error was expanded to the full Order 1 error allowance at that depth. Although this may occur on irregular shoals or rock pinnacles, man-made features such as piles and wrecks are of particular concern. These features have very slender high points that extend far above the surrounding seafloor as well as the CUBE surface. To ensure that these features are properly represented, the shoalest point is flagged “designated” in CARIS. During the “finalization” process, the CUBE surface is forced to honor all soundings which have been flagged “designated”. In the case of a survey where the high points of many features are not being captured by the CUBE surface, (i.e. a boulder field), the hydrographer may decide to produce higher resolution CUBE surfaces to ensure that these features are being honored. Any such deviations from standard procedures will be noted in that survey’s Descriptive Report. At the time of this report, Coast Survey has not approved multiple resolution BASE surfaces as a final deliverable. Although these surfaces are acceptable for field use, the algorithm produces artifacts at the resolution steps that are unsuitable for a final product. To circumvent this problem, single resolution CUBE

OPR-N395-RA-09 Data Acquisition and Processing Report April 2009
15
surfaces were generated to be “cookie cut” and then reassembled to create the final CUBE surface from which depths are derived. Multiple CUBE surfaces are gridded using different resolutions for different depth ranges (see table 2). Under ideal circumstances gridding should be done at the finest resolution that the data density will support. This theoretical maximum resolution was historically defined as three times the beam footprint size for a particular echosounder and depth combination. HTD 2009-2 further refined the data density requirement as “a minimum density of 5 soundings per node is adequate to represent the depth of the seafloor while not being strongly influenced by a single erroneous sounding.” In practice, Rainier adheres the table of resolutions and depth ranges as defined in HTD 2009-2 which are based on practical experience in “typical” survey areas, and a working knowledge of bottom coverage capabilities of each echo sounding system in use. These resolutions are also based on assumed sonar system selections for each depth regime and practical data processing limitations. Typically, deeper areas are gridded at a coarser resolution than shoaler areas where the data density is greater. Another shortcoming exists in CARIS that limits CUBE surfaces to a maximum of approximately 25 million nodes. This upper bound is imposed to keep CUBE surface processing within the 2 GB of physical memory installed on most Rainier workstations. Exceeding this limit has been shown to dramatically increase processing time and software crashes as the system swaps data to and from virtual memory. This node limit is generally not a problem at the coarser resolutions, but surveys requiring 1m or finer resolution surfaces often must be subdivided into several field sheets to keep the respective CUBE surfaces under this limit. The field sheet layout and CUBE surface resolutions are described for each survey in the Descriptive Report. Each resolution-specific field sheet and its CUBE surface share a unique name, according to the following convention:
H<registry #>_<resolution in meters>M_<letter designation, if necessary>
(EX: “H12345_2M” refers to the two-meter resolution surface of survey H12345 and “H54321_1M_C” would be the third field sheet necessary to cover the area of H54321 at one-meter resolution.) Once the collection of field sheets accurately represent the surveyed bottom and it is certain that no further edits will be made, each CUBE surface is finalized using the resolution shown in table 2. All CUBE surfaces are then combined at the coarsest resolution used to create the final combined CUBE surface. The final, combined CUBE surface should be named Hxxxxx_Final_Combined_Xm and be created in the survey wide field sheet Hxxxxx. The final CUBE surfaces are sun-illuminated from different angles and examined for coverage and as a final check for systematic errors such as tide, sound velocity, or attitude and/or timing errors. The final CUBE surface submitted in the fieldsheet serves to demonstrate that both SWMB coverage requirements are met and that systematic errors have been examined for quality-assurance purposes. As a quality control (QC) measure, cross-lines with a linear nautical total of at least 4% of mainscheme multibeam lines were run on each survey and manually compared to the mainscheme lines in CARIS subset mode. This qualitative QC comparison is discussed in the descriptive report for each survey. Feature Data Source shoreline data for this project was supplied by N/CS31 in a single Composite Source Shoreline file in S57 000 format (0_1CSF01.000). Additionally, Rainier personnel imported the sheet and survey limits into a Reference .hob file. The project-wide .000 file was trimmed to each sheet’s individual survey limits and

OPR-N395-RA-09 Data Acquisition and Processing Report April 2009
16
saved as both HOB and S57 000 files by the survey managers. The .000 format was used for computer display in Hypack on the survey launches. The HOB file was used in CARIS Notebook and printed to create paper boat sheets for reference and note-taking during shoreline verification operations. This process is described in detail in the “CARIS Notebook” section below. Shoreline verification was conducted during daylight periods near MLLW. A line was run along the shore approximating the position of the Navigational Area Limit Line (NALL) while the launch crew searched for uncharted or mischarted features. In the absence of direction to the contrary, the NALL was the furthest offshore of the following:
The 4m depth contour at MLLW. A line seaward of the MHW line by the ground distance equivalent to 0.8mm at the scale of the
largest scale raster chart of the area. This definition of the NALL is subject to modification by the Project Instructions, Chief of Party (Commanding Officer), or (in rare instances) Hydrographer-In-Charge of the survey launch. Some possible reasons for modifying this direction included:
Sea conditions in which it was unsafe to approach shore to the specified distance or depth. Regular use of waters inshore of this limit by vessels navigating with NOAA nautical chart
products. (This does not include skiffs or other very small craft navigating with local knowledge.)
As the approximate NALL line was run along the shore, the hydrographer both annotated the shoreline reference document and scanned the area for features to be addressed. Feature types to be addressed were as follows:
Seaward of the NALL:
o A feature found within 20 meters of the composite source position had its height/depth determined.
o A feature outside 20 meters of the composite source position had its field position revised in addition to a heights/depth determination.
o Features with any linear dimension greater than 0.5mm by 0.65mm at the scale of the largest scale chart were treated as an area and delineated.
o New features not in the Composite Source file. o AWOIS items and other features specifically identified for investigation.
Inshore of the NALL: o Navigationally significant features only, as defined below.
Navigationally Significant” features were defined as the following:
All features within the limits of safe navigation (i.e., offshore of the NALL). Features inshore of the NALL which:
o are sufficiently prominent to provide a visual aid to navigation (landmarks). Note that rocks awash are almost never landmarks, but distinctive islets or other features visible at MHW can be useful for visual navigation.
o significantly (a ground unit distance equivalent to 0.8mm at the scale of the largest scale chart of the area) deflect this limit. Common examples of these features include foul areas and large reef/ledge structures.

OPR-N395-RA-09 Data Acquisition and Processing Report April 2009
17
o are man-made permanent features connected to the natural shoreline (such piers and other mooring facilities) larger than the resolution specified for the survey. Seasonal features will be evaluated by the Command.
o are man-made permanent features disconnected from the shoreline, such as stakes, pilings, and platforms, regardless of size.
Small, private mooring facilities (piers and buoys) suitable for pleasure craft were not generally considered navigationally significant. Areas with a high density of mooring buoys for these vessels were delineated, but the features themselves not individually positioned. Terminology used for field annotation of the shoreline reference document during shoreline verification was as follows:
“Noted” The existence of a feature and its characteristics were confirmed from a distance, and its position
appeared to be correct within the scale of the chart or source. Appropriate for features inshore of the limit of hydrography and not navigationally significant,
significant features that require no further investigation, or features unsafe to approach to verify position within survey scale.
Noted features were annotated on the shoreline reference document but carried no further forward in the processing pipeline. A "noted" annotation on a feature is not included in the H-Cell and adds little to PHB’s current evaluation and verification process.
“ Verified " The feature’s position and characteristics were acquired and recorded either by directly occupying
the site, or by applying a range and bearing offset to a known position. Positioning was generally by DGPS methods.
Appropriate for new items within the limits of hydrography, or navigationally significant features inshore of this limit. Also appropriate for existing features with a source position not accurate at survey scale.
“DP for Height” The feature’s source position is correct, but height (VALSOU or HEIGHT attribute) was either
unknown or incorrect. This position does not supersede that of the source data, so it is only necessary to approach the feature as closely as required to accurately estimate the height. However, it is critical that the positions be correctly linked to the features they modify to avoid confusion during processing. To avoid this potential for confusion, it is a common practice is to “fudge” the range and bearing of a “DP for Height” to coincide with the position of the feature in question.
Appropriate for source features found within 20m of their source positions, but with incorrect or missing height or depth data.
“New" The feature’s position and attributes (including height) were acquired and recorded either by directly
occupying the site, or by applying a range and bearing offset to a known position. Positioning was generally by DGPS methods.
Appropriate for items seaward of the NALL that are not present in the Composite Source. Items inshore of the NALL which are navigationally significant and are not present in source data. “Not Seen” The feature was present in source data (chart, DCFF, etc.) but was not visually observed in the field.
Full disproval search (see below) was not conducted. Appropriate for:

OPR-N395-RA-09 Data Acquisition and Processing Report April 2009
18
o Features above MHW, the absence of which can be proven visually from a distance. o Source features inshore of the limit of hydrography which are not observed, but whose
presence on or absence from the survey will not affect safe navigation. o Any feature from source which was not seen, but for which full disproval search (see below)
is impractical or unsafe.
“Disproved” The feature was present in source data, but was not located after a full search. “Full Search” means
SWMB, VBES, SSS, and/or Detached Position coverage of the area which conclusively shows that the item is not located at the position given to the accuracy and scale of the source document.
The primary purpose of detached positions (DPs) is to verify and define shoreline features (ex: rocks, reefs ledges, piles), disprove charted features, position navigational aids and landmarks (ex: buoys, beacons, lights), and mark positions of bottom samples. Point features were captured in the field as attributed S57 objects in Caris Notebook.. Any line objects, such as small piers or foul areas were digitized directly into Caris Notebook while in the field. Concurrent with the acquisition of these features, digital photographs were taken of most objects which were exposed above the waterline. The survey vessel’s track may also be used to delineate area features, such as reefs, ledges, or foul areas. Where it is safe to approach these features to within the specified horizontal accuracy requirement, this method can produce a more accurate and efficient representation of large features than would be provided by multiple DPs on the extents. In addition to the traditional shoreline techniques using VBES launches, RA1 (1101) was also used to delineate the 4-meter curve and/or junction lidar data with her 30-degree tilted Reson 8125. During periods of high tide, 1101 collected data while running parallel to shore along the 30-foot curve. Although this technique was found to nicely fill in between the 4 and 8 meter curves with 100% coverage, it also produced coverage far inside the NALL line (typically the 4-meter curve). These additional soundings inshore of the NALL line were processed as follows:
“Good” seafloor is not rejected anywhere. Any bad soundings are cleaned out to make the surface represent the seafloor, but there is no cut-off of soundings shoaler than the 4-meter or 0-meter curves. Negative soundings are fine so long as they represent the bottom.
No launch is to go inside the NALL line trying for the 0-meter curve, or developing items that are found outside the survey limits (i.e. NALL line)
For cultural features (pilings, piers, buoy's and buoy chains, etc.) that are above MLLW (i.e. negative sounding) AND on the field verified .hob layer, all soundings on the cultural item are deleted. This technique will prevent the BASE surface from being pulled up on features already charted above MLLW in the hob file.
For cultural features that are below MLLW, the shoalest sounding is designated (which the
BASE surface will honor) AND the feature is included on the field verified .hob file.
For cultural features that are above MLLW and are not on the field verified .hob file, the least depth is flagged as "outstanding," but not include it in the BASE surface and all other data on the object is rejected. In this case the "outstanding" sounding is used as a basis for creating a new feature in the field verified .hob, but it will not affect the BASE surface. This is accomplished by using the option in BASE surface creation to not include outstanding soundings.

OPR-N395-RA-09 Data Acquisition and Processing Report April 2009
19
Rocks and reefs are treated as "seafloor." No data is rejected on rocks, reefs or ledges, even above MLLW. The primary method of getting heights on rocks will remain "leveling" (aka eyeballing) during traditional shoreline, but if a least depth of a rock is obtained with SWMB, it will be designated and the height/depth will be used as the VALSOU in the FieldVerified .hob. As previously stated, launches will not go inshore of the NALL line trying to get these data, but it will not be discarded if they are obtained. In cases where the echosounder data does not get the least depth, the soundings obtained will be left in the surface and a DP (or previously acquired comp source data) will be used for the feature.
Following acquisition, digital photos were renamed to match their respective DP’s fix number and moved into a single folder. Any required application of tide and SV corrections were performed in CARIS Notebook. S-57 Attribution (Pydro Feature Creation) Although feature attribution collected in the field is typically entered directly into CARIS Notebook bypassing Pydro completely, Pydro is still used in some instances to manage and report on features. Soundings designated as DTONs are imported into Pydro from CARIS in order to generate the DTON report. AWOIS items are also tracked and resolved in Pydro in addition to generating the shoreline report which includes these items. Submerged features, such as wrecks and submerged piles designated in CARIS may also be brought into Pydro for attribution and eventual export to Notebook. Finally, SSS contacts that have been selected in CARIS and imported into Pydro for correlation and further evaluation. S-57 attribution is not required for those features flagged as "secondary". All Pydro XML features marked as “primary” were edited to have their object/attribute instances describe each feature as completely as possible. In some cases this required that multiple object classes be assigned to a single feature. Object attributes assigned to each feature conform to direction located within both the draft “S57 PYDRO guide” and the CARIS “IHO S-57/ENC Object and Attribute Catalogue”. Pydro also has chart action check boxes in a drop-down menu which are edited to reflect the hydrographer recommendations as follows:
Chart - Add -- A new feature was identified during survey operations. The hydrographer recommends adding the feature to the chart.
Chart - Modify -- The feature was found to be positioned or portrayed incorrectly on the chart. Modify is also used in the case where the feature was found to be attributed incorrectly or insufficiently and is modified to reflect the additional or corrected attribution.
Chart - Delete -- The feature was disproved using approved search methods and guidelines. The hydrographer recommends removing it from the chart.
Chart - ? -- (aka Retain or No Action) The feature was found during survey operations to be positioned correctly or was not investigated. The hydrographer recommends retaining the feature as charted.
Features selected for transfer to Notebook are flagged as either Chart – Add, Chart – Modify or Chart - Delete in Pydro. Pydro Feature Extraction Pydro features are exported as Extensible Markup Language (XML) files for use in CARIS Notebook by selecting Data Export XML Feature Data. Pydro feature data is sorted by using export filters in pre-

OPR-N395-RA-09 Data Acquisition and Processing Report April 2009
20
configured filter templates created by Rainier personnel. By using both Pydro Keywords and CartoAction flags, features are sorted into XML files for later import into the CARIS Notebook submission HOB files. The HXXXXX_Pydro_Updates XML export file is incorporated into the HXXXXX_ Final_Features_File.HOB file while the Hxxxxx_Pydro_Disprovals is incorporated into the HXXXXX_ Disprovals.HOB file.
XML file Feature Query Tree
HXXXXX_Pydro_Updates Features – Primary - CartoActionAdd Features – Primary - CartoActionModify
Hxxxxx_Pydro_Disprovals Features – Primary - CartoActionDelete Table 3 Feature tree filters required for XML export files
Data processing flow diagrams are included in Appendix I of this report. Pydro Processing & Reports Pydro was used to manage, attribute, and report features as described in Section 4.4 of the OCS Field Procedures Manual. All features were categorized, correlated, investigated as necessary, and resolved. Pydro was used to generate the Feature Report, Danger to Navigation Reports, and Requests for Approved Water Levels included with each survey. CARIS Notebook The composite source shoreline feature file created at HSD and delivered with the project instructions is to be used as the only shoreline data for use in the field. The composite source file is compiled from all available source shoreline files (i.e. ENC, Geographic Cells, LIDAR, RNC, and Prior Surveys) into a single file in an S-57 .000 format. In preparation for shoreline verification, the Survey Manager copied the project wide composite source file and cropped it to include only items contained on their assigned sheet. This cropped file is then saved as a HOB file named HXXXXX_Original_Comp_Source.HOB. At this point no further edits are ever made to this HOB file and it is retained as the “starting point” to any subsequent changes discovered during shoreline verification. A copy of the original source HOB file is created and called HXXXXX_ Final_Features_File.HOB. It is to this field verified HOB file that any edits are performed. The Survey Manager next creates a composite shoreline reference document, the paper representation of the shoreline that will be used to write observations in the field. The HXXXXX_Original_Comp_Source.HOB file is color coded by source using the SORIND source indicator and sent directly to the plotter from Notebook. The HXXXXX_Original_Comp_Source.HOB is also saved in an S-57 .000 format which can be directly opened in Hypack for field reference and verification where necessary. In the field, CARIS Notebook was used to collect DPs and/or modify S57 attribution of existing features. Edits and DPs were collected on the most current version of the HXXXXX_ Final_Features_File.HOB file. An archival copy of the final features file is saved for each day of feature verification. Daily copies are produced in order to aid feature tracking and the eventual compilation of all features in the submission HXXXXX_ Final_Features_File.HOB. De-confliction of the composite source shoreline was conducted only on items specifically addressed in the

OPR-N395-RA-09 Data Acquisition and Processing Report April 2009
21
field while conducting shoreline verification. As a general rule, nearly all features inshore of the NALL line are not investigated. All conflicting composite source features that are not addressed in the field were left unedited in the final features file HOB. Composite source features offshore of the NALL which were DPed for height were also de-conflicted if multiple shoreline features were present representing the same item. The source item most closely representing the actual feature was retained in the HXXXXX_ Final_Features_File.HOB while the other extraneous features were moved into HXXXXX_Disprovals.HOB. In the event that a DP was taken to reposition an incorrectly charted feature, all of the composite source features in the wrong position were moved into HXXXXX_Disprovals.HOB. For surveys where limited shoreline verification was performed, DP/GPs and/or CARIS VBES/SWMB CUBE surfaces were used to help define kelp and foul areas. Any new line features were digitized in the HXXXXX_ Final_Features_File.HOB file. Deleted sections of line features and/or any items fully deleted are moved to the HXXXXX_Disprovals.HOB file for tracking purposes. In all cases, when objects were added or modified the SORDAT and SORIND fields were updated. Investigation methods and results are described in CARIS Notebook under the S57 attributes acronym “remrks”. In the event that charting confusion could result from just the “remrks” field, specific recommendations are described under the S57 attributes acronym “recomd”. Any composite source features or shoreline not addressed during shoreline verification are left untouched. All shoreline data is submitted in Caris Notebook .hob files. The Notebook HOB files submitted as each individual survey’s shoreline deliverables are:
HXXXXX_Original_Comp_Source – The unedited source shoreline file, compiled at Operations with no de-confliction and including all available shoreline sources (with appropriate source attribution, SORIND).
HXXXXX_Final_Features_File – This file is a copy of the original composite source HOB file that
has been edited to represent the shoreline as seen in the field during shoreline verification. This editing includes de-confliction for items investigated, where all unnecessary duplicate features have been removed. The field unit verifies only features within the survey limits (i.e. seaward of the NALL or deemed navigationally significant). If a feature within the survey limits has multiple sources, then the hydrographer picks the most accurately charted feature and removes the other source feature(s). In the event that an item in not specifically addressed in the field, no de-confliction takes place and all depictions of said feature are left untouched in the Final Features HOB file.
This file also includes all new point features (rocks, ATONS, etc), line features (kelp, foul limits, ledges, etc) and any source features that have been modified with the assistance of the VBES buffer line or GPs taken to delineate new extents. DP/GPs taken on bottom samples or to update source features, and underwater features designated in CARIS and exported from Pydro as XML files are also included in this HOB file.
HXXXXX_ Disprovals - This layer serves as a means to keep track of all the source features deleted
from the Final Features layer. Features may be deleted from the Final Features File because they were disproved with VBES or SWMB echosounder or removed during de-confliction. Disproved features always maintain their original SORDAT and SORIND.
The SORDAT and SORIND fields were filled in for any objects added to or modified in the Final Features HOB file.

OPR-N395-RA-09 Data Acquisition and Processing Report April 2009
22
At the current time, Notebook lacks support to directly apply TCARI tides to raw featured heights observed in the field.. Rainier personnel are currently investigating a potential workaround for this problem that involves exporting features from Notebook to Pydro, creating a custom tide file in Pydro, and finally applying this custom tide file to the features in Notebook. C. CORRECTIONS TO ECHO SOUNDINGS Sound Velocity Sound velocity profiles were acquired with SeaBird Electronics SeaCat SBE19 and SBE 19Plus Conductivity, Temperature, and Depth (CTD) profilers (S/N 219, 281, 4039, 4114, 4343, and 4443). Raw conductivity, temperature, and pressure data were processed using the program VelocWin which generated sound velocity profiles for CARIS in the .SVP format. Calibration reports and dates of the SeaCat profilers are included in the 2009 NOAA Ship Rainier Hydrographic Readiness Review Package. The speed of sound through the water was determined by a minimum of one cast for every four hours of SWMB acquisition in accordance with the Standing Project Instructions and the NOS Hydrographic Surveys Specifications and Deliverables Manual. Casts were conducted more frequently when changing survey areas, or when it was felt that conditions, such as a change in weather, tide, or current, would warrant additional sound velocity profiles. Additionally, drastic changes in the surface sound velocity indicative of the need for a new cast were determined by observation of the real-time display of the Odom Digibar Pro mounted on vessel 1101 and the Reson SVP 71 mounted on vessels 2801, 2802, 2803 and 2804. The Reson 8125 SWMB system utilized on vessel 1101 requires a sound velocity probe to be interfaced with the sonar processor for use in projector steering computations. An Odom Digibar Pro, model db1200 velocimeter is utilized to feed a real time SV value is feed directly into the 8125 system. The Reson 7125 SWMB systems utilized on vessels 2801, 2802, 2803 and 2804 require a sound velocity probe to be interfaced with the sonar processor for use in projector steering computations. A Reson SVP 71 surface sound velocity probe is utilized to feed real time SV values directly into the 7-P Sonar Processing Unit. Sound velocity profiles for CARIS were concatenated into a sheet-wide file in order of ascending time/date and saved in the root directory of each sheet’s SVP directory. A naming convention of Hxxxxx_Concat.SVP was used where Hxxxxx is the sheet’s registry number (Ex: H11292_Concat.SVP is the concatenated SVP file for sheet H11292). This concatenated file was then applied to all HDCS data acquired with the option Nearest in distance within time (4 Hours) selected under the Profile Selection Method. Occasionally the digibar or SVP 71 experienced problems due to kelp or bubbles interfering with the sound velocity sensor. These blowouts will cause CARIS to refuse to convert Reson data. Basically, if the sound speed is too low or too high, Reson will not accept it - so the Reson data on the acquisition computer will continue to look good, but CARIS will refuse convert it. This problem may be circumvented by running the HSTP developed macro SetXTFReson8125ss.py. This macro allows a user entered sound speed to supersede the erroneous value in the Reson XTF packet. Since the beamforming is not done in CARIS, the exact value of the user entered sound speed is not critical, so long as it is in the range which CARIS will accept. The macro creates a new xtf file (line_yyyy.xtf, where yyyy is the sound speed input, (should be 1500). This new file is then converted as normal. Vessel 2801 (RA-4) suffered from intermittent sound velocity dropouts from her Reson SVP 71 beginning on 4/9/09. This problem was eventually traced to a damaged sound speed cable which was replaced on 4/11/09.

OPR-N395-RA-09 Data Acquisition and Processing Report April 2009
23
Vessel Offsets and Dynamic Draft Correctors The table below shows when the vessel offsets and dynamic draft correctors used for this project were last determined. A full description of the methods and results employed for each vessel is included in the 2009 NOAA Ship Rainier Hydrographic Readiness Review Package.
Vessel Hull
Number
Date of Static Draft and Transducer
Offset Measurements
Method of Settlement and Squat Measurement
Date of Settlement and Squat
Measurement
Location of Settlement and Squat
Measurement 1101 April 2008 Ellipsoidal Reference April 2, 2009 Lake Washington, WA 1103 April 2007 Optical Level March 9, 2009 Lake Washington, WA 2801 April 2008 Ellipsoidal Reference March 12, 2009 Lake Washington, WA 2802 April 2008 Ellipsoidal Reference March 30, 2009 Lake Washington, WA 2803 April 2009 Ellipsoidal Reference April 3, 2009 Lake Washington, WA 2804 April 2009 Ellipsoidal Reference April 11, 2009 Lake Washington, WA
Table 4 Dates of measurements (transducer offsets and settlement – squat) Settlement and squat observations were conducted for launches 1101, 2801, 2802, 2803 and 2804 using the ellipsoidal referenced method. The Ellipsoidally Referenced Dynamic Draft Measurement (ERDDM) methodology is based on work by ENS Glen Rice’s, outlined in the report titled “FAIRWEATHER Ellipsoidally Referenced Dynamic Draft Measurement”. Unlike the discrete at speed lines used by Fairweather, Rainier used a procedure developed by PS Grant Froelich described in his report “ERDDM Experiment for RA Launch 2801”. Rainier decided to use this method for all of her POS/MV equipped survey launches once HSTP had reviewed Mr. Froelich’s report and gave permission to deviate from the FPM. For the ellipsoidally referenced dynamic draft measurement method as utilized by Rainier, the launch was run with a constant line heading while speed was increased in two-knot increments from four to ten knots in two-minute intervals. A two minute rest period was placed between the runs. POSPac data was recorded as soon as the system was brought up and throughout the entire duration of the dynamic draft measurement. A GPS base station was also set up to record 1 Hz data over the tidal benchmark TIDAL located in the Building 8 parking lot adjacent to the Lake Washington test area for Single Base processing in the Applanix POSPac MMS software suite. Following acquisition, the POSPac data recorded by the POS/MV was imported into the POSPac MMS software suite and processed using Single Base processing. Data from either the Rainier installed GPS base station at the TIDAL benchmark or the national Geodetic Survey CORS station SEAI, operated at Sand Point, was selected as the Base Station. The resulting SBET was exported as an ASCII file, which was processed using the python processing script developed by ENS Glen Rice. Dynamic draft curves were then generated, from which speed and delta draft values were pick for entry into the CARIS dynamic draft table. Values generated using this method were compared to historic values and correlated well, with the ERDDM method giving a more complete picture of the dynamic draft curve. Settlement and squat observations using a surface analysis method was also conducted for launches 2803 and 2804 as a baseline for comparison to the ellipsoidal referenced method. The procedure follows the one outlined in the FPM (1.4.2—Vessel Dynamic Offsets). The same line run repeatedly was used to acquire the data. After the initial first line was run at idle, the speeds thereafter increased at 200-RPM increments. Finally settlement and squat speed curves were derived by querying three pre-selected target areas using surface differencing was used in Fledermaus and graphing the change of apparent depth at different speeds.

OPR-N395-RA-09 Data Acquisition and Processing Report April 2009
24
The optical level method for measuring settlement and squat was conducted for launch 1103. The procedure followed that outlined in the FPM (1.4.2—Vessel Dynamic Offsets). The shore party set up with an optical Zeiss Ni2 level on an offshore platform in Lake Washington. A leveling rod was then held in place on the launch, as closely as possible to directly over the position of the VBES transducer. One line as planned in MapInfo running straight to this platform was used to acquire the data. The orientation of the line was planned in this manner since running parallel to the observer makes reading the rod very difficult. After the initial first line was run at 4 knots SOG, the speeds were increased in 2-knot increments. The vessel was run both towards and away from the pier and ten readings were recorded for each line once the vessel stabilized at each speed. Readings were also taken while the launch was at rest, both before and after each line. The difference between the average at rest readings and the average of the towards and away underway readings produced the values for the settlement and squat speed curves. Due to the fact that Rainier acquired two more new launches for the 2009 field season, arrangements were made for personnel from the National Geodetic Survey’s Geodetic Services Division to conduct spatial relationship surveys. Vessels 2803, and 2804 were pulled out of the water and put up on blocks in order to determine the spatial relationship of various sensors, the multibeam transducers, and reference points in relation to the POS/MV IMU. Unfortunately at the time this survey was conducted, the transducer arrays of the SWMB systems were not yet installed on these two launches due to the need for some additional grinding and welding on the hulls. Two reference points (FORE and AFT) were positioned adjacent to the sonar rack assembly in order to accomplish this task at a later date. Rainier personnel used these reference points and steel tapes to position the SWMB transducers once they were installed in their final position. These measurements, in addition to dimensional blueprints and technical schematics from sonar manuals were used to determine each vessels’ offsets. During the 2007-2008 winter repair period, National Geodetic Survey’s Geodetic Services Division personnel conduct spatial relationship surveys on three Rainier launches (2801, 2802 and 1101). These surveys were conducted due to the Rainier’s acquisition of her first two new launches (2801 and 2802) and the installation of a SWMB system on launch 1101. These measurements, in addition to dimensional blueprints and technical schematics from sonar manuals were used to determine each vessels’ offsets. During the 2008-2009 winter repair period spot checks of these vessel offsets and static drafts were measured using steel tapes and a LEICA laser distance meter but no significant differences were observed. These results were not unexpected since no significant chances were made to vessels 1101, 2801 or 2802 during the winter repair period. Vessel offsets and static draft for vessel 1103 were measured using both steel tapes and a LEICA laser distance meter. In all cases, measurement values obtained were within a few centimeters of historic values and these were retained. These results were not unexpected since no significant chances were made on vessel 1103 during the winter repair period. Dynamic draft and vessel offsets corrector values are stored in the HIPS Vessel Files (HVFs). Survey platforms with more than one acquisition method or system frequency have a separate HVF associated with each individual acquisition method available. Each of these HVFs contains sensor offset and dynamic draft correctors that pertain to this single acquisition system. Sensor offset and dynamic draft correctors were applied to bathymetric data in CARIS during post-processing. Vessel offset diagrams and dynamic draft tables are included in the 2009 NOAA Ship Rainier Hydrographic Readiness Review Package. The HVFs themselves are submitted with the digital HDCS data.

OPR-N395-RA-09 Data Acquisition and Processing Report April 2009
25
The following table lists each HIPS Vessel File used for this project:
HVF name
Survey Vessel & System Type
1101_Reson8125 Jensen hull 1101, SWMB using hull mounted Reson 8125 1103_Singlebeam_HVF Jensen hull 1103, singlebeam using Knudsen 320M 2801_Reson7125_HF_512 Jensen hull 2801, SWMB using Reson 7125, 400kHz, 512 beams2801_Reson7125_LF_256 Jensen hull 2801, SWMB using Reson 7125, 200kHz, 256 beams2802_Klein3k_100_towed Jensen hull 2802, 100% SSS using a towed Klein 3000 2802_Klein5K_100_HVF Jensen hull 2802, 100% SSS using hull mounted Klein 5500 2802_Reson7125_HF_512 Jensen hull 2802, SWMB using Reson 7125, 400kHz, 512 beams2802_Reson7125_LF_256 Jensen hull 2802, SWMB using Reson 7125, 200kHz, 256 beams2803_Reson7125_HF_512 Jensen hull 2803, SWMB using Reson 7125, 400kHz, 512 beams2803_Reson7125_LF_256 Jensen hull 2803, SWMB using Reson 7125, 200kHz, 256 beams2804_Reson7125_HF_512 Jensen hull 2804, SWMB using Reson 7125, 400kHz, 512 beams2804_Reson7125_LF_256 Jensen hull 2804, SWMB using Reson 7125, 200kHz, 256 beams
Table 5 List of HVFs used for project OPR-N395-RA-09. Heave, Pitch, Roll and Heading, Including Biases and Navigation Timing Errors Attitude and Heave data were measured with the sensors described in Section A, and applied in post-processing during SVP Correct and Merge in CARIS HIPS. Rainier’s SWMB equipped survey launches utilize a data time synchronization method known as “precise timing” as described in Section 3 of the OCS Field Procedures Manual. This synchronization significantly reduces latency magnitude and variability, producing data which is both horizontally and vertically more accurate. Rainier’s SWMB equipped survey launches utilize a heave filter integration method known as “TrueHeave” as described in Section 3 of the OCS Field Procedures Manual. This dramatically reduces the filter settling time as compared to the traditional heave filter, almost completely eliminating the need for steadying up on lines before logging can begin. TrueHeave data were logged throughout the survey day, independent of line changes. A new POS file need be created only in the event that the acquisition computer crashes or the launch acquired data on multiple sheets in the same day. Every “POS” file is named in such a manner to be easily identifiable with the applicable DN, VN, and sheet (ex: H12035_2801_DN141_POSA.000). TrueHeave files are transferred the “POS” folder of the CARIS preprocessed data drive (ex: H:\OPR-O112-RA-06_Sitka\H11128\POS\2801\DN148 contains TrueHeave data acquired by vessel 2801 on day number 148 for sheet H11128) for later submission to the PHB. In the event of a computer crash, a new POS file must be created. Multiple POS files have their names appended with “A”, “B”, and so on so that the order they were collected in could later be determined. After regular CARIS data conversion this TrueHeave file was separately loaded into HIPS, replacing the unfiltered heave values recorded in the raw data. To avoid CARIS problems in applying true heave it is now standard procedure to start TrueHeave logging at least 3 minutes before starting bathymetric data acquisition, and letting it run for at least 3 minutes afterward. This is required because the filter which produces the true heave values looks at a long series of data before and after the actual collection time of bathymetric data. If there is still a problem with the TrueHeave data, the utility “fixTrueHeave” was run from the command line with the following context: "fixTrueHeave <trueheave filename> -trim". This produces a new file with the same base name, but with the suffix "fixed" appended. This new ".fixed" file is then applied to the appropriate lines in HIPS.

OPR-N395-RA-09 Data Acquisition and Processing Report April 2009
26
In the event that the POS file refuses to load it is also possible to apply POSPac data. Although this process is labor intensive, it did provide a fall-back method to reduce heave artifacts. Timing and attitude biases were determined in accordance with Section 1 of the Field Procedures Manual, and are described in the 2009 NOAA Ship Rainier Hydrographic Readiness Review Package. All vessel offsets, dynamic draft correctors, and system bias values are contained in CARIS HIPS Vessel Files (HVFs) and were created using the program Vessel Editor in CARIS. These offsets and biases are applied to the sounding data during processing in CARIS. Water Level Correctors For daily processing, soundings were reduced to Mean Lower-Low Water (MLLW) using predicted water levels from the preliminary TCARI file “N395RA2009.tc”. Applying tides with the TCARI file by itself without loading any water level data simply applies predicted tides without any of the residual correctors that observed water levels would provide. After the conclusion of data acquisition, soundings were reduced to Mean Lower-Low Water (MLLW) using TCARI, the Tidal Constituent And Residual Interpolator. TCARI automatically calculates the error associated with water level interpolation. This error is incorporated into the residual/harmonic solutions and included in the Total Propagated Error (TPE) for the survey. For hydrography in project area Central Puget Sound, WA, TCARI grid “N395RA2009.tc” was supplied to produce a seamless tide correction. The application of TCARI tides fully supersedes the need for tidal computations using a zone definition file. The TCARI grid file is sent from CO-OPS and loaded into Pydro. Once in Pydro the TCARI grid may be examined along with the list of tide stations that affect it. TCARI utilizes all tide stations in the project area (historical and currently operating) for harmonic constants and datums. Only those stations selected in the residual column are used for residuals. Residuals are the difference between observed water levels and predicted water levels due to non-tidal components such as meteorological effects. The TCARI Project Instructions sent for each project list the stations required for residuals that must be downloaded from the CO-OPS website. The operating National Water Level Observation Network (NWLON) stations at Port Townsend, WA (9444900), Tacoma, WA (9446484), and Seattle, WA (9447130) served as both datum control and a source of water level reducers for this project. No subordinate water level stations were required for this project and none were installed by Rainier personnel Verified six-minute water level data for stations Port Townsend, WA (9444900), Tacoma, WA (9446484) and Seattle, WA (9447130) were downloaded on the MLLW datum in meters and UTC. TCARI tides are loaded and applied directly to CARIS HDCS data using Pydro. Once all required water levels are downloaded, they are loaded from the main menu bar, TCARI > Load WL Data. Tide reducers are generated for HDCS bathymetry from the main tool bar, TCARI > Create HDCS Tides. At this time HDCS data is selected by project, vessel, and day with individual lines selected with the Descend/Confirm button. TCARI then creates new “Tide”, “TideLineSegments”, and “TideTmIDX” files for each line of bathymetry. Once TCARI created the new tide files, the lines were re-merged in CARIS to force the changes to take affect. Refer to individual Descriptive Reports for further information regarding water level correctors specific to each survey.

OPR-N395-RA-09 Data Acquisition and Processing Report April 2009
27
D. APPROVAL As Chief of Party, I have ensured that standard field surveying and processing procedures were followed during this project. All operations were conducted in accordance with the Office of Coast Survey Field Procedures Manual (April 2009 edition), NOS Hydrographic Surveys Specifications and Deliverables (April 2009 edition), and all Hydrographic Technical Directives issued through the dates of data acquisition. All departures from these standard practices are described in this Data Acquisition and Processing Report and/or the relevant Descriptive Reports. I acknowledge that all of the information contained in this report is complete and accurate to the best of my knowledge. Approved and Forwarded: _________________________________ Donald W. Haines Captain, NOAA Commanding Officer In addition, the following individual was also responsible for overseeing data acquisition and processing of this project: Chief Survey Technician: _________________________________ James B. Jacobson Chief Survey Technician, NOAA Ship Rainier Field Operations Officer: _________________________________ Charles J. Yoos Lieutenant, NOAA Field Operations Officer

OPR-N395-RA-09 Data Acquisition and Processing Report April 2009
28
APPENDIX I
Data Processing Flow Diagrams


Detached Position processing(Raw DP's to Pydro)
LaunchDetachedPositions
(target file)
NetApp(Ra_Raw)
See"Pydro & Caris
data toNotebook" flowchart
Pydroopen/create PSS &Insert Hypack DPs
In Pydroedit DPs &
link to photos
HVF values(Offset, draft, &dynamic draft)
applied
NetApp(RA_proc)
(HDCS/DATA)
TGT_editorReject invalid tgtsCorrect Bearing
renames DPrenames Tgt file
save PSS
Rename photosto
vessel_day_fix#format
Digital Picturesof DP'ed items
NT server(Ra-survey)(Projects)
NT server(Ra-survey)
(Projects...PSS)
LaunchSEACAT
data
VelocWinDownload and
process onlaunch
NODC datasubmission
SVP files
predicted orobserved zoned
tides fromCARIS
NT server(Ra_Bds)(Velocity)
CatfilesNODC files
SVfiles
SVP files
SVPcorrectors
Photoshopand/or MS Paint
crop photostouch up photos
lable DP's
Trimble backpackpositions
(TerraSyncformat)
NT serverPreProcess\
Trimble_GPs\folder
Pathfinder Data Transfer
PathfinderReview and edit data
Pydroopen/create PSS &
Insert Generic GPs/DPs
Export shapefilesOne set of files(.dbf, .shp, .shx)
will be created perobject type
echosounder ornon-echosounder
DPs
Apply tide, draft.offset, and SV
correctors
Apply tidecorrectors
non-echosounder
echosounder
fullycorrected
DPs
AssignEchosounder or
Non -Echosounder
HVF
In CARISapply correctors to
DPs
ALLcorrectors
applied
TCARItides from
Pydro

InsertedPydro
Features
Primary?
1. Designate as "Primary".2. Designate CorrelatingFeatures "Secondary".
Significant?
1. Select best feature on object and designate as "Primary".2. Designate Correlating Contacts "Secondary".
Mark "Resolved"
1. Mark "Significant".2. Assess Bathy Coverage.
Is Feature the "Primary" contact on a physical object?1. Best DP on a shoreline feature?2. Best SSS Image?3. SWMB or VBES Least Depth?4. Dive Investigation DP?
Does the feature meet the standard of "Significance"?1. DP corresponds to significant feature?2. SSS Contact Height >1m or 20% of water depth in >20m of water?3. SSS Contact poses particular hazard to navigation?4. SSS Contact of possible cultural or historical significance?5. Bathy or Dive DP on significant feature?6. Shoal sounding on "skin of the earth" type feature?
YES
NO
YES
NO
Investigate?
Chart?
Report?
DTON?Mark "Resolved"1. Mark "DTON".2. Generate DTON Report.3. Mark "Resolved".
1. Mark "Investigate", clear "Tgt Exported" flag if set.2. Export Investigation Items (sets "Tgt Exported").3. Plan and execute additional coverage (SWMB, VBES, DI, DP)
1. Clear "Investigate"2. Select new "Primary"3. Describe Investigation in "Remarks"
1. Mark "Chart" and select Feature Type.2. Make Charting Recomendation.
YES
NO
NO
YES
NO
YESNO
Mark"Report"
YES
Is additional investigation required?1. Nadir, or near-nadir bathymetry coverage?2. Suspicious sounding or DP?3. Diver Investigation required to identify object?
Does the Hydrographer recommend plotting this feature on theSmooth Sheet? (includes features representing disproval DPs)
Will feature be specifically addressed in Descriptive Report?
Detached Position processing in Pydro
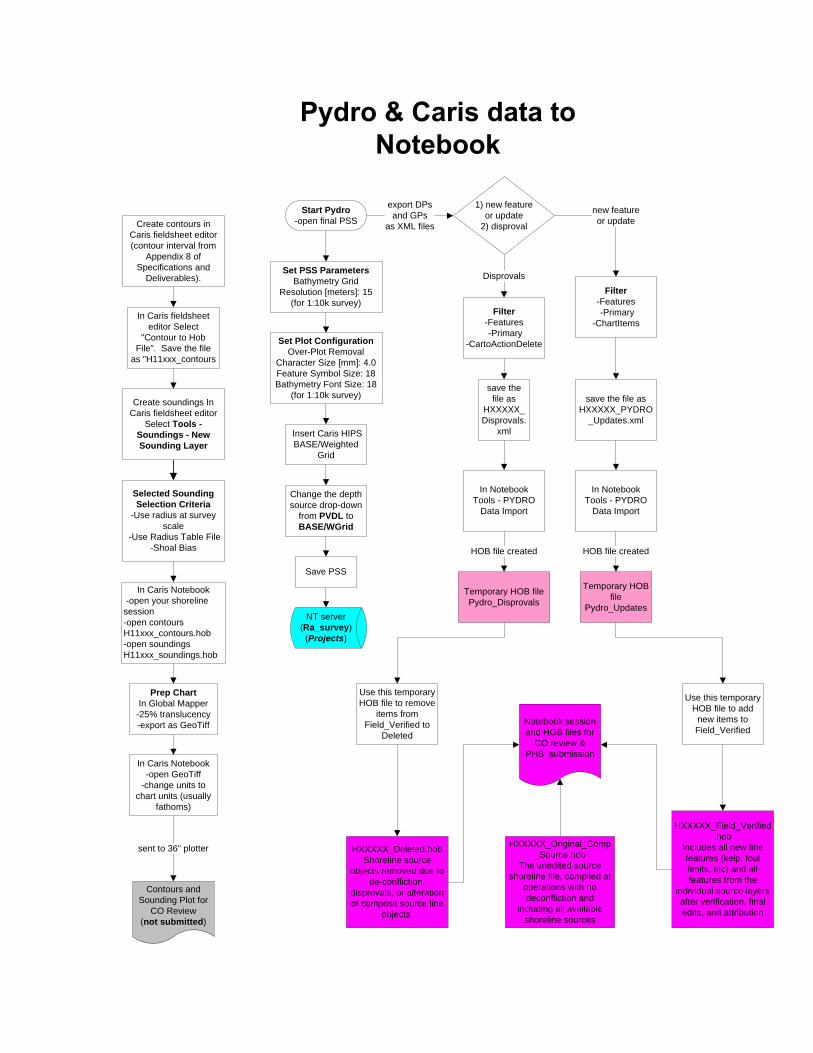
Set Plot ConfigurationOver-Plot Removal
Character Size [mm]: 4.0Feature Symbol Size: 18Bathymetry Font Size: 18
(for 1:10k survey)
Insert Caris HIPS BASE/Weighted
Grid
Save PSS
Notebook session and HOB files for
CO review &PHB submission
Contours and Sounding Plot for
CO Review(not submitted)
NT server(Ra_survey)
(Projects)
Set PSS ParametersBathymetry Grid
Resolution [meters]: 15(for 1:10k survey)
Start Pydro-open final PSS
Change the depth source drop-down
from PVDL to BASE/WGrid
Create contours in Caris fieldsheet editor (contour interval from
Appendix 8 of Specifications and
Deliverables).
In Caris fieldsheet editor Select
"Contour to Hob File". Save the file
as "H11xxx_contours
Create soundings In Caris fieldsheet editor
Select Tools -Soundings - New Sounding Layer
Disprovals
export DPsand GPs
as XML files
1) new featureor update
2) disproval
new featureor update
Filter-Features-Primary
-ChartItemsFilter
-Features-Primary
-CartoActionDelete
In NotebookTools - PYDRO
Data Import
Selected Sounding Selection Criteria
-Use radius at survey scale
-Use Radius Table File-Shoal Bias
In Caris Notebook-open your shoreline session-open contours H11xxx_contours.hob -open soundings H11xxx_soundings.hob
Prep ChartIn Global Mapper-25% translucency-export as GeoTiff
In Caris Notebook-open GeoTiff
-change units to chart units (usually
fathoms)
sent to 36" plotter
save the file as HXXXXX_PYDRO
_Updates.xml
save the file as
HXXXXX_Disprovals.
xml
In NotebookTools - PYDRO
Data Import
Temporary HOB file
Pydro_Updates
HOB file created
Temporary HOB filePydro_Disprovals
HOB file created
HXXXXX_Field_Verified.hob
Includes all new line features (kelp, foul limits, etc) and all features from the
individual source layers after verification, final edits, and attribution
HXXXXX_Original_Comp_Source.hob
The unedited source shoreline file, compiled at
operations with no deconfliction and
including all available shoreline sources
HXXXXX_Deleted.hob Shoreline source
objects removed due to de-confliction,
disprovals, or alteration of composit source line
objects.
Use this temporary HOB file to remove
items from Field_Verified to
Deleted
Use this temporary HOB file to add
new items to Field_Verified