
DasibiCO3008MonitorManual
156
-
Upload
api-26966403 -
Category
Documents
-
view
483 -
download
2
Transcript of DasibiCO3008MonitorManual
DASIBI ENVIRONMENTAL CORP. TM910415
Preface
This Operating & Maintenance (O&M) manual contains information foruse by operating personnel of the Dasibi Environmental Corporation(Dasibi) Model 3008 Gas Filter Correlation Carbon MonoxideAnalyzer, also referred to herein as the unit or instrument. Thisinformation includes descriptions of installation, theories ofoperation, basic operation, calibration, preventive & correctivemaintenance procedures and troubleshooting techniques for the unit.
-.
Experience indicates that the user will obtain maximum performanceand utility from the instrument when time has been spent studyingthe information provided herein. It is therefore recommended thatthis manual be fully reviewed before proceeding with installationand commissioning of the unit.
Dasibi continually strives to remain current with the latestelectronic developments. Hardware/software improvements areincorporated into its products as soon as development and testinghave been accomplished. Sometimes, due to printing and shippingrequirements, these changes are not immediately incorporated intothe manuals, but are rather presented as individual technicalupdate pages provided in Appendix B. Information aboutmodifications that have taken place since the copyright date listedon the front page of this manual, are detailed there. It is highlyrecommended that this section be reviewed for any unit purchased.
Modifications that have occurred since the last copyright date ofthis manual will be carried in Appendix B until they may bepermanently entered into the manual. If no update pages areincluded in this section, then this manual is correct as printed.Any feature described in this section that is applicable to theunit shipped with this manual will have an asterisk (*) hand-written next to its listing in the Table of Contents when thismanual is inspected before shipment. Although every effort is madeto keep the manual accurate and up-to-date, it is possible thaterrors have been made. If an error in the manual is found, orfurther information or assistance is desired, please contactDasibi's sales department.
Dasibi Environmental Corporation506 Paula AvenueGlendale, CA 9 1201Phone #: (818) 247-7601 Fax #: (818) 247-7614
This manual was prepared exclusively for use by the owners of theModel 3008. The material contained herein is proprietary and is tobe used only for the purpose of operating this product. Any otheruse or duplication without prior written consent of Dasibi isprohibited. Any modifications made to the unit without prior,written consent of Dasibi may void the following warranty.
ii

DASIBI ENVIRONMENTAL CORP.
Warranty
TM910415
-_
This warranty covers two specific areas that may occur afterdelivery to the original purchaser by Dasibi, or by an authorizedDasibi representative:
1) Defective instrument operation according to guaranteedperformance specifications.
2) Defects in materials or workmanship.
The warranty is applicable, provided that inspection and analysisby Dasibi discloses that any defects in instrument performance ordefects in materials and workmanship developed under normal andproper use, and that the instrument was maintained and operated inaccordance with the operations and service manuals supplied withthe instrument. Dasibi will be released from all obligations underthis warranty in the event repairs or modifications to theinstrument have been made by persons other than Dasibi's ownrepresentatives, unless such repairs were made with the prior,written consent of Dasibi.
Any item claimed to be defective must be returned to Dasibi,transportation charges prepaid, and will be re-shipped to thecustomer collect, unless the item is actually found to bedefective, in which case, Dasibi will pay transportation charges.
Defective Instrument Operation
Dasibi agrees to correct any unit that does not function within thelimits of the published performance specifications, either byrepair or, at the option of Dasibi, by replacement, for one yearafter delivery to the original purchaser, the only exception beingconsumable items.
Defective Materials or Workmanship
Dasibi agrees to correct any defects in materials or workmanship inany unit either by repair or, at the option of Dasibi, byreplacement, subject to the following conditions:
1. Dasibi extends to the original purchaser a two year warrantyon all Dasibi-manufactured electronic parts and a one vearwarranty on all Dasibi-manufactured mechanical parts.
2. Dasibi extends to the customer whatever dated warranty isgiven to Dasibi by the suppliers of component items purchasedby Dasibi and incorporated into the instrument.
3. This warranty does not cover expendable items, because theirduration and performance may vary from case-to-case.
iii

DASIBI ENVIRONMENTAL CORP. TM910415
Claims for Damaged Shipments and Shipping Errors
Damaged Shipments
Merchandise should be inspected immediately upondescribed in Section One of this manual.
receipt asA packing list is
supplied with every shipment, and all items received should bechecked against this list. If there appears to be shipping damage,both the carrier and Dasibi should be notified immediately (if theinstrument appears to have only operational problems not associatedwith shipping damage, only Dasibi should be notified).
Claims for Shipping Discrepancies
It is important to check the contents of all shipments promptlyagainst the packing list. Dasibi reserves the right to disavow allclaims of deficiency that are not promptly reported.
__ If a claim is to be made, report the following:
1. Sales Order Number2. Purchase Order Number3. Model Number4. Serial Number5. Date Received
In addition, the following documents may be necessary to support aclaim for shipping damage:
1. Copy of original invoice2. Copy of packing list3. Original freight bill and bill of lading4. Photos of damaged equipment and container (if possible)
Conditions of Shipment
F.O.B. DESTINATION means that Dasibi pays all expenses and assumesall risks until actual delivery of the merchandise at the pointagreed upon with the buyer.
F.O.B. GLENDALE means that the purchaser will pay all expenses andassumes all risks of merchandise damage.
iv

DASIBI ENVIRONMENTAL CORP. TM910415
-- 1)
2)
--
3)
4)
5)
6)
-
Procedure For Returns/Repairs
Contact Dasibi to describe the problem. Obtain a returnauthorization number from the sales/service department. Thisnumber aids Dasibi in Yrackingfl returned items and indetermining whether or not the item is still under warranty,or considered out-of-warranty.
w*ran$cItem: Please enclose a written description of the exactproblem as accurately as possible. If strip charts or othersuch test documents are available, please include copies ofthem in the return shipment as they will help in the swifttroubleshooting of described problems.
m:-Of-waFrantYItemS: Providing a written description of the exactproblem as accurately as possible, guarantees that Dasibitechnicians will only perform repair work on the requestedareas. If additional repairs/upgrades are desirable, Dasibicustomer service will notify the customer to first obtainapproval.
Upon receipt of an out-of-warranty item, Dasibi will draft anestimate of the repair work required (there is no charge forthis). The estimate will contain probable replacementparts/assemblies and the respective costs of each. Inaddition, there will be an estimate of "hands onI1 labor time.
Dasibi's service department will contact the customer with theinitial estimate. Dasibi will not complete the required workuntil proper authorization from the customer is obtained.Because of the nature of some problems, though, some repairwork may have to be performed before authorization is obtainedin order to draft the initial estimate.
If repair work is going to exceed the initial estimate, Dasibiwill draft an estimate revision, provide an explanation forthe additional work required, and submit this to the customerfor re-approval. Once such approval is either given, ordenied, work will commence. This prevents any unauthorizedwork from being performed.
Dasibi will ship repaired out-of-warranty items back to thecustomer with appropriate strip charts and quality controlreports verifying performance, along with a detailed listingof all replaced parts and assemblies. Dasibi will return anyreplaced component upon customer request onlv.
V
- -- -
- -.
DASIBI ENVIRONMENTAL CORP. TM910415
Operating Warning Information
*** DANGER ***
TOXIC EXHAUST GAS
Route exhaust gas from rear panel outlet tooutside vent or laboratory fume hood throughtubing with an O.D. of l/4-inch and an I.D. ofl/8-inch or greater.
*** DANGER ***
ELECTRICAL SHOCK HAZARD
There exists HIGH VOLTAGE within portions ofthis analyzer, Please refer to materialcontained within this manual before performingany servicing inside the unit, itself.
_-
vi

DASIBI ENVIRONMENTAL CORP. TM910415
EPA Designation
The Dasibi Model 3008 Gas Filter Correlation (GFC) Infrared COAnalyzer has been designated by the United States EnvironmentalProtection Agency as a reference method for the measurement ofambient air concentrations of Carbon Monoxide pursuant with therequirements defined in 40 CFR Part 53 (40 FR 7049, Feb. 18, 1975)
Designated Reference Method Number: RFCA-0488-067
EPA Designation Date: April, 1988
The Dasibi Model 3008 GFC Infrared CO Analyzer meets EPA designatedreference method requirements when operated within the followingparameters:
Range
Line Voltage Range
Temperature Range
Time Constant Setting
0 - 50 PPM
105 - 125 VAC
20 - 3o"c
60 seconds
The analyzer must be operated and maintained according to theoperation and service manual to conform to the EPA Designationrequirements.
vii
DASIBI ENVIRONMENTAL CORP. TM910415
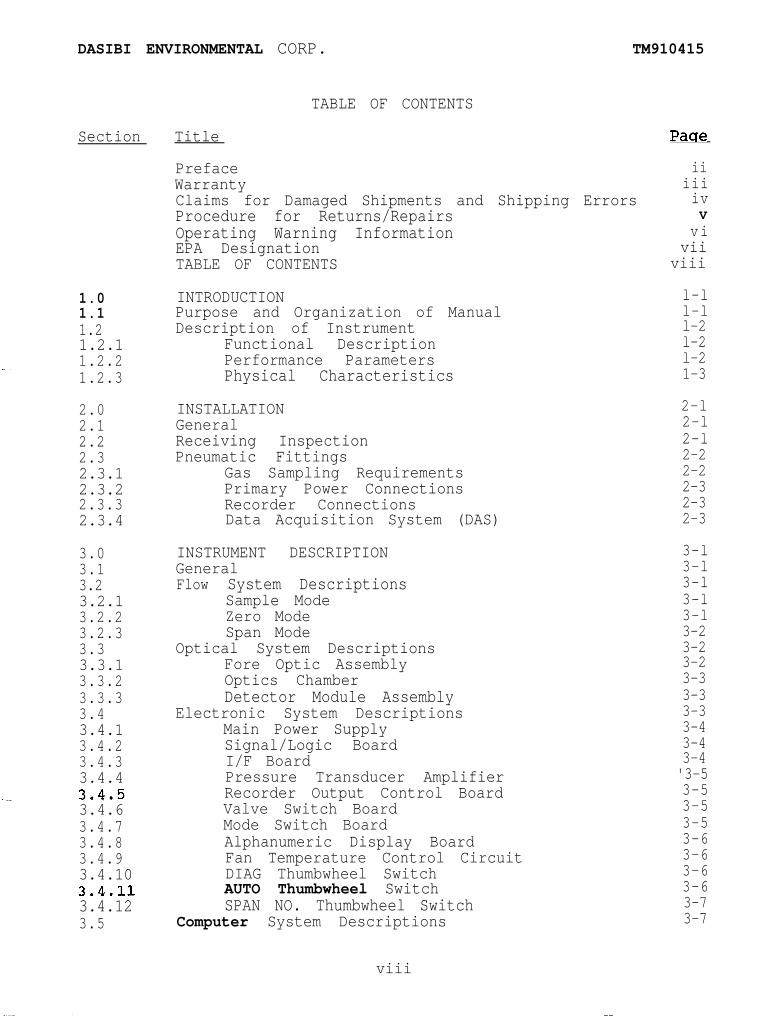
Section
1.0 INTRODUCTION1.1 Purpose and Organization of Manual1.2 Description of Instrument1.2.1 Functional Description1.2.2 Performance Parameters1.2.3 Physical Characteristics
2.0 INSTALLATION2.1 General2.2 Receiving Inspection2.3 Pneumatic Fittings2.3.1 Gas Sampling Requirements2.3.2 Primary Power Connections2.3.3 Recorder Connections2.3.4 Data Acquisition System (DAS)
3.0 INSTRUMENT DESCRIPTION3.1 General3.2 Flow System Descriptions3.2.1 Sample Mode3.2.2 Zero Mode3.2.3 Span Mode3.3 Optical System Descriptions3.3.1 Fore Optic Assembly3.3.2 Optics Chamber3.3.3 Detector Module Assembly3.4 Electronic System Descriptions3.4.1 Main Power Supply3.4.2 Signal/Logic Board3.4.3 I/F Board3.4.4 Pressure Transducer Amplifier3.4.,5 Recorder Output Control Board3.4.6 Valve Switch Board3.4.7 Mode Switch Board3.4.8 Alphanumeric Display Board3.4.9 Fan Temperature Control Circuit3.4.10 DIAG Thumbwheel Switch3.4.11 AUTO Thumbwheel Switch3.4.12 SPAN NO. Thumbwheel Switch3.5 Computer System Descriptions
TABLE OF CONTENTS
Title
PrefaceWarrantyClaims for Damaged Shipments and Shipping ErrorsProcedure for Returns/RepairsOperating Warning InformationEPA DesignationTABLE OF CONTENTS
viii
--
Page
iiiiiivV
vivii
viii
l-ll-ll-2l-2l-21-3
2-l2-l2-l2-22-22-32-32-3
3-l3-l3-l3-l3-l3-23-23-23-33-33-33-43-43-4'3-53-53-53-53-63-63-63-63-73-7
DASIBI ENVIRONMENTAL CORP. TM910415
Section
3.5.13.5.23.5.33.5.4
4.04.14.24*34.44.54.64.7
5.0 OPERATION5.1 General5.2 Controls and Indicators5.3 Turn On5.4 Turn Off5.5 Mod,es of operation5.5.1 AUTOSTART Program5.5.l.l Instrument Start-Up with AUTOSTART5.5.1.2 AUTBSTART Program Protocol5.5.2 MANUAL Mode
' 5.5.2.1 On-Board and External Operation5.5.2.2 Using Manual Mode During Calibrations5.5.3 AUTO Mode5.5.3.1 Recommended Use of the AUTO Mode5.6 Recorder and DAS Connections5.7 Selection of Averaging Time
6.06.16.26.2.16.2.26.2.2.16.2.2.26.2.36.2.3.16.2.3.26.2.3.36.2.3.46.2.3.56.2.3.66.2.3.76.2.3.86.3
TABLE OF CONTENTS (Continued)
Title Pase
I/O Board 3-7CPU Board 3-7Flashing Messages 3-8Computer Diagnostics 3-9
PRINCIPLES OF OPEIEATION 4-lGeneral 4-lTheory of Operation 4-lTemperature/Pressure Correction 4-2Flaw System 4-3Optical System 4-3Electronic System 4-3Computer System 4-4
5-l5-l5-15-25-25-25-25-35-35-45-55-65-65-75-8
5-10
MAINTENANCE 6-lGeneral 6-1Preventiv e Maintenance 6-l
Maintenance Schedules 6-lLeak Check 6-l
Checking For Leaks in the Valving SystemLocating Leak Exclusive of Valving System
Replacement of ComponentsTeflon Filter Pad ReplacementZero Air Element ReplacementPump ReplacementSolenoid Valve ReplacementGas Filter Correlation WheelInfrared SourceReplacement of the Program EPROMCleaning of the Mirrors
Corrective Maintenance
6-26-26-26-36-36-46-46-56-66-76-76-9
ix
DASIBI ENVIRONMENTAL CORP. TM910415
Section
6.3.16.3.26.3.2.16.3.2.26.3.2.36.3.36.3.3.16.3.3.26.3.3.36.3.3.46.3.3.56.3.3.66.3.3.76.3.3.86.3.3.96.3.3.106.3.46.46.56.5.16.5.26.5.36.5.46.5.56.5.66.5.76.5.86.5.96.5.106.5.116.5.126.5.136.5.146.5.156.5.16
7.07.17.27.37.47.5
TABLE OF CONTENTS (Continued)Title Pacre
General Troubleshooting Techniques 6-9General Diagnostic Information 6-10
Flashing Messages 6-10PROM Failure 6-10V/F Failure 6-10
Diagnostics Dialed Via DIAG Thumbwheel Switch 6-10DIAG 0DIAG 1DIAG 2DIAG 3DIAG 4DIAG 5DIAG 6DIAG 7DIAG 8DIAG 9
Special Test Functions of Computer-COMPTESTTroubleshooting ProcedureStepwise Troubleshooting Procedures
Physical ExaminationMain Power SupplyE-SYS TestI/F BoardC-SYS TestCPU BoardI/O BoardDetector ModuleSignal/Logic BoardOptical BenchGas Filter Correlation WheelGas Handling SystemRecorder Output BoardFan Control BoardValve Control BoardHeater Control Circuit
REPLACEMENT PARTS LISTSGeneralOrdering InformationService Kit for One Year of OperationService Kit for Two Years of OperationReplacement Component/Assembly Stock Numbers
APPENDIX A INSTRUMENT CALIBRATIONA.1A.2 JGeneral
Quick CalibrationA.3 *'Formal1M CalibrationA.3.1 Apparatus Needed for Calibration
6-116-116-116-126-126-126-126-126-136-136-136-156-156-156-166-166-176-176-186-186-186-216-226-23
6-246-246-246-246-25
7-l7-l7-l7-l7-l7-2
A-lA-2A-2A-3A-3
X
--
DASIBI ENVIRONMENTAL CORP. TM910415
SectionTABLE OF CONTENTS (Continued)
A.3.2 ode1 3008 CheckoutA.3.3 Step-by-Step Dynamic Multipoint CalibrationA.3.4 Frequency of CalibrationsA.4 Zero/Span CheckA.4.1 Use of Internal Catalytic CO Scrubber
APPENDIX B M.ANUAL UPDATESB.1 New Valve Control BoardB.2 Optional Advanced Diagnostic BoardB.2.1 Isolated Status Input/Control Output SignalsB.2.2 RS232 Interface CommunicationsB.2.3 External Relay/Terminal BoxB.3 Special lSvstem~l SoftwareB.4 DasibiNet tnterfaceB.5 'I New I' RS232 Interface Capabilities
* = Feature is included in unit shipped with this manual.
APPENDIX C REFERENCESc.1 General
LIST OF FIGURES_I_ - ------
Fiqure No. Title
2-l
3-l3-23-33-43-53-G3-73-83-8A3-93-103-113-123-133-143-153-163-173-183-193-203-21
Back Panel of Instrument
dlow DiagramOptics Bench AssemblyFront Panel DiagramFunctional Electronics DiagramPower Supply Board DiagramPower Supply Board SchematicsSignal/Logic Board DiagramSignal/Logic Board Schematics (A)Signal/Logic Board Schematics (B)I/F Board DiagramI/F Board SchematicsRecorder Output Board DiagramRecorder Output Board SchematicsValve Switch Board DiagramValve Switch Board SchematicsMode Switch Board DiagramFan Control Board DiagramFan Control Board SchematicsI/O Board DiagramI/O Board Schematics (A)I/O Board Schematics (B)CPU Board Diagram
xi
Page
A-4A-4A-6A-6A-6
B-lB-2B-2B-3B-8B-10B-10B-11B-11
C-lc-2
Page
2-4
3-103-113-123-133-143-153-163 - 173-183-193-203-213-223-233-243-253-263-273-283-293-303-31
DASIBI ENVIRONMENTAL CORP. TM910415
Figure No.
LIST OF FIGURES (Continued)-m
Title
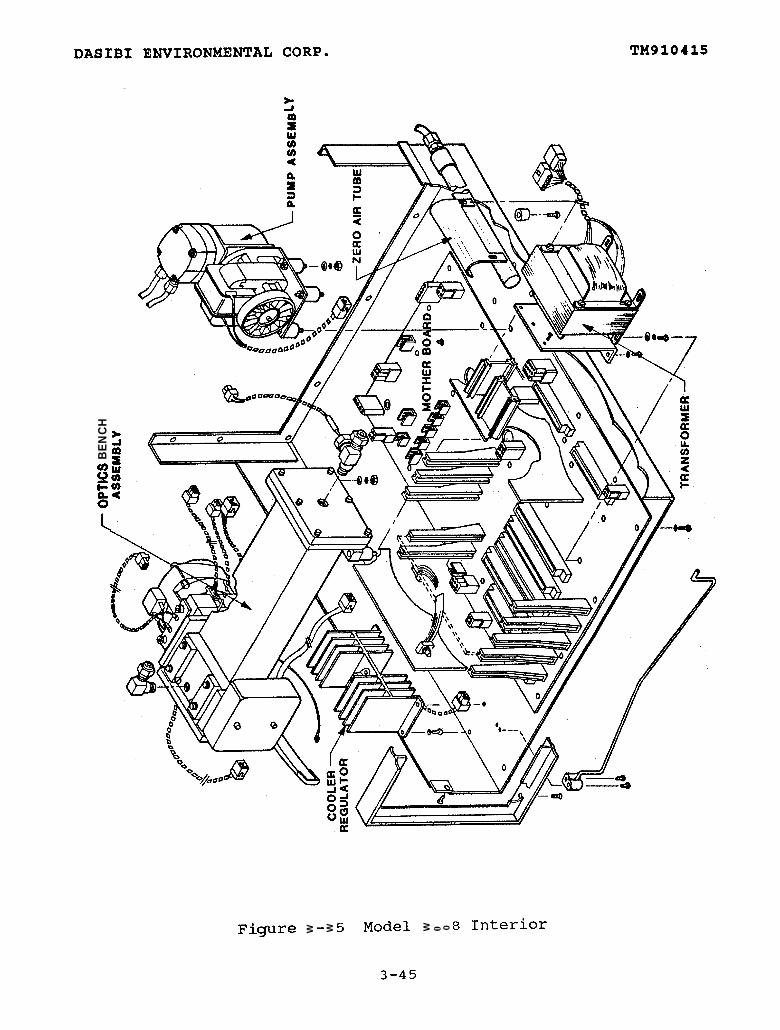
3-22 CPU Board Schematics (A) 3-323-23 CPU Board Schematics (B) 3-333-24 Mother Board Diagram 3-343-25 Mother Board Schematics 3-353-26 CPU Watchdog Board Diagram 3-363-27 CPU Watchdog Board Schematics 3-373-28 Detector Module Diagram 3-383-29 Detector Pre-Amp Schematics 3-393-30 Cooler Regulator Diagram 3-403-31 Cooler Regulator Schematics 3-413-32 Optics Chamber 3-423-33 RS232 Board (Optional) Diagram 3-433-34 RS232 Board (optionalj Schematics 3-443-35 Model 3008 Interior 3-45
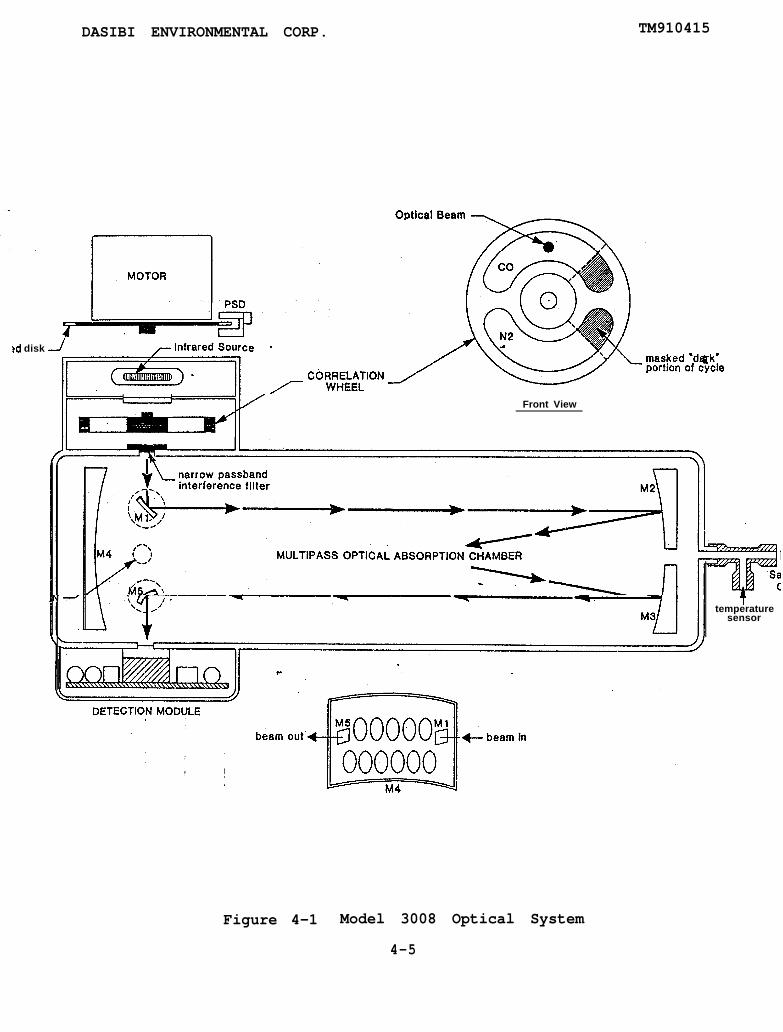
4-1 Model 3008 Optical System
6-16-26-36-46-56-66-76-86-96-106-116-12
'A-lA-2
Multipoint Calibration Set- pvys
Sample Calibration CurveA-8A-9
B-l New Valve Control Board Diagram BD-1B-2 New Valve Control Board Schematics BD-2B-3 Diagnostic Board Connections BD-3B-4 Diagnostic Board Diagram BD-4B-5 Diagnostic Board Schematics (A) BD-5B-6 Diagnostic Board Schematics (B) BD-6B-7 Network Interface Board Diagram BD-7B-8 Network Interface Board Schematics BD-8
Table No. Title
Zero Air Tube Element ReplacementPump ReplacementE-PROM Replacement.Cable Connections To MicroprocessorDetector Module Waveform ComparisonChecking Trimpots and Test Points with DVMSimplified Circuit Diagram:Signal/Logic BoardDiagnostics Performance ChartTeflon Filter Pad ReplacementI.R. Source ReplacementRemoval of Beam Steering MirrorsFlow Diagram of Troubleshooting
LIST OF TABLES
l-l Outline of Organization of Manuall-2 Performance Specification of Model 3008
xii
Page
4-5
6-266-276-286-296-306-316-326-336-346-356-366-37
Page
l-1l-2

DASIBI ENVIRONMENTAL CORP. TM910415
LIST OF TABLES (Continued)
Table No. Title
l-3 Physical Characteristics, Dasibi Model 3008Gas Filter Correlation Carbon Monoxide Analyzer
3-1 DIAG Thumbwheel Switch Settings 3-63-2 AUTO Thumbwheel Switch Settings 3-73-3 CFU Dipswitch Settings 3-8
5-l AUTOSTART Program Protocol
6-1 Diagnostic Functions Using DIAG Thumbwheel Switch6-2 AUTO Thumbwheel Switch Settings For Calibration
Signals At DIAG NO, 86-3 Troubleshooting Procedures6-4 Maintenance Schedule6-5 Maintenance Check List
Page
1-3
5-3
6-10
6-126-146-246-25
xiii
DASIBI ENVIRONMENTAL CORP. TM910415
1.0 INTRODUCTION
1.1 Purpose and Orqanization of Manual
This O&M manual presents operating and service information forthe Dasibi Model 3008 Gas Filter Correlation Carbon MonoxideAnalyzer. Past experience indicates that the user will obtainmaximum performance from the instrument when time has been spentstudying this information. It is therefore recommended that thismanual be reviewed before installing, operating or servicing theanalyzer.
The information is presented in seven sections which includea description of the instrument design and operating theory, aswell as discussions of its installation, operation, andmaintenance. Appendices include specialized information on thegeneral instrument calibration procedures, and update informationto this manual (when applicable). For each section, theinformation is presented as descriptive text, followed by thereferenced figures, in order, at the end of the section. Theinformation presented is outlined in Table l-l, below.
TABLE l-lOutline of Organization of Manual
Section Topics Covered
\ . 1
2_ _
3
5
6
General instrument description, performancespecifications, and physical characteristics.
Instrument installatiorW
Instrument description{
Theory of operation.:
Routine operation.;
Maintenance procedures.
Replacement parts list.
Appendix A Instrument calibration.
Appendix B Manual update information (as appropriate).
Appendix C References
l-l----
DASIBI ENVIRONMENTAL CORP. TM910415
Included with this manual is the final factory quality controlreport for the analyzer. These data are of great value indetermining if the analyzer, as received by the user, hasexperienced any change in performance due to shipping problems.The user is encouraged to re-check the performance of theinstrument immediately after installation.
1.2 Description of Instrument
1.2.1 Functional Description
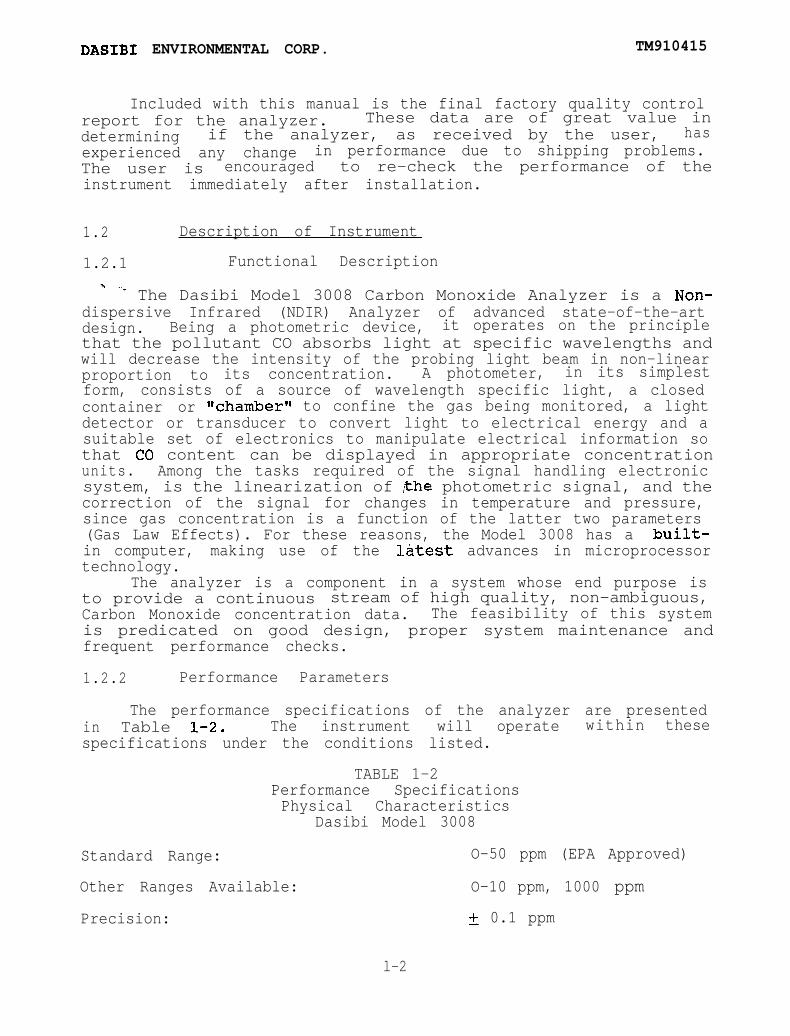
n 'I* The Dasibi Model 3008 Carbon Monoxide Analyzer is a Non-dispersive Infrared (NDIR) Analyzer of advanced state-of-the-artdesign. Being a photometric device, it operates on the principlethat the pollutant CO absorbs light at specific wavelengths andwill decrease the intensity of the probing light beam in non-linearproportion to its concentration. A photometer, in its simplestform, consists of a source of wavelength specific light, a closedcontainer or %hamberV1 to confine the gas being monitored, a lightdetector or transducer to convert light to electrical energy and asuitable set of electronics to manipulate electrical information sothat CO content can be displayed in appropriate concentrationunits. Among the tasks required of the signal handling electronicsystem, is the linearization of the photometric signal, and thecorrection of the signal for changes in temperature and pressure,since gas concentration is a function of the latter two parameters(Gas Law Effects). For these reasons, the Model 3008 has a built-in computer, making use of the latest advances in microprocessortechnology.
The analyzer is a component in a system whose end purpose isto provide a continuous stream of high quality, non-ambiguous,Carbon Monoxide concentration data. The feasibility of this systemis predicated on good design, proper system maintenance andfrequent performance checks.
1.2.2 Performance Parameters
The performance specifications of the analyzer are presentedin Table l-2. The instrument will operate within thesespecifications under the conditions listed.
TABLE 1-2Performance SpecificationsPhysical Characteristics
Dasibi Model 3008
Standard Range: O-50 ppm (EPA Approved)
Other Ranges Available: O-10 ppm, 1000 ppm
Precision: t 0.1 ppm
l-2
DASIBI ENVIRONMENTAL CORP. TM910415
Linearity: 2 1%
Noise (at zero concentration): & 0.05 ppm
Lower Detectable Limit: 0.1 ppm
Rejection ratio:Water Vapor Over 200,000 : 1
Zero Drift With Auto Zero:Without Autozero:
Zero0.2 ppm/24 hours
Span Drift:(25*C, Nominal line voltage)
2 1% /24 hours& 2% /week
Lag Time: 2 seconds
Rise/Fall Time to 98% Full Scale: 120 seconds
5 to 40*c20 to 3o"c
Operating Temperature:EPA Temperature:
o-95%Operating Humidity (non-condensing):-.
1 LPMFlow Rate
O-10 VFS (Adjustable)O-10 VFS (Adjustable)
output:
-_ Power: 105-125 VAC, 50/60 Hz220-240 VAC, 50/60 Hz
1.2.3 Physical Characteristics
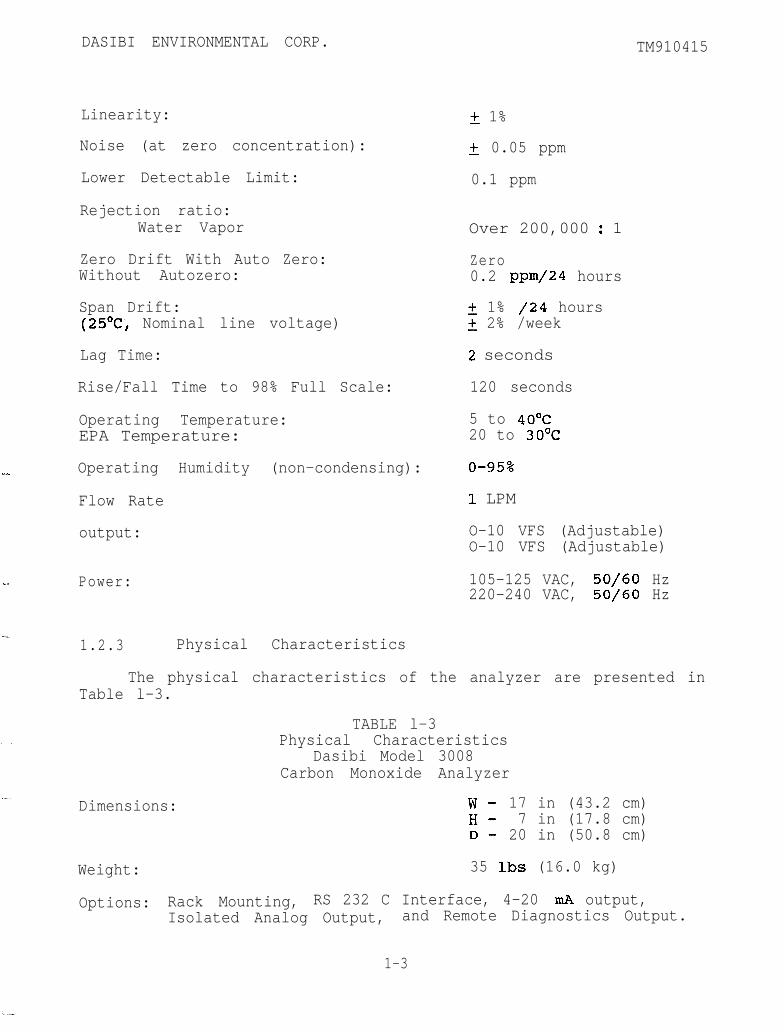
The physical characteristics of the analyzer are presented inTable l-3.
TABLE l-3Physical Characteristics
Dasibi Model 3008Carbon Monoxide Analyzer
Dimensions: W- 17 in (43.2 cm)H- 7 in (17.8 cm)D- 20 in (50.8 cm)
Weight: 35 lbs (16.0 kg)
Options: Rack Mounting, RS 232 C Interface, 4-20 mA output,Isolated Analog Output, and Remote Diagnostics Output.
1-3

DASIBI ENVIRONMENTAL CORP. TM910415
2.0
2.1 General
This section of the manual describes installation of theinstrument. It is advisable to read this section beforeinstallation is begun. The information presented includesreceiving inspection, and pneumatic, and electrical connections.
INSTALLATION
2.2 Receivinq Inspection
The instrument was carefully inspected and packed prior toshipment. After the instrument has been delivered, please checkthe following:
1.
2.
3.
4.
6.
7 .
Verify that the package contents are complete as ordered.
Inspect the instrument for external physical damage dueto shipping such as scratched or dented panel surfaces,broken knobs or connectors, etc.
Remove the instrument cover and remove all interior foampacking and save for future shipments. Make note of howthe foam packing was installed.
Inspect interior of instrument for damage, brokencomponents, loose circuit boards, etc. If no damage isevident, the instrument is ready for installation andoperation. If any damage due to shipping is encountered,please contact Dasibi (see preface page iv, llClaims forDamaged Shipments and Shipping Error&*).
If shipping damage is found, and it becomes necessary toreturn the instrument, please re-pack it in the same wayit was delivered (using both the Dasibi shippingcontainers and the internal foam packing material).
The Dasibi shipping boxes and interior packing materialsare specifically made for shipment of the analyzer. Thematerials should be retained for possible future re-shipments to Dasibi (such as subsequent service or repairrequirements).
If it becomes necessary to return the instrument toDasibi at some future time, and the original shippingmaterials and container cannot be found or were notsaved, please contact the Dasibi sales office before re-shipment, with the model number of your instrument,
2-l
TM910415
and Dasibi will offer for purchase the appropriateshipping container and materials to prevent damage to theinstrument during shipping. Lt is not recommended thatthe instrument be shipped using shipping materials andcontainers unsuited for this purpose.
2,3 Pneumatic Fittings
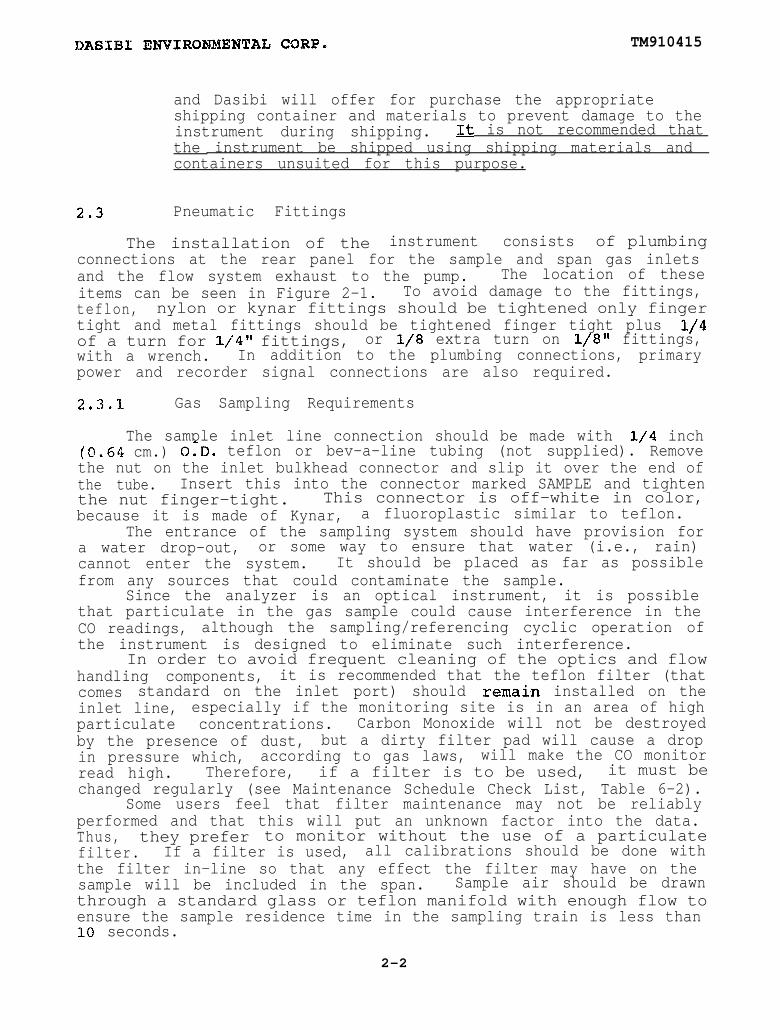
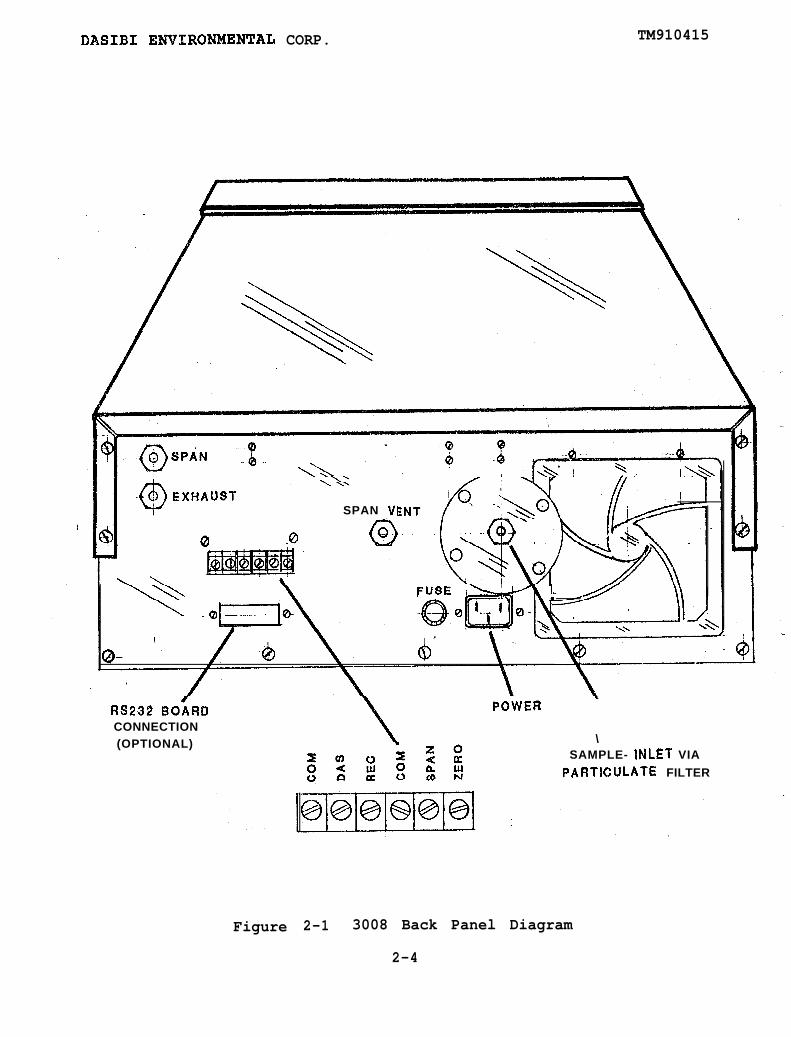
The installation of the instrument consists of plumbingconnections at the rear panel for the sample and span gas inletsand the flow system exhaust to the pump. The location of theseitems can be seen in Figure 2-1. To avoid damage to the fittings,teflon, nylon or kynar fittings should be tightened only fingertight and metal fittings should be tightened finger tight plus l/4of a turn for l/4** fittings, or l/8 extra turn on l/8'@ fittings,with a wrench. In addition to the plumbing connections, primarypower and recorder signal connections are also required.
2.3.3.. Gas Sampling Requirements
The sample inlet line connection should be made with l/4 inch(L64 cm.) O:D. teflon or bev-a-line tubing (not supplied). Removethe nut on the inlet bulkhead connector and slip it over the end ofthe tube. Insert this into the connector marked SAMPLE and tightenthe nut finger-tight. This connector is off-white in color,because it is made of Kynar, a fluoroplastic similar to teflon.
The entrance of the sampling system should have provision fora water drop-out, or some way to ensure that water (i.e., rain)cannot enter the system. It should be placed as far as possiblefrom any sources that could contaminate the sample.
Since the analyzer is an optical instrument, it is possiblethat particulate in the gas sample could cause interference in theCO readings, although the sampling/referencing cyclic operation ofthe instrument is designed to eliminate such interference.
In order to avoid frequent cleaning of the optics and flowhandling components, it is recommended that the teflon filter (thatcomes standard on the inlet port) should .remain installed on theinlet line, especially if the monitoring site is in an area of highparticulate concentrations. Carbon Monoxide will not be destroyedby the presence of dust, but a dirty filter pad will cause a dropin pressure which, according to gas laws, will make the CO monitorread high. Therefore, if a filter is to be used, it must bechanged regularly (see Maintenance Schedule Check List, Table 6-2).
Some users feel that filter maintenance may not be reliablyperformed and that this will put an unknown factor into the data.Thus, they prefer to monitor without the use of a particulatefilter. If a filter is used, all calibrations should be done withthe filter in-line so that any effect the filter may have on thesample will be included in the span. Sample air should be drawnthrough a standard glass or teflon manifold with enough flow toensure the sample residence time in the sampling train is less than10 seconds.
2-2
DASIBI ENVIRONMENTAL CORP. TM910415
The instrument does not use any reagents and is safe to ventinto a working area. The exhaust is actually ambient air. Forthis reason, the exhaust should also be prevented from re-enteringthe sample system.
2.3.2 Primary Power Connections
The instrument is designed to operate on standard, singlephase electrical current, 105 to 125 VAC, 50 to 60 Hz or 220 VAC,50 to 60 Hz. Prior to connecting the AC power cord to the powersource, ensure that the power switch on the instrument is in theoff position.
To protect operating personnel, the National ElectricalManufacturer's Association recommends that the instrument begrounded. The instrument is equipped with a three-conductor powercable which automatically grounds the instrument when theappropriate outlets are used. The round pin on the power cable isthe ground pin connection. To retain the protection feature whenoperating the instrument from a two-contact outlet, use athree-conductor to two-conductor adapter and connect the adaptergrounding wire to a suitable ground.
HAZARD WARNING
Operating the instrument without properlyconnecting the ground lead is a dangerouselectrical practice.
2.3.3 Recorder Connections
A terminal strip is located on the rear panel for theconnection of one or two recorders. The standard instrumentprovides adjustable analog output signals at this terminal stripfrom 0 - 1 and 0 - 10 volts to record CO readings. Trimpots,accessible through holes located on the front panel permit both therecorder ZERO and SPAN to be set for each output. When connectingrecorders, use shielded, twin-lead cable and observe the correctpolarity.
2.3.4 Data Acquisition System (DAS)
The instrument analog output can be connected to a dataacquisition system as well as a recorder at the terminal strip onthe back panel. If a data acquisition system is connected, onlyone recorder can then be connected at the same time. There areZERO and SPAN adjustments on the front panel for adjusting both arecorder output as well as for setting up the data acquisitionsystem. When connecting the data acquisition system, use shielded,twin-lead cable and observe the correct polarity.
2-3
DASIBY ENVXRBNMENTAL CORP. TM910415
EXHAUST\’
SPAN ,VI
0 ?
FlJSE w !,---.-. -,.
FIG232 E&RDCONNECTION(OPTIONAL)
PdWpt
\SAMPLE- INLET VIA
PARTlCULATE FILTER
Figure 2-1 3008 Back Panel Diagram
2-4

DASIBI ENVIRONMENTAL CORP. TM910415
3.0 INSTRUMENT DESCRIPTION
3.1 General
This section provides a brief *physical and operationaldescription of the instrument. Further operating details andtheory are provided in Section 4.0, Principle of Operation. Thetwo sections should be read together to obtain a full overview ofthe instrument's construction and capabilities. Section 5.0describes instrument adjustments for routine operation. The COAnalyzer Model 3008 is composed of three (3) functional subsystems:
1. The Flow System - Figure 3-l
2. The Optical System - Figure 3-2
3. The Electronic System - Figure 3-4
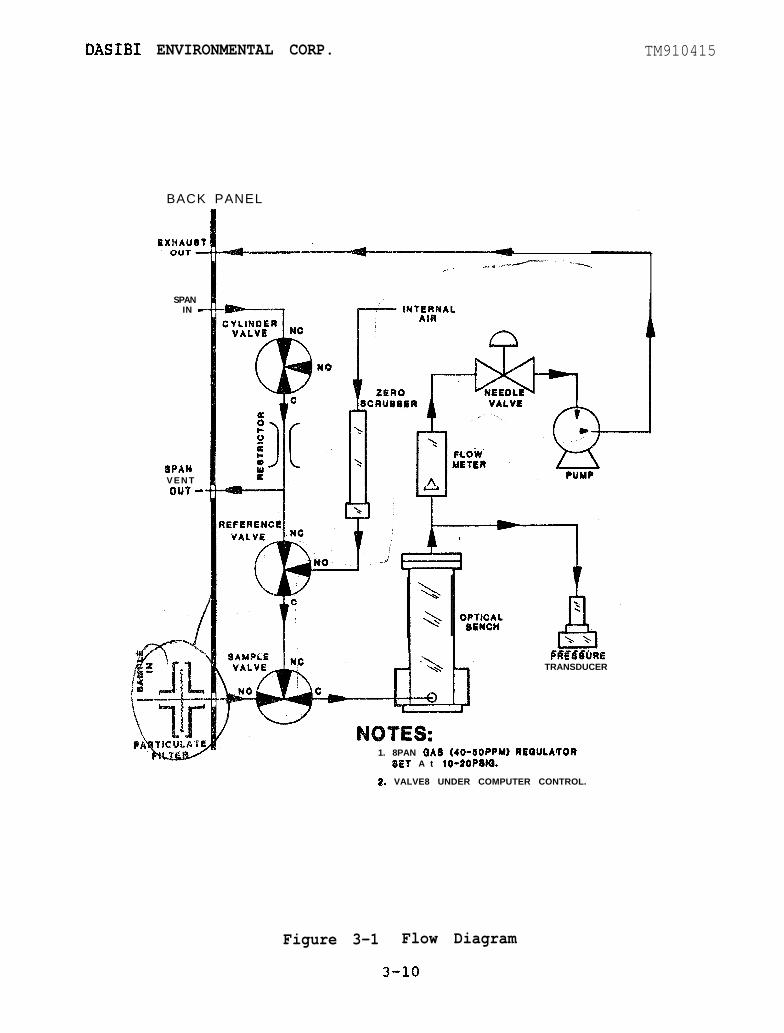
3.2 Flow Svstem Descriptions (Refer to Figure 3-l)
This system is composed of:
1. Sample Solenoid Valve (3-way)
2. Reference Solenoid Valve (3-way)
3. Span Tank Solenoid Valve (2-way; third port is not used)
All three valves are connected to the optical unit, which inturn is connected to a flowmeter equipped with a needle valve. Theflowmeter is connected to the suction side of a pump: the pressureside of the pump is connected to the exhaust port of the analyzer.
3.2.1 SAMPLE MODE
.
c_
When the front panel mode switch labelled SAMPLE is pushed nosolenoid valves are activated and the analyzer samples ambient airthrough the Sample port. From here, incoming gas enters the Samplevalve, which is in an'unenergized state and allows the sample gasto flow through the a'ilalyzer's optical bench. The sample gas ispulled out of the optical bench by the action of a vacuum pumplocated downstream of the bench, after it is passed through aflowmeter, and a needle valve flow controller that is set tomaintain the flow at 1.0 LPM. The gas is then vented out of theinstrument via the Exhaust port.
3.2.2 ZERO MODE
Pushing the ZERO mode switch activates the Sample Valve onlv,which connects to the unenergized Reference Valve, permitting theinstrument to sample gas through the Zero Air Filter.. The air isthen drawn through the optical bench via the downstream pump.
-_ 3-l
DASIBI ENVIRONMENTAL C3RP. TM910415
The Zero Air Filter consists of a cartridge (mounted insidethe instrument) containing a special catalyst able to remove carbonmonoxide from ambient 'air, thus providing a source of zero gas forthe instrument without the use of tanks. When the Reference valveis activated (manually or automatically) the instrument samplesambient air through the catalyst and a dynamic zero is achieved.
3-2.3 SPAN MODE
Pushing the SPAN mode switch activates all three valvessimultaneously allowing the instrument to sample span gas comingfrom a pressurized cylinder.
The function of the span valve is to shut off the effluent ofthe standard gas cylinder so that it does not continue to flowthrough the capillary "flow restrictor and out of the Vent Port whenthe instrument is no longer in the SPAN mode. This is especiallynecessary with the use of the remote control options. It alsopermits the user to have the span gas cylinder itself always opento the analyzer without the danger of wasting its contents. Thecapillary flow restrictor sets the gas flow at about 1.2 LPM, 1 LPMused by the analyzer and 0.2 LPM being vented through the Ventport. The span gas cylinder pressure is normally set at 15-20PSIG *
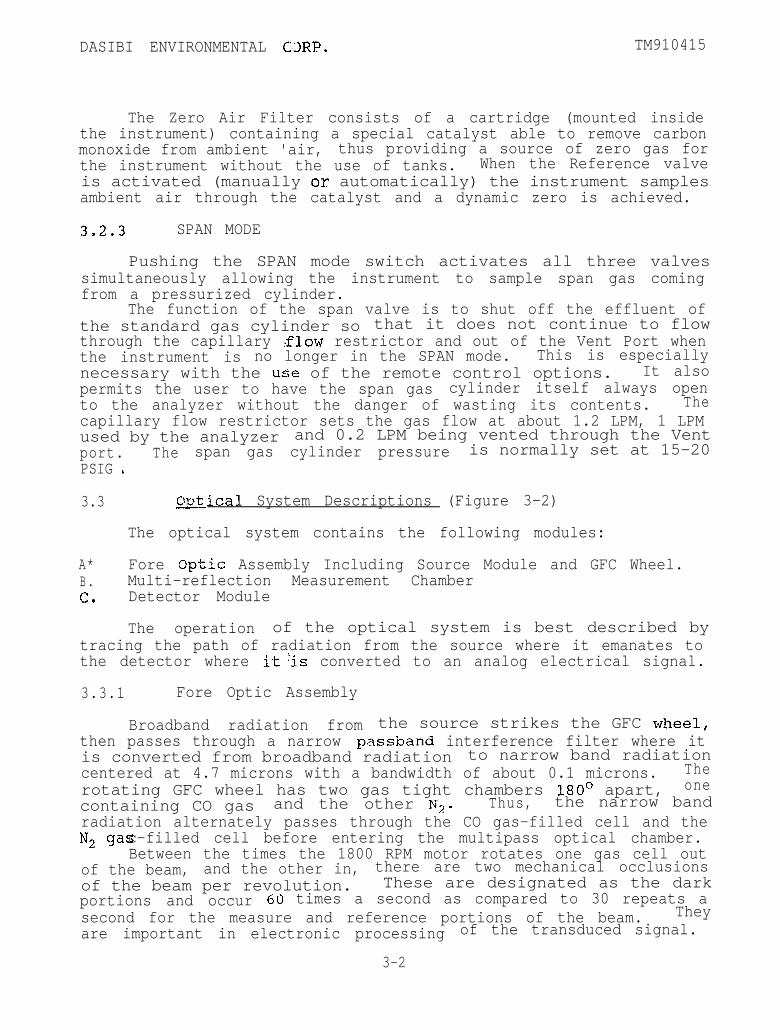
3.3 C&ical System Descriptions (Figure 3-2)-A-
The optical system contains the following modules:
A* Fore Qptic Assembly Including Source Module and GFC Wheel.B. Multi-reflection Measurement ChambercN. Detector Module
The operation of the optical system is best described bytracing the path of radiation from the source where it emanates tothe detector where it'is converted to an analog electrical signal.
3.3.1 Fore Optic Assembly
Broadband radiation from the source strikes the GFC wheel!then passes through a narrow passband interference filter where itis converted from broadband radiation to narrow band radiationcentered at 4.7 microns with a bandwidth of about 0.1 microns. Therotating GFC wheel has two gas tight chambers 180* apart, onecontaining CO gas and the other N2. Thus, the narrow bandradiation alternately passes through the CO gas-filled cell and theN, gasc-filled cell before entering the multipass optical chamber.
Between the times the 1800 RPM motor rotates one gas cell outof the beam, and the other in, there are two mechanical occlusionsof the beam per revolution. These are designated as the darkportions and occur 60 times a second as compared to 30 repeats asecond for the measure and reference portions of the beam. Theyare important in electronic processing of the transduced signal.
3-2
DASIBI ENVIRONMENTAL CORP. TM910415
The rotation of the motor shaft determines the timing of theoptical events taking place in the optical module. I In order forthe measurement information to be synchronously decoded by theelectronic system, the latter must be coordinated time-wise withthe wheel rotation. This is done by a slotted disk which ismounted on the motor shaft. The disk interrupts a light beamgenerated in an optical position sensing device (PSD). This smallassembly is positionable about an arc and controls the phaserelationship between the electronic signal sampling, and theangular position with time of the correlation wheel.
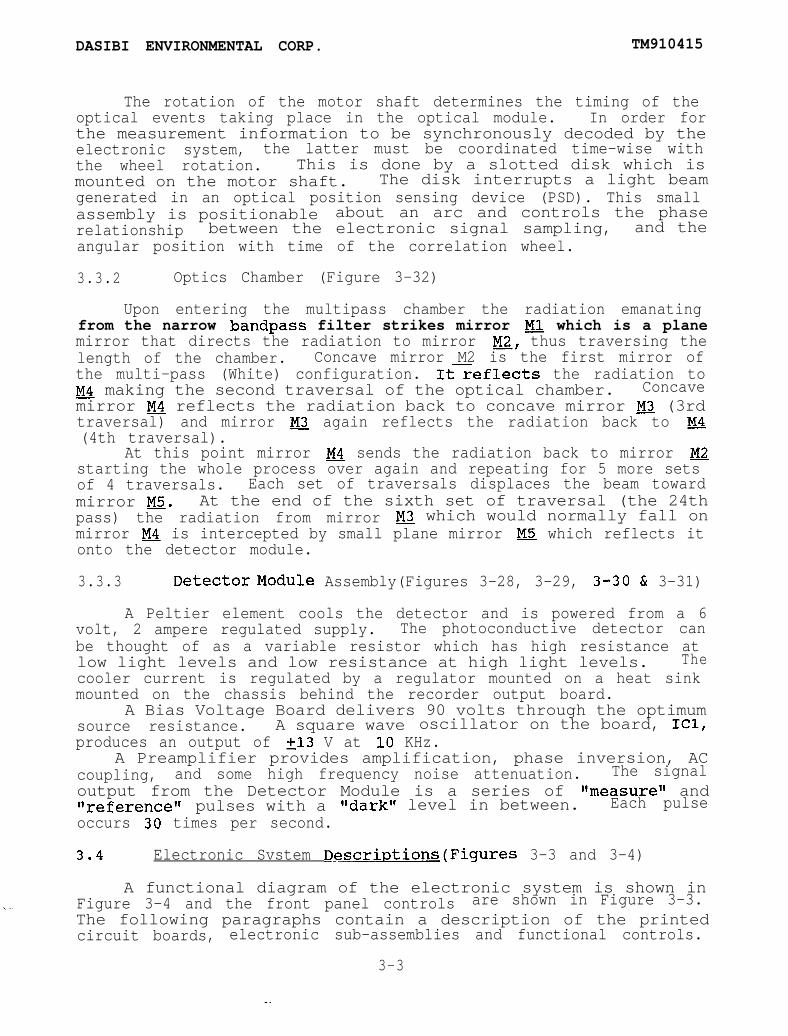
3.3.2 Optics Chamber (Figure 3-32)
Upon entering the multipass chamber the radiation emanatingfrom the narrow bandpass filter strikes mirror MA which is a planemirror that directs the radiation to mirror E, thus traversing thelength of the chamber. Concave mirror M2 is the first mirror ofthe multi-pass (White) configuration. Itxeflects the radiation to& making the second traversal of the optical chamber. Concavemirror M4 reflects the radiation back to concave mirror M3 (3rdtraversal) and mirror @J again reflects the radiation back to M4(4th traversal).
At this point mirror M4 sends the radiation back to mirror M2starting the whole process over again and repeating for 5 more setsof 4 traversals. Each set of traversals displaces the beam towardmirror m. At the end of the sixth set of traversal (the 24thpass) the radiation from mirror M3 which would normally fall onmirror M4 is intercepted by small plane mirror m which reflects itonto the detector module.
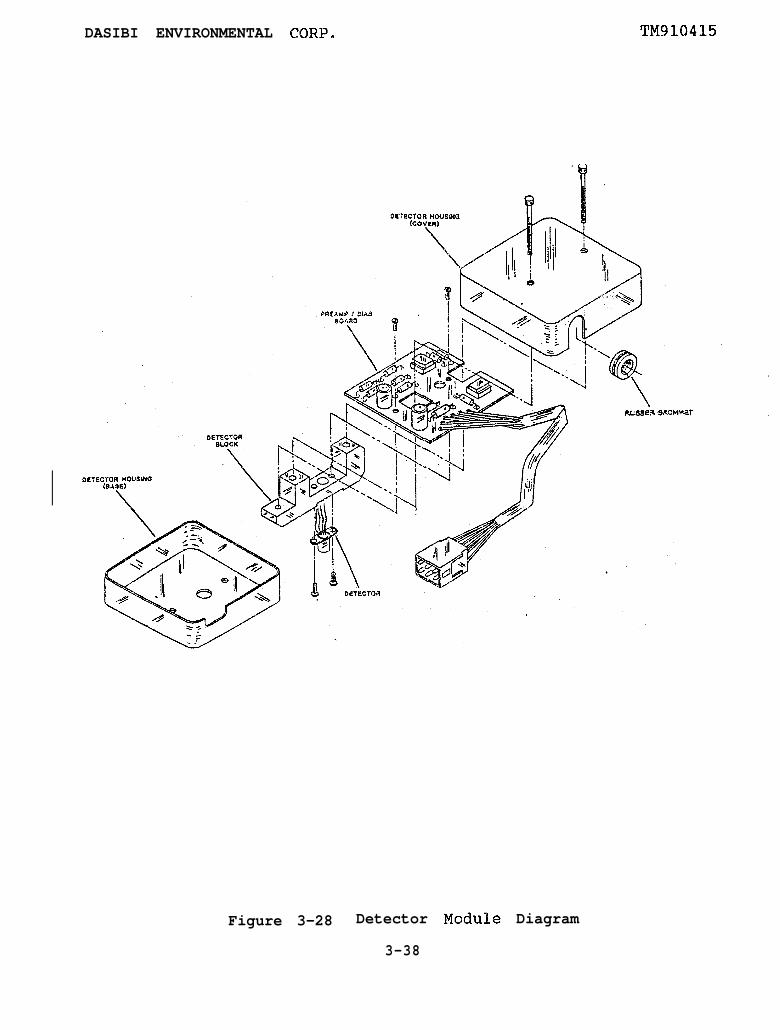
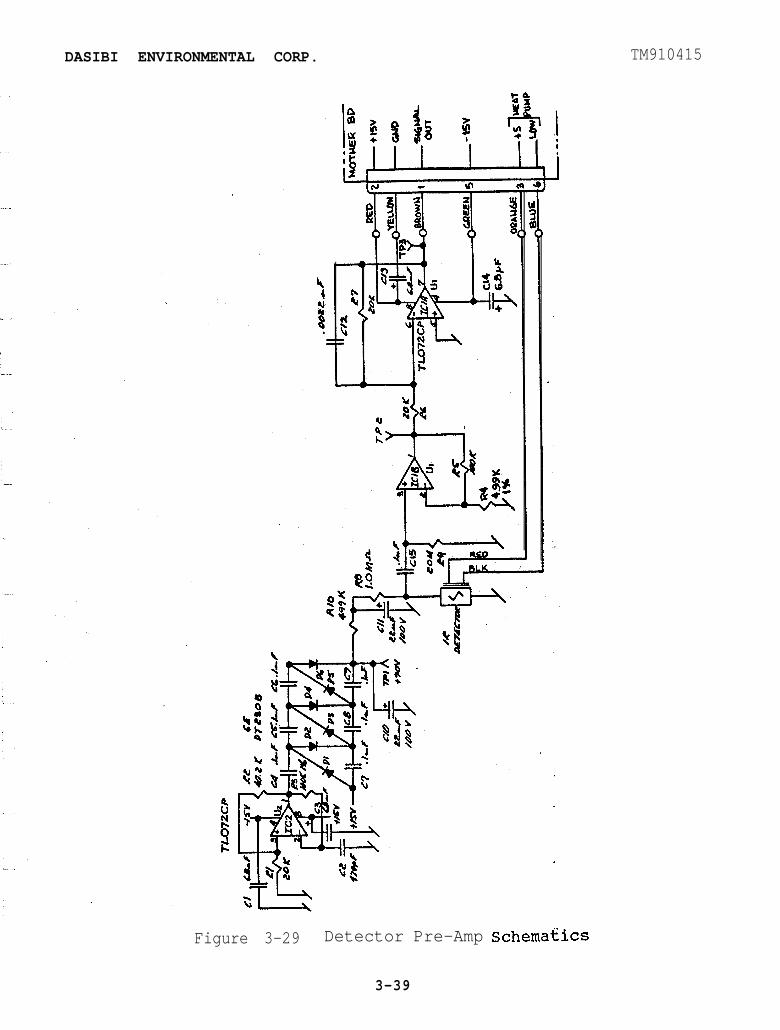
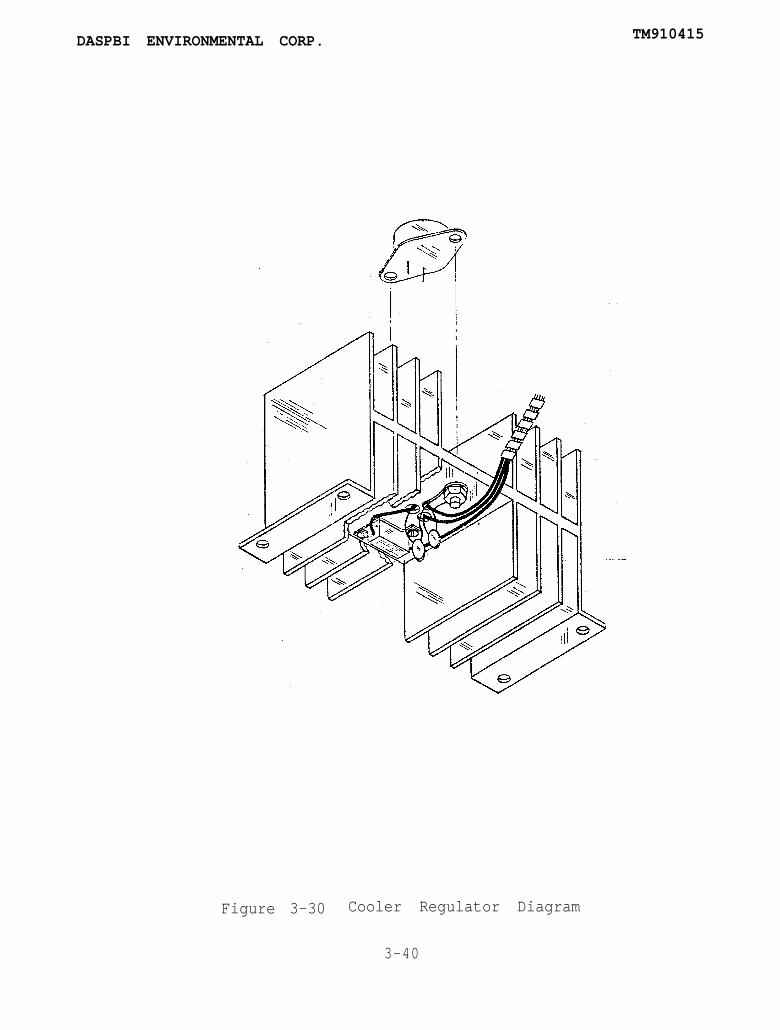
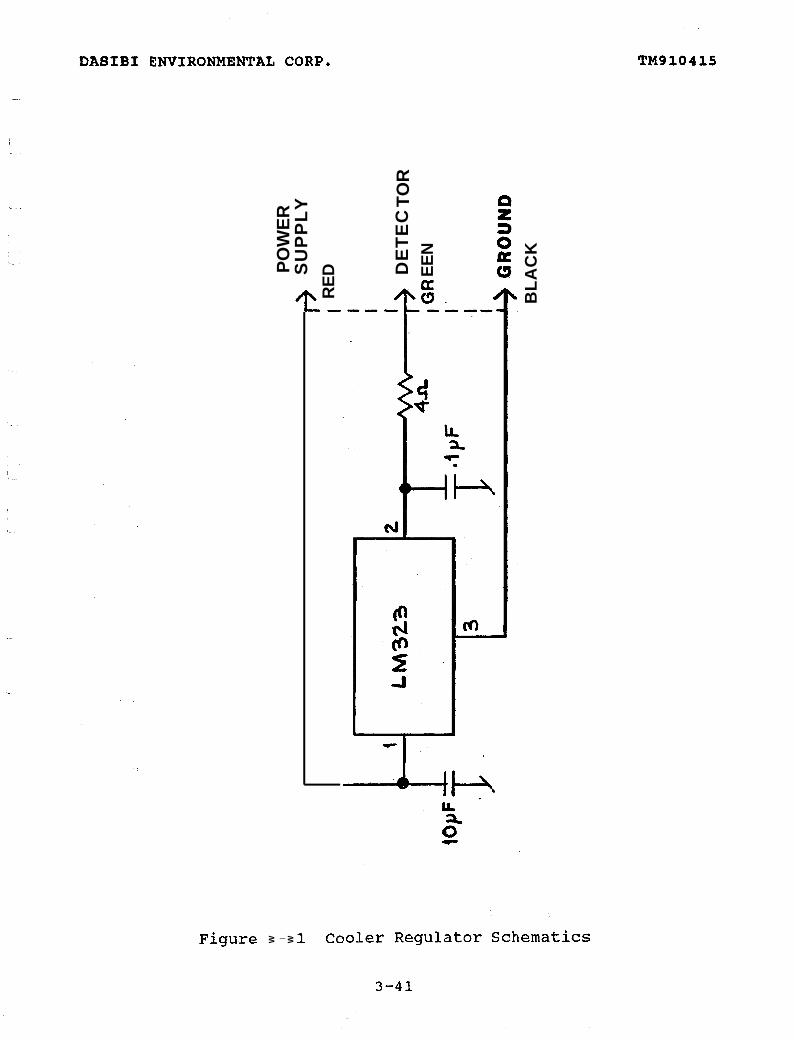
3.3.3 DetectorModule Assembly(Figures 3-28, 3-29, 3-30 & 3-31)
A Peltier element cools the detector and is powered from a 6volt, 2 ampere regulated supply. The photoconductive detector canbe thought of as a variable resistor which has high resistance atlow light levels and low resistance at high light levels. Thecooler current is regulated by a regulator mounted on a heat sinkmounted on the chassis behind the recorder output board.
A Bias Voltage Board delivers 90 volts through the optimumsource resistance. A square wave oscillator on the board, ICl,produces an output of &13 V at 10 KHz.
A Preamplifier provides amplification, phase inversion, ACcoupling, and some high frequency noise attenuation. The signaloutput from the Detector Module is a series of llmeasurell and*'reference" pulses with a "darkl' level in between. Each pulseoccurs 30 times per second.
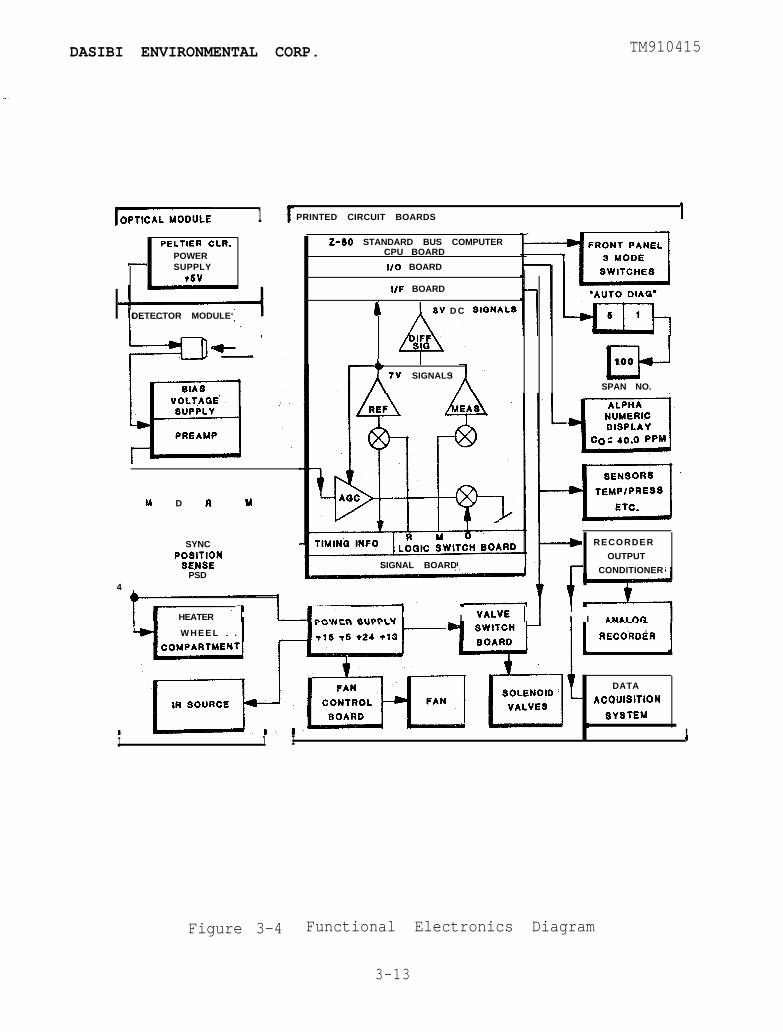
Electronic Svstem Descriptions(Figures 3-3 and 3-4)
A functional diagram of the electronic system is shown inFigure 3-4 and the front panel controls are shown in Figure 3-3.The following paragraphs contain a description of the printedcircuit boards, electronic sub-assemblies and functional controls.
3-3
DASIBI ENVIRONMENTAL CORP. TM910415
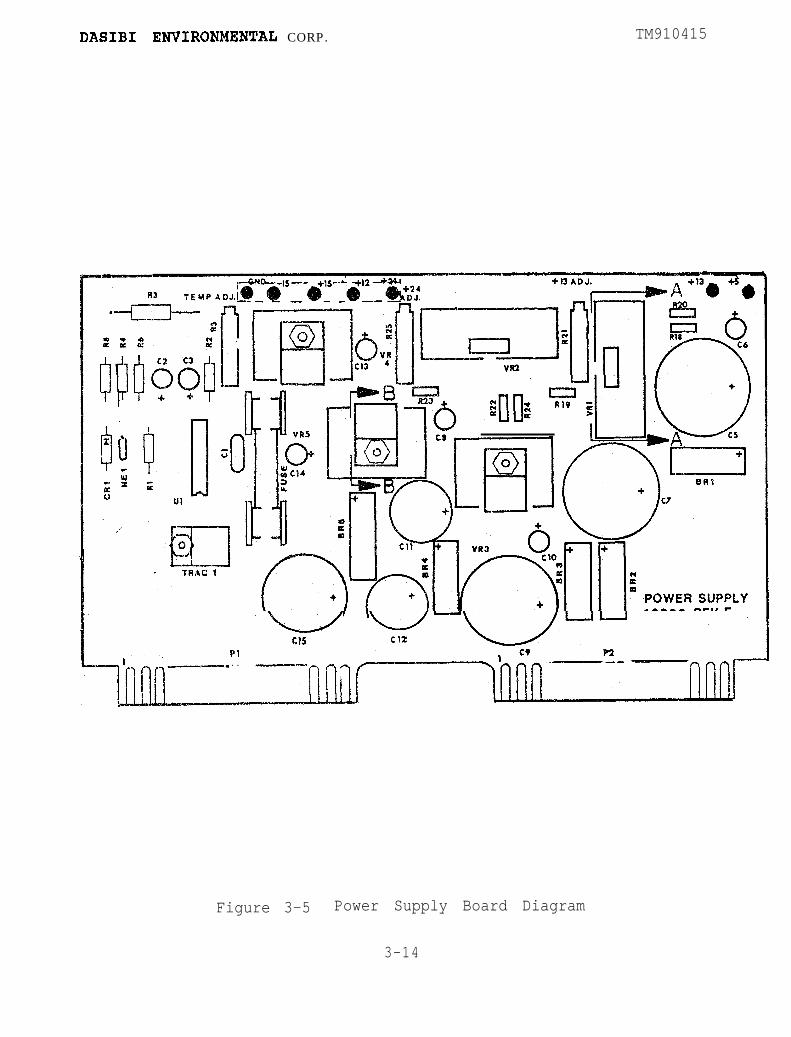
3.4.1 Main Power Supply Board (Figures 3-5 and 3-6)
Regulated power supplies deliver the various DC voltages tooperate the unit. These include 515 Vdc for operational amplifiers,+5 Vdc for digital functions and +24 Vdc for solenoid valves. The+13 Vdc is used as an I.R. source supply. The optical chambertemperature regulation circuit is also on this board.
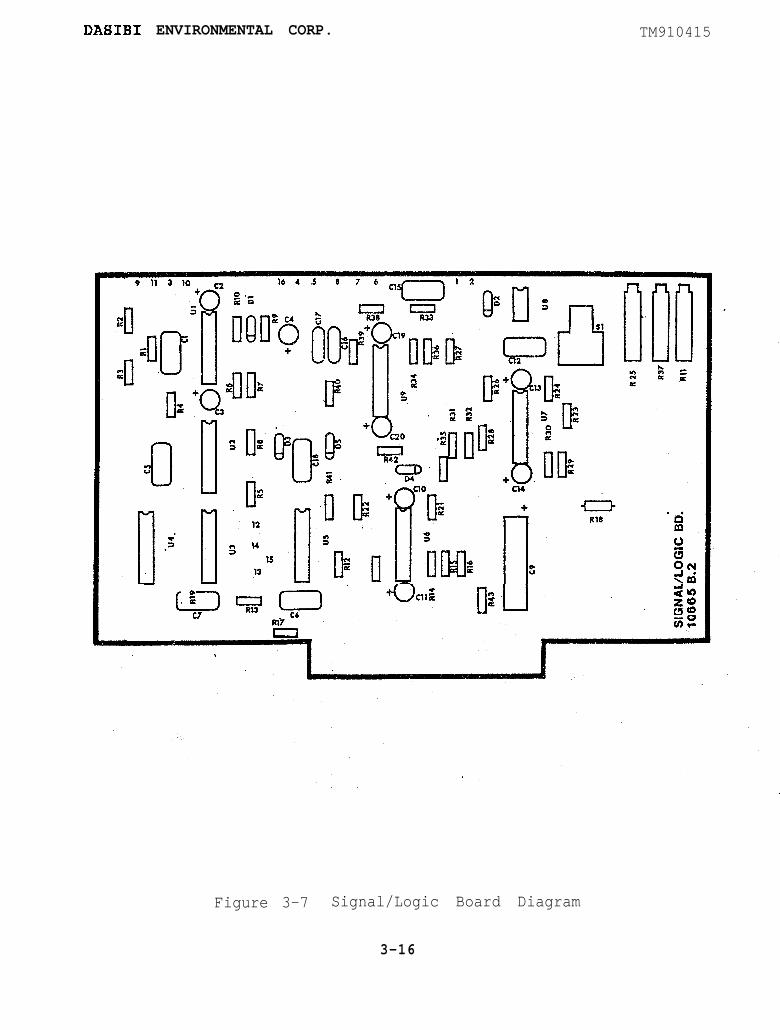
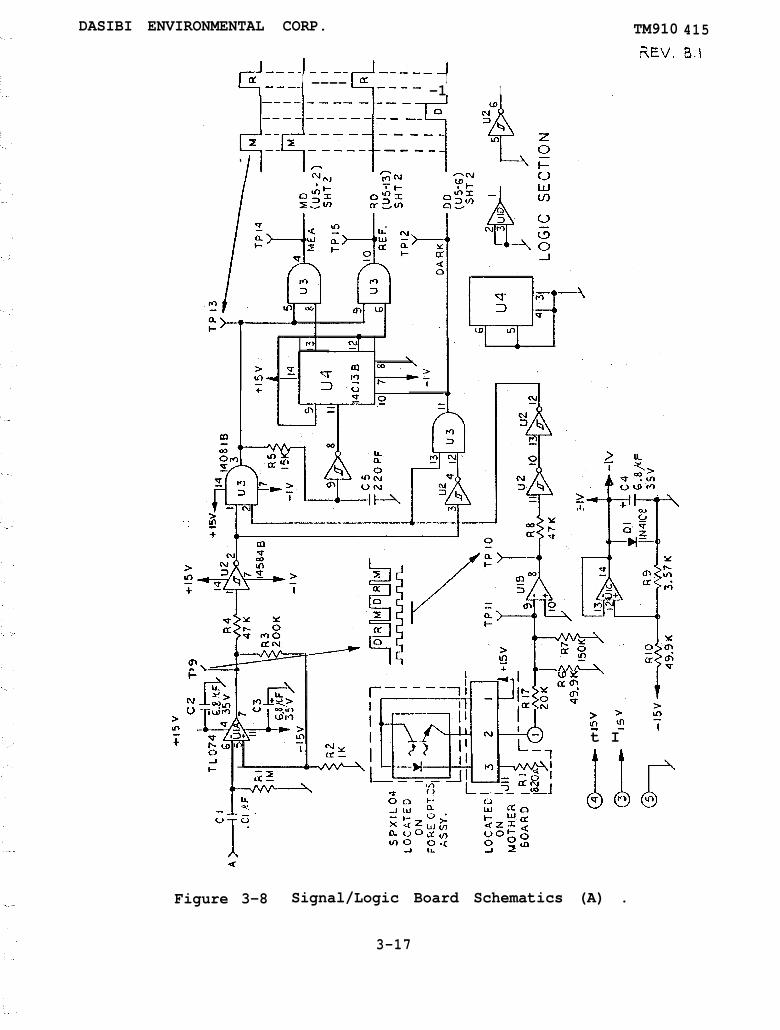
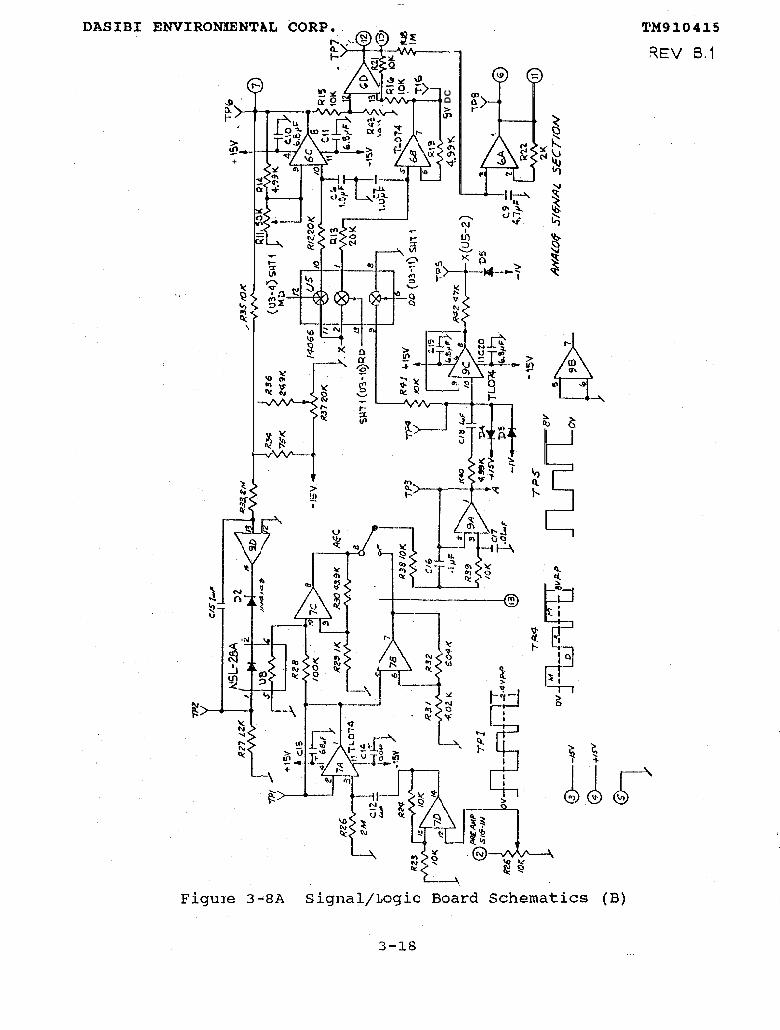
3.4.2 Signal/Logic Board (Figures 3-7, 3-8 and 3-8A)
The series of pulses from the detector is amplified andsampled to produce two DC levels by means of sample and holdcircuits. These two DC levels are with respect to the dark level(taken as zero) and the net output is a lowpass filtered DC signalproportional to the difference between the measure and referencesignals.
In order to sample the measure, reference and dark levels atthe proper time, synchronizing signals are derived from a photocellwhich senses slots in the slotted disc. In conjunction with asignal board, the logic board sorts out the times of the Measure,Reference and Dark signals and provides sampling gates on three
-separate
3.4.3
Allrelatingsensors,properlyfilters.
lines at optimum times for the signal.
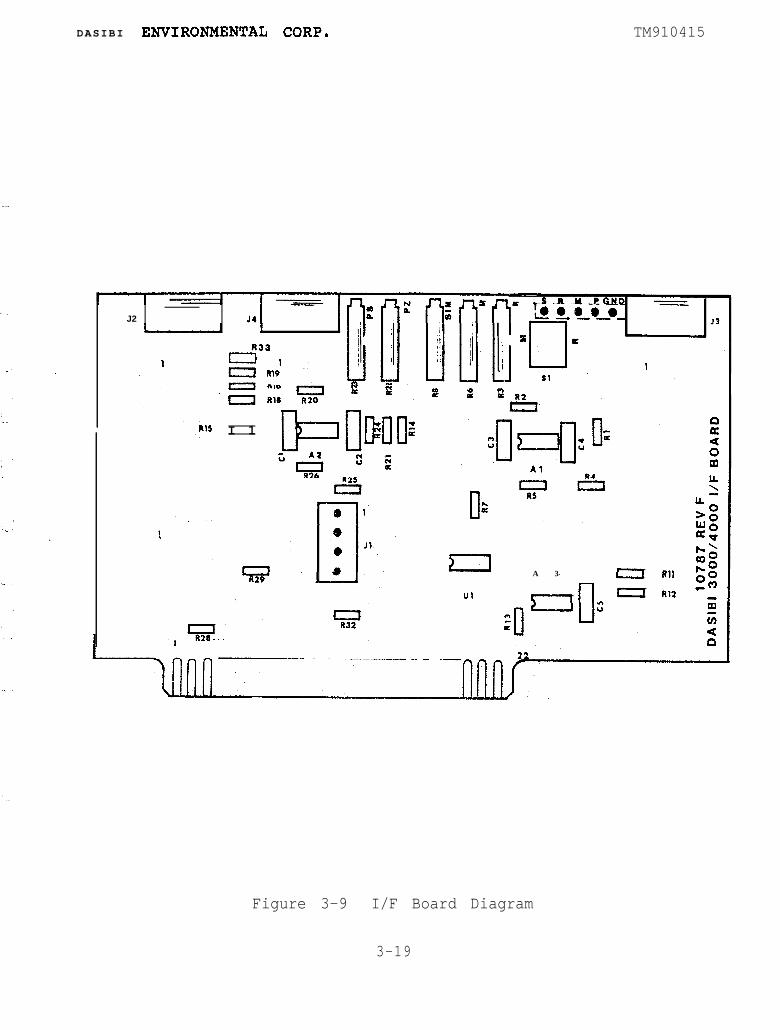
I/F Board (Figures 3-9 and 3-10)
analog signals developed within the monitor, whetherto CO concentration, or from temperature and pressureetc. must be interfaced into the computer system inscaled units and in some cases signal conditioned by
Also, command signals from the computer which aresupplied to activate solenoid valves, calibrate recorders and dataacquisition systems, etc. must be coupled outside the computerenvironment by appropriate interfacing.
All of these tasks are undertaken by the I/F Board, which bothreceives and transmits information to the computer boards overseparate lines for each function. These signals are physicallytransferred by means of ribbon cables which connect multi-pinconnectors on the tops of the appropriate PC boards. In-going andoutgoing signals from the computer, enter at the top of the I/FBoard, generally receive some signal manipulation and are routed toappropriate destinations within the instrument through the boardsocket and mother board distribution.
In addition, the IJF board contains a signal simulator whichallows the entire electronic system to be tested independently ofthe optical bench.
CAUTION
Switches Sl and 52 on the I/F Boardmust be in the m position for theanalyzer to perform its normal,intended function.
3-4
DASIBI ENVIRONMENTAL CORP. TM910415
\ --
3.4.4 Pressure Transducer Amplifier
The pressure is monitored by a pressure transducer located atthe input gas stream of the flow meter. The circuit amplifying theoutput of the pressure transducer is located on the I/F Board.
The pressure transducer is used to measure the absolutepressure in the gas stream, and also to indicate flow interruptiondue to pump failure or other pneumatic problems. It iselectrically connected to the I/F Board by means of a ribbon cableand plug. Its signal is amplified by dual op-amp A2, the firstsection of which is the pressure transducer's zero offsetcompensator, PZ, and the second section is the pressuretransducer% span adjustment, PS. The zero adjustment must be madewith the pump connected to the input of the pressure transducer.The span adjustment, PS, is set to make the pressure agree with a
, laboratory barometer while the transducer is exposed to theatmosphere.
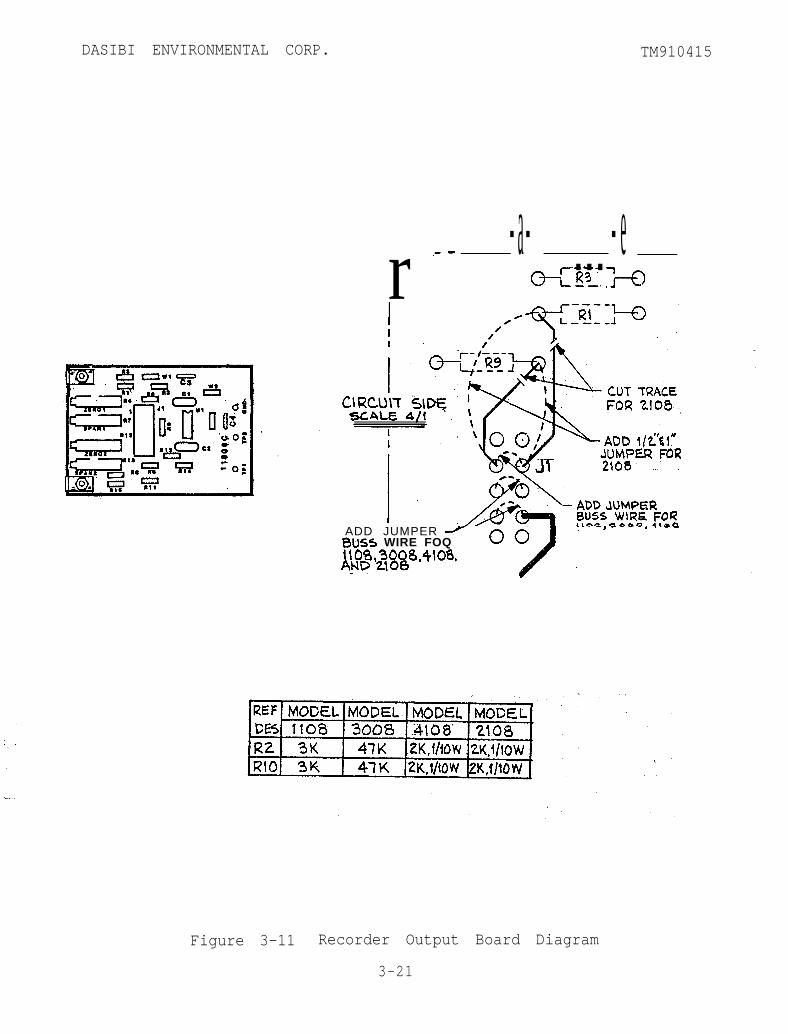
3.4.5 Recorder Output Control Board (Figures 3-11 and 3-12)
Two analog output signals are provided, each with its own zeroand span adjustment. This signal is adjustable from 0 to 10 voltsfull scale (or anywhere in-between). The scaling and zeroadjustments can be made from the front panel using trimpotsaccessible through holes. The output signal is available from aterminal strip at the back of the analyzer. This signal isprovided to operate recorders and data acquisition systems.
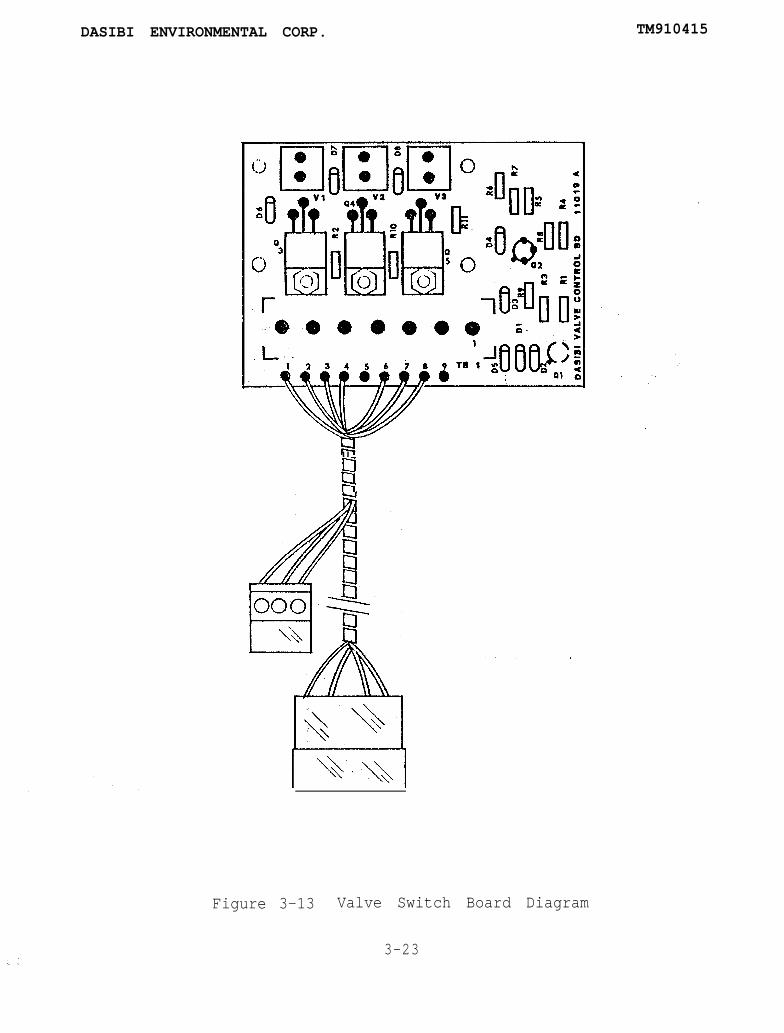
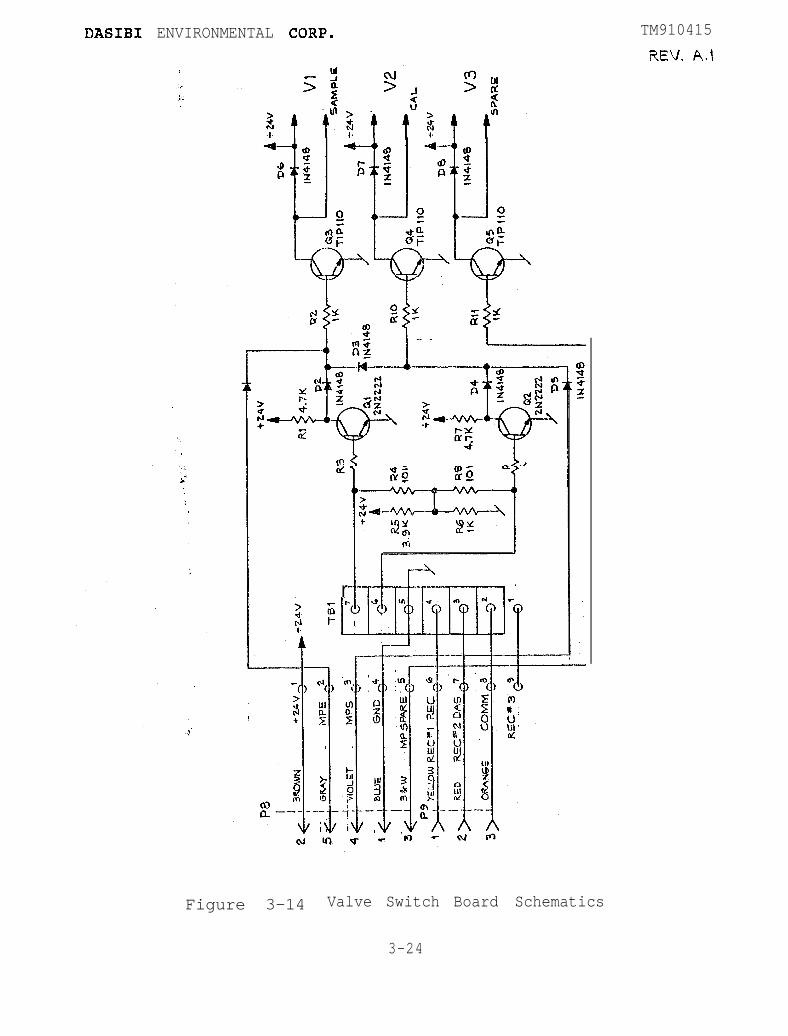
3.4.6 Valve Switch Board (Figures 3-13 and 3-14)
The solenoid valves are used in programmed modes such as inthe **Start-up Program" and the "Auto-Cal Program," and as such areunder the direction of the internal computer. The latter issuescommands to the I/F Board which relays them via the Mother Board tothe Valve Switch Board. This board has the capability to receivelogic signals and to convert them to 24 volt drive signals to powerthe solenoid valves independently of each other for use with thegas cylinders. The Valve Switch Board is located on the back paneland contains terminals so that the valves can be remotelycontrolled.
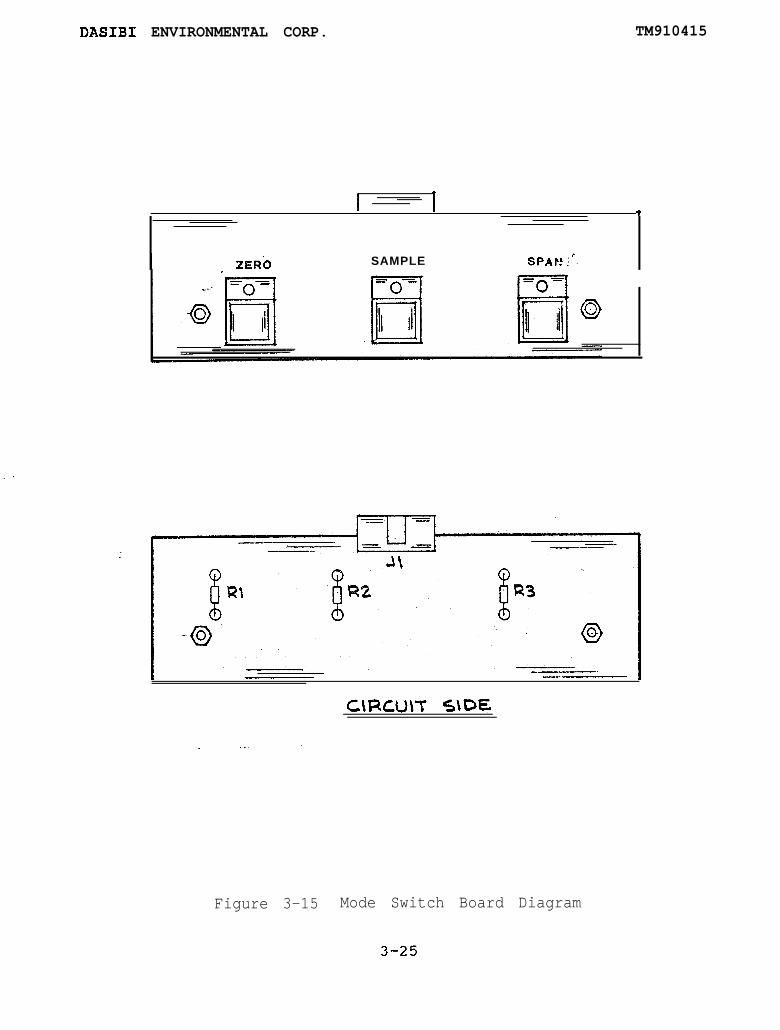
3.4.7 Mode Switch Board (Figure 3-15)
The three blue push button switches on the front panel controlthe gas sampling modes: SAMPLE, ZERO and SPAN. They are mounted ona printed circuit board which receives computer commands that lightappropriate LED% and also provides user directed input to thecomputer. This is the 11keypad11 of the instrument, and although itonly has three buttons, the sequence in which these buttons arepressed allows a variety of user options. For example, a detailedsequence of instrument diagnostics can be called-up by pressing theZERO and SPAN buttons simultaneously.
- 3-5

DASIBI ENVIRONMENTAL CORP. TM910415
3.4.8 Alphanumeric Display Board
The alphanumeric display board on the front panel contains anentire, separate microprocessor system which accepts information inASCII code and.displays messages in a maximum of 20 digits. Alldisplayed information is updated once each second.
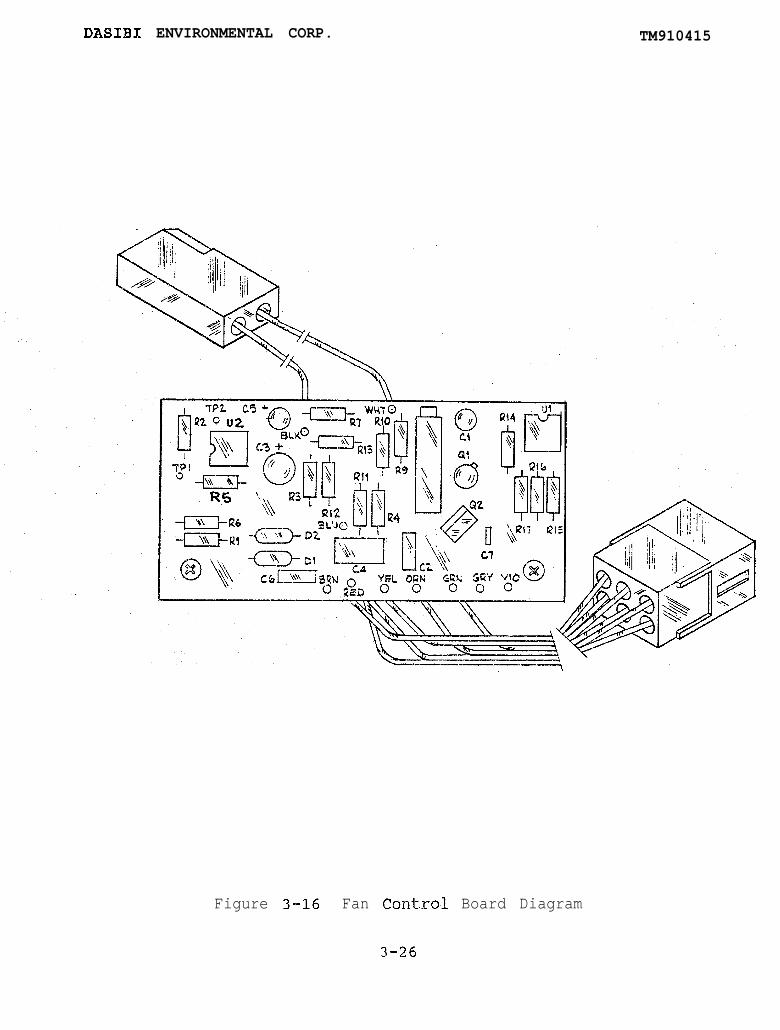
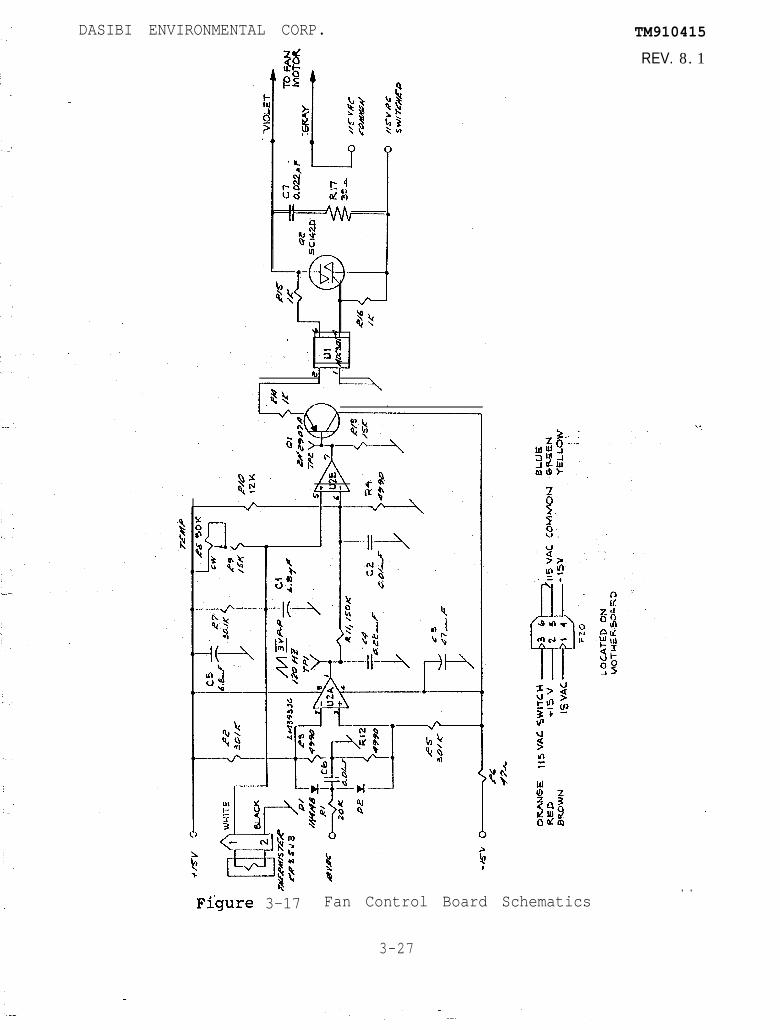
3.4.9 Fan Temperature Control Circuit (Figures 3-16 and 3-17)
The internal temperature of the analyzer is regulated at 44'C22% by a modulated fan controller which admits more outsidecooling air as the internal temperature increases, In addition, acontrolled heater in the wheel compartment maintains thetemperature between 43.5 and 44.5%.
3.4.10 DIAG (Diagnostic) Thumbwheel Switch (Figure 3-3)
The DIAG thumbwheel switch allows the user to call up precisemeasurements and information on the alphanumeric display board thatwill enable assessment of the performance of the components andsystems in the analyzer. In addition, the switch is useful in thecalibration of external read-out devices, by supplying accuratecalibration voltages. The switch settings are shown in Table 3-1.
TABLE 3-lDIAG Thumbwheel Switch Settings
DIAG # Information Displayed
0 Normal operating position. The front paneldisplays CO concentration in PPM.
1 The front panel display the Zero Signal in mV.
2 Gas temperature in OC is displayed.r3 Gak Pressure in mm Hg is displayed.
4 The gas law correction factor is displayed.
5 The measure and reference voltages are displayedin mV.
6 Wheel temperature in *C is displayed.
7 Not in use.
8 Chart recorder calibration signals arealternated in conjunction with use of the AUTOthumbwheel.
9 Not in use.
* 3-6
DASIBI ENVIRONMENTAL CORP. TM910415
These parameters are normally read-out only on the display,and are not presented to the recorder or data acquisition systemoutput. It is possible, however, to display the parameters onanalog readout devices by closing position 8 on the CPU dipswitch.
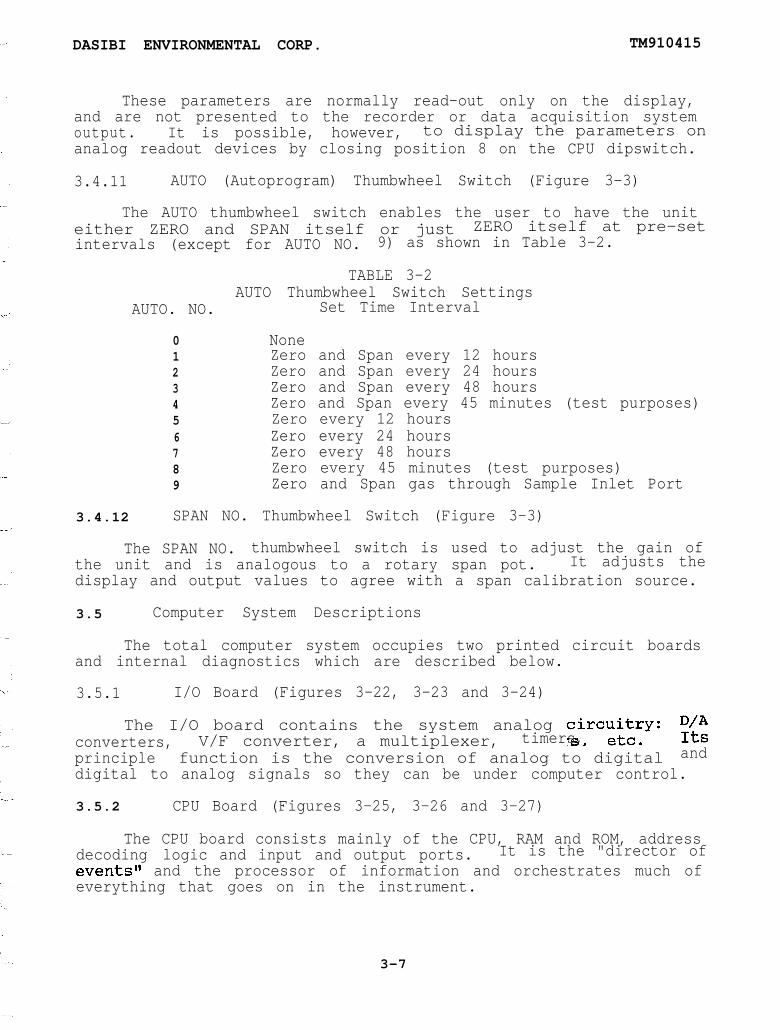
3.4.11 AUTO (Autoprogram) Thumbwheel Switch (Figure 3-3)
The AUTO thumbwheel switch enables the user to have the uniteither ZERO and SPAN itself or just ZERO itself at pre-setintervals (except for AUTO NO. 9) as shown in Table 3-2.
TABLE 3-2AUTO Thumbwheel Switch Settings
AUTO. NO. Set Time Interval
0123456789
NoneZero and Span every 12 hoursZero and Span every 24 hoursZero and Span every 48 hoursZero and Span every 45 minutes (test purposes)Zero every 12 hoursZero every 24 hoursZero every 48 hoursZero every 45 minutes (test purposes)Zero and Span gas through Sample Inlet Port
3.4.12 SPAN NO. Thumbwheel Switch (Figure 3-3)
The SPAN NO. thumbwheel switch is used to adjust the gain ofthe unit and is analogous to a rotary span pot. It adjusts thedisplay and output values to agree with a span calibration source.
3.5 Computer System Descriptions
The total computer system occupies two printed circuit boardsand internal diagnostics which are described below.
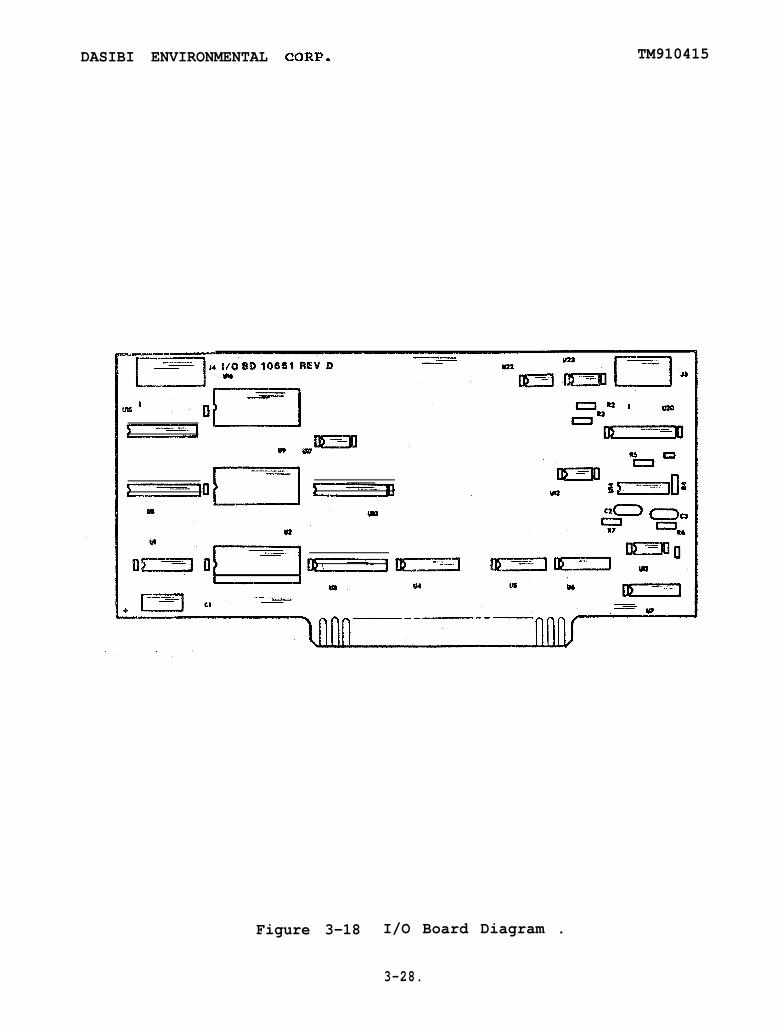
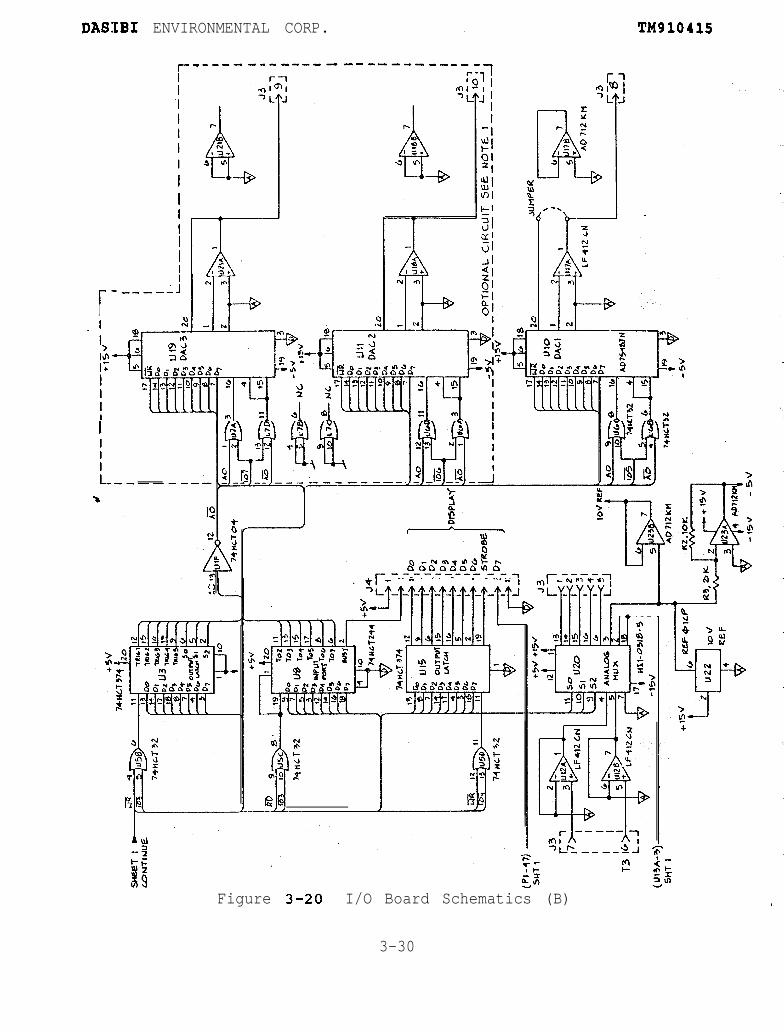
3.5.1 I/O Board (Figures 3-22, 3-23 and 3-24)
The I/O board contains the system analog circ;pcry: WAconverters, V/F converter, a multiplexer, timers,principle function is the conversion of analog to digital
Itsand
digital to analog signals so they can be under computer control.
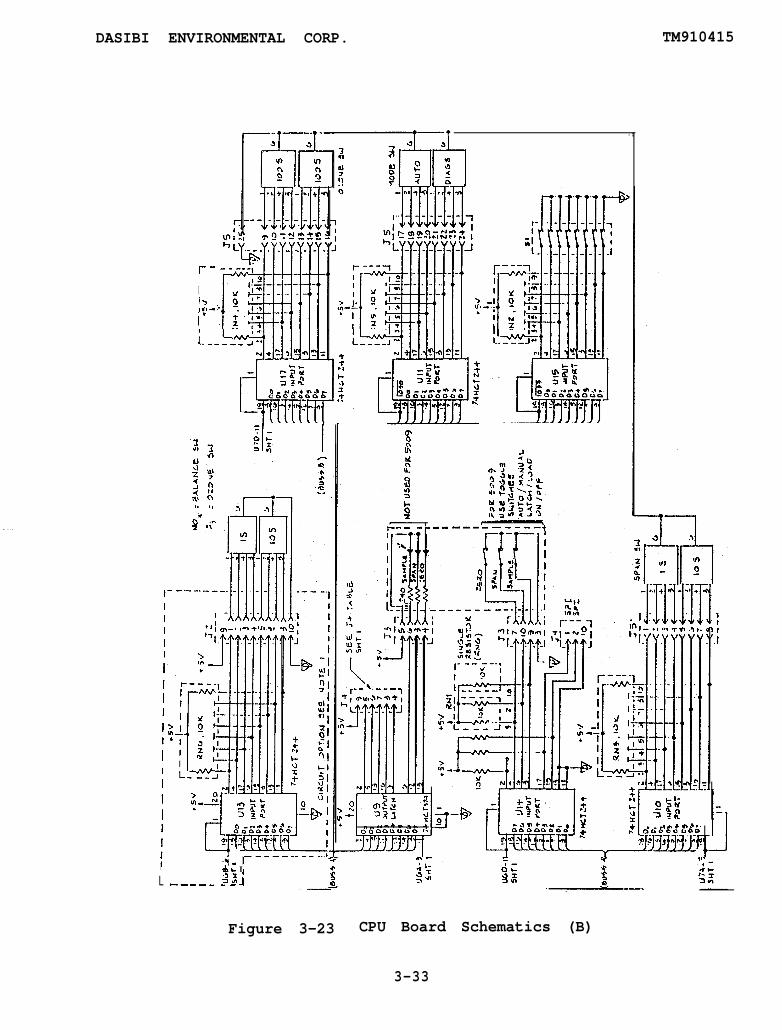
3.5.2 CPU Board (Figures 3-25, 3-26 and 3-27)
The CPU board consists mainly of the CPU, RAM and ROM, addressdecoding logic and input and output ports. It is the "director ofevents" and the processor of information and orchestrates much ofeverything that goes on in the instrument.
3-7
DASIBI ENVIRONMENTAL CORP. TM910415
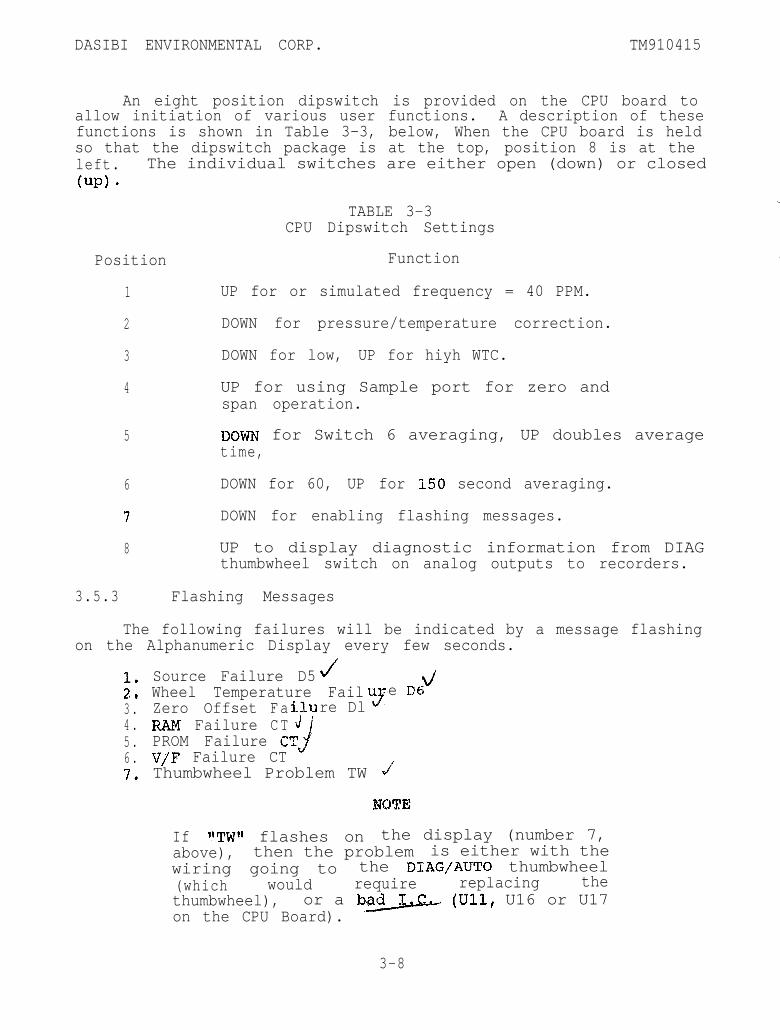
An eight position dipswitch is provided on the CPU board toallow initiation of various user functions. A description of thesefunctions is shown in Table 3-3, below, When the CPU board is heldso that the dipswitch package is at the top, position 8 is at theleft. The individual switches are either open (down) or closed(up)*
TABLE 3-3CPU Dipswitch Settings
Position Function
1 UP for or simulated frequency = 40 PPM.
2 DOWN for pressure/temperature correction.
3 DOWN for low, UP for hiyh WTC.
4 UP for using Sample port for zero andspan operation.
5 DOWN for Switch 6 averaging, UP doubles averagetime,
6 DOWN for 60, UP for 150 second averaging.
7 DOWN for enabling flashing messages.
8 UP to display diagnostic information from DIAGthumbwheel switch on analog outputs to recorders.
3.5.3 Flashing Messages
The following failures will be indicated by a message flashingon the Alphanumeric Display every few seconds.
1.
3d .
3 .4 .5 .6 .7.
Source Failure D5 J dWheel Temperature Fail e DC-;Zero Offset Fa re DlRAM Failure CTPROM Failure cV/F Failure CTThumbwheel Problem TW J'
If IrTW1l flashes on the display (number 7,above), then the problem is either with thewiring going to the DIAG/AUTO thumbwheel(which would require replacing thethumbwheel), or a ba+G2 (Ull, U16 or U17on the CPU Board).
3-8
DASIBI ENVIRONMENTAL CORP. TM910415
3.5.4 Computer Diagnostics
Introubleshootingthe analyzer, the diagnostics are generallythe fastest and easiest way to determine a problem area. Thediagnostics are displayed by setting the DIAG thumbwheel on numbers0 through 8. In addition, the diagnostics can be displayed on astrip chart recorder 'or dat-a acquisi em by changing theposition of dipswitch 8 on the CPU Board (down to up). See Section3.4.10 for a listing of the diagnostics available and thethumbwheel setting for each.
3-9
DASIBI ENVIRONMENTAL CORP. TM910415
BACK PANEL
SPANIN -
IBPRNVENTOUT -
--
_“. *I ---.-----. . ” ----..1-.-.̂.I ”
PRESSWRiETRANSDUCER
1. 8PAN QA8 (4006OPPM) REQWLATORbET A t lo-POP810.
2. VALVE8 UNDER COMPUTER CONTROL.
Figure 3-1 Flow Diagram
3-10

DASIBI ENVIRONMENTAL CORP. TM910415
Figure 3-2 Optics Bench Assembly
3-11

DASIBI ENVIRONMENTAL CORP.
S P A N N O . .,lHUMBWHEEL
ALPHANUMEAIC
AUTO DlAGTHUMBWHEEL
4BPAN MODE
RECORDER AtID Qp;SZERO AND WAM
ADJUBTMEWB8
Figure 3-3 Front Panel Diagram
3-12
DASIBI ENVIRONMENTAL CORP. TM910415
1 PRINTED CIRCUIT BOARDS I
PELflEA Ct.R.POWER
- SUPPLY+6V
DETECTOR MODULE‘
Y D R M
4
SYNCPOSLTlON
SE.NSEPSD
Z-80 STANDARD BUS COMPUTERCPU BOARD
l/O BOARD
l/F BOARD
1, 8V D C SIGNALS
A I
7V SIGNALS
SIGNAL BOARD
w100
SPAN NO.
b RECORDER
OUTPUT
j CONDITIONER
HEATER I I-,-* e,,ss.v I I VALVE I I I I ‘ANALOQ I
W H E E L c . 1 R-i&&R 1
DATA
ACQUlSlTiON
SYSTEM
I II 1 I I
Figure 3-4 Functional Electronics Diagram
3-13
DASIBI ENVXRlONMENTAL CORP. TM910415
-L-J --w--ClS Cl2
Pl. _-. e . . --14
Figure 3-5 Power Supply Board Diagram
3-14

TM910415DASIBI ENVIRONMENTAL CORP.
5
we-
c--s. .--a
!p-- P+-41i
Lf
o-a
r-0
8,six3
41 0 II
-a---..----*--..-- ---1--
-----e-----.--------;
. Figure 3-6 Power Supply Board Schematics
3-15
DASIBI ENVIRONMENTAL CORP. TM910415
()lI(--)2
c7 C4
Figure 3-7 Signal/Logic Board Diagram
3-16
DASIBI ENVIRONMENTAL CORP. TM910SW,
4156.1
J----I----I-----Jla I la I--a- -----l 1 1---- -1 I-- --. ----
t 3----tfl~
(v0 > r+In m- ->
u-lT: t I
bb,rP v-l u- t-1
tJ.
“:,-’
v-l-0
Figure 3-8 Signal/Logic Board Schematics (A) .
3-17
INS
L-Zf
?aA
+ 6
V7Pb
Rt7
LZ
KI
-f
\Y
-
11
911.
SOK
RtA
1
Rtf
Y4:
<9-K
bV D
Cc
I
DASIBI ENVIRONW~NTAL CORP. TM910415
J2
I 1
Ul
A 3 Rll
Figure 3-9 I/F Board Diagram
3-19

TM910415DASIBI ENVIRONMENTAX, CORP.
Figure 3-10 I/F Board Schematics
3-20
DASIBI ENVIRONMENTAL CORP. TM910415
r.- - -a- -e(p-CE' -jj---
ADD JUMPERBUSS WIRE FOQt100,3008,4108,AFD 2100
Figure 3-11 Recorder Output Board Diagram
3-21

DASIBI ENVIRONMENTAL CORP. TM910415R E V E
I11
--- -I U.9
I ---- ION10
L,9REX-2OUT PU+
Figure 3-12 Recorder Output Board Schematics
3 - 2 2
DASIBI ENVIRONMENTAL CORP. TM910415
UclR
Figure 3-13 Valve Switch Board Diagram
3-23
DASIBlf ENVIRONMENTAL CQRP. TM910415WV. Ad
r
Figure 3-14 Valve Switch Board Schematics -
3-24
DASIBI ENVIRONMENTAL CORP. TM910415
I I f
SAMPLE SPA&! ::.
Figure 3-15 Mode Switch Board Diagram
DASIBI ENVIRONMENTAL CORP. TM910415
Figure 3-16 Fan Conlcrol Board Diagram
3-26
DASIBI ENVIRONMENTAL CORP. TM910415
REV. 8.1
. .i Figure 3-17 Fan Control Board Schematics
3-27
DASIBI ENVIRONMENTAL CORP. TM910415
Figure 3-18 I/O Board Diagram .
3-28.

J3
TA
6LE
s33500
-1
.W
M
EA
S.
b74
HL-f
I38
vY
a
&D
tiT-
INLI
E
0t-J
S
HE
ET
2
-2
.co
RE
r=.
-3
:w
fK
Es5
.
-4co
TEM
P.
~-5
. c+i
AH
~16~
P
-0-
-7
A
I
W
:Lli?
o-2
,w)
SHT
2
DASIBI ENVIRONMENTAL CORP.
r-I
I
C.
kM910415
Figure 3-20 I/O Board Schematics (B) *
3-30

DASIBI ENVIRONMENTAL CORP. TM910415
CO/SO* C P U BOARD 10660 c I’IInn0 I ’
iI* .
@-
rLo
a0
I . s!I11a 3
1I I I: PC aI’ aI
sI
L
Ea
5 aI/0
t+
Figure 3-21 CPU Board Diagram
3-31
-

TM910415DASIBI ENVIRONMENTAL CORP.
- 1
r-
I1,,7,-B:I‘
68Irl
:
i
l-s
e-- -----me I .---m-w--,
i *? - I
Lmr- IGJ--m-w - -
Figure 3-23 CPU Board Schematics (B)
3-33
--

DASIBI ENVIRONMENTAL CORP. TM910415
Figure 3-24 Mother Board Diagram
3-34
DASIBI ENVIRONMENTAL CORP. TM910415
LoOUR~I6ULAToR
+ WI J%-I REC-tJ9-2 -C-z
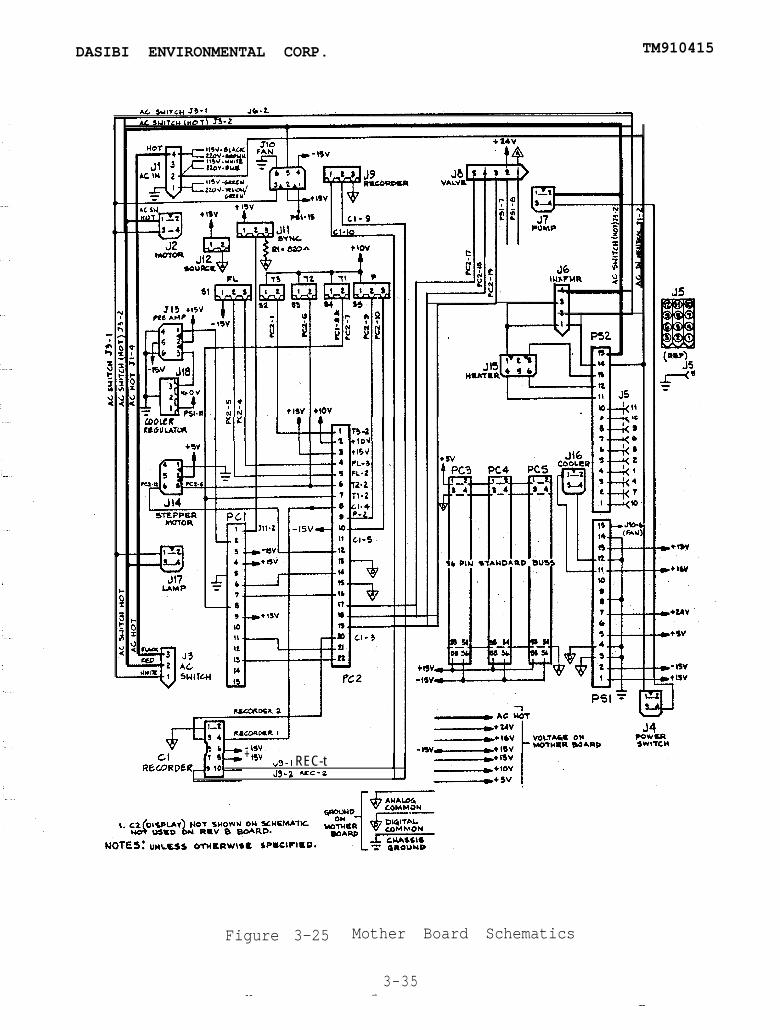
Figure 3-25 Mother Board Schematics
3-35---
DASIBI ENVIRONMENTAL CORP. TM910415
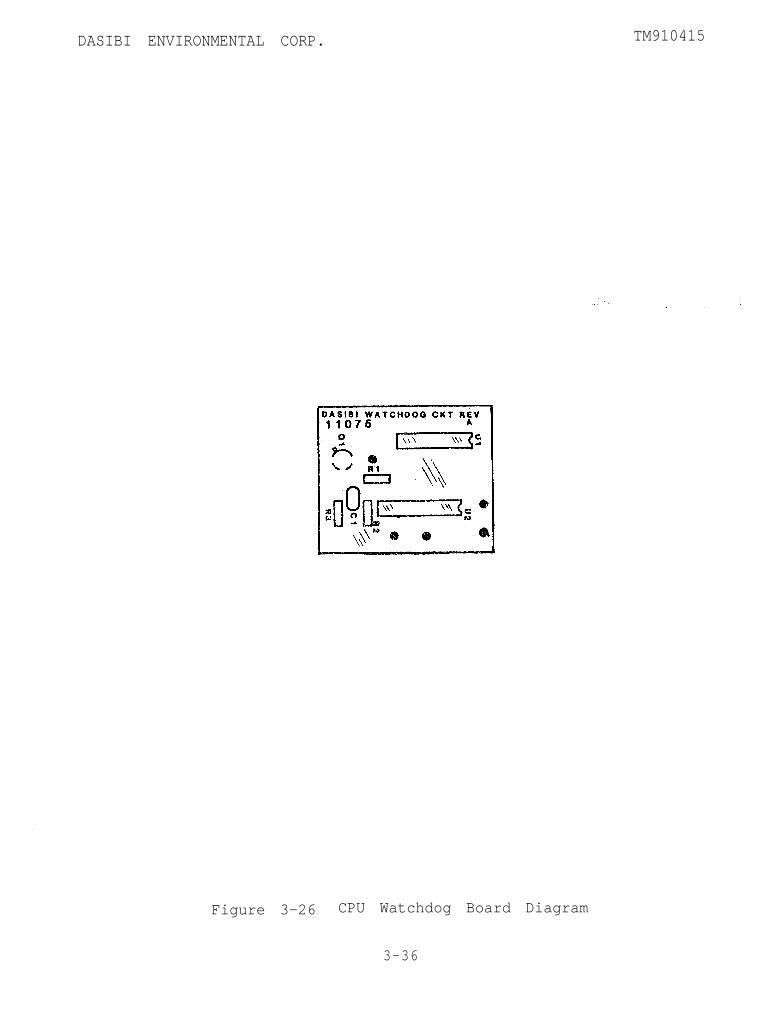
Figure 3-26 CPU Watchdog Board Diagram
3-36

DASIBI ENVIRONMENTAL CORP.
IO20Y
tsv +5v
’ 7J
74 HCTOOI
.
__I_-
TM910415
UZM C
145218
PB RESET
Y
CND
J
Figure 3-27 CPU Watchdog Board Schematics
3 - 3 7
-
DASIBI ENVIRONMENTAL CQRP, TP'BlQ4l.5
Figure 3-28 Detector Module Diagram
3-38
DASIBI ENVIRONMENTAL CORP. TM910415
Figure 3-29 Detector Pre-Amp Schematiics
3-39
DASPBI ENVIRONMENTAL CORP. TM910415
Figure 3-30 Cooler Regulator Diagram
3-40
I i
1
IW I W P
PO
WE
R
I)S
UP
PL
Y1
RE
D DE
TE
CE
EN
TO
R
BL
AC
K

DASIBI ENVIRON-MENTAL CORP. TM910415
tted disk
r----lM O T O R
Optlcel Beam’,- - -
Front View
MULTIPASS OPTlCAi ABSORPTION CHAMBER I
.P .
DETECTlON MODULEI
b&m out:
Figure 3-32 Optics Chamber
3-42

DASIBI ENVIRONMENTAL CORP. TM910415
tct
It
II
C( f
C
S O i
i-i
/// I2
Figure 3-33 RS232 Board (Optional) Diagram
3-43
----_ -- -
DASIBI ENJ~IRONMENTAL CORP. TM910415
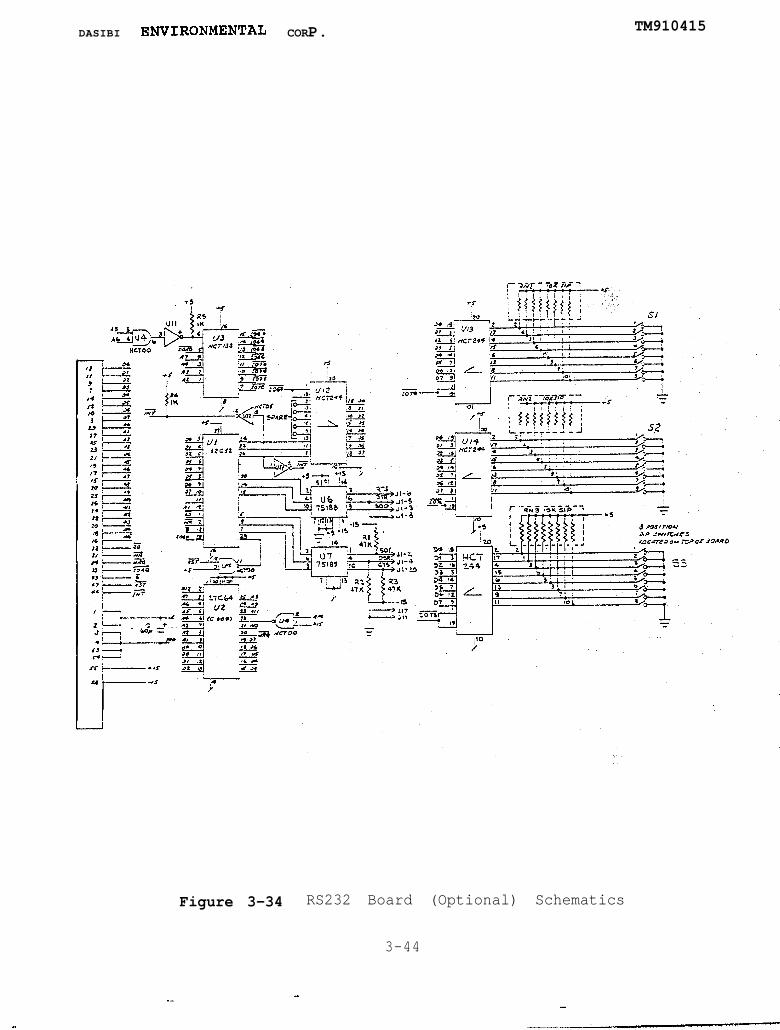
Figure 3-34 RS232 Board (Optional) Schematics
3-44
---- --
__
%I r- a 5 W 1 W ul W 0 0 00
/-
OPT
KS
BEN
CH
,/
,
LY

DASIBI ENVIRONMENTAL CORP. TM910415
4.0 PRINCIPLES OF OPERATION
4.1 General
This section provides descriptions of the operating principlesemployed by Dasibi 3008 Carbon Monoxide Analyzers.
4.2 Theory of Operation
The Dasibi Model 3008 Carbon Monoxide Analyzer is a Non-dispersive Infrared (NDIR) Analyzer of advanced state-of-the-artdesign. Being a photometric device, it operates on the principlethat the pollutant CO, absorbs light at specific wavelengths andwill decrease the intensity of a probing light beam in non-linearproportion to its concentration.
The source of wavelength specific light referred to above, isthe primary device that determines the specificity of an analyzerto the pollutant it must measure. Dasibi carbon monoxide analyzersemploy the technique of Gas Filter Correlation (GFC). In thistechnique, a highly specific light probe, is created by causing abeam of infra-red light of narrow spectral bandwidth to beintercepted by a rotating wheel containing two different entrappedgases; carbon monoxide and nitrogen.
When the light beam is intercepted by the carbon monoxideportion of the wheel, the carbon monoxide, which is at relativelyhigh concentration, absorbs all wavelengths that are CO-specific,creating an emanating light beam that is VI0 blind? ThislVoptically scrubbedfl portion of the beam is designated theReference beam, as compared to the nitrogen-intercepted portion ofthe beam which is *'CO sensitive" and therefore, is designated theMeasure beam.
The single, time-shared Reference (R) and Measure (M) beam isreflected many times back and forth across the photometer chamberwhere more of its light energy is absorbed by sampled CO with eachtraversal (See Figure 4-l). In the absence of CO no attenuation ofthe R and M port,ion of the beam will occur. Gaseous species otherthan CO will cause an equal attenuation of both R and M portions ofthe beam. If CO is present in the air being sampled, then the beamportion generated by the CO side of the wheel will experience noattenuation, but the beam portion generated by the N2 portion ofthe wheel will be attenuated to the degree dictated by the level ofCO concentration.
A third portion of the time-shared beam is also produced.This is the "dark portion", which is simply the period of time inthe rotation of the GFC wheel in which the light beam is totallyblocked off or "dark? This provides a zero light reference pointto compensate for the "dark current" of the detector.
The rotation of the motor shaft determines the timing of theoptical events taking place in the optical bench. In order for themeasurement information to be synchronously decoded by theelectronic system, the latter must be coordinated time-wise withthe wheel rotation. This is done by a slotted disk mounted on the
4-1

DASIBI ENVIRQNMENTAL CORP. TM910415
motor shaft, which interrupts an optical switch. The latterprovides a signal to digital logic which then encodes'the time-shared electronic analog signal of the optical probing beam.
The unit's computer records the imbalance between the R and Mbeams portions, performs a data linearization, corrects for changesin temperature and pressure, and displays the CO content.
4.3 Temperature/Pressure Correction
When a gas is confined to a fixed volume as is the case of aphotometric analyzer such as the Model 3008, and the pressure andtemperature of the gas in the chamber is free to vary with theexternal atmosphere, the readout concentration of pollutant will beinfluenced by the variation of these parameters
The 3008 is able, by means of its built-in computer andappropriate transducers, to correct for the variation oftemperature and pressure, and to present a concentration reading ofCO under standard conditions. The standard conditions set by theEPA for air monitoring are 25 degrees Celsius for temperature and760 Torr for pressure. The equation used for correcting observedreadings of the Model 3008 to be corrected readings is known as theGAS LAW. It can be expressed as follows:
CO (Correct) = CO (Observed) X PO/P1 X T1/TO*
where, po = The standard pressure of 760 TorrPl = The actual pressure in the measurement chamber
when a reading is being taken.T1 = The actual temperature* in the measurement
chamber when a reading is being taken.TO = The standard temperature* of 25O + 273O or 298O
Kelvin.
*All temperature readings must be converted to ABSOLUTEtemperature (Kelvin) by adding 273 to the normal Celsiusreading.
In the Model 3008, the computer automatically corrects eachreading taken by performing a calculation according to the aboveequation. The pressure and temperature data are provided byappropriate transducers linked to the optical chamber. Thefollowing considerations apply:
1 . The source of span gas must be a certified tank in which _the concentration listed has been converted to StandardTemperature and Pressure (STP) conditions. This isstandard practice with all major gas suppliers.
2. When a span is taken, the computer will apply the Gas Lawcalculation so that the concentration readout takes intoaccount that conditions within the chamber are not at STP.It does this by letting the user adjust the display valueto equal the span tank listed value by means of the SPAN
4-2
DASIBI ENVYRONMENTAL CORP. TM910415
No. thumbwheel switch. The computer simultaneouslyrecords and places in memory the pressure and temperature,PPand TO, that existed when the span operation took
p ace. As subsequent measurements are made, the pressureand temperature Pl and Tl are continuously monitored andthe computer calculates a P/T correction factor toaccommodate any changes that have taken place since thespan operation. The correction factor, which can beaccessed on position 4 of the DIAG thumbwheel, iscontinuously applied to all concentration readings.
3. Each time a span is taken, the values for P0 and T0 areupdated.
4. If it is desired that P/T corrections are not made, thisfeature can be disabled by changing dipswitch 2 on the CPUBoard from the open to the closed position.
4.4 Flow System
The gases utilized by the analyzer are introduced into theinstrument at bulkhead fittings on the back panel. There are threedifferent gases used during various modes of analyzer operation:ambient air, zero gas and span gas. The plumbing utilized withinthe analyzer is either teflon, Bev-a-line, or stainless steel tomaintain the purity of the sample gas prior to measurement. Inaddition, teflon tubing should be used to connect the span and zerogases to the instrument to maintain their purity.
4.5 Optical System
The optical system is designed to withstand shock, vibrationand the effect of thermal gradients. All optical elements arecemented on self-aligning aluminum mounts. Since infraredradiation of 4.7 microns is monitored, all optical elementsincluding windows must either reflect or transmit radiationefficiently at this wavelength. Mirrors are precision ground andpolished and are coated with protected aluminum. Windows areeither sapphire or coated silicon.
4.6 Electronic System
The electronic system is composed of a mother board andplug-in printed circuit boards which power the photo-detector andamplify and process its signal to produce a linearized analog DCoutput which can be read on a built-in alphanumeric display or onan external analog chart recorder and/or data acquisition system.To aid repair and maintenance each module is dedicated to specificfunction.
4-3
DASIBI ENVIRONMENTAL CORP, TM910415
4.7 Computer System
The self-contained computer is a powerful 8-bit system usinga Z-80 CMOS microprocessor, 8K of RAM and 8K of ROM. It makes useof an industry standard STD bus structure. This allows forauxiliary circuit board plug-in to augment the functions of theinstrument. An RS232 Board can be provided to supply informationto microcomputers and other peripheral equipment.
Capabilities of the computer include mathematical functionssuch as computing ratios, diagnostic functions such as failureidentification, and control functions such as periodic auto-calibration sequencing.
Xn addition, there are built-in programs contained in ROM tomake the instrument "user friendly.ss An example of this is theSTART-UP program, which places the instrument in a structuredroutine each time the unit is turned on, This routine provides forrecorder and instrument calibration and also gives pertinentdiagnostic information,
4-4
DASIBI ENVIRONMENTAL CORP. TM910415
‘?d disk
Front View
Figure 4-1 Model 3008 Optical System
4-5
Itemperature
sensor

DASIBI ENVIRONMENTAL CORP.
5.0
5.1‘ General
This section contains information for the operation of thefront panel controls and indicators. Also describedon procedure and shutdown procedure.
OPERATION
TM910415
are the turn-
5.2 Controls and Indicators
The operating controls are described below. ,diagram of the front panel of the instrument Shown in Figure 3-3.
Refer to the
1.
2 .
I. 3 .
4 .
5.
6 .
7 .
8.
POWER SWITCH - This pushbutton switch turns theinstrument on and off.
RECORDER AND DAS ZERO & SPAN ADJUSTMENTS - Used foradjusting the recorder and DAS systems.
MODE SWITCH "ZERO" POSITION - Used to autozero the unitvia computer control.
MODE SWITCH "SAMPLE" POSITION - Ambient air is sampledby the instrument.
MODE SWITCH "SPAN" POSITION - Used to perform a 10percent to 90 percent upscale analyzer response check.
"AUTO" THUMBWHEEL - This thumbwheel switch automaticallysets the computer controlled zero and zero/span checkintervals.
"DIAG" THUMBWHEEL - This thumbwheel allows the user tolook at different subsystems of the instrument.
9.
FLOWMETER - The flowmeterthe pneumatic system.
NOTE
10
The flow rate must be setflow rate may cause theadversely affected.
displays the flow rate through
at 1 LPM as any change to thislinearity of the unit to be
"SPAN NO." THUMBWHEEL - This thumbwheel switch is usedto set theconventional
gain of the analyzer (it works like arotary span potentiometer).
ALPHANUMERIC DISPLAY - This display shows the digitalvalue of the CO gas concentrations and other informationrequested by user diagnostics.
5-l
5.3 Turn On
Connect the instrument as described in Section 2 and turn thepower switch on. The pump switch must also be on at this time.The AUTOSTART program as described in Section 5.6.1 will facilitateputting the total system in proper operation.
NOTE
Allow at least 60 to 90 minuteswarm-up time befsre performing apreliminary calibration (seeAppendix A) o
5.4 Turn Off
If the analyzer will not be used for an extended period oftime p‘ turning it off will.. extend the life of the 1.R. source andalloff
5 "9 .d
movinq parts.pcjsition.
To do so, simply push the power switch to the
Modes of Operation
The modes of operation of the analyzer are all under directcontrcl of the self-contained computer. Three separate programmedmodes of operation described next are available to the user.
1, An AUTOSTART program, which aids the user to place theinstrument on-line.
2, A MNGJAL mode, which is sim.iJar to conventional analogmonitors except that three pushbuttons do all the workand no dial adjustments other than a thumbwheel SPANsetting have to be made.
?w . An AUTO mode, which allows a program sequence of ZERO orZERO/SPAN operations to be performed at user selectableintervals.
The AUTOSTART program I&*C automatically initiated each time theanalyzer is powered-up, Its purpase is to assist the operator inmaking the normal adjustments and checkout tests when placing theinstrument on-line from an un-powered state. A structured protocolfor the AUTOSTART program functions has been programmed into theinstrument% computer via a PROM IC. Although there is no way theoperator can change this program, it can be bypassed simply bypressing the SAMPLE button after the analyzer has begun to zeroitself (Step 11 as described in Section 5.5.1.2), in which case theunit switches to the MANUAL mode and the user assumes immediate,direct operational control.
5-2
DASIBI ENVIRONMENTAL CORP. TM910415
5.5.1.1 Instrument Start-up Using The AUTOSTART Program
1. The AUTO thumbwheel switch should be on 0.
2 . The DIAG thumbwheel switch should be on 0.
3. Connect recorder(s) and/or data acquisition system(s) to (appropriate terminals on the rear panel. - up to twodevices can be installed. .I
5.5.1.2 The AUTOSTART Program Protocol
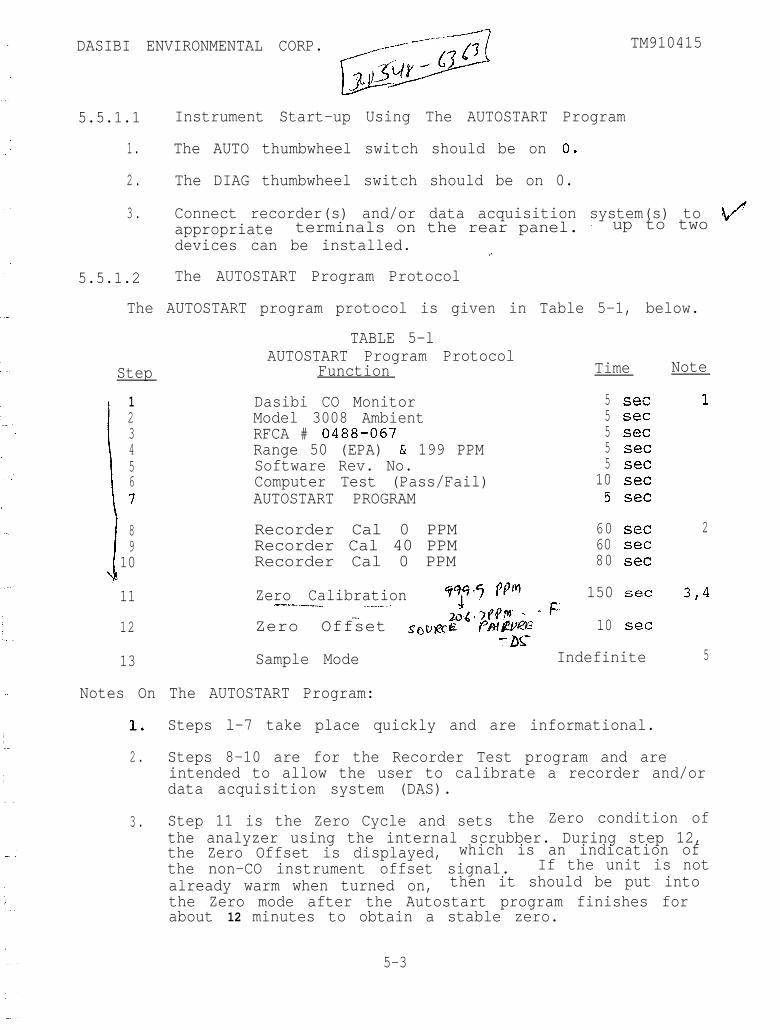
The AUTOSTART program protocol is given in Table 5-1, below.
Step
TABLE 5-lAUTOSTART Program Protocol
Function Time Note
1234567
89
10
11
12
13
Dasibi CO Monitor 5 setModel 3008 Ambient 5 setRFCA # 0488-067 5 setRange 50 (EPA) & 199 PPM 5 setSoftware Rev. No. 5 setComputer Test (Pass/Fail) 10 setAUTOSTART PROGRAM 5 set
Recorder Cal 0 PPM 60 setRecorder Cal 40 PPM 60 setRecorder Cal 0 PPM 80 set
Zero Calibration ywj PPw,JI
150 set.s.-..""--ll*l~.""~-_"i"
.".____l-"-~(J#p')QBM .- - f=
Zero Offset g(glgce I"‘dwLVQ~ 10 set-asT
Sample Mode Indefinite
1
2
314
5
Notes On The AUTOSTART Program:
1. Steps l-7 take place quickly and are informational.
2. Steps 8-10 are for the Recorder Test program and areintended to allow the user to calibrate a recorder and/ordata acquisition system (DAS).
3. Step 11 is the Zero Cycle and sets the Zero condition ofthe analyzer using the internal scrubber. During step 12,the Zero Offset is displayed, which is an indication ofthe non-CO instrument offset signal. If the unit is notalready warm when turned on, then it should be put intothe Zero mode after the Autostart program finishes forabout 12 minutes to obtain a stable zero.
5-3
DASIBI ENVIRONMENTAL CORP, TM93,04X5
4 .
5,
6.
5.5.2
TQ
MANUAL Mode
takes aboutit may takerecommendedplace, so
view CO concentrations when in this mode,the DIAGthumbwheel switch must be set--to-.& In the MANUAL .lmode, theinstrument is quite easy to use: simply ,press one of the threepushbuttons for whichever function is desired. All pushbuttonsturn on LED% mounted on them when they are activated, and eachremains activated until another pushbutton is pressed.
If the AUTO thumbwheel switch is set on an auto-cycleprogram, i,e. positions 1-9, then when the unit enters theZero Cycle, or Operation # 11, the Auto Program that isdialed will take place.
When Operation 13 or Sample Mode is achieved, theinstrument is automatically switched back to the manualmode, and the user is free to go back and check the Zero,to Span the instrument, etc.
During the time the AUTOSTART program is taking place, thesour&e resistor is waxming up, a process that8 to I.0 minutes (if the unit is already warm:up to 90 minutes if cold). Therefore, it isthat the entire process be permitted to takethat a good stable zero is achieved.
NOTE
If flashing message(s) appear duringAUTOSTART program, the operatorshould check the table of contentsfor the appropriate manualdiscussion of the flashing fault.
NOTE
The unit does not require span gasto be supplied in order to befunctional- If a calibration is notrequired, due to the instrumentserving a demonstration or testpurpose, set the Span No. thumbwheelswitch on 100. This will giveapproximate values----o%+ C* butcali beforeambi l
ZERO: When this button is pressed, a red LED will light up onthe button, an appropriate solenoid valve willactivate, and zero gas will be sampled from theinternal zero scrubber. The display will read:
“(y-J z X.X PPM" .5-4
DASIBI ENVIRONMENTAL CORP. TM910415
where the number as indicated in place of the X's willnormally descend as zero gas replaces the air in theoptical bench chamber.
SAMPLE: When the SAMPLE pushbutton is pressed, afterapproximately 1 minute, a message will flash:
YZ Offset = 10 rnV*#
(a a number as high as 60), then the display willautomatically be set to CO = 0.0 PPM, & 0.1. PPM.Gas is then sampled from the inlet port and theconcentration is instantly read out on thealphanumeric display. This process willcontinually repeat until the user presses one ofthe other mode pushbuttons.
SPAN: The SPAN pushbutton behaves much the same way as theSAMPLE button, except that it activates a pair ofII_solenoid valves so that span gas%ae sampled from atank. T-A%%& thumbwheel switch can then be usedto make the reading on the display correspond with thetank concentration.
In the MANUAL mode, all pushbuttons turn on LED% mounted onthem when they are activated, and each remains activated untilanother is pressed. If it is known that the optical chamber is.-.-..w- w----filled with zer~o.r- S, an instantaneous zero or spanadjustment can be made by pressing the SAMPL~-pu3h'bu'~~-t&n theZERO or SPAN, and then going back to the SAMPLE mode.
5.5.2.1 On-Board And External Operation
Two different methods of supplying span and other calibration" --x-x. ‘ " *qyJ-e---S~t--commijn 1s toconnect a
es from acommon manifold into the sample port at ambient pressure.especially true when a multi-point calibratian-e-being performed.If zero gas is to be sampled from the sample port, a mode of
This is caused by the fact.-,gannot.-be used when zero gas
ecause it is combined with a specific
placing dipswitzh~__4 on the CPU.w -1 ".a." 1 . ", y ,When thesis done, no solenoid
valves receive activation when mode buttons are pressed, so thatall gases sampled are received through the sample port. If themonitor is only going to be used in the manner occasionally,position 9 on the AUTO thumbwheel allows for the same results to be
5-5

DASIBI ENVIRONMENTAL CORP. TM910415
achieved. Making either of these modifications allows the user toestablish a zero reading on the display by first pressing the ZEROpushbutton, and then the SAMPLE in sequence, after sufficient zerogas from an external source has been supplied, to the monitor togive a stable reading.
In using the MANUAL mode during multipoint calibrations, allcalibration gases should enter the Sample inlet. This should bedone preferably from a common manifold, or calibration unit. 'Theuse of the front panel pushbuttons remains very much the same as innormal operation, except attention should be paid to a few points.
5.5*2.2 Using Manual Mode Controls During Multipoint Calibrations.( "j *
The AUTO thumbwheel should be set on position 9: x:',::"':
ZERO: This button should be used the same as in normal MANUALmode, except that it only has to be momentarily pressedafter sufficient zero gas has been sampled to give a stable'reading. Pressing the SAMPLE button after this has beenpressed, will cause a reading of 0.0 PPM to be displayed asconcentration.
SAMPLE: Once the analyzer has been properly challenged by a zerogas source, and the ZERO button pressed, the unit shouldbe placed in the SAMPLE mode by pushing the SAMPLE button.It should remain in this state during the entiremultipoint calibration, unless the Zero of the analyzer isdesired to be re-checked.
SPAN: This pushbutton should not be used during the multipointcalibration, The SPAN NO. thumbwheel switch, however, canbe used to make the display concentration agree with theactual concentration of a standard gas reference.
5*5.3 AUTO MODE
In the AUTO MODE, the user can select from a menu, a sequenceprogram that will permit the monitor to zero only or zero and spanitself at fixed time increments. This periodic calibrationsequence will take place with the unit unattended. If the zero andspan option is desired, a tank of span gas set op,en at anappropriate pressure of 15-20 PSIG is required. The followingoptions are available and selection is made by setting theappropriate number of the thumbwheel switch labeled AUTO.AUTO FUNCTIONS:
Switch Function ‘*Q Zero at turn-on only1 Zero and span every 3.2 hours2 Zero and span every 24 hours3 Zero and span every 48 hours4 Zero and Span every 45 mins.
5-6

DASIBI ENVIFUXWEMTAL CORP. TM910415
5 Zero every 12 hours6 Zero every 24 hours7 zero every 48 hours8 Zero every 45 mins.9 Zero/Span via Sample port
.-
The AUTO programs. that are recommended to be the mostpractical are the ones on Switch setting 5 and 6 (AUTOZERO). Thisis because the nature of a GFC Monitor such as the 3008 is that ithas a good span stability by nature of design. The zero stabilityis harder to control, and if there is likely to be drift due totemperature variation it will more likely be zero drift. Also,since an internal non-consumable scrubber is used for zero gasgeneration, no penalty is paid for operating in this mode and theuser is assured of good zero stability month after month.
The sequence of events that take place during an AUTOZERO, orAUTO ZERO/SPAN is as follows:
AUTO ZERO:
.
1. The program is engaged by setting the AUTO thumbwheel ona chosen time interval.
2. The analyzer will then enter the ZERO mode, and remainthere for 12 minutes.
3. During this time, CO-scrubbed air will be sampled fromthe internal catalytic converter for the complete 12minutes.
4. After 2 minutes, the readout will be adjusted to 0 PPM,after which it will continue sampling scrubbed air forthe remaining ten minutes.
5. At the end of the ten minutes, the microprocessor willagain set the readouts to 0 PPM, and the analyzer willbe automatically switched back to the SAMPLE mode.
6. This process will be repeated at the frequency settingselected on the AUTO thumbwheel.
AUTO ZERO/SPAN:
l-4. These steps are the same as in the AUTOZERO mode.5. At the end of 10 minutes, the readouts are set to 0
PPM, and the analyzer is automatically switched to theSPAN mode.
6. The analyzer at this point will sample span gas from anappropriately set up cylinder for 12 minutes.
7. At the end of the 12 minutes, the analyzer willautomatically set itself to the SAMPLE mode.
8. The process will repeat at intervals determined by theAUTO thumbwheel setting.
5.5.3.1 Recommended Use of The AUTO Mode
1. The user is free to decide what Auto Program best suitshis needs, and experience is the best guide.
5-7
TM91041%
2. Too frequent periodic checking of zero and span causesa loss of monitoring data and may be objectionable.
3. Periodic checks every 24 hours are quite customary andare recommended. Checks every 12 hours are a suitablealternative if tighter control of measurement accuracyis desired.
4. It is recommended that the user consider the use of theAUTOZERO mode in preference to the AUTO ZERO/SPAN mode.This is because a GFC monitor is more prone to have zerodrift as opposed to span drift. It will generally benoted, that the Span value "tracksI the zero value, Inother words, the difference in value between the zeroand span values remains constant. Also, since theinternal catalytic scrubber is used in the ZERO mode,the operation is free of the use of consumables, and theanalyzer needs very little attention*
NOTE
Position 9 on the AUTO thumbwheelwill disable the zero/span valves.This selection is useful when theoperator wants to zero and span theanalyzer via the Sample inlet,When this feature is activated, theflashing Wheoker*' sign is replacedwith a flashing lrStl meaning Sampleinlet. This feature comes in handywhen the operator wants the computerto re-set the zero value on thebasis of an external zero sourcebeing supplied to the sample inlet.Therefore, it is VERY IMPORTANT tohave a very good zero air source.
5.6 Recorder and Data Acquisition System (DAS) Connections
Many types of recorders and data acquisition systems areavailable to the Model 3008 user (including Dasibi% 8001 or 8003dataloggers). The most common recorder range is 1 volt full scale,and data collectors often are either 1 volt or 5 volt,$. In theModel 3008, provision has been made to accommodate virtually anyanalo< input device. Two identical, but independent outputs areprovified, and each can be set for any range under 10 volts by meansof front panel adjustments. Recorders generally contain their ownzero adjustment, and this is preferably used to offset the signalso readings below zero can be recorded. Some older recorders donot have a zero adjustment, so the analyzer's zero adjustment canbe used in this case,
5-8
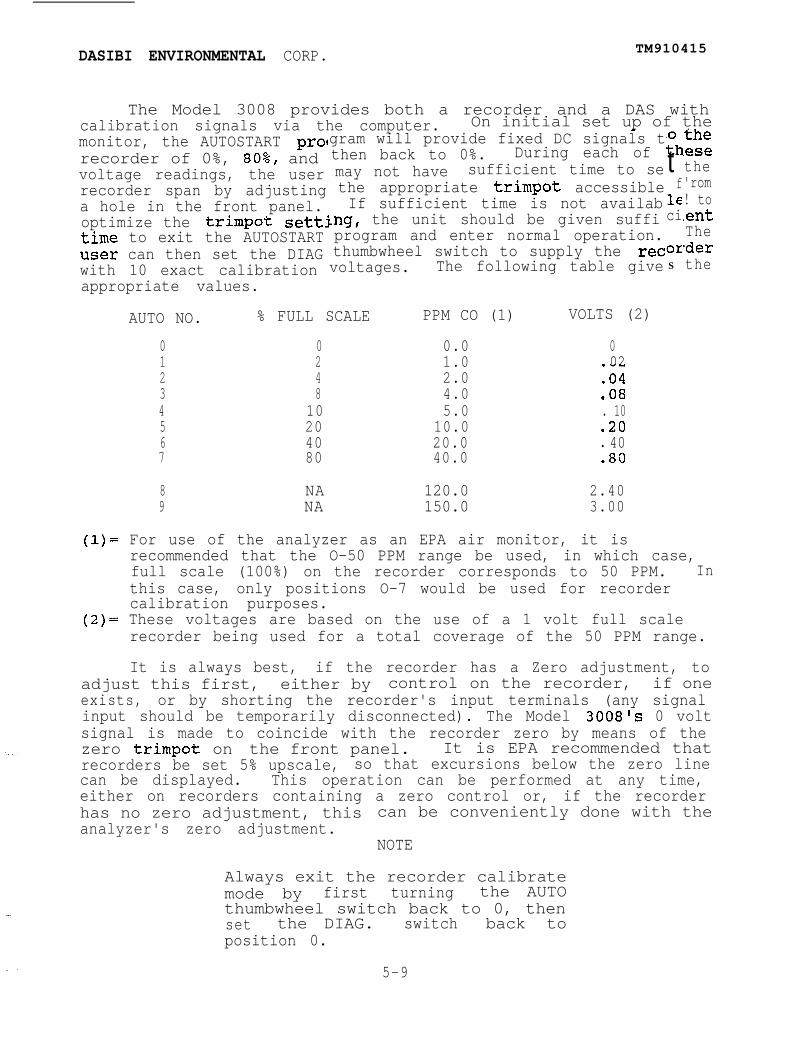
DASIBI ENVIRONMENTAL CORP. TM910415
The Model 3008 provides both a recorder and a DAS withcalibration signals via the computer. On initial set up of the- . -monitor, the AUTOSTART pro'recorder of 0%, 80%, andvoltage readings, the userrecorder span by adjustinga hole in the front panel.optimize the trimpot setti+;me to exit the AUTOSTARTb-0-L.
,,er can then set the DIAGwith 10 exact calibrationappropriate values.
W=
w=
._.
gram will provide fixed DC signals tthen back to 0%. During each ofmay not have sufficient time to sethe appropriate trimpot accessibleIf sufficient time is not availab
Lng, the unit should be given suffiprogram and enter normal operation.thumbwheel switch to supply the retvoltages. The following table give
t”htf
leci
Or
S
the.esethe'rom! to.entThebderthe
AUTO NO. % FULL SCALE PPM CO (1) VOLTS (2)
0 0 0.0 01 2 1.0 022 4 2.0 :043 8 4.0 .084 10 5.0 . 105 20 10.0 .206 40 20.0 l 407 80 40.0 .80
8 NA 120.0 2.409 NA 150.0 3.00
For use of the analyzer as an EPA air monitor, it isrecommended that the O-50 PPM range be used, in which case,full scale (100%) on the recorder corresponds to 50 PPM. Inthis case, only positions O-7 would be used for recordercalibration purposes.These voltages are based on the use of a 1 volt full scalerecorder being used for a total coverage of the 50 PPM range.
It is always best, if the recorder has a Zero adjustment, toadjust this first, either by control on the recorder, if oneexists, or by shorting the recorder's input terminals (any signalinput should be temporarily disconnected). The Model 3008's 0 voltsignal is made to coincide with the recorder zero by means of thezero trimpot on the front panel. It is EPA recommended thatrecorders be set 5% upscale, so that excursions below the zero linecan be displayed. This operation can be performed at any time,either on recorders containing a zero control or, if the recorderhas no zero adjustment, this can be conveniently done with theanalyzer's zero adjustment.
NOTE
Always exit the recorder calibratemode by first turning the AUTOthumbwheel switch back to 0, thenset the DIAG. switch back toposition 0.
5-9
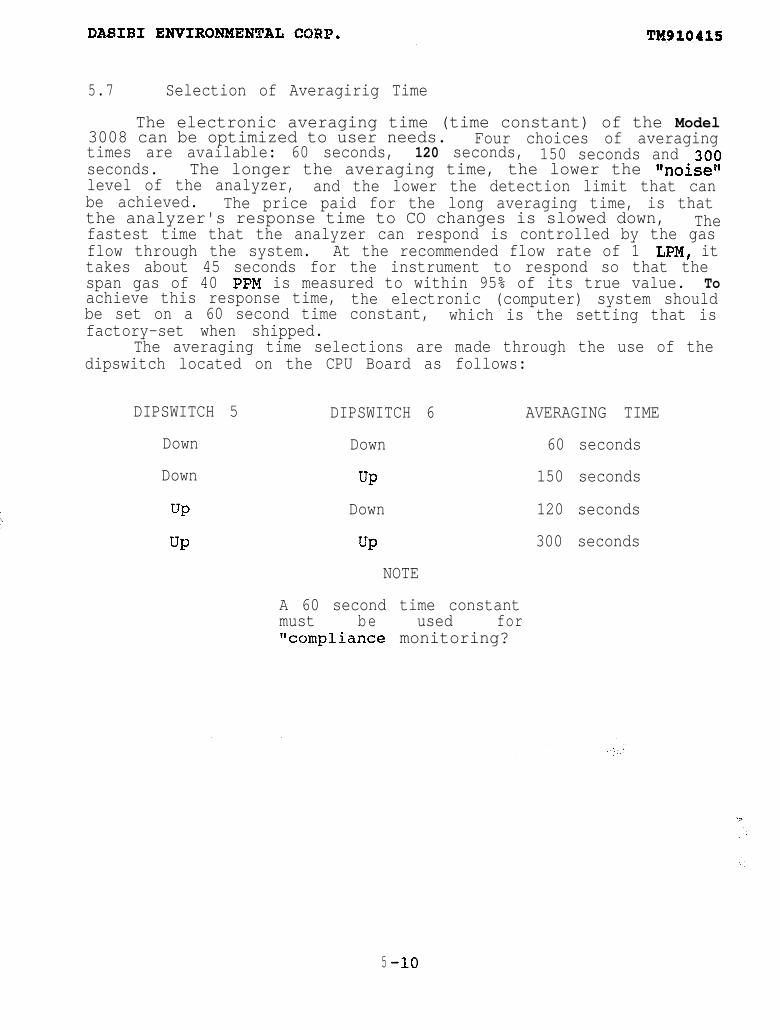
5.7 Selection of Averagirig Time
The electronic averaging time (time constant) of the Model3008 can be optimized to user needs. Four choices of averagingtimes are available: 60 seconds, 120 seconds, 150 seconds and 300seconds. The longer the averaging time, the lower the %oise"level of the analyzer, and the lower the detection limit that canbe achieved. The price paid for the long averaging time, is thatthe analyzer's response time to CO changes is slowed down, Thefastest time that the analyzer can respond is controlled by the gasflow through the system. At the recommended flow rate of 1 I&W, ittakes about 45 seconds for the instrument to respond so that thespan gas of 40 FFM is measured to within 95% of its true value. Toachieve this response time, the electronic (computer) system shouldbe set on a 60 second time constant, which is the setting that isfactory-set when shipped.
The averaging time selections are made through the use of thedipswitch located on the CPU Board as follows:
DIPSWITCH 5 DIPSWITCH 6 AVERAGING TIME
Down Down 60 seconds
Down UP 150 seconds
UP Down 120 seconds
UP 300 seconds
NOTE
A 60 second time constantmust be used forfQ20mpliance monitoring?
5 -10
DASIBI ENVIRONMENTAL CORP. TM910415
6.0 MAINTENANCE
6.1 General
In this section, preventive maintenance and maintenanceschedules are detailed. An introduction to corrective maintenanceexplains the general approach to trouble isolation. Performancechecks are also described.
6.2 Preventive Maintenance
Preventive maintenance is a quality control procedure and mustbe done periodically in order to maintain the integrity of theinstrument.
6.2.1 Maintenance Schedules
It is highly recommended that a log. be kept with theinstrument, since the maintenance schedules are in accordance withtotal instrument ON time. Dasibi provides such a record-keepinglog in Table 6-5 for use by the customer at their discretion. Thelife span of the scrubbing components cannot be predictedaccurately since they depend on the pollutants flowing through thesystems, the level of those pollutants, and the flow rate used.SO, the user should determine an average life span based uponexperience. In Table 6-4 at the end of this section, Dasibiprovides an initial replacement time frame until such an averagehas been determined.
By periodically recording the values obtained in the DIAG.switch positions, trends can be evaluated which will indicate thepossibility of problems occurring. Unexpected shifts in specificparameter readings often indicate a problem, or the beginning ofone. For example, a large change in the Offset value may indicatethat the gas filter correlation wheel has begun to leak and mayneed replacement. Figure 6-8 provides a chart that can bephotocopied and used for recording these diagnostic values.
6.2.2 Leak Check
Any leaks in the system can cause inaccurate data collection.The system should be leak checked by blocking off various inletports and observing the flowmeter ball to see if it drops to thebottom of the flowmeter.
Leaks are most easily found by a process of systematicelimination. In the procedure that follows, the analyzer isdivided into two functional sections, the valving system, which islocated on the back panel, and the analyzer proper, which isincluded in the valving system.
6-l
-- ;
-
DASIBI ENVIRONMENTAL CORP. TM910415
6.2.2.1 Checking For Leaks in the Valving System
The valving system is shown in Figure 3 -1 as the components onthe left side of the figure including the CO scrubber.
1. Place the analyzer in the SAMPLE mode, cap the Sample inletwith a plug fitting, and observe if the ball in theflowmeter goes to the bottom of the unit. If it does not,the leak is anywhere in the system.
2. If the flowmeter ball bottoms, unscrew the plug from theSample inlet, unscrew the tubing connection to the internalCO scrubber and block it with a plug fitting. Press theZERO pushbutton and observe if the ball bottoms,, If itdoes, the Sample is not leaking. If the ball ff@,ges notbottom there is a leak anywhere in the valving system.
3. Carry out a similar test by blocking the Span inlet and theVent outlet, and pressing the front panel's Spanpushbutton. If the flowmeter ball bottoms, the cylindervalve, and the tubing connections leading from it to thereference valve are gas tight. In addition, the samplevalve is not leaking.
4. If step 3 indicated no leak, and step 2 does, the leak isprobably located in the reference valve or its tubingconnection to the scrubber. *,
6.2.2.2 Locating a-Leak Exclusive of the Valving System
1. Start the testing at the Sample inlet while the analyzer isset to the Sample mode. Progressively block off eachpneumatic connection, following the path that air travelsthrough the analyzer after being sampled, until a place isfound where the flowmeter ball bottoms.
2. At this point work back to the Sample inlet to isolate thecomponent that is leaking.
3. If leaks persist that cannot be traced, contact the factoryfor specific instructions.
602.3 Replacement of Components
The following items of the instrument's components should beconsidered of limited life span and therefore may requirereplacement: ' t,'
1 . Ambient air teflon filter pad.2. Zero scrubber.3. Pump.4 . Solenoid valves.
The following items may require cleaning, dependent uponconditions of usage:
1. Optical elements.2. Capillary.
6-2

DASIBI ENVIRONMENTAL CORP. TM910415
6.2.3.1 Teflon Filter Pad Replacement (Figure 6-9)
The unit is delivered with a particulate filter holderassembly attached to the sample inlet port on the rear panel. TheTeflon pad inside of this assembly reduces the amount ofparticulate matter that will enter the instrument, thus preventingproblems from occurring, while reducing the frequency with whichthe optics cell must be cleaned. This pad should be replacedperiodically: how often! is dependent upon the flow rate used andthe concentration of particulate matter in the air stream. A"trial and error" method of determining how often this pad shouldbe replaced must be conducted by the end user. It is possible thata flashing message indicating a pressure problem could be caused bya clogged air filter. To remove the Teflon filter pad forreplacement, follow these instructions:
1.
2 .
3 .4 .
5 .
6 .7 .
6.2.3.2 Zero Air Tube Element Replacement (Figure 6-l)
Remove the Filter Holder Assembly located on the Sampleinlet port by loosening the nut on the Sample portfitting and pulling the assembly off.Use the two green wrenches that were delivered with theunit's manual to grasp the two clamps on either side ofthe filter assembly. Move the wrenches in oppositedirections to unscrew the clamps; this may require quitea bit of torque as the seal may be very tight (in orderto prevent leaks).Remove the Teflon filter element.Install the new filter element making sure it is centeredon the filter holder's flgridll.Start the re-seal of the filter holder's clamps byturning the inlet clamp clockwise. Once it is as tightas it can be made by hand, turn it l/4 turn using thewrenches.Re-apply power and check the flow of the instrument.If a leak exists in the filter holder, turn tighten theclamps further, using the wrenches, until the leakdisappears.
The efficiency of the catalytic CO scrubber may becomeunacceptable at some time in the use of the analyzer. This willbecome apparent when the efficiency test is run at the end of eachmultipoint calibration. This section is discussed in detail inAppendix A. If the scrubber efficiency becomes unacceptable, thescrubber capability can be regenerated by means of heating it at100° to 125°C while passing a stream of dry air through it. Thefollowing prokedure is given for guidance since there are many waysto apply heat to the catalyst tube:
1. Arrange a flow system so that ambient air can be pulledthrough the scrubber at a flow rate of l-2 LPM.
6-3
--.

DASIBI ENVIRONMENTAL CORP. TM910415
2 . Choose a convenient means of heating the catalyst tube.Possibilities include putting the tube in an oven,wrapping a heating tape controlled by a Variac around it,or blowing hot air over it. The tube can be heated in theanalyzer by means of a heating tape, while using theanalyzer flow system.
3, Heat the tube for at least two hours and re-test.
If the efficiency of the element remains unsatisfactory,replace the chemical as follows:
1.2 .
3 .4 .
5 .
6 .7 .
8 .
Turn power off,Disconnect the zero air tube by unscrewing the two screwsholding the tube bracket to the mother board transformer.Pull the tube assembly and bracket out of the unit.Unscrew the end capI being careful not to allow theinternal spring to fall, and empty the chemical.Refill the tube (refill packages are available fromDasibi in pre-measured amounts, stock number S-0138).Replace the tube spring and screw the end cap back on. 'Re-install tube assembly by reversing the aboveinstructions and re-apply power.Re-check Flow, Zero and Span.
6.2.3.3 Pump Replacement (Figure 6-2)
A flashing message on the alphanumeric display of PRESSURE canindicate a pump fault. The pump should be replaced or repaired ifit exhibits any sign of malfunction, i.e., excessive noise, erraticoperation or lack of pressure drop as indicated on the front paneldisplay while the diagnostic switch is set on position 3.Diaphragms can be cleaned or replaced by the following procedure:
1. Disassemble the head by removing the four fasteningscrews.
34-a. Inspect the orientation of head components duringdisassembly so that they can be re-assembledappropriately.
3. Clean or replace the diaphragms as required.4. Re-assemble in reverse order.
6.2.13.4 Solenoid Valve Replacement
The solenoid valves are very reliable, and both mechanical andelectrical failures are rare. However, if problems are suspected,they can be checked by listening for audible clicks when the ZEROpushbutton is pressed (which activates the SAMPLE solenoid), andthen when the SPAN pushbutton is pressed (which activates thereference solenoid). If the valves fail to activate, a check toensure that voltage is reaching them can be made by voltmeterreadings on the valve control board on the rear panel of theinstrument.
6-4
DASIBI ENVIRONMENTAL CORP. TM910415
The valves are removed for servicing as follows:
1. Remove their inlet and outlet tubes, unplug theirelectrical connections and remove the screws that boltthem to the rear panel.
2. The valves can be inspected and cleaned, by undoing twoscrews at their base, and separating the solenoid upperportion from the valve lower portion.
3. Inspect for damage, brush out any particulate matter, andclean with methyl or ethyl alcohol.
4. Re-assemble and test, or replace valves.
6.2.3.5 Gas Filter Correlation Wheel Replacement
Evidence of a defective gas filter correlation wheel isoutlined in the Corrective Maintenance Section following thissection. Wheels generally last many years, however, they have beenknown to fail due to extreme temperature cycling, which destroysthe epoxy seals holding the sapphire windows to the metal wheelbody. If a gas correlation wheel is determined to be defective,follow these replacement instructions:
1) Disassemble the fore optic assembly from the optics bench byloosening and removing the four 8/32 x 1 l/2" socket screws.
2) Remove the thermistor mounting block to gain access to the GFCwheel.
3) Remove the wheel from the motor shaft by loosening the setscrew (4/40 x 3/32") mounted on the protrusion of the shaft.
4) Loosen the set screw installed in the replacement GFC wheeland mount it to the motor shaft making sure that:
a) The set screw of the GFC wheel seats on the flat portionof the motor shaft and is perpendicular to the opticalinterrupter blade positioned in the middle of the phasesensor (PSD). Refer to Figure 4-1.
W The black tape side of the GFC wheel is facing towardsthe interrupter.
Cl The masked lldarkl* portion of the wheel is on top of themotor shaft.
5) Tighten the set screw firmly, but carefully, onto the shaft.
6) Reverse Steps 1 & 2 to re-assemble the bench.
7) For the final adjustments, refer to Section 6.5.9 and foroscilloscope patterns, refer to Figure 6-5.
6-5

DASIBI ENVIRONMENTAL CORP. TM910415
6.2.3.6 Infrared Source Replacement (Figure 6-10)
The source is expected to give more than one year's service.Its intensity does not decrease during operation with time. Whenit fails,When thisdisplay.following
1.
2 .
3 .
4 .
To replace the source, proceed as follows:
1. Obtain either a replacement source assembly from Dasibi(stock # 2-0001-B) or a source itself (stock # D-0041).
2.
3 .
4 .
5 .
it suffers catastrophic failure and must be replaced.happens, a SOURCE FAILURE message will flash on theThe source failure can be further diagnosed by the
four tests:
If the user has a voltmeter, then unplug the I.R. sourcefrom the Mother Board and test its impedance across theplug terminals: it should be 15 ohms. If the impedanceis infinite, the source is open (failed).
If the user does not have access to a voltmeter, thenlook through the hole located in the I.R. source's blockto see if there is a dull red glow. If not, the sourcehas failed.
Put the DIAGVoltage (R).volt) from 5good source.
If there is, go to step 3.
switch on position 5 and read the ReferenceA steady voltage (fluctuations less than 1to 8 volts after the letter rlRfl indicates a
The voltage supply to the source can be checked at itsterminals. It should be from 11 to. 13.5 Vdc. Highervoltage lowers the analyzer noise, but shortens thesource lifetime. The voltage is controlled by trimpotR21 on the Power Supply Board.
CAUTION: SOURCE IS HOT!
Remove the infrared source assembly by means of the twoscrews that straddle the power connections.
Unplug the source power connector, and eitherdiscard theentire assembly, or remove the source itself byunscrewing the two sets screw which hold it in place.
Replace the old source with the new one. Make sure thatthe bare wire portion of the resistor faces away from the"1 iP" of source assembly's bracket, and that this lipfaces the fan on the back panel when it is re-installed.
Before placing the source assembly back into the fore-optics, allow it to burn in for at least 30 minutes toprevent lffoggingl' on the mirrors during this time.
6-6
DASIBI ENVIRONMENTAL CORP. TM910415
6 . Re-connect mounting screws and power cable connector.
6.2.3.7 E-Prom Replacement (Figures 6-3 and 6-4)
The analyzer operates from instructions contained in Read OnlyMemory (ROM). This software is contained in one of the integratedcircuits in the instrument called a PROM (Programmable Read-OnlyMemory). The analyzer can be made to operate in different modes,and to different specifications, by changing the PROM (installinga new program). For example, it could be made to be more l%serfriendly", or give more diagnostic information. Also, operationalparameters such as time constant or concentration range could bechanged by modifying the program in the PROM.
For this reason, users of the analyzer may wish to change theprogram, as new programs evolve based on new developments. Dasibiwill contact users if improved or more versatile programs becomeavailable. The steps outlined below, should be followed ininstalling a new PROM.
1 . Turn off power to the instrumentboards. Damage to circuit IC's willif cards are pulled out when thepower.
before removing PCalmost always resultinstrument is under
2. Disconnect the cables to the CPU Board, and make note oftheir positions, so they can be reconnected correctly.
3. Place the CPU board on a flat static-free surface.4. Carefully IrpryI1 the PROM using a small screwdriver and
replace it with the new one, obeying proper orientation.5. Replace the CPU Board and re-connect the cables.
6.2.3.8 Cleaning of Mirrors
There are five mirrors in the Model 3008 optical bench (referto Figure 4-l). With use, dust and other contamination can depositon these mirrors. When this becomes severe, the energy throughputof the system is lowered, and the analyzer may become noisy. Thiscondition is diagnosed by the Bench Efficiency Test (BET) which isdescribed in the Corrective Maintenance Section. The mirrors'reflective surface is a layer of aluminum deposited on the uppersurface of a polished glass plate. Although a protective coatingis applied to the aluminum surface to permit cleaning, the surfaceshould still be considered delicate and not handled with pressure.Mirror cleaning should be done with suitable solvents and IrQ1' tips;the following solvents are recommended for mirror cleaning:
1. Windex or equivalent window detergent
2. Methyl Alcohol
3. Distilled or Deionized Water
Procedure For Cleaning Mirrors:
6-7
DASIBI ENVIRONMENTAL CORP.
A. Preparing the mirrors for cleaning:
1.2 .3 .
supporting4.5.
6 .
7.
8 .
9.
10.
Turn off power and unplug the power cord.Place analyzer on its right side (facing the unit).Using an 8-32 nut driver, remove the five nuts holdingthe bench to the bottom of the chassis, while
the bench with one hand.Place the analyzer back in a normal upright position.Elevate the end of the optical bench facing the powerSUPPlY*Remove the l/4 H tubes connected to the Wee" locatedon the mirror plate at the foot of the bench which facesthe power supply. DO NOT remove the Vee" itself.Unscrew the five screws and one nut that hold the platecontaining mirror pair M2 and M3 in place.Place the mirror assembly, mirror side down, on a cleanflat surface.Elevate the upper end of the bench, and remove the sixscrews that hold the single large concave mirror M4 inplace.Place this mirror assembly, mirror side down, on a cleanflat surface.
B. Cleaning of mirrors with a pressurized stream of dry gas.
1. Use a source of clean dry gas such as a cylinder or arubber bulb blower used to clean photo lenses. Removeas much particulate matter as possible by blowing itoff.
2 . Inspect the mirrors for cleanliness.3. If the mirrors have no obvious deposits of dirt or oil
film after this operation, they should be re-installed,and no further cleaning attempted.
c. Cleaning of mirrors with solvents.
1. Using !*Qti tips, gently brush the mirror surfaces withone of the solvents or detergents listed above.Always use, as a final solution, Distilled or Deionizedwater.The drying of the cleaned mirrors can be speeded byblowing dry clean air over their surface. I(The mirrors are re-installed by reversing the procedureused to remove them.
2.
3 .
4 .
D. Cleaning of Beam Steering Mirrors Ml and M5.
1. The beam steering mirrors can be removed by the pair ofscrews that hold each of them.
2. They should be inspected and cleaned if necessary. Takethe same precautions cited for other mirrors.
3. Re-assemble the mirrors using the position stop screwsto preserve alignment.
6-8
DASIBI ENVIRONMENTAL CORP. TM910415
6.3 CORRECTIVE MAINTENANCE
Corrective maintenance on the instrument is aided by thepowerful diagnostic capabilities of the integral computer.Investigation of a problem can be explored by employing the DIAGthumbwheel switch, which permits the user to isolate and displaythe values associated with various, individual instrument functionsfor analysis and correlation purposes.
In many cases, the failure or malfunction of a component willbe indicated by a periodic message flashing on the alphanumericdisplay. Flashing messages are a user option, and dipswitch 7 onthe top of the CPU Board controls activation of this feature. Itis recommended that dipswitch 7 be in the DOWN position so that theflashing message option will be activated during normal operation.
The Start-Up program provides ease of operation during start-up* It checks out a number of analyzer functions on a pass/failbasis.
6.3.1 General Troubleshooting Techniques
In presenting the following troubleshooting procedures,directions are given for locating malfunctions in a sequentialmanner. This process is facilitated by the use of built-incomputer diagnostics. These diagnostic functions can be called-upat any time by using the DIAG thumbwheel switch. Refer to Table 6-1 for a description of the functions available with the DIAGthumbwheel switch.
BY calling-up each of the individual diagnostic tests,information will appear on the alphanumeric display which willallow the faulty module or PC board to be identified and replaced.This computer diagnostic capability is quite useful, since it isgenerally true that the proper diagnosis of a problem is thegreater part of its overall solution.
NOTE
When performing troubleshooting andmaintenance procedures, it is recommended thatcommon shop-level hand tools be available. Inaddition, a piece of test equipment that isvery useful in troubleshooting the instrumentis a digital voltmeter capable of 10 mVresolution or better.
After a diagnosis has been made, the corrective action that isgenerally recommended is replacement of the faulty module or PCboard, whenever possible. To facilitate rapid repair, it isrecommended that users of the instrument maintain spare replacementcomponents. A list of recommended spares is given on Page 7-l.However, spare PC boards and other modular components forreplacement are also maintained at Dasibi for prompt shipment uponrequest.
6-9-
DASIBI ENVIRONMENTAL CORP. TM910415
6.3.2 General Diagnostic Information
The analyzer has three separate means of presenting diagnosticinformation to the user. These are:
1. Flashing messages.2. Diagnostics dialed via the DIAG thumbwheel switch.3. Special test functions of computer system - COMPTEST.
6.3.2.1 Flashing Messages
The analyzer provides flashing messages as intermittentinterruptions of the concentration readings on the alphanumericdisplay on the front panel when operation of a key component is notwithin the proper range. Position 7 on the CPU board dipswitchcontrols the flashing messages, and they can be eliminated byplacing the switch in the UP or CLOSED position. The followingmessages may appear:
1. Source Failure D5 i"' /2. Wheel Temperature Failu3. Zero Offset Failure Dl4. RAM Failure CT5. PROM Failure CT6. V/F Failure CT
6.3.2.2 PROM Failure
This message can mean that the EPROM is faulty or poorlyconnected into the circuit board. Inspect the CPU Board forfaults.
6.3.2.3 V/F Failure. _.-_
This message usually indicates that either the voltage-to-frequency converter has failed or the 10 V reference which powersthe converter and the multiplexers has failed.
6.3.3 Diagnostics Dialed Via The DIAG Thumbwheel Switch
In troubleshooting the analyzer, the built-in diagnostics aregenerally the fastest and easiest way to identify a problem area.The diagnostics are displayed by setting the DIAG thumbwheel switchon numbers 1 through 8. In addition, some diagnostics can bedisplayed on a strip chart recbrder or data acquisition system bychanging the position of dipswitch 8 on the CPU Board (DOWN to UP).
Table 6-l is a listing of the diagnostics available and theDIAG thumbwheel switch setting for each. This list gives theoperational range of each parameter displayed for the appropriateDIAG NO. It is useful during troubleshooting to display theperformance of modules under examination on a strip chart recorder;the table identifies which parameters are available for a recorder.
6-10--
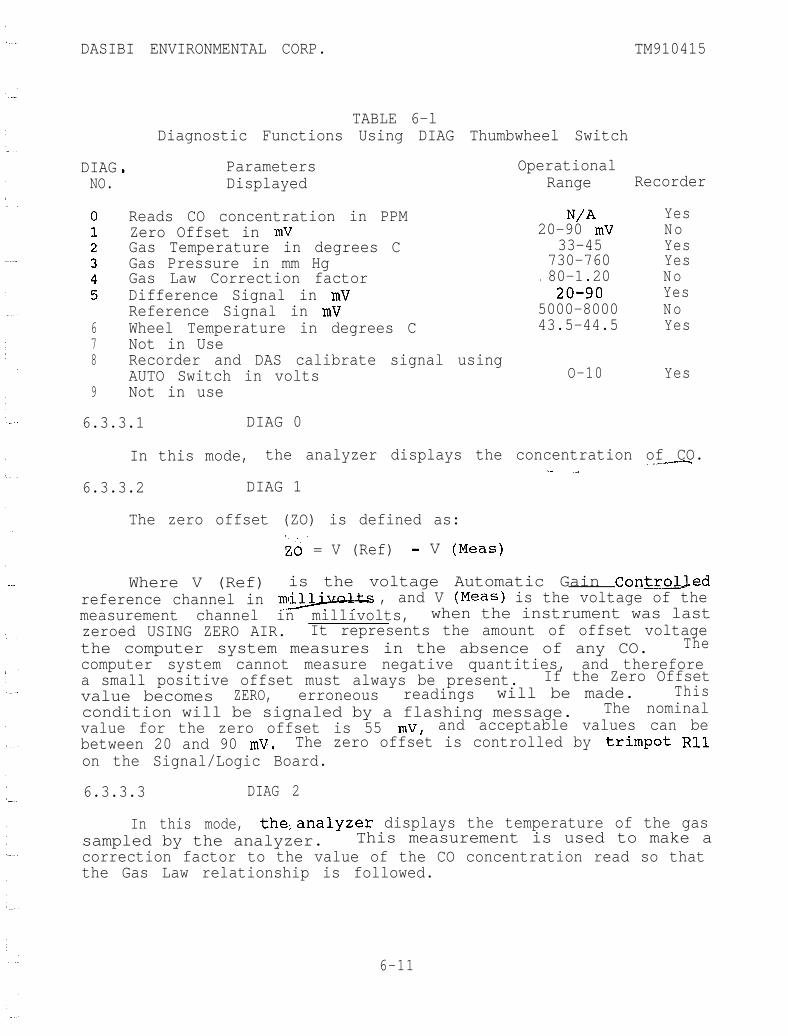
DASIBI ENVIRONMENTAL CORP. TM910415
DIAGNO.
678
9
.
TABLE 6-lDiagnostic Functions Using DIAG Thumbwheel Switch
Parameters OperationalDisplayed Range Recorder
Reads CO concentration in PPM VA YesZero Offset in mV 20-90 mV NoGas Temperature in degrees C 33-45 YesGas Pressure in mm Hg 730-760 YesGas Law Correction factor . 80-1.20 NoDifference Signal in mV 20-90 YesReference Signal in mV 5000-8000 NoWheel Temperature in degrees C 43.5-44.5 YesNot in UseRecorder and DAS calibrate signal usingAUTO Switch in volts O-10 YesNot in use
6.3.3.1 DIAG 0
In this mode, the analyzer displays the concentration of CO._ >..w"-------n- ~,6.3.3.2 DIAG 1
The zero offset (ZO) is defined as:. .zo = V (Ref) - V (Meas)
Where V (Ref) is the voltage Automatic Gain ControlJedreference channel in rnw, and V (Meas) is the voltage of themeasurement channel in millivolts, when the instrument was lastzeroed USING ZERO AIR. It represents the amount of offset voltagethe computer system measures in the absence of any CO. Thecomputer system cannot measure negative quantities, and thereforea small positive offset must always be present. If the Zero Offsetvalue becomes ZERO, erroneous readings will be made. Thiscondition will be signaled by a flashing message. The nominalvalue for the zero offset is 55 mV, and acceptable values can bebetween 20 and 90 mV. The zero offset is controlled by trimpot Rllon the Signal/Logic Board.
6.3.3.3 DIAG 2
In this mode, the,analyzer displays the temperature of the gassampled by the analyzer. This measurement is used to make acorrection factor to the value of the CO concentration read so thatthe Gas Law relationship is followed.
6-11
DASIBI ENVIRONMENTAL CORP. TM910415
6.3.3.4 DIAG 3
A pressure transducer is included in the flow monitoringsystem which measures the pressure of the gas sampled by theanalyzer. This measurement is used along with the temperature tocalculate a correction factor for the Gas Law relationship.
6.3.3.5 DIAG 4
Since the analyzer is calibrated at one point in time andmakes measurements at other times, changes in pressure andtemperature that are time dependent can influence the measurementaccuracy. In the Model 3008 analyzer, the microprocessor receivescontinuous temperature and pressure information, and corrects themeasurement made, so that it is always referenced to standardtemperature and pressure, which for an ambient monitor is taken tobe 25*C and 760 torr.
6.3.3.6 DIAG 5
The measurement of CO is obtained by taking the difference oftwo DC signals, the measurement signal and the reference signal.The difference voltage read on DIAG. 5 is this difference read outin millivolts. It is proportional to the concentration of CO beingmeasured in the analyzer. Super-imposed on this voltage, is theZero Offset voltage, which is a fixed constant of nominally 55 mVused to insure that readings are always positive. The value of theoffset is not critical, but should be within 20 and 90 mV. Thereference voltage is maintained constant by an Automatic GainControl (AGC) circuit which is part of the analog signalconditioning circuitry. It is nominally set at 8.0 volts, butvalues between 5 to 8 volts are acceptable for use.
6.3.3.7 DIAG 6
The Gas Filter Correlation Wheel is temperature sensitive,and should be maintained with a temperature variation as small aspossible to minimize instrument zero drift with temperature. Inaverage use, the wheel temperature should stay within the range of43.5 to 44.5Oc. The regulation of the temperature of the wheel islargely controlled by the modulated fan blowing outside air uponit. The fan, in turn, )is controlled by a thermistor sensor locatednear the wheel compaktment. The optical chamber is kept at atemperature between 33,-45*C. The temperature adjustment is made bytrimpot R5 labelled "Temperature Adjustment" on the Power Supply.
6.3.3.8 DIAG,7
Currently not in use.
6-12
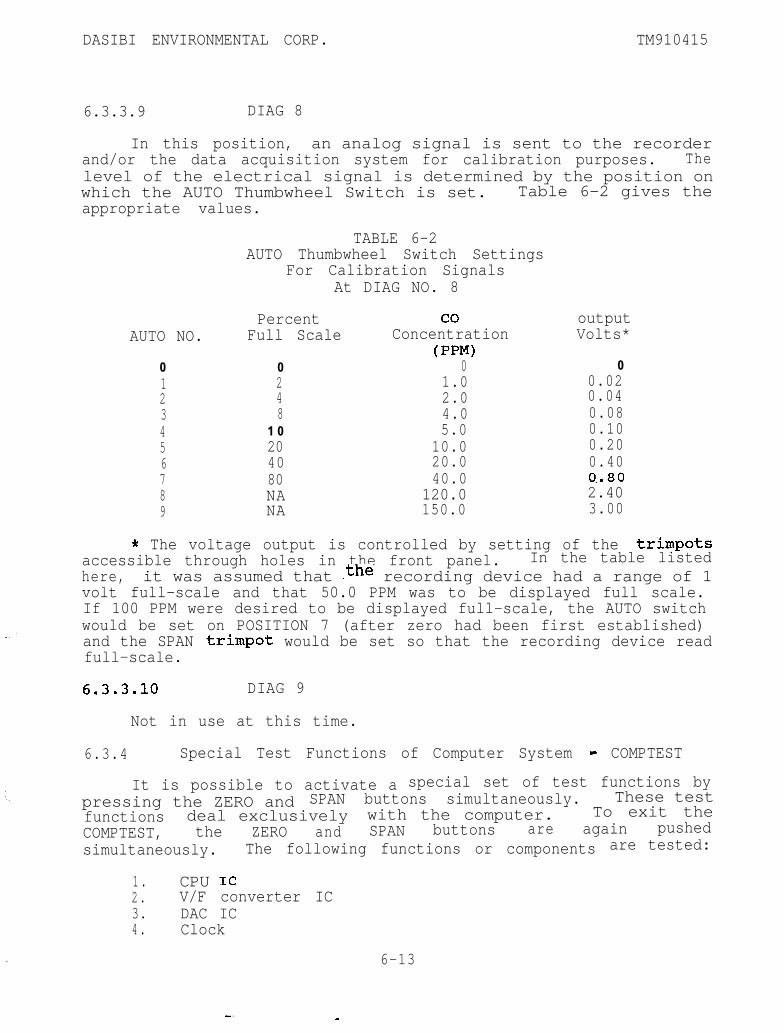
DASIBI ENVIRONMENTAL CORP. TM910415
6.3.3.9 DIAG 8
In this position, an analog signal is sent to the recorderand/or the data acquisition system for calibration purposes. Thelevel of the electrical signal is determined by the position onwhich the AUTO Thumbwheel Switch is set. Table 6-2 gives theappropriate values.
TABLE 6-2AUTO Thumbwheel Switch Settings
For Calibration SignalsAt DIAG NO. 8
AUTO NO.
0123456789
PercentFull Scale
0248
1 0204080NANA
outputVolts*
coConcentration
(PPW0
1.02.04.05.0
10.020.040.0
120.0150.0
00.020.040.080.100.200.400..802.403.00
* The voltage output is controlled by setting of the trimpotsaccessible through holes in the front panel. In the table listedhere, it was assumed that ,the recording device had a range of 1volt full-scale and that 50.0 PPM was to be displayed full scale.If 100 PPM were desired to be displayed full-scale, the AUTO switchwould be set on POSITION 7 (after zero had been first established)and the SPAN trimpot would be set so that the recording device readfull-scale.
6.3.3.10 DIAG 9
Not in use at this time.
6.3.4 Special Test Functions of Computer System - COMPTEST
It is possible to activate a special set of test functions bypressing the ZERO and SPAN buttons simultaneously. These testfunctions deal exclusively with the computer. To exit theCOMPTEST, the ZERO and SPAN buttons are again pushedsimultaneously. The following functions or components are tested:
1. CPU IC2 . V/F converter IC3. DAC IC4. Clock
i 6-13
--. -

DASIBI ENVIRONMENTAL CORP. TM910415
5. CPU Board dipswitch6. All front panel thumbwheel switches7. CPU tiWatchdogH counter test8. RS 232C Board, if present
Once the ZERO and SPAN buttons are pushed, and the analyzerenters the COMPTEST mode, the various tests are engaged by pressingthe appropriate front panel push buttons. Pressing the YZERO" modepushbutton initiates the following sequence:
1. Displays software revision number.2. Performs CPU test.3. Performs V/F test.4. Displays thumbwheel settings in hexadecimal code.
Pressing the Y%MPLE" mode pushbutton initiates the following:
1. The DIAG NO. thumbwheel switch can now select each of thesix multiplexed (MUX) inputs to the V/F converter, andthey will be displayed as millivolt readings. Position7 is set to read 10,000 as the voltage standard.
2. The value set on the SPAN NO. thumbwheel switch is usedto test the digital-to-analog converters (DACS). Byconnecting a recorder, DVM, or a Data Acquisition System(DAS) to the analog output(s), the DACS can be checkedfor linearity by changing the value set on the SPAN NO.thumbwheel switch in a sequential manner. By steppingthe switch from 000 to 999, corresponding linear outputvoltages from 0 to 10 volts (or whatever the user-selected maximum analog output value is) will beobtained.
Pressing the llSPAN1l mode pushbutton initiates the following:
1.
2 .
3 .
4 .
When the DIAG NO. thumbwheel switch is set on 0, thedipswitch positions on the CPU Board are read out on thealphanumeric display in binary code (1 = '*switch open,"0 "switch closed"). Dipswitch position 8 is in thelef=t most position on the display.
When the DIAG NO. thumbwheel switch is set on 1, a clockcheck is made. The display is updated every fiveseconds.
DIAG NO. 2 will display the communication parameters ofthe RS232 port, if this option is present.
DIAG NO. 3 will proceed with the tiWatchdogu counter test(designed to reset the computer in case of a lock-up).If the counter is working, the analyzer will be resetwithin 30 seconds.
6-14
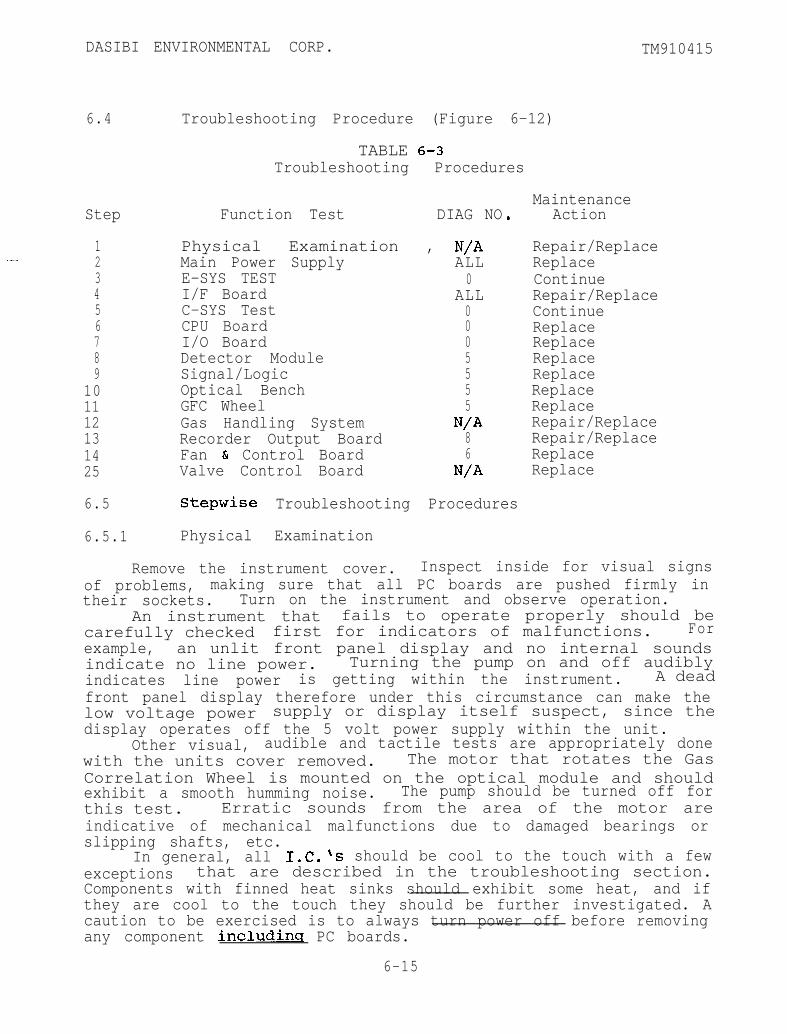
DASIBI ENVIRONMENTAL CORP. TM910415
6.4
Step
1 Physical Examination , VA2 Main Power Supply ALL3 E-SYS TEST 04 I/F Board ALL5 C-SYS Test 06 CPU Board 07 I/O Board 08 Detector Module 59 Signal/Logic 5
10 Optical Bench 511 GFC Wheel 512 Gas Handling System WA13 Recorder Output Board 814 Fan & Control Board 625 Valve Control Board WA
6.5
6.5.1
Troubleshooting Procedure (Figure 6-12)
TABLE 6-3Troubleshooting Procedures
Function Test DIAG NO .Maintenance
Action
Repair/ReplaceReplaceContinueRepair/ReplaceContinueReplaceReplaceReplaceReplaceReplaceReplaceRepair/ReplaceRepair/ReplaceReplaceReplace
Stepwise Troubleshooting Procedures
Physical Examination
Remove the instrument cover. Inspect inside for visual signsof problems, making sure that all PC boards are pushed firmly intheir sockets. Turn on the instrument and observe operation.
An instrument that fails to operate properly should becarefully checked first for indicators of malfunctions. Forexample, an unlit front panel display and no internal soundsindicate no line power. Turning the pump on and off audiblyindicates line power is getting within the instrument. A deadfront panel display therefore under this circumstance can make thelow voltage power supply or display itself suspect, since thedisplay operates off the 5 volt power supply within the unit.
Other visual, audible and tactile tests are appropriately donewith the units cover removed. The motor that rotates the GasCorrelation Wheel is mounted on the optical module and shouldexhibit a smooth humming noise. The pump should be turned off forthis test. Erratic sounds from the area of the motor areindicative of mechanical malfunctions due to damaged bearings orslipping shafts, etc.
In general, all IX. \s should be cool to the touch with a fewexceptions that are described in the troubleshooting section.Components with finned heat sinks should exhibit some heat, and ifthey are cool to the touch they should be further investigated. Acaution to be exercised is to always turn power off before removingany component includinq PC boards.
6-15
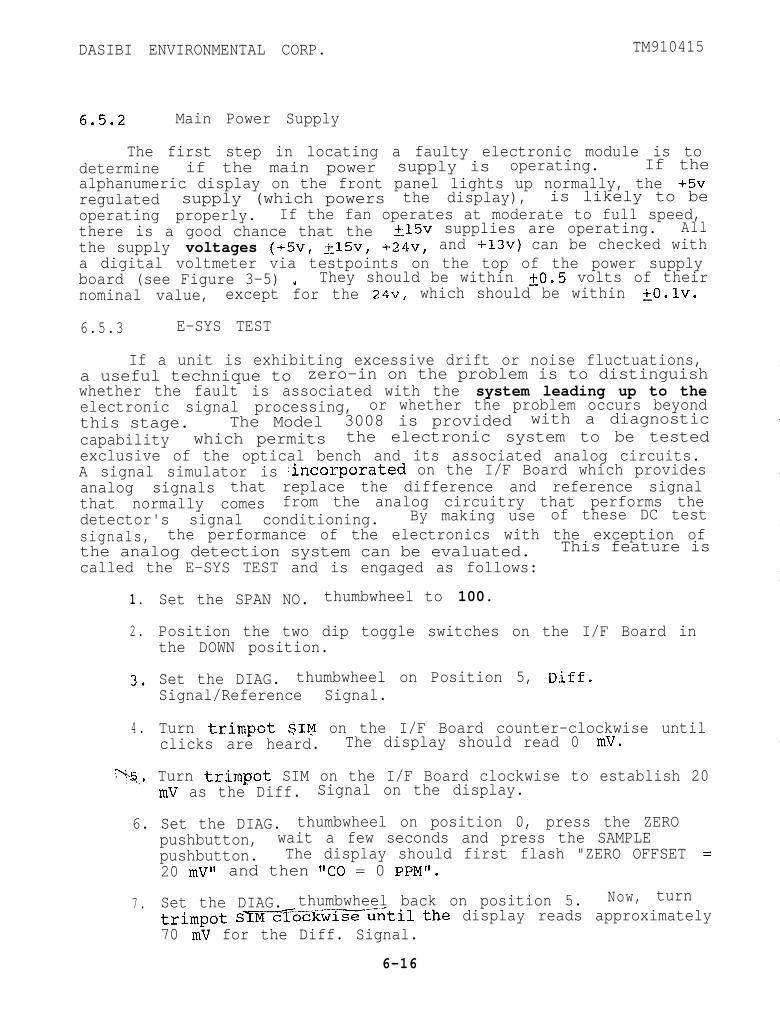
DASIBI ENVIRONMENTAL CORP. TM910415
6.5.2 Main Power Supply
The first step in locating a faulty electronic module is todetermine if the main power supply is operating. If thealphanumeric display on the front panel lights up normally, the +5vregulated supply (which powers the display), is likely to beoperating properly. If the fan operates at moderate to full speed,there is a good chance that the 515~ supplies are operating. Allthe supply voltages (+5v, &15v, +24v, and +13v) can be checked witha digital voltmeter via testpoints on the top of the power supplyboard (see Figure 3-5) * They should be within to.5 volts of theirnominal value, except for the 24v, which should be within &O.lv.
6.5.3 E-SYS TEST
If a unit is exhibiting excessive drift or noise fluctuations,a useful technique to zero-in on the problem is to distinguishwhether the fault is associated with the system leading up to theelectronic signal processing, or whether the problem occurs beyondthis stage. The Model 3008 is provided with a diagnosticcapability which permits the electronic system to be testedexclusive of the optical bench and its associated analog circuits.A signal simulator is .incorporated on the I/F Board which providesanalog signals that replace the difference and reference signalthat normally comes from the analog circuitry that performs thedetector's signal conditioning. By making use of these DC testsignals, the performance of the electronics with the exception ofthe analog detection system can be evaluated. This feature iscalled the E-SYS TEST and is engaged as follows:
1 . Set the SPAN NO. thumbwheel to 100.
2 . Position the two dip toggle switches on the I/F Board inthe DOWN position.
3. Set the DIAG. thumbwheel on Position 5, Diff.Signal/Reference Signal.
4. Turn trimpot $Iv on the I/F Board counter-clockwise untilclicks are heard. The display should read 0 mV.
y+a,, . Turn trimpat SIM on the I/F Board clockwise to establish 20mV as the Diff. Signal on the display.
6. Set the DIAG. thumbwheel on position 0, press the ZEROpushbutton, wait a few seconds and press the SAMPLEpushbutton. The display should first flash "ZERO OFFSET =20 mV1l and then "CO = 0 PPM?
7. Set the DIAG. thumbwheel back on position 5. Now, turntrimpot tilthe display reads approximately70 mV for the Diff. Signal.
6-16

DASIBI ENVIRONMENTAL CORP.
8. Set the DIAG thumbwheel on position 0. The display shouldread approximately 14 to 15 PPM, within several minutes.
!a9. Turning the SIM trimpot on the I/F Board clockwise will now
let you simulate CO, and you can dial in as much as 40 PPM.In this position, display readings should show no noisefluctuations, and drift due to thermal effects should notbe observed.
If the tests described above are re-produced, the electronicsystem is working satisfactorily. This includes the I/F, CPU, andI/O Boards, but not the Detector Module or the Signal/Logic Board.
Be sure at this point to return the two switches on the I/FBoard to the up position.
If the E-SYS TEST did not pass, the unit should be subjectedto the C-SYS TEST, which tests out the computer system.
6.5.4 I/F Board
If the E-SYS TEST was passed, it is likely that the I/F Boardis working satisfactorily. A few amplifiers that deal withtransducers, such as the Pressure Transducer are not tested byE-SYS TEST. If there is evidence that the E-SYS TEST wassatisfactory, it may indicate that the I/F Board shouldreplaced. Alternatively, the op-amps (Al) can be replaced.
6.5.5 C-SYS Test
The computer section consists of the CPU Board and the
thenotbe
Board. The CPU contains the Z-80 microprocessor CPU systemincluding the system program which resides in an EPROM. The I/Ofunctions to translate all incoming and outgoing signals so theyare compatible with both the computer and the connecting circuitry.The C-SYS test applies to both boards and cannot isolate problemsto a individual board. The test is performed as follows:
1. Locate the red, 8-position dipswitch at the top center ofthe CPU Board. When the levers of this switch are in theUP position, the switches are CLOSED, or conducting, andwhen they are in the DOWN position, they are OPEN, ornon-conducting.
.2 . Close switch 2 (UP position). In this mode, the computer
supplies equivalent voltages to voltages normally fromthe I/F Board to" result in a reading of 40.0 PPM..: J (;J p ( "2;c. i
If the test described above is reproduced, the computer systemis working satisfactorily, with the exception of the exclusion tobe discussed below. If the test did not perform satisfactorily, itmay indicate that either the I/O or CPU Board should be replaced.
6-17
-
DASIBI ENVIRONMENTAL CORP. TM910415
4 ;
” *Exclusion to C-SYS Test:
:(.y[* The analog-to-digital conversion of signals coming from theJ :""~I/F Board is performed on the I/O Board. This is done by a signal
multiplexer (MUX), which switch-selects on a time-share basis the*:“ different analog signals to be converted to digital form. TheI time-shared analog signals are then fed to a voltage-to-frequency
converter which converts them to digital form. In the C-SYS test,this portion of the circuit of the I/O Board is not used.Therefore, if the C-SYS test passed, but the COMPTEST Span modetest failed, it is likely that either ,the HIl-0158-5 MUX or the
verter has failed and should be replaced. It ishat in this case the entire I/O Board be replaced.
NOTE
At instrument TURN-ON, thealphanumeric display on the frontpanel will read the status of thecomputer system. If the V/Fconverter is faulty, it should givea flashing messaye.
6.5.6 CPU Board
The diagnosis of this board is best done by the C-SYS testdescribed above. In addition, there are other indications that canbe used to rule out problems on this board. If the analyzerdisplays diagnostic information it is a favorable sign about thestatus of this board. Also, at turn-on a message will appearflCOMPUTER PASS" or ttCOMPUTER FAIL" which is indicative of thestatus of this board. Finally, if there is a problem in the EPROMon this board, a flashing message will indicate "PROM FAILURE."
6.5.7 I/O Board
This board is diagnosed by the C-SYS test, bearing in mind theexclusion discussed above. A failure of the V/F converter whichdoes the analog to digital conversion, is indicated by a flashingmessage: ,tV/F FAILURE."
6.5.8 Detector Module
The Detector Module must be diagnosed with an oscilloscope,since the signals it produces are AC waveforms. The output signalof the detector module can be examined on test point 1 of theSignal/Logic Board.
6-18
DASIBI ENVIRONMENTAL CORP. TM910415
NOTE
It takes several minutes after poweris applied for the Bias Voltagenecessary to power the detector tobecome active, due to its oscillatorcircuit. Therefore, it is necessaryto wait several minutes after powerup to test the detector.
Procedure:
1. Set the scope sweep for 5 ms/div.
2. Set the scope volts/div at 1 volt.
3. Compare waveform observed with that in Figure 6-5.
4. The waveform should have the same shape, be stable, and bebetween 2 and 5 volts peak to peak.
5. If the voltage is not correct it can be adjusted by R25 onthe Signal/Logic Board.
6. If the voltage cannot be raised to 2 volts peak to peak,the analyzer will be noisy, and either there is analignment problem in the optical bench, or the detectormodule has a problem.
Isolating a problem between the optical bench and detectormodule:
1.
2.
3 .
4 .
If a low, or no signal is obtained on test point 1, it isnecessary to isolate the problem to either the bench or theDetector Module.
Remove the beam steering mirrors by the four retainingscrews that fasten them from the top (Figure 6-11).Before doing this, check that the set screws shown in thefigure are tight, and that positioning screws arescrewed to the point of contact with the bench side plates.This allows the mirrors to be removed, and replaced inoptical alignment.
With the mirrors removed, test point 1 is again checked fora waveform of the proper shape' and voltage.
If an acceptable signal is present, the problem is in thebench alignment. If not, the problem is in the DetectorModule.
DASIBI ENVIRONMENTAL CORP. TM910415
Testing the Detector Module's cooler circuit:
1. The detector has a solid state cooler, which must performcorrectly for the detector to function properly. Thecircuit that powers the cooler is located on the main powersupply as well as a heat sink module on the left frontcorner of the chassis.
2. The cooler power supply can be checked by reading the DCvoltage on the power regulator mounted on the heat sink.This can be done by touching the case of the regulator withthe positive probe of a voltmeter. The negative probeshould be placed on ground. The voltage should read +mV. >
50
3, If no voltage is read, touch the positive probe on thefirst contact facing the front of the analyzer on theorange plug leading from the heat sink module to the MotherBoard. The voltage read here should be + 13 to 14 Volts.If this reading is obtained, the voltage regulator mountedon the heat sink is defective.
4. If no voltage is obtained in Step 3, or if the voltage isless than 4 volts, a problem exists on the main PowerSupply Board,
5. There is a five (5) Amp fuse on the Power Supply Board,and it is functioning in the cooler circuit. It can betested with a voltmeter to see if the + 1.3 to 14 Volts canbe measured on both the upper and lower clip terminals. Ifthe voltage is on the upper terminal, but not the lowerterminal, the fuse should be replaced.
6. If there is no voltage on the upper fuse terminal, the mainpower supply is defective and should be replaced.
The Detector Module itself:
It has been general experience that a defective de;;;:;;module almost always is caused by the detector elementmalfunctioning. This i s not. a field repairable situation.Therefore, it is recommended that if the problem is isolated to thedetector module, either the entire module should be replaced orsent to Dasibi for determination of exact causes. If it is thedetector itself, Dasibi will be able to replace it for less expensethan that of replacing the whole assembly.
6-20
k. -
. .
DASIBI ENVIRONMENTAL CORP.
6.5.9 Signal/Logic Board
1. Use an oscilloscope to check if a signal is present on TPlthat agrees with the waveform shown in Figure 6-5. If nooscilloscope is available it is suggested that the board bechecked by means of a DVM, and the values listed on Figure6-6 be verified.
2. Place the scope probe on TP 5. The waveform form should,again, be shown as in Figure 6-5.
3. Now, flip the AGC toggle switch mounted on the board backand forth. Three flat regions on the waveform, two at thetops of the waveform, one at the wide bottom section shouldbe seen to first separate and then merge. These are thesampled portions of the waveform separated by thesample/hold switches. Their position is indicated bydotted lines in the waveform shown in Figure 6-5. Forphasing to be correct, the wide bottom flat should becentered on the same mid-point for the switched, andun-switched section.*
* Be sure, when this test is finished, that the lever of thetoggle switch is facing away from the front of the panel, so thatthe AGC circuit is engaged.
4.
5 .
6 .
7 .
If the waveform behaves as described, all of the digitallogic functions that control the sample/hold switches arefunctioning, and the sample/hold switch itself (U5) isoperational. If the proper behavior is not observed theproblem is likely to be in a defective logic IC, or theswitch IC. The faulty unit can usually be located bymonitoring the various test points on the Signal/LogicBoard using the information contained in Figures 6-5, 6-6and 3-8 & 3-8A.
Measure the voltage on TP 6 using a DVM or a scope, andcheck to see if it is 8 to 9 volts. If it is not, set itto 8 volts by means of trimpot R37.
Measure the voltage on TP 7 using a DVM or scope, and setit to 80 mV by means of trimpot R11.
Challenge the analyzer with span gas, while monitoring TP7. The voltage should rise proportionally with the spangas concentration, and reach a steady value approximately2 volts for 40 PPM. If this is observed, the Signal/LogicBoard is satisfactory.
6-21
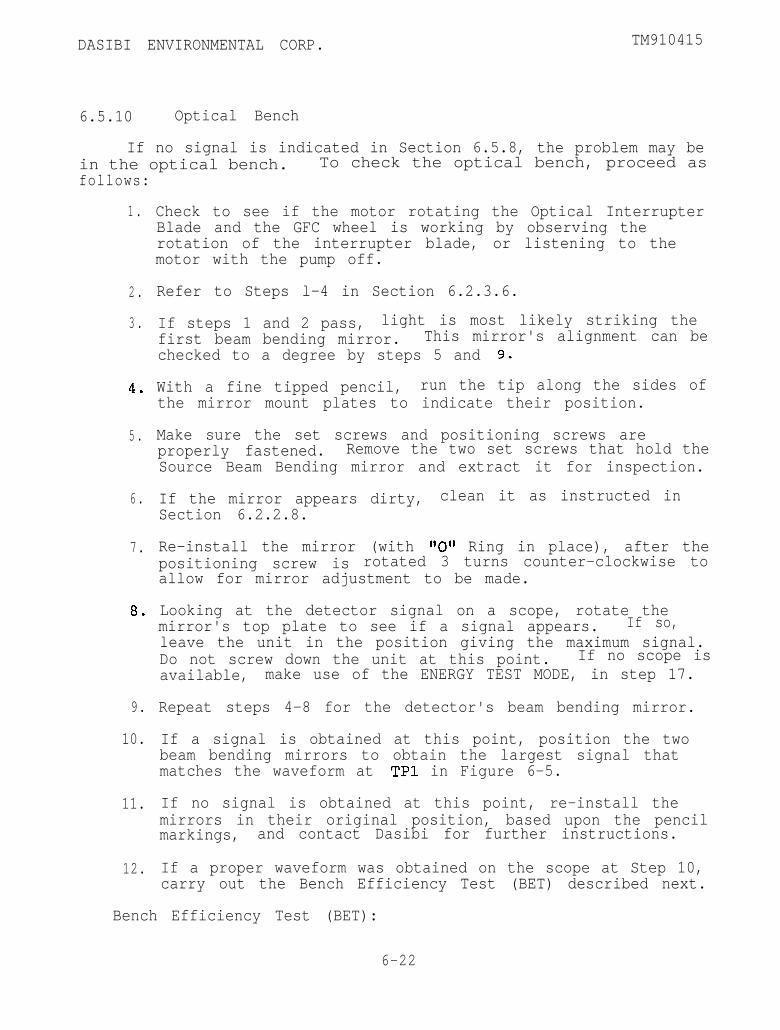
DASIBI ENVIRONMENTAL CORP. TM910415
6.5.10 Optical Bench
If no signal is indicated in Section 6.5.8, the problem may bein the optical bench. To check the optical bench, proceed asfollows:
1 .
2 .
3 .
4.
5 .
6 .
7.
8.
9. Repeat steps 4-8 for the detector's beam bending mirror.
10.
11.
12.
Check to see if the motor rotating the Optical InterrupterBlade and the GFC wheel is working by observing therotation of the interrupter blade, or listening to themotor with the pump off.
Refer to Steps l-4 in Section 6.2.3.6.
If steps 1 and 2 pass, light is most likely striking thefirst beam bending mirror. This mirror's alignment can bechecked to a degree by steps 5 and 9.
With a fine tipped pencil, run the tip along the sides ofthe mirror mount plates to indicate their position.
Make sure the set screws and positioning screws areproperly fastened. Remove the two set screws that hold theSource Beam Bending mirror and extract it for inspection.
If the mirror appears dirty, clean it as instructed inSection 6.2.2.8.
Re-install the mirror (with 11011 Ring in place), after thepositioning screw is rotated 3 turns counter-clockwise toallow for mirror adjustment to be made.
Looking at the detector signal on a scope, rotate themirror's top plate to see if a signal appears. If so,leave the unit in the position giving the maximum signal.Do not screw down the unit at this point. If no scope isavailable, make use of the ENERGY TEST MODE, in step 17.
If a signal is obtained at this point, position the twobeam bending mirrors to obtain the largest signal thatmatches the waveform at TPl in Figure 6-5.
If no signal is obtained at this point, re-install themirrors in their original position, based upon the pencilmarkings, and contact Dasibi for further instructions.
If a proper waveform was obtained on the scope at Step 10,carry out the Bench Efficiency Test (BET) described next.
Bench Efficiency Test (BET):
6-22
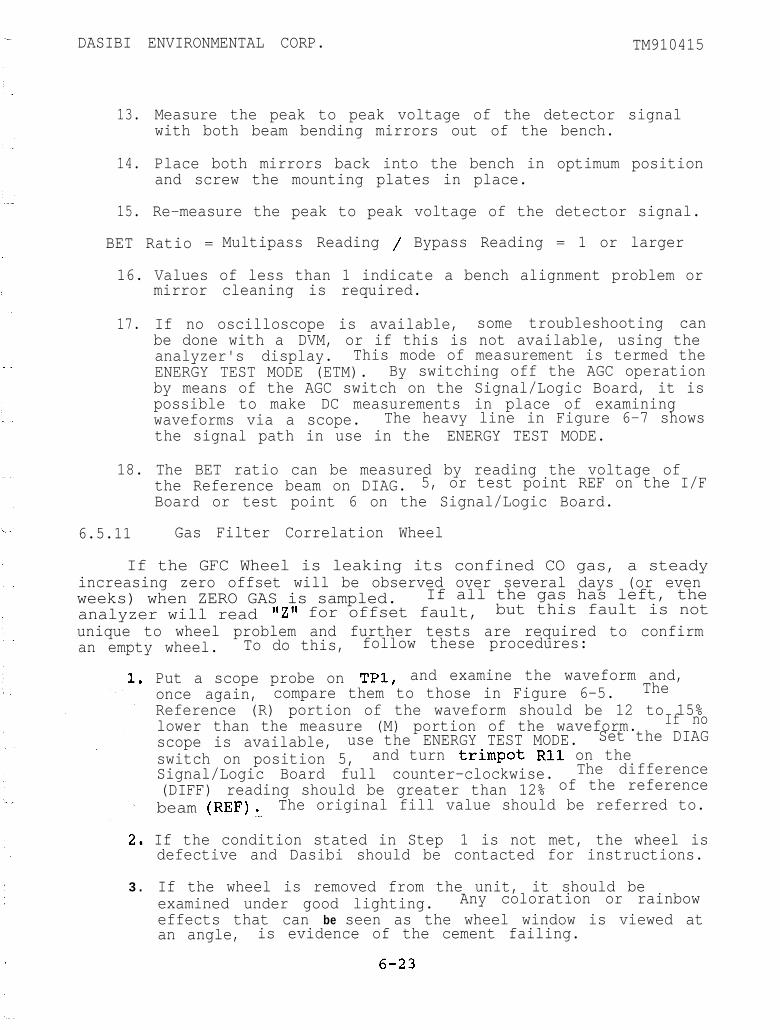
DASIBI ENVIRONMENTAL CORP. TM910415
13.
14.
15.
Measure the peak to peak voltage of the detector signalwith both beam bending mirrors out of the bench.
Place both mirrors back into the bench in optimum positionand screw the mounting plates in place.
Re-measure the peak to peak voltage of the detector signal.
BET Ratio = Multipass Reading / Bypass Reading = 1 or larger
16. Values of less than 1 indicate a bench alignment problem ormirror cleaning is required.
17. If no oscilloscope is available, some troubleshooting canbe done with a DVM, or if this is not available, using theanalyzer's display. This mode of measurement is termed theENERGY TEST MODE (ETM). By switching off the AGC operationby means of the AGC switch on the Signal/Logic Board, it ispossible to make DC measurements in place of examiningwaveforms via a scope. The heavy line in Figure 6-7 showsthe signal path in use in the ENERGY TEST MODE.
18. The BET ratio can be measured by reading the voltage ofthe Reference beam on DIAG. 5, or test point REF on the I/FBoard or test point 6 on the Signal/Logic Board.
6.5.11 Gas Filter Correlation Wheel
If the GFC Wheel is leaking its confined CO gas, a steadyincreasing zero offset will be observed over several days (or evenweeks) when ZERO GAS is sampled. If all the gas has left, theanalyzer will read *???* for offset fault, but this fault is notunique to wheel problem and further tests are required to confirman empty wheel. To do this, follow these procedures:
. Put a scope probe on TPl, and examine the waveform and,once again, compare them to those in Figure 6-5. TheReference (R) portion of the waveform should be 12 to 15%lower than the measure (M) portion of the waveform. If noscope is available, use the ENERGY TEST MODE. Set the DIAGswitch on position 5, and turn trimpot Rll on theSignal/Logic Board full counter-clockwise. The difference(DIFF) reading should be greater than 12% of the referencebeam (REF),. The original fill value should be referred to.
Ir* If the condition stated in Step 1 is not met, the wheel isdefective and Dasibi should be contacted for instructions.
3. If the wheel is removed from the unit, it should beexamined under good lighting. Any coloration or rainboweffects that can be seen as the wheel window is viewed atan angle, is evidence of the cement failing.
6-23
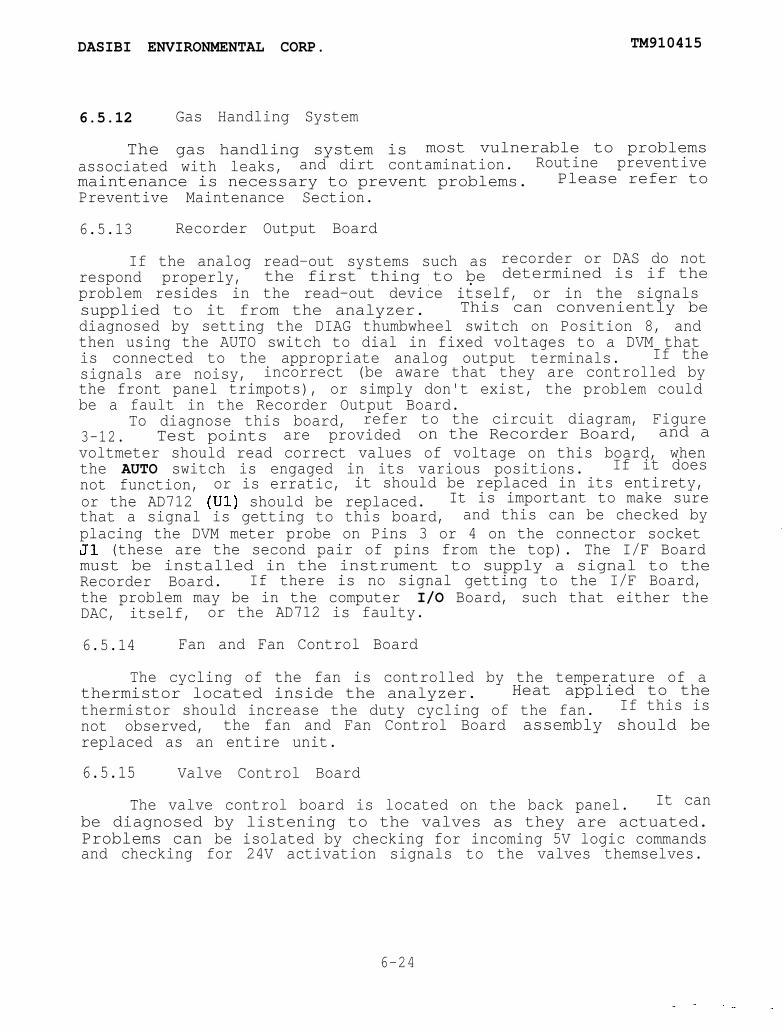
DASIBI ENVIRONMENTAL CORP. TM910415
6.5.12 Gas Handling System
The gas handling system is most vulnerable to problemsassociated with leaks, and dirt contamination. Routine preventivemaintenance is necessary to prevent problems. Please refer toPreventive Maintenance Section.
6.5.13 Recorder Output Board
If the analog read-out systems such asrespond properly, the first thing to be. .
recorder or DAS do notdetermined is if the
problem resides in the read-out device itself, or in the signalssupplied to it from the analyzer. This can conveniently bediagnosed by setting the DIAG thumbwheel switch on Position 8, andthen using the AUTO switch to dial in fixed voltages to a DVM thatis connected to the appropriate analog output terminals. If thesignals are noisy, incorrect (be aware that they are controlled bythe front panel trimpots), or simply don't exist, the problem couldbe a fault in the Recorder Output Board.
To diagnose this board, refer to the circuit diagram, Figure3-12. Test points are provided on the Recorder Board, and avoltmeter should read correct values of voltage on this board, whenthe AUTO switch is engaged in its various positions. If it doesnot function, or is erratic, it should be replaced in its entirety,or the AD712 (Ul) should be replaced. It is important to make surethat a signal is getting to this board, and this can be checked byplacing the DVM meter probe on Pins 3 or 4 on the connector socketJl (these are the second pair of pins from the top). The I/F Boardmust be installed in the instrument to supply a signal to theRecorder Board. If there is no signal getting to the I/F Board,the problem may be in the computer I/O Board, such that either theDAC, itself, or the AD712 is faulty.
6.5.14 Fan and Fan Control Board
The cycling of the fan is controlled by the temperature of athermistor located inside the analyzer. Heat applied to thethermistor should increase the duty cycling of the fan. If this isnot observed, the fan and Fan Control Board assembly should bereplaced as an entire unit.
6.5.15 Valve Control Board
The valve control board is located on the back panel. It canbe diagnosed by listening to the valves as they are actuated.Problems can be isolated by checking for incoming 5V logic commandsand checking for 24V activation signals to the valves themselves.
6-24
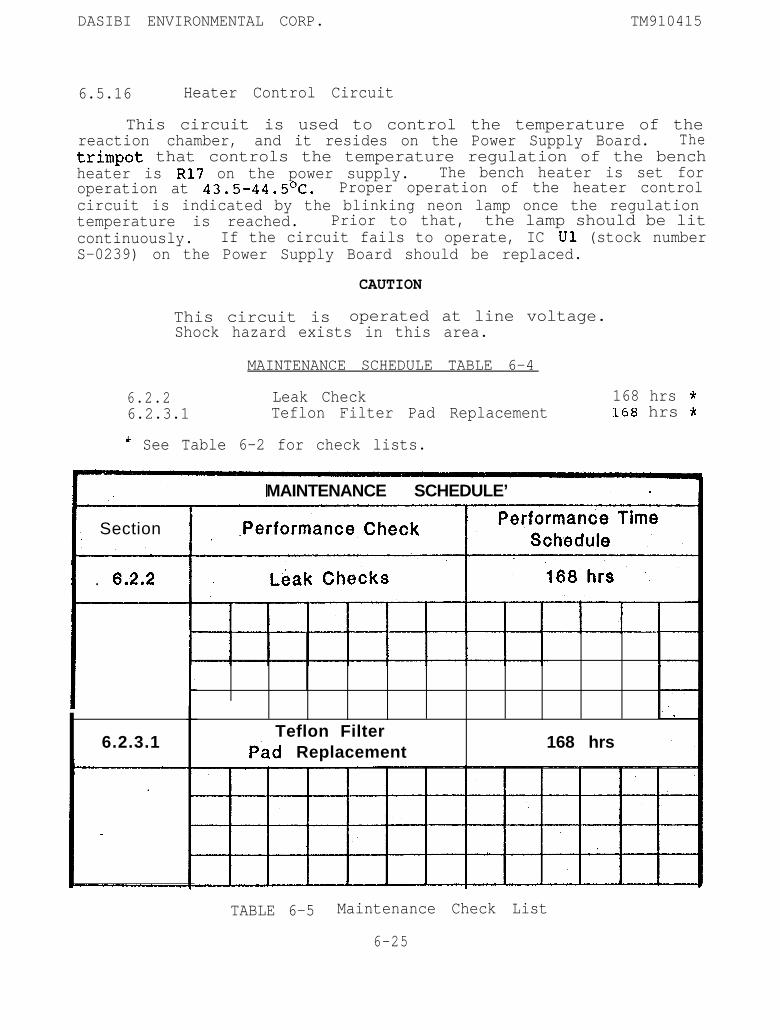
DASIBI ENVIRONMENTAL CORP. TM910415
6.5.16 Heater Control Circuit
This circuit is used to control the temperature of thereaction chamber, and it resides on the Power Supply Board. Thetrimpot that controls the temperature regulation of the benchheater is R17 on the power supply. The bench heater is set foroperation at 43.5-44.5OC. Proper operation of the heater controlcircuit is indicated by the blinking neon lamp once the regulationtemperature is reached. Prior to that, the lamp should be litcontinuously. If the circuit fails to operate, IC Ul (stock numberS-0239) on the Power Supply Board should be replaced.
CAUTION
This circuit is operated at line voltage.Shock hazard exists in this area.
MAINTENANCE SCHEDULE TABLE 6-4
6.2.2 Leak Check6.2.3.1 Teflon Filter Pad Replacement
* See Table 6-2 for check lists.
168 hrs *168 hrs *
Section
. 6.2.2
6.2.3.1
MAINTENANCE SCHEDULE’
Teflon FilterPad Replacement 168 hrs
TABLE 6-5 Maintenance Check List
6-25
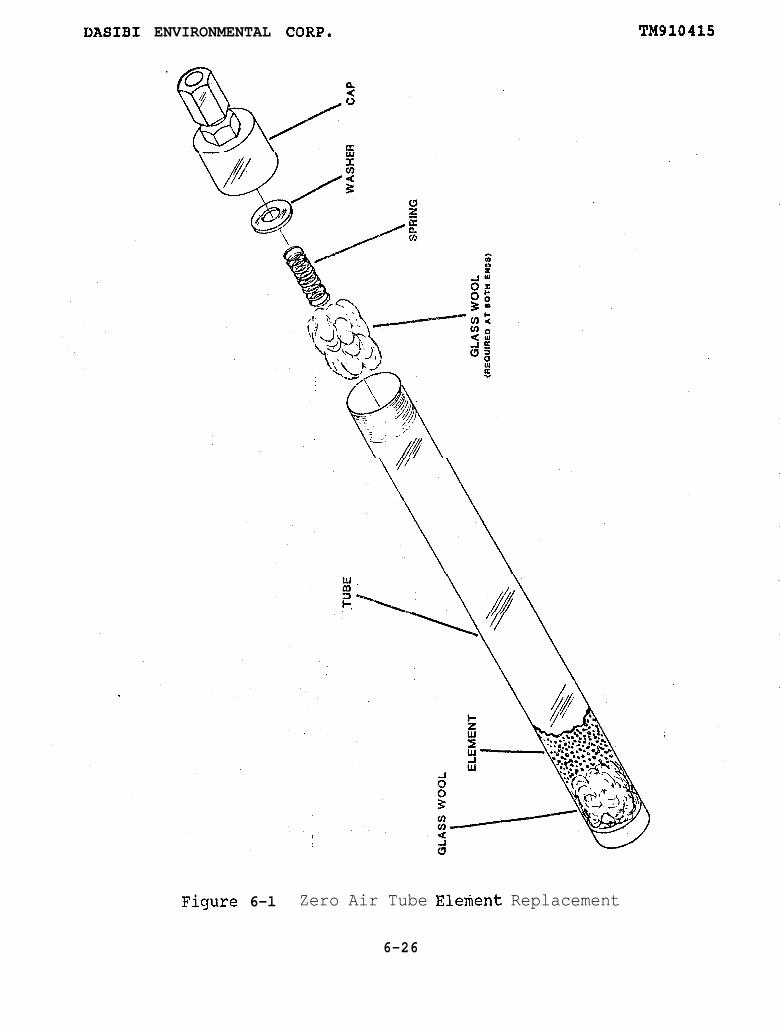
BASIBI ENVIRONMENTAL CORP, TM610415
sFigure 6-l Zero Air Tube Elefient Replacement
6-26
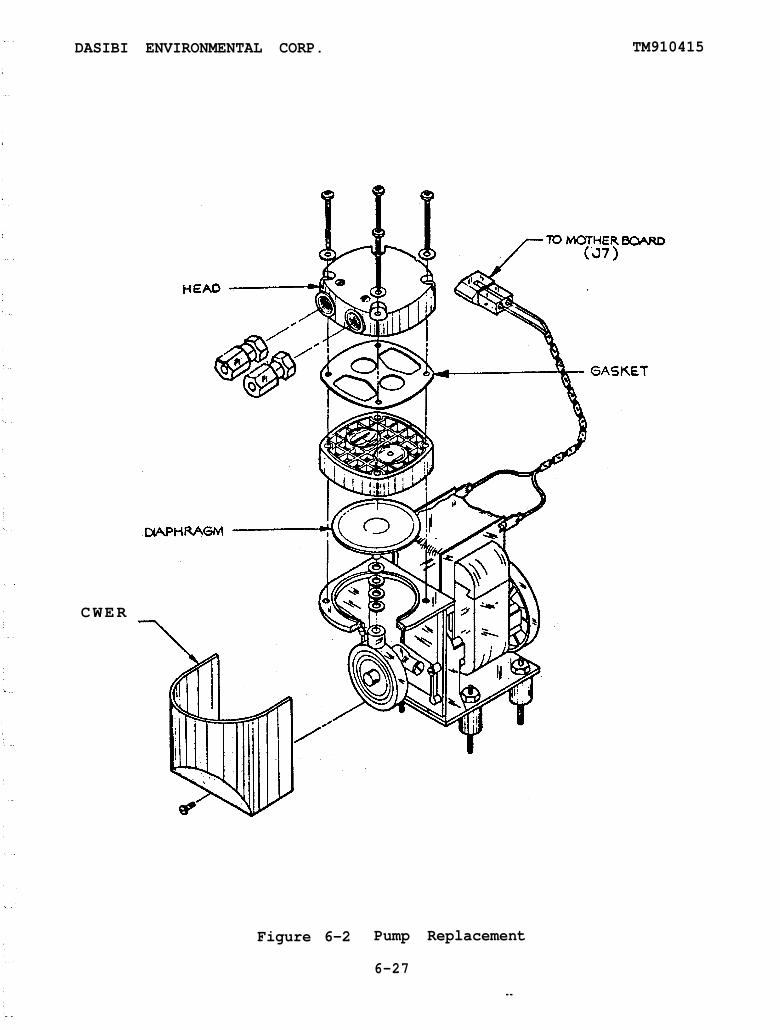
DASIBI ENVIRONMENTAL CORP. TM910415
CWER
Figure 6-2 Pump Replacement
6-27--

TM910415DASIBI ENVIRONMENTAL CORP.
I I
--
E-PROM
cu + IReplacement
II
3 ;
‘I
Ii
I--------c(IxII-
Figure 6-3 E-PROM Replacement
6-28
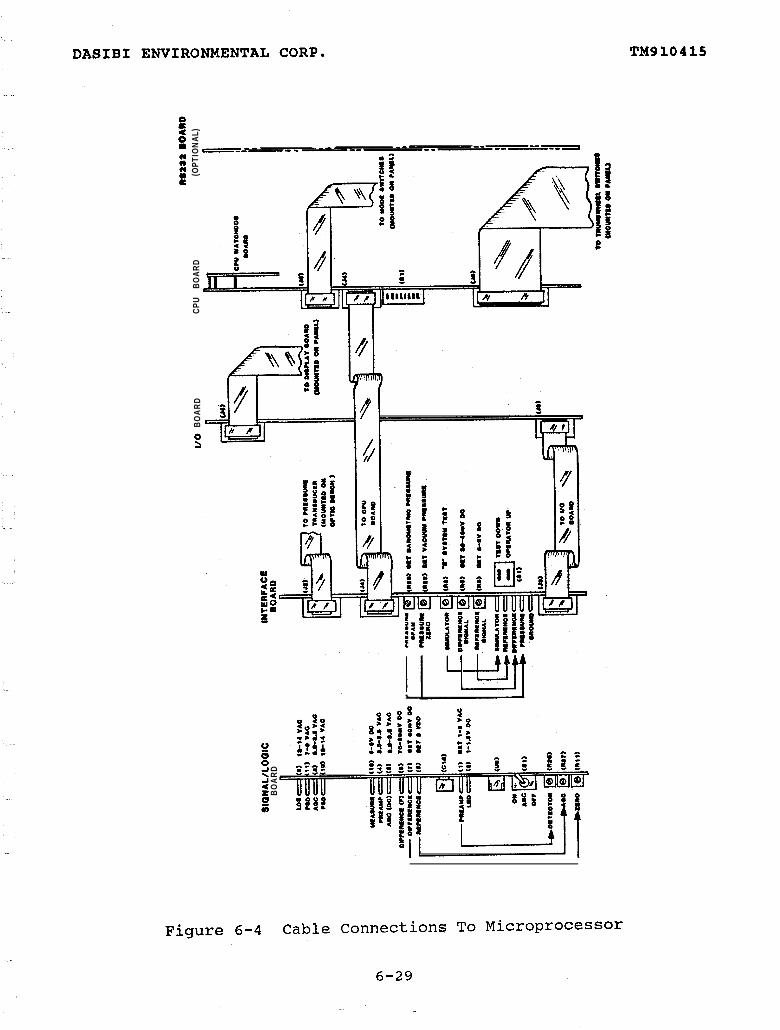
SIQ
NA
L/LO
QlC
BOAR
D
r
vo
BOA
RDCP
U BO
ARD
w2a
2 D
OARO
(OPT
IONA
L)
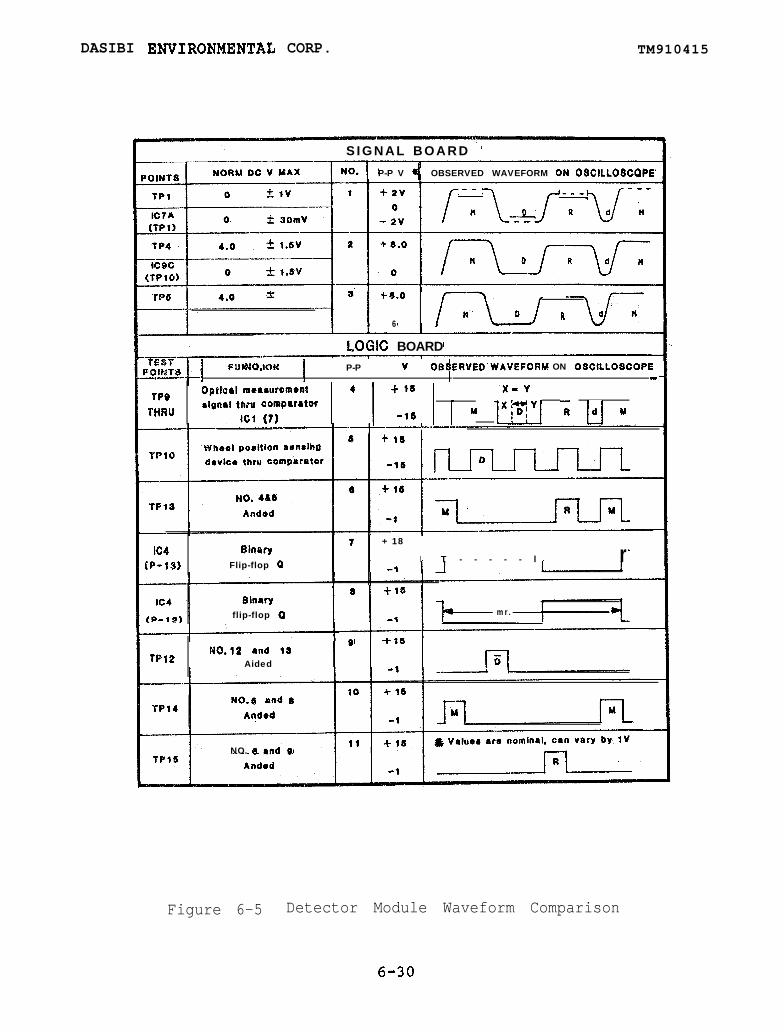
DASIBI ENVIRONMENTAG CORP. TM910415
S I G N A L B O A R D ’
P-P V 4 OBSERVED WAVEFORM ON O3Cll.LO8COPE
+a.0
R6
LOGIC: BOARDIESVPOI#T8 . FSOBdCflC)I! MO. ! P-P V !OQSERVED‘WAVEFORM ON OSC?LLOSCOPE-u_- .-
HP@Optical msarursment
TMRUrlgnal thou compw8tor
IC1 (?I1 ’ 1 “:: 1 1 M ,$+, .R u M
IC4(P-13)
airmyFlip-flop B
+ 18
I T - - - - - l rBlmry
flip-flop 0 mr.
@
NQ.12 rnd larrt2 Aided
NO. 0 8nd Q
Figure 6-5 Detector Module Waveform Comparison
6-30
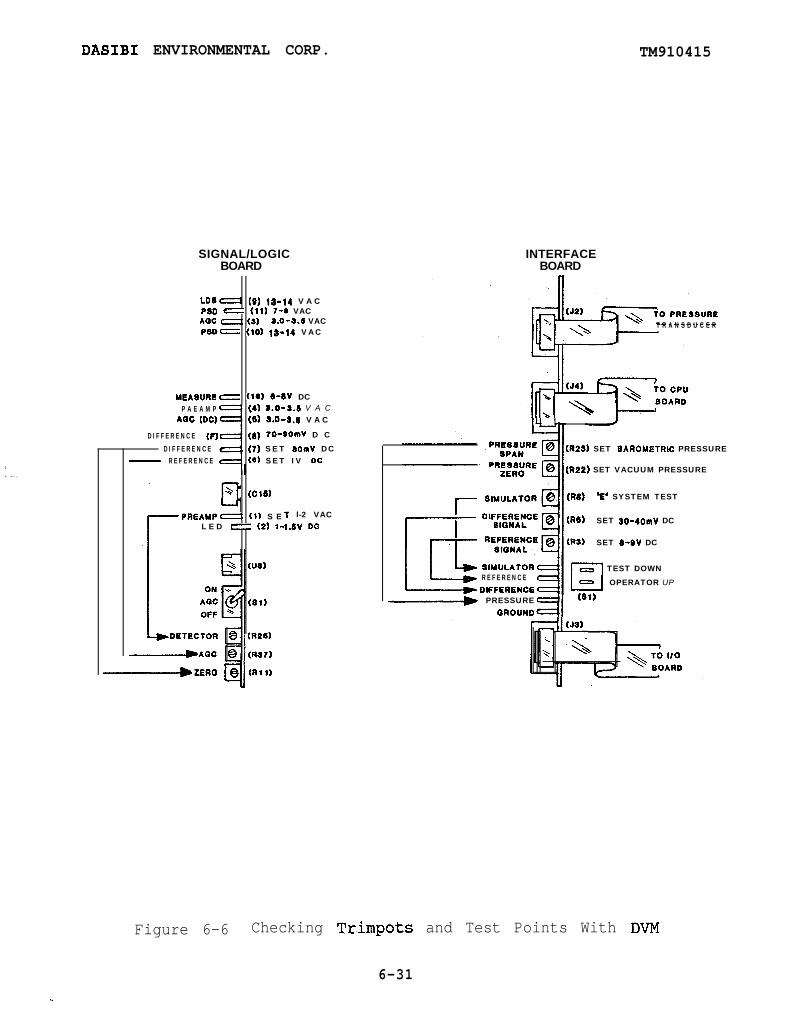
DASIBI ENVIRONMENTAL CORP.
SIGNAL/LOGICBOARD
LOSc==t (01 10-14 V A CPI0 c=z (111 t-0 VAC
AQC GI (31 9.0-5.6 VACPSDC (10) 13-14 VAC
MEASURE= (10) 6-8V DCP A E A M P (4) 3.0-3.6 V A C
AQC (DC) (S) ~.6-S.6 V A C
D I F F E R E N C E (F) (8) 70-*OmV D CD I F F E R E N C E (7) SET bOmV DC
- R E F E R E N C E (8) SET IV DC
(Cl61
PREAMPGZ=b (1) S EL E D = (2) l-
-ZERO Q (Rll)q
T l-2 VAC1.6V DO
TM910415
INTERFACEBOARD
T R A N S D U C E R
R E F E R E N C EOIFFERENCE
1___1_) PRESSURE
(R21)) SET BAROMETRH: PRESSURE
(RPP) SET VACUUM PRESSURE
(RIB) ‘E’ SYSTEM TEST
(RO) SET 30-4OmV DC
tRS) SET O-OV DC
/=I TEST DOWN
I OPERATOR UP
CSl)
Figure 6-6 Checking Trimpots and Test Points With DVM
6-31_. --
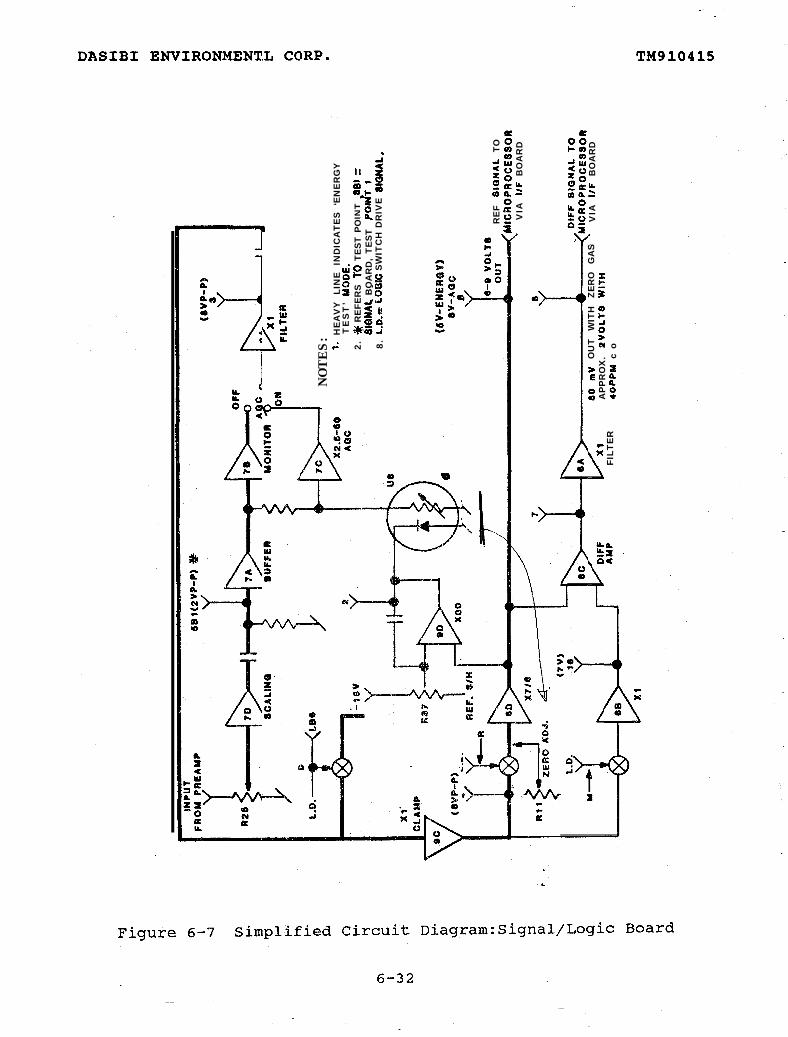
NOTES:
3.
HEA
VY
LI
NE
IND
ICA
TES
‘EN
ERG
YT
ES
T’
YQ
DE
.2.
$jf
REF
ERS
TO
TEST
PO
INT
8BI
=Sl
QNAL
BO
AR
D,
TEST
P
Od
T v
--
8. L
O*=
LOQI
C S
WIT
CH
DR
IVE
SM
MA
L.
t6V
-EN
ER
QY
)B
Y-A
OC
II
REF
S
IQN
AL
TOM
lGR
OP
RO
CE
SS
cjR
VIA
I/
F B
OA
RD
FILT
ER
80
mV
O
UT
WIT
H
ZER
O
GA
SV
IA
I/F
B
OA
RD
APP
RO
X.
ZV
OLT
S
WlT
H4
OP
PU
co
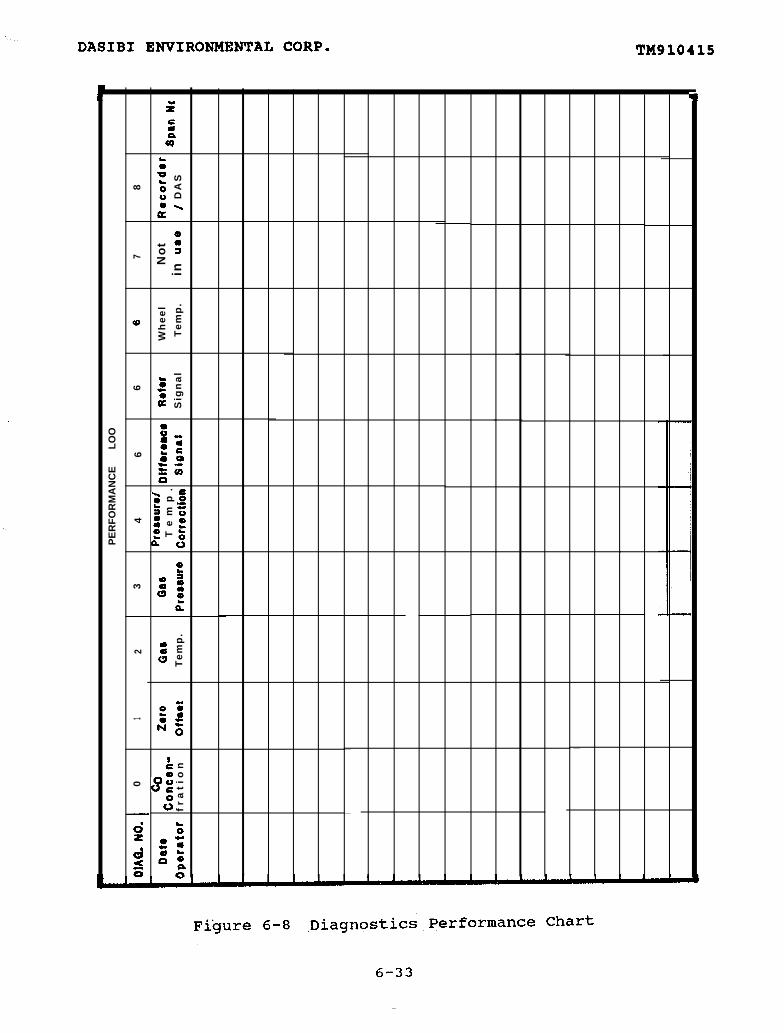
/i
PE
RF
OR
MA
NC
E
LO
O
DIA
Q,
NO
.0
12
34
66
67
8
Pre
rou
ral
Dat
ec
oC
on
ce
n-
Zer
oQ
a8Q
a8T
em
p.
Dif
fore
ne
o R
efer
Wh
ee
lN
otR
ecord
or
Op
era
tor
f
ra
tio
nO
ff8et
Te
mp
.P
re88
ure
C
orr
ectio
n
Sig
na
lS
ign
al
Te
mp
.in
~8
0/
DA
S8p
an N
c
II I
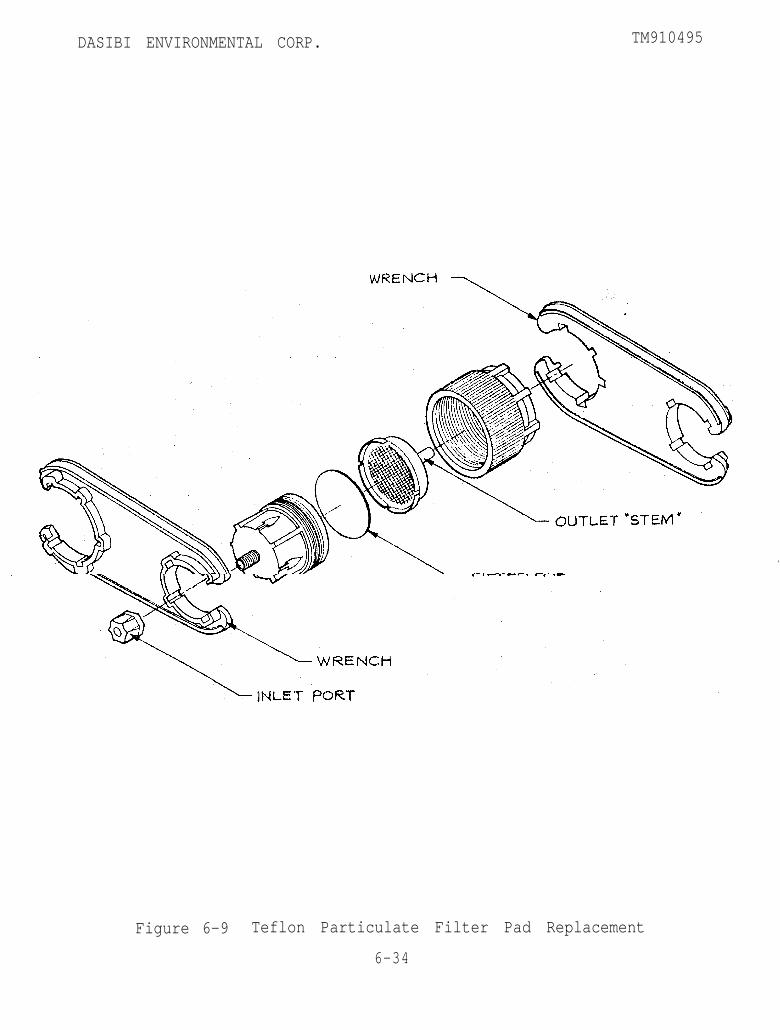
DASIBI ENVIRONMENTAL CORP. TM910495
Figure 6-9 Teflon Particulate Filter Pad Replacement
6-34
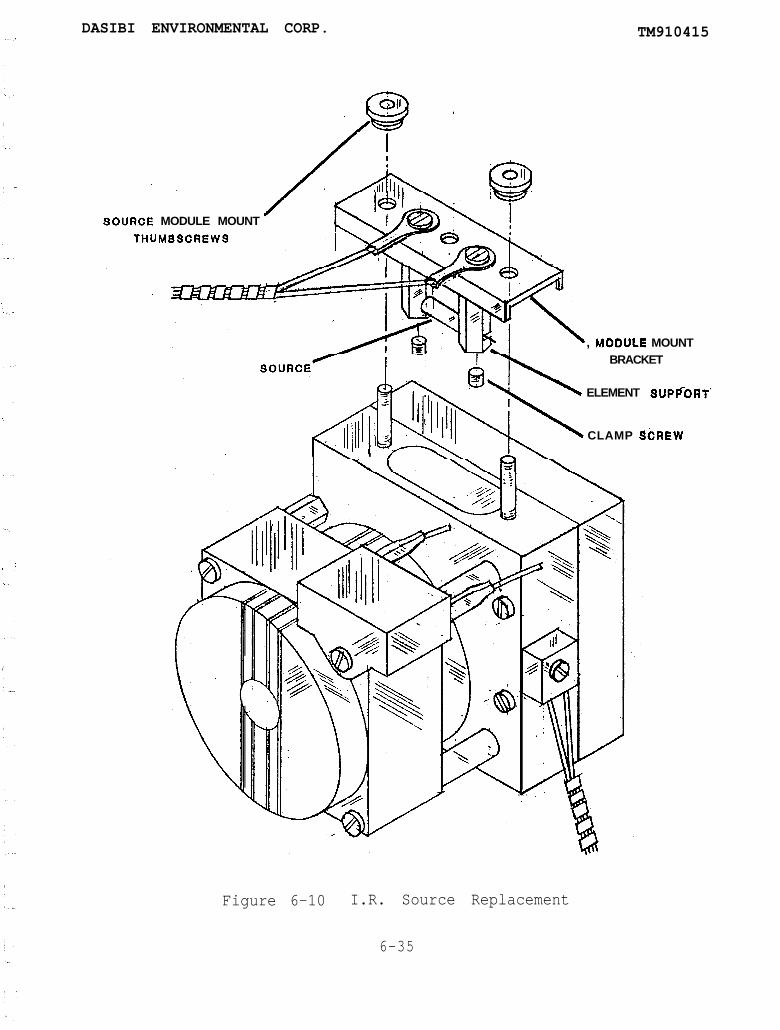
DASIBI ENVIRONMENTAL CORP. TM910415
MODULE MOUNTMBSCREWS
, MCDULE MOUNTBRACKET
ELEMENT 8UF+4OR
CLAMP BbREW
Figure 6-10 I.R. Source Replacement
6-35
T’
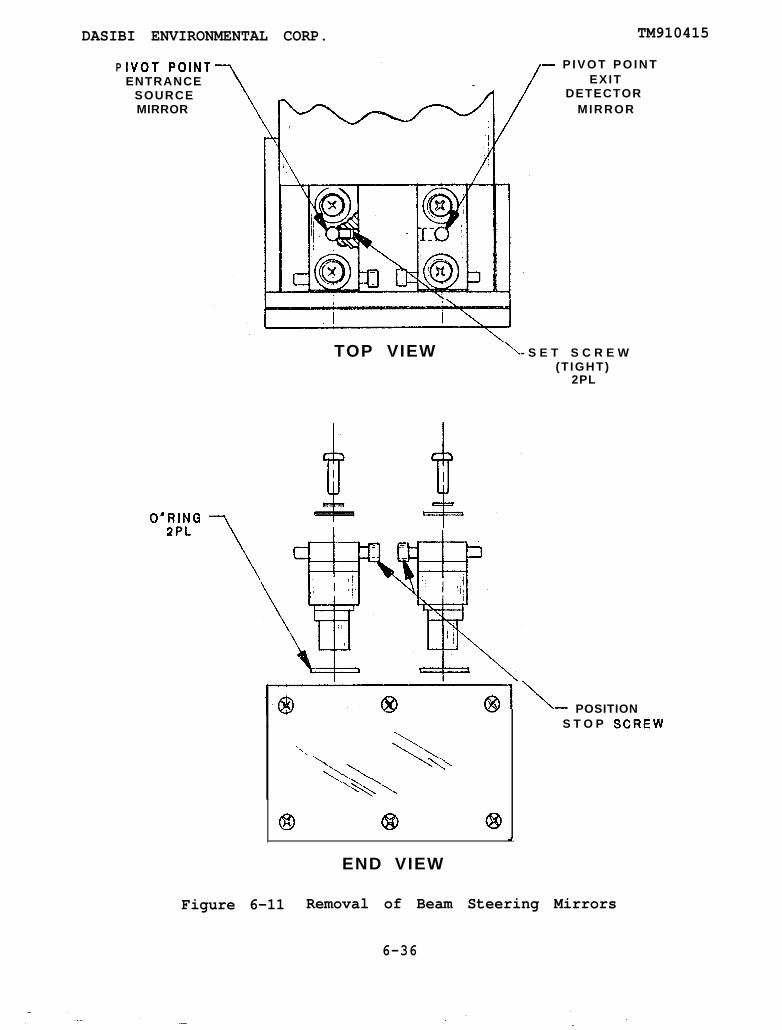
DASIBI ENVIRONMENTAL CORP. TM910415
P IVOT POiNTENTRANCE
SOURCEMIRROR
O’RING2PL
P I V O T P O I N TEXIT
DETECTORMIRROR
TOP VIEW - S E T S C R E W(T IGHT)
2PL
7
\
‘1..\\\
+A\\\‘\
END VIEW
-\-
d
POSITIONS T O P SCRiW
Figure 6-11 Removal of Beam Steering Mirrors
6-36

DASIBI ENVIRONMENTAL CORP. TM910415
CHECK BENCH HEATER , FAN. FAN CONTROL,SENSORB
PROM FAIL
FLASHINGMESBAOES DIAONOSTICS
Figure 6-12 Flow Diagram of Troubleshooting
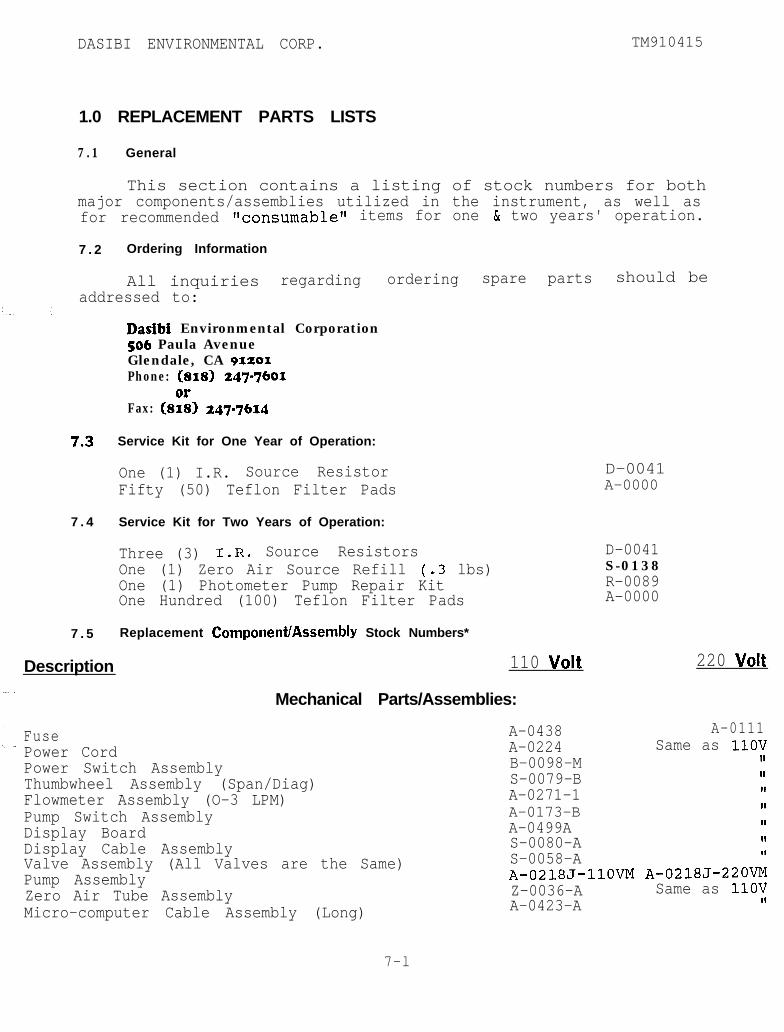
DASIBI ENVIRONMENTAL CORP. TM910415
1.0 REPLACEMENT PARTS LISTS
7.1 General
This section contains a listing of stock numbers for bothmajor components/assemblies utilized in the instrument, as well asfor recommended Wonsumablell items for one & two years' operation.
7 . 2 Ordering Information
All inquiries regarding ordering spareaddressed to:
7 . 4
7 . 5
Dasibi Environmental Corporation506 Paula AvenueGlendale, CA 91201Phone: (818) 247-7601
Or
Fax: (818) 247-7614
Service Kit for One Year of Operation:
One (1) I.R. Source ResistorFifty (50) Teflon Filter Pads
Service Kit for Two Years of Operation:
Three (3) I.R. Source ResistorsOne (1) Zero Air Source Refill (.3 lbs)One (1) Photometer Pump Repair KitOne Hundred (100) Teflon Filter Pads
Replacement ComponentiAssembly Stock Numbers*
parts should be
Description 110 Volt
D-0041 jA-0000
D-0041S-0138R-0089A-0000
Mechanical Parts/Assemblies:
FusePower CordPower Switch AssemblyThumbwheel Assembly (Span/Diag)Flowmeter Assembly (O-3 LPM)Pump Switch AssemblyDisplay BoardDisplay Cable AssemblyValve Assembly (All Valves are the Same)Pump AssemblyZero Air Tube AssemblyMicro-computer Cable Assembly (Long)
A-0438A-0224B-0098-MS-0079-BA-0271-1A-0173-BA-0499AS-0080-AS-0058-AA-0218J-1lOVMZ-0036-AA-0423-A
220 Volt
A-0111Same as 11OV11
II
II
A-0218J-220VMSame as 11OV1)
7-l
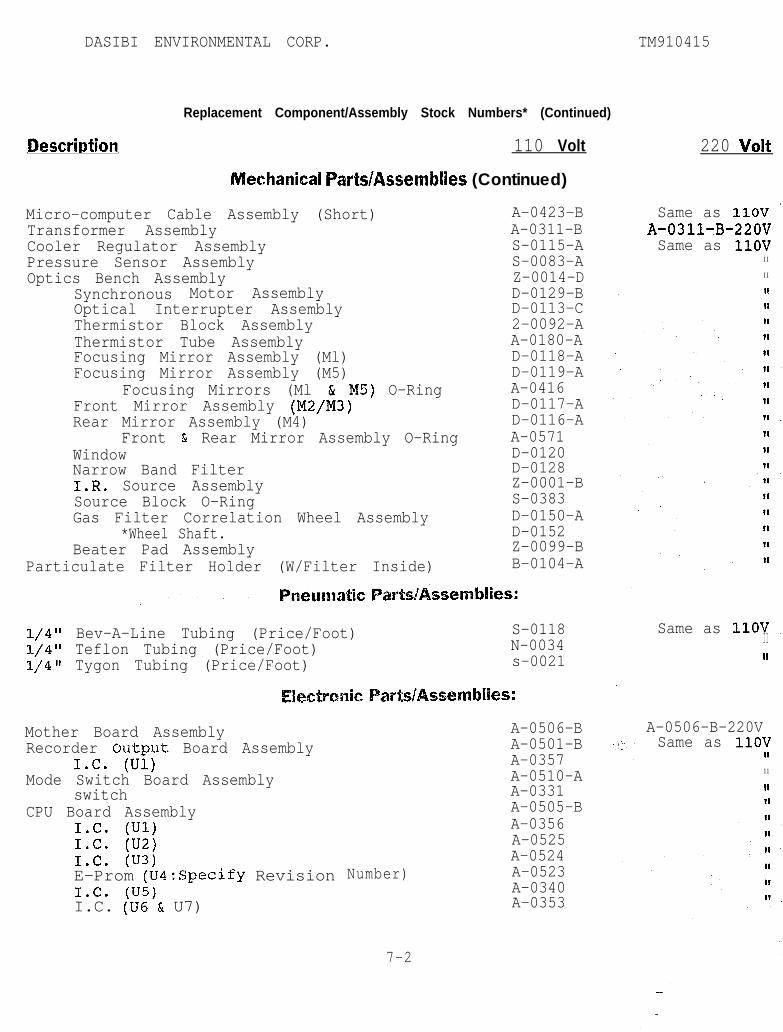
DASIBI ENVIRONMENTAL CORP. TM910415
Replacement Component/Assembly Stock Numbers* (Continued)
Dewription 110 Volt
Nkchanical Parts/AssembIies (Continued)
Micro-computer Cable Assembly (Short)Transformer AssemblyCooler Regulator AssemblyPressure Sensor AssemblyOptics Bench Assembly
Synchronous Motor AssemblyOptical Interrupter AssemblyThermistor Block AssemblyThermistor Tube AssemblyFocusing Mirror Assembly (Ml)Focusing Mirror Assembly (M5)
Focusing Mirrors (Ml & M5) O-RingFront Mirror Assembly (M2/M3)Rear Mirror Assembly (M4)
Front & Rear Mirror Assembly O-RingWindowNarrow Band FilterI.R. Source AssemblySource Block O-RingGas Filter Correlation Wheel Assembly
*Wheel Shaft.Beater Pad Assembly
Particulate Filter Holder (W/Filter Inside)
A-0423-BA-0311-BS-0115-AS-0083-AZ-0014-DD-0129-BD-0113-C2-0092-AA-0180-AD-0118-AD-0119-AA-0416D-0117-AD-0116-AA-0571D-0120D-0128Z-0001-BS-0383D-0150-AD-0152Z-0099-BB-0104-A
l/4" Bev-A-Line Tubing (Price/Foot) S-0118l/4" Teflon Tubing (Price/Foot) N-0034114 It Tygon Tubing (Price/Foot) s-0021
arts/Assemblies:
Mother Board AssemblyRecorder Ou,tput Board Assembly
I.C. (Ul)Mode Switch Board Assembly
switchCPU Board Assembly
I.C. (Ul)1.61. (U2)I.C. (U3)E-Prom (U4rSpecify RevisionI.C. (U5)I.C. (UC; & U7)
Number)
A-0506-BA-0501-BA-0357A-0510-AA-0331A-0505-BA-0356A-0525A-0524A-0523A-0340A-0353
220 Volt
Same as 11OV "A-03119B-220VSame as 1lOV
I I
I I
18
II
Same as 11OV _I III
A-0506-B-220VSame as 1lOVII
1 1
11
7-2
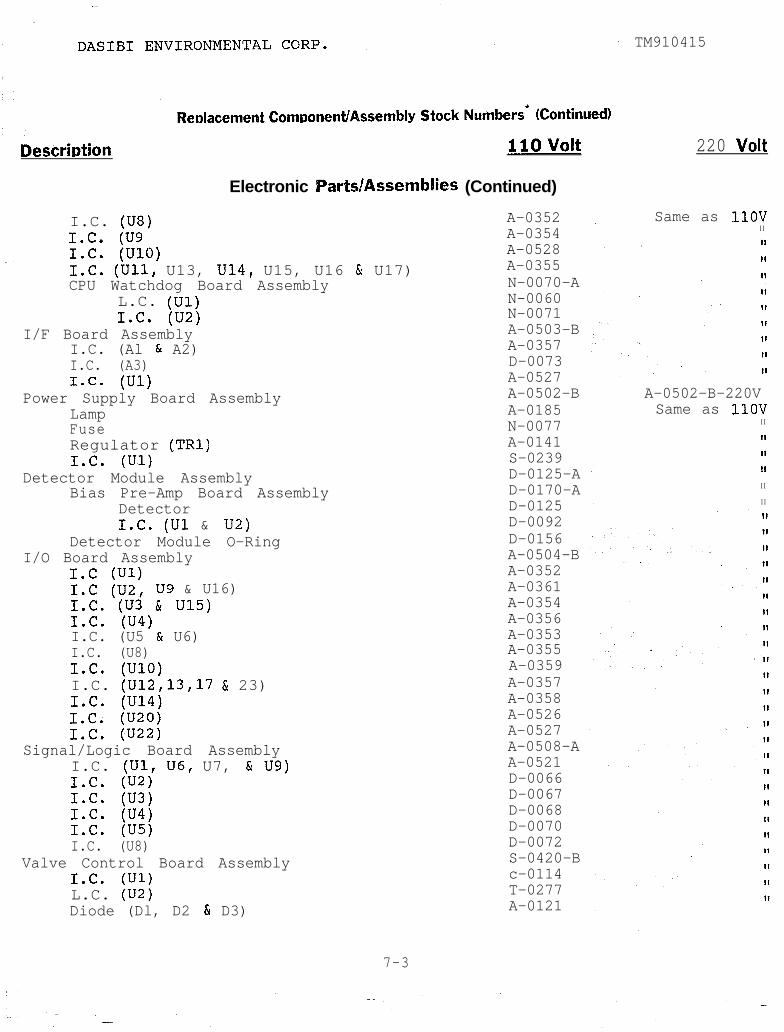
DescriDtion
Electronic PartslAssembllies (Continued)
I.C. (U8)I.C. (U9I.C. (UlO)I.C.. (Ull, U13, U14, U15, U16 & U17)CPU Watchdog Board Assembly
L.C. (Ul)I.C. (U2)
I/F Board AssemblyI.C. (Al & A2)I.C. (A3)I.C. (Ul)
Power Supply Board AssemblyLampFuseRegulator (TRl)IIC. (Ul)
Detector Module AssemblyBias Pre-Amp Board Assembly
DetectorI.C. (Ul & U2)
Detector Module O-RingI/O Board Assembly
1.c (Ul)1.c (U2, U9 & U16)I.C. (U3 & U15)I.C. (U4)I.C. (U5 & U6)I.C. (U8)I.C. (UlO)I.C. (U12,13,17 & 23)I.C. (U14)I.C. (U20)I.C. (U22)
Signal/Logic Board AssemblyI.C. (Ul, U6, U7, & U9)I.C. (U2)I.C. (U3)I.C. (U4)I.C. (U5)I.C. (U8)
Valve Control Board AssemblyI.C. (Ul)L.C. (U2)Diode (Dl, D2 & D3)
A-0352A-0354A-0528A-0355N-0070-AN-0060N-0071A-0503-BA-0357D-0073A-0527A-0502-BA-0185N-0077A-0141S-0239D-0125-AD-0170-AD-0125D-0092D-0156A-0504-BA-0352A-0361A-0354A-0356A-0353A-0355A-0359A-0357A-0358A-0526A-0527A-0508-AA-0521D-0066D-0067D-0068D-0070D-0072S-0420-Bc-0114T-0277A-0121
7-3
TM910415
220 Volt
Same as 11OVI I
A-0502-B-220VSame as 11OV
I I
II
II
II
I I
1 1
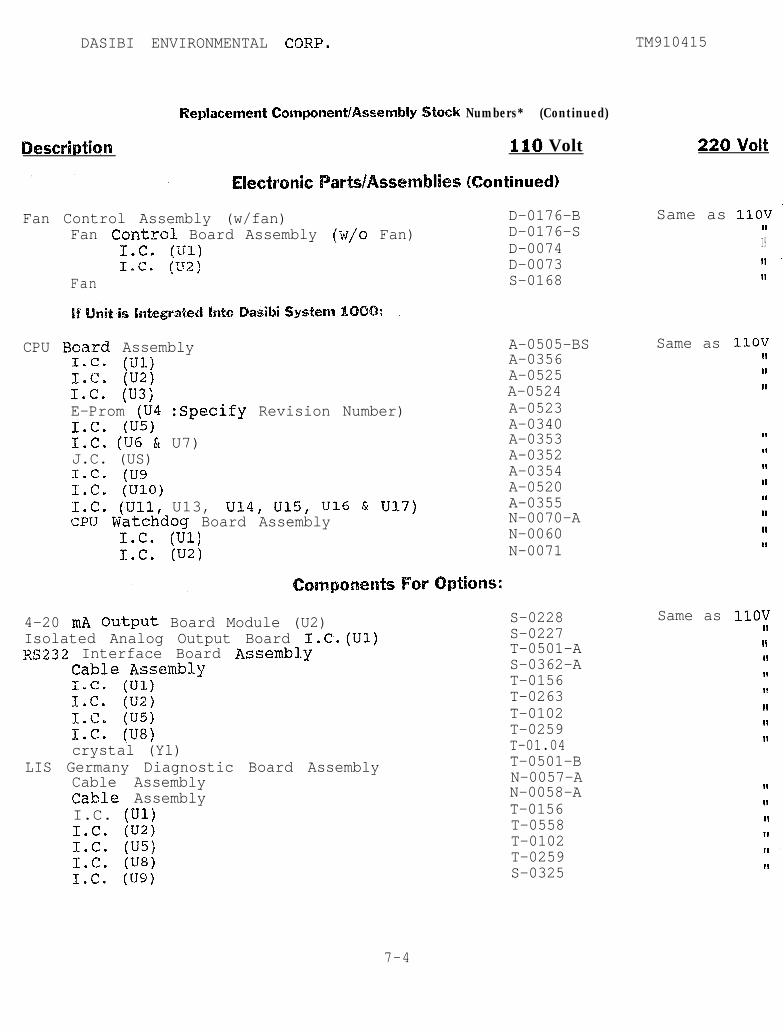
DASIBI ENVIRONMENTAL CQRP. TM910415
Numbers* (Continued)
Description
Fan Control Assembly (w/fan)Fan Cord-xoh Board Assembly (w/o Fan)
I*C. (Ul)I*C. (U2)
Fan
CPU Bmrd AssemblyI.C, (Ul)ImC* (U2)X.C. (U3)E-Prom (U4 :Specify Revision Number)I.C. (U5)I.C, (U6 ii U7)J.C. (US)S.C. (119I.C. (UZO)I.C. (Ull, U13, u14, u15, UlG & Ul7)CPlJ Watchdoy Board Assembly
I.C. (Ul)I.C. (K?)
Pi0 Volt
IContinued)
4-20 mA Butput Board Module (U2)Isolated Analog Output Board I.C.(Ul)RS232 Interface Board AssembIy
Cable AssemklyIYC, (Ul)I.@. (U2)x.c* (U5)I.C* (US)crystal (Yl)
LIS Germany Diagnostic Board AssemblyCable AssemblyCable AssemblyI.C. (Ul)I.C. (U2)I.C. (U5)I.C. (U8)I.C. (U9)
D-0176-BD-0176-SD-0074D-0073S-0168
A-0505-BSA-0356A-0525A-0524A-0523A-0340A-0353A-0352A-0354A-0520A-0355N-0070-AN-0060N-0071
S-0228S-0227T-0501-AS-0362-AT-0156T-0263T-0102T-0259T-01.04T-0501-BN-0057-AN-0058-AT-0156T-0558T-0102T-0259S-0325
220 Volt
Same as 11OV 'III 9II ’
11
Same as 11OVre
II
19
99
11
99
19
I9
99
Same as 11OV99
99
99
99
11 dI9
99
11
1199
99
7-4
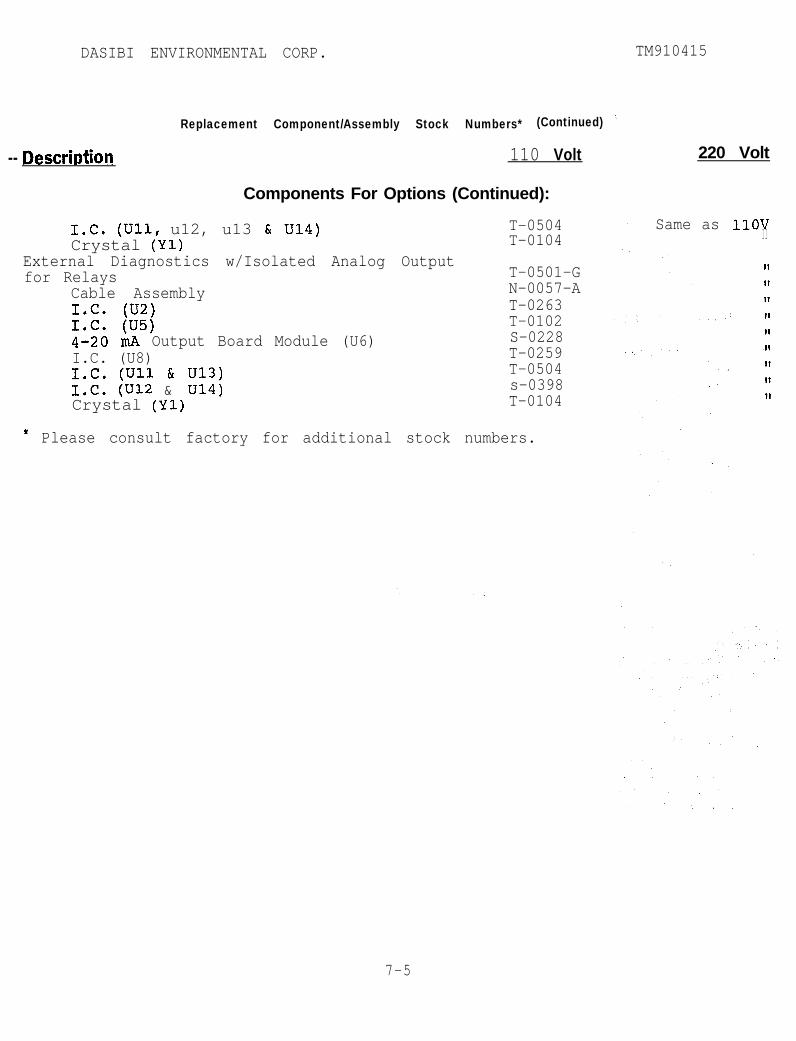
DASIBI ENVIRONMENTAL CORP. TM910415
Replacement Component/Assembly Stock Numbers* (Continued)
-- DescriDtion 110 Volt
Components For Options (Continued):
I.C* (Ull, u12, u13 b U14)Crystal (Yl)
External Diagnostics w/Isolated Analog Outputfor Relays
Cable AssemblyI.C. (U2)I.C. (U5)
T-0504T-0104
4-20 mA Output Board Module (U6)I.C. (U8)I.C. (Ull & U13)I.C. (U12 & U14)Crystal (Yl)
T-0501-GN-0057-AT-0263T-0102S-0228T-0259T-0504s-0398T-0104
* Please consult factory for additional stock numbers.
220 Volt
Same as 11OVI I
7-5

DASIBI ENVIRONMENTAL CORP. TM910415
.
APPENDIX A
INSTRUMENT CALIBRATION
A-l
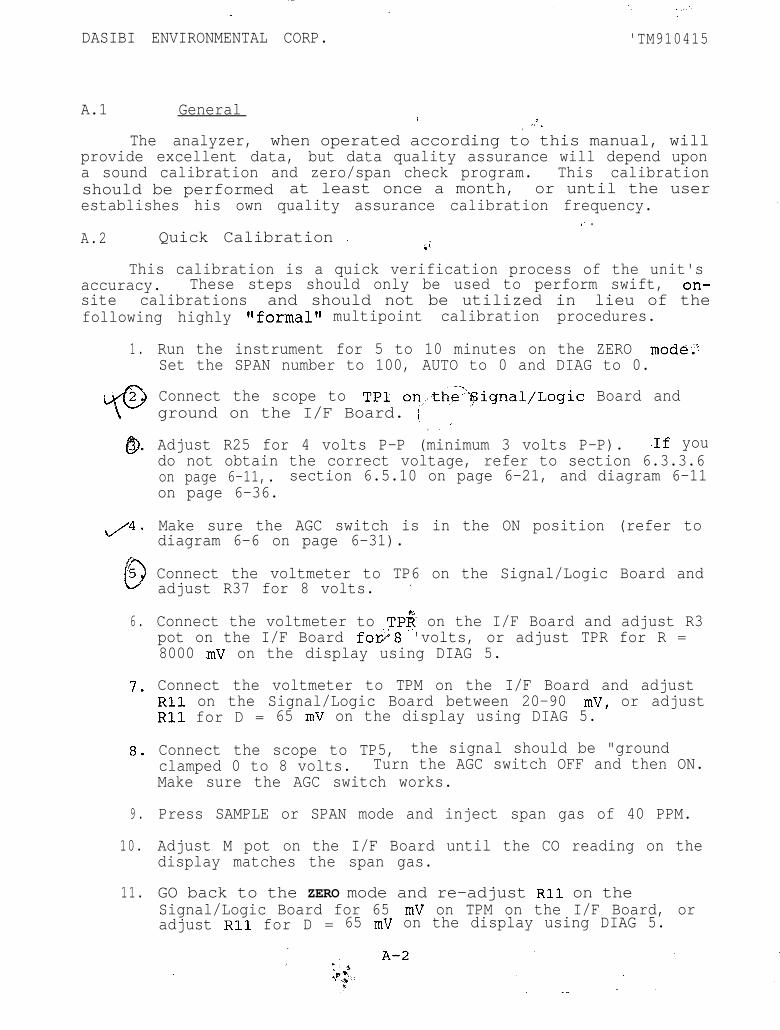
DASIBI ENVIRONMENTAL CORP. 'TM910415
A.1 General 1' :ill -.The analyzer, when operated according to this manual, will
provide excellent data, but data quality assurance will depend upona sound calibration and zero/span check program. This calibrationshould be performed at least once a month, or until the userestablishes his own quality assurance calibration frequency.
.' .A.2 Quick Calibration _ *;
This calibration is a quick verification process of the unit'saccuracy. These steps should only be used to perform swift, on-site calibrations and should not be utilized in lieu of thefollowing highly flformalvl multipoint calibration procedures.
1. Run the instrument for 5 to 10 minutes on the ZERO mode::Set the SPAN number to 100, AUTO to 0 and DIAG to 0.
Connect the scope to TPl on,the“yignal/Logic Board andground on the I/F Board. [ 'c. "
6 .
7.
8.
9 .
10.
11.
Adjust R25 for 4 volts P-P (minimum 3 volts P-P). aIf youdo not obtain the correct voltage, refer to section 6.3.3.6on page 6-11,. section 6.5.10 on page 6-21, and diagram 6-11on page 6-36.
Make sure the AGC switch is in the ON position (refer todiagram 6-6 on page 6-31).
Connect the voltmeter to TP6 on the Signal/Logic Board andadjust R37 for 8 volts. '
Connect the voltmeter to TP$ on the I/F Board and adjust R3pot on the I/F Board fop;8 'volts, or adjust TPR for R =8000 mV on the display using DIAG 5.
Connect the voltmeter to TPM on the I/F Board and adjustRll on the Signal/Logic Board between 20-90 mV, or adjustRll for D = 65 mV on the display using DIAG 5.
Connect the scope to TP5, the signal should be "groundclamped 0 to 8 volts. Turn the AGC switch OFF and then ON.Make sure the AGC switch works.
Press SAMPLE or SPAN mode and inject span gas of 40 PPM.
Adjust M pot on the I/F Board until the CO reading on thedisplay matches the span gas.
GO back to the ZERO mode and re-adjust Rll on theSignal/Logic Board for 65 mV on TPM on the I/F Board, oradjust Rll for D = 65 mV on the display using DIAG 5.

.
DASIBI ENVIRONMENTAL CORP. TM910415
A.3 "ForrnalVt Calibration
Performing a Vformal" calibration on the instrument involvesa;Qcomplete multipoint definition of the analyzer's response toaccurate, reli,able standards over the entire analyzer range. Suchcalibration must be performed dvnamicallv by allowing the analyzerto measure, in its normal mode of operation, air containingaccurately known concentrations of carbon monoxide.
Either of two methods may be used for dynamic multipointcalibration of the analyzer, One method (illustrated in FigureA.1) uses a single certified kttandard cylinder of CO, diluted asnecessary wimth zero air to' obtain the various calibrationconcentrations needed. An alternate method *'uses individualcertified standard cylinders of CO for each concentration needed.
The multipoint calibration, contrary to zero/span checks, mustbe performed through the analyzer% sample port, and in theanalyzer's sample mode of operation. This requires that the AUTOthumbwheel switch be se'c. on position 9.
A.3.1 Apparatus Needed For Calibration
1 .
2 .
3 .
4,
5 .
6 .
A dilution system similar to the one depicted in FigureA.1 (such systems as Dasibi Models 5009-CP or 1005~C2 or5008) provide accurate and repeatable calibrationatmospheres.
A compressed ga.5: cylinder conta.ini.ng zero (clean) air with.less than 0,2 X?M of carbon monoxide that alsb containsapproximately 350 PPM of C03" The latter is preferred sothat the zero a.i.r is sinil.&i.in composition to atmosphericair, GFC analyzers do sometimes have a very small butdetectable response to CC+ The source of zero air caneither be a cylindeZ, or a catalytic converter (such asthat found in Uasibi M$deX 5011-B Zero Air Unit}. Airpassed through a he&ted (250°C) catalytic converter suchas palladium on a1,umina is satisfactory, however, the airshould be supplied under positive pressure by means of apump. Pollutants in the air other than CO do not affectthe accuracy,as the WC analyzer does not respond to them.
A compressed gas cylinder containing a high concentration(such as 2500 PPMj cf CO, traceable to NBS-SRM.
Pressure regulators with non-reactive diaphragms andinternal parts and a suitable delivery pressure.
Flow meters (with ff.ow co.nt:rol.lers) able to measure andmonitor flow rates with an accuracy of 9% of the measuredvalue.
Mixing chamber, constructed of glass, teflon or other non-reactive material and designed to provide thorough mixingof CO and diluent air for the dilution method.

DASIBI ENVIRONMENTAL CORP. TM910415
6 . Mixing chamber, constructed of glass, teflon or other non-reactive material and designed to provide thorough mixingof CO and diluent air for the dilution method.
7. Output manifold, constructed of glass, teflon or othernon-reactive material and with sufficient diameter toinsure an insignificant pressure drop at the analyzerconnection. The system must have a vent designed toinsure atmospheric pressure at the manifold and to preventambient air from entering the manifold.
A.3,2 Model 3008 Checkout
Before starting a multipoint calibration, the analyzer shouldbe completely warmed up and checked out. It is recommended to letthe unit run overnight to check the baseline stability. Beforecommencing with the calibration, run through all the diagnosticsettings on the DIAG thumbwheel switch, check if they are withinlimits, and record,their values. The analyzer should be connectedto some form of data recording device, and the device should becalibrated using DIAG switch setting 8 and the appropriate settingson the AUTO switch. ,
A.3.3 Step-By-Step Dynamic Multipoint Calibration Procedure(By Dilution)
1. .
2 .
3 .
4 .
5.
Assemble a dynamic calibration system such as shown inFigure A-l. References to analyzer responses in theprocedure given below refer to recorder to data deviceresponses.
Disconnect the analyzer sample port from the samplingmanifold and connect it to the calibration system'smanifold. The particulate filter cartridge mustremain connected to the analyzer sample port. Set theanalyzer flow at 1 LPM.
Generate at least 2 liters-2 per minute (LPM) of zero air.Verify that there is flow coming out of the manifold vent;if not, increase the zero air flow until you can measureat least 0.2 liters/minute at the vent.
Allow dilution air alone to flow from the manifold intothe analyzer. If mass flow controllers are used it may benecessary to disconnect the CO line and cap it since notall mass flow controllers have a positive shut off. A 'valve in this line, will be convenient to achieve the sameeffect.
Allow the analyzer to sample zero air until a stableresponse is obtained (5 - 10 minutes). After a stableresponse is obtained, adjust the front panel "REC ZERO"
A-4

DASIBI ENVIRONMENTAL CORP. TM910415
to +5% of scale is recommended to facilitate observingnegative zero drift (the zero offset can be obtained withthe recorder zero or the analyzer zero). Record thestable zero air response as 2.
6 . Generate 80% of full scale CO concentration, or 40.0 PPM.Allow the instrument to sample for 5 - 10 minutes andobtain a stable reading. Again, make sure that the totalflow from the calibration system is eoual or greater thanthe analyzer's flow rate plus manifold vent flow. Theexact CO concentration is calculated from:
[Copout = ( [Col,td x F,,) / tF,, + Fd)where,
[Colout
[Co]stdFco
=
==
=
diluted CO concentration at the output manifold,PPMconcentration of the undiluted CO standard, PPMflow rate of the CO standard corrected to 25OCand 760 mm Hg, l/min.flow rate of the dilution air corrected to 25OC
u and 760 mm Hg, l/min.
7. Allow the analyzer to sample this CO concentration untila stable response is obtained.
8. Adjust the SPAN NO. thumbwheel switch to obtain a recorderresponse as indicated below:
Recorder response (% Scale) = (([CO]out X lOO)/ URL) + Z,,
where,
URL = Nominal upper range limit of analyzer's operatingrange.
zC O= Analyzer response to zero air, percent scale.
9. Repeat Steps 4-8 for CO concentration of 40, 20, 10 and 5PPM. Record the CO concentration and analyzer's responsefor each concentration. Plot the analyzer's responseversus the respective calculated CO concentrations andplot a linear regression curve.
10. Record the SPAN NO. in the instrument log. Re-connect theanalyzer to its sampling manifold. It is recommended thatthe calibration of a newly installed 3008 be repeatedafter 24 hours of operation in order to verify that theunit is working well.
A-5

DASIBI ENVIRONMENTAL CORP. TM910415
A.3.4 Frequency of Calibrations
It is recommended that a multipoint calibration be performed:
1. Every six months.
2. At any time following a major servicing of the unit.
3. Any time excessive variation occurs in the zero and spanvalues of the analyzer.
In addition, calibration documentation should be maintainedwith the analyzer, and it should include calibration data (orcurve), analyzer identification, calibration date, analyzerlocation, calibration standards used and their traceability, andcalibration equipment used in the calibration.
A.4 Zero/Span Check
Zero/Span check consists of a zero baseline check and anupscale check of the analyzer response, usually between 70% and 90%of the measurement range.
A.4.1 Use of Internal Catalytic CO Scrubber
It is extremely convenient to utilize the internal CO scrubberfor a zero check. However, it is recommended to always check thescrubber efficiency every time a multipoint calibration isperformed. The following procedure is suggested for this purpose:
1. Establish a Zero reading on the analyzer using the diluentgas employed for the multipoint calibration. This isconveniently done by having the AUTO thumbwheel switch onposition 9, so that the ZERO solenoid is not activated inthe process of setting the display to zero.
2. Set the AUTO thumbwheel switch back to 0, and press thefront panel ZERO pushbutton so that zero gas from thescrubber is sampled.
3. Allow the scrubbed air from the catalytic CO scrubber to besampled long enough to assure a stable reading .(at leastfive minutes). Do not; during this time, press the SAMPLEbutton. This will cause the panel display to go to zero.
4. The value for CO that the internal scrubber registers onthe display or recording device should not exceed + 0.2PPM. It should be recorded along with other calibrationdata, and should remain constant from one calibrationinterval to the next. If it does not, the scrubber needsregeneration (refer to Section 6.2.3.2).
A-6

--
--
. .--
DASIBI ENVIRONMENTAL CORP. TM910415
The Model 3008 is configured to conveniently do the followingchecks by either pressing the ZERO or SPAN pushbutton. All sampledgases must be done at atmospheric conditions. The three solenoidvalves located on the back panel can be operated manually bypressing the ZERO and SPAN buttons, remotely from externalcommands, or automatically by use of the AUTOPROGRAM. In all threecases, the red LED's on the pushbuttons indicate the mode that.isactive.
1. Zero Check: This is done via the internal CO scrubber.Record the analyzer's response in percent of scale as Ao.Compute the zero drift for the following:
Zero Drift % = A0 - Z,,
where Z is the recorder response obtained at the lastcalibra ?onf for zero air, 5% scale.
2. Span Check: This check is usually made with a cylinder ofCO at approximately 80% of the URL, which translates toabout 40 PPM for the EPA range of 50 PPM for CO. A higherconcentration suitably diluted will also serve, but thisadds another source of potential error to the measurementand is therefore not highly recommended. In either case,the source of CO should be checked against an SRM or CRM.Record the analyzer's response in % scale as AsO:Calculate the span error as follows:
Span error, % = ([(A80 - Z)URL/lOO] - [CO]) X lOO/[CO]where,
Z = Recorder response obtained at last zero calibration in %.fW = Span concentration.
The level of acceptance is as follows:
ZERO DRIFT+3.0 ppm+l.O ppm
0 PPm
Calibrate AnalyzerAdjust AnalyzerNo Adjustment Required
SPAN DRIFT+6%+2%0%
For more information about zero/span checks refer to number 3in Section C, References, of this manual.
A-7

DASIBI ENVIRONMENTAL CORP. TM910415
-FLOWMETER
ZERO AIR. -
PRESSURE
.
VENT - OUTPUT MANIFOLD
STD
EXTRA OUTLETS CAPPED
WHEN NOT IN USE
TO lNLET OF ANALYZERc U N D E R CALBRATlbN
Figure A-l Multipoint Calibration Set-up
A-8

DASIBI ENVIRONMENTAL CORP. TM910415
OUTPUT(VOLTS)
1 0 20 30 40 50
co PPM .
Figure A-2 Sample Calibration Curve
A-9

DASIBI ENVIRONMENTAL CORP. TM910415
APPENDIX B
MANUAL UPDATE INFORMATION
B-l
--- -
DASIBI ENVIRONMENTAL CORP. TM910415
B.l New Valve Control Board (Figures B-l and B-2)
There is a new version of Valve Control Board that is in theprocess of being implemented into production and may or may not becontained in this unit. If the number on the Valve Control Boardcontained in this unit is # 11019, then this information will notpertain to your unit. This section describes the new board'soperational capabilities.
Internal solenoid valves allow zero or span gases to bedirected into the instrument for calibration purposes. Thesevalves are controlled by the Valve Control Board, which is mountedto the rear panel and can be commanded either by signals from theinternal computer or from zero or span remote control inputs on therear panel.
The internal computer activates the solenoid valves during the"Start UpI' program and the "Auto CalI program or when the frontpanel ZERO or SPAN buttons are pressed. Any zero calibrationactivated via the internal computer causes the zero offset to bere-calculated. Calibrations activated externally, via the rearpanel, do not change the zero offset and are not indicated on thefront panel of the instrument.
.
The rear panel zero and span terminals provide a dualfunction. When either of these terminals are connected to ground,the corresponding calibration function is activated. In addition,when the internal computer activates a calibration, theseterminals, which are normally pulled to +5V, are held low by anopen collector transistor. A datalogger monitoring these terminalscan, therefore, distinguish sampled data from the calibration data,whether the calibration is activated internally or externally.
B.2 Optional Advanced Diagnostic Board (Figures B-3,B-4,B-5 & B-6)
Dasibi's Advanced Diagnostic Board is a plug-in printedcircuit board which adds the capability for several remote outputsand controls to Dasibi's line of microprocessor-based gasanalyzers. It may be purchased in several differentconfigurations, depending upon the requirements of the end user.Capabilities for diagnostic status outputs and controls, serial RS232 interface, internal data storage and isolated analog output(s)are all available for connection to remote equipment, eitherdirectly or via modem.
The Advanced Diagnostic Board is easily installed in thefield, requiring only a pair of long-nosed pliers and a phillipsscrewdriver. The board plugs into the spare STD bus slot in 3008analyzers. It can support one 9 pin and one 25 pin D subminiatureconnector on the rear panel: one male connector for RS 232communications and one connector female for diagnostic connections,respectively. Alternatively, connections to a 50 pin Dsubminiature connector can be provided to support the requirementsof the German LIS field bus system. Ribbon cables extend from theconnectors on the Advanced Diagnostic Board to the rear panel,which is able to accept either one 25 pin or one 9 pin connector.
B-2
DASIBI ENVIRONMENTAL CORP. TM910415
If both the serial. and diagnostic connectors are required, anadapter plate will allow both connectors to be mounted on the rear.
B.2.1 Isolated Status Input/Control Output Signals
The Advanced Diagnostic Board may be configured to utilize adiagnostic connector which provides a convenient means ofinterfacing remote equipment to the analyzer via a singleconnector. This connector supports status outputs, remote controlinputs and two analog outputs. All diagnostic signals are capableof being isolated, eliminating possible ground loop problems.
The status outputs can be used to flag error conditions to anattached datalogger or to otherwise indicate a system malfunction.Status outputs are isolated transistor contact closures. A pull-upresistor is provided on each output so that a rlgooda condition ishigh (+W). Jumpers (Jl & J2) allow selection of the source of 5Volts; either from the analyzer or, if complete isolation isrequired, from an external power supply. The individual statussignals supported by the 3008 CO analyzer are described below:
Power off pin 2 ---
This output is pulled to the analyzer ground when theinstrument is turned off. The power off signal is not isolated.
Manual Mode pin3 continuous
Indicates that the instrument is in a manual operating modeand not collecting data. ,Zero mode pin4 continuous
Indicates the instrument is performing a manual, automatic orremote zero calibration.
Span mode pin5 continuous
Indicates the instrument is performing a manual, automatic orremote span calibration.
Diaqnostic error pin6 continuous/Power uP
This output is active when any diagnostic error conditionexists.
Computer failure pin 7 power up
Indicates an EPROM, RAM, V/F or stepper diagnostic failure.
Not Presently Used pin 8
B-3
DASIBI ENVIRONMENTAL CORP. TM910415
Flow failure pin9 continuous
Flags a probable pump failure as indicated by the pressuretransducer.
The remote control inputs allow remote instrument control bymeans of isolated, contact closures. Since the control inputs areisolated, they can be referenced either to internal ground and 5
* Volts, or to the ground an +5 of the controlling instrument.Control inputs can be activated by CMOS or TTL output levels. Theactive condition for all control signals is low (0 Volt).
A dipswitch is provided on the board which allows the controlsto be activated manually when the diagnostic connector is un-plugged (or the control pins are not pulled low). Whena switch isturned on, it overrides the control input. The functionscontrolled via the remote inputs are described next:
Instrument calibration (pins 10 thru 13)
An instrument zero or span can be controlled remotely byactivating (pulling to ground) the zero or span control inputs.When both calibration input pins are left open (or pulled high) theinstrument will be in sample mode (unless a manual calibration isbeing performed). The calibration mode will be active while thecontrol input is pulled low, but can be overridden by pressing thecorresponding front panel button. The functions of the calibrationcontrol pins are listed next:
pin 10
pin 11
pin 12
pin 13
Activate a span calibration. The span controlpin must be held low for the span to remainactive.
Activate an audit zero. No adjustment willbe made to the internal zero. This zero is onlyactive while the control pin is held low.
ActivBt'e a zero calibration. An internal zeroadjustment will be made upon completion. Onceinitiated, this zero will continue for theminimum time required for a valid zeroadjustment, however the duration can beextended by holding the control pin low past thistime period.
Initiate a power-up diagnostic test. Somediagnostic tests are only performed during theinitial power-up sequence. Pulling this pin low,then back high causes the power up sequence tobe re-activated, remotely, without cycling power _to the instrument,
B-4
DASIBI ENVIRONMENTAL CORP. TM910415
Diagnostic analog output selection (pins 14 thru 17)
Control pins 14 through 17 select a diagnostic signal level tobe presented on the diagnostic analog output (pins 23 & 24). Thetable presented next indicates which signal is selected for eachcombination of the control bits. A one represents a pin pulled toground, while a zero indicates a high (+SV) signal or open pin.17-14 function
1 1 1 1 Full scale output1 1 1 0 Zero offset1 1 0 1 Gas Temperature1 1 0 0 Gas Pressure1 0 1 1 Difference Signal1 0 1 0 Reference Signal1 0 0 1 Wheel. Temperature1 0 0 0 Chamber-Temperature0 1 1 1 Zero Output0 1 1 0 Zero Output0 1 0 1 Span Thumbwheel Setting0 10 0 Zero Output0 0 1 1 Zero Output0 0 10 Full Scale (both analog outputs)0 0 0 1 Half Scale (both analog outputs)0 0 0 0 Zero (both analog outputs)
Remote +5V reference (pin 19)
This pin may be connected to the 5V supply of a controllinginstrument in order to provide full isolation. Jumper Jl should beinstalled for full isolation (with pin 18 connected to an external5V source). If isolation is not necessary, J2 should be installedinstead and pin 18 left unconnected.
Analog outputs (pins 20 thru 25)
Two analog outputs are provided on the diagnostic connector.The standard outputs can be selected, via jumpers, for lV, 5V or1OV. Isolated voltage or current outputs are provided as an option.The functions of the two outputs are described next:
Primary analog output (pins 20 thru 22)
The first analog output always indicates the primary gasconcentration.
Diagnostic analog output (pins 23 thru 25)
The second analog output can be remotely controlled via pins14 through 17, to present one of up to sixteen different diagnosticsignals (see description previously). Most of these signals can
B-5

DASIBI ENVIRONMENTAL CORP. TM910415
also be viewed on the front panel by using the diagnosticthumbwheel switch. Headers P3 or P4 should be used for thediagnostic connections, depending upon whether a 25 pin (P3) or 50pin (P4) diagnostic connector is needed.
DiagnosticStandardConnector(25 pin)
123456791011I"21314
15
16
17
181920
21
2223
24
25
connector pinoutLISfield bus(50 pin)
:819202136373565
15
14
12
signal signaldirection descriptionMMoutoutoutoutoutoutoutininininin
in
in
in
ininout
out
u-out
out
--
GroundPower offManual modeZero modeSpan modeDiagnostic errorComputer failureFlow failureSpan calZero calZero adjustPerformpower-uptestDiagnostic outputselect 0Diagnostic outputselect 1Diagnostic outputselect 2Diagnostic outputselect 3no connectionRemote +5V referencePrimaryanalogoutput(+IPrimaryanalogoutputt-1GroundDiagnostic analogoutput (+)Diagnostic analogoutput (-)Ground
Switch-connector SW2 allows the operator to manually activatethe diagnostic functions of the system; functions which, duringnormal operations, are controlled by control inputs. Switchnumbers 1-4 on the switch-connector activate instrument calibrationfunctions. These switches, and the corresponding remote controlsignals, can override the front panel button, but not vice versa.Only one of the four functions can be activated at a time (switchnumber one is located on the right-hand side of the connector whenlooking at the front face of the board; rloff*l is when the switch isin the down position):
B-6

DASIBI ENVIRONMENTAL CORP. TM910415
Switch #l While this switch is on (up position), the instrumentperforms span calibration.
Switch #2 While this switch is on, the instrument performs zeroaudit, No adjustment is made to the internal zero.
Switch #3 While this switch is on, the instrument initiates a zerocalibration cycle in which an adjustment will be made tothe internal zero.
Switch #4 While this switch is on, the instrument initiates apower-up system wide diagnostic test.
Switch numbers 5-8 set the seecond analog output to reflectthe instrument internal parameters listed next, depending upon thecombination of the four switches. These switch settings can alsobe set both the analog outputs to a fixed value, in the vent thatthe operator needs to adjust the analog output circuitries. Thetable provided next, applies only if there are no active controlinput signals on pin numbers 14 -17 of the 250pin connector locatedon the rear panel of the instrument.
#soffonoffonoffonoffonoffonoffonoffonoffon*
**
#6offoffononoffoffononoffoffononoffoffonon
Switch SW2#7offoffoffoffononononoffoffoffoffonononon
#8offoffoffoffoffoffoffoffonononononononon
Diaqnostic Function. A . *Zero Output""Half Scale Output*_:Full Scale Outpu$-lNO, ConcentrationNO, ConcentTation*Span NumberCooler Temperature*Converter TemperatuFe*Chassis TemperaturFHigh Voltage(in*V)Pressure (mmHg)PMT Signal, NO,(mV):PMT Signal, NO,(mV)*NO Zero OffsetNOX Zero Offset(Fu%l Scale Output*
Applies only to second (diagnostic) analog output; the first(primary) analog will indicate the primary gas concentration.
Applies to both first and second analog outputs.
B-7

DASIBI ENVIRONMENTAL CORP. TM910415
NOTE
If no control inputs are connected to theAdvanced Diagnostic Board, switch numbers 5-8on SW2 must be set to the correct combinationduring normal operation in order to have thedesired output for both the first and secondanalog output.
Resistor trimpots RlO, R17, R26 and R33 on the AdvancedDiagnsotic Board are used for fine tuning the analog outputs tocorrect for Op Amp zero offset and gain inaccuracies per thefollowing chart (follwed by the procedure to accomplish this:
R10R17R26R33
1)
2)
3)
4)
5)
6)
Analog zero offset adjustment for the first analog output.Analog gain adjustment for the first analog output.Analog zero offset adjustment for the second analog output.Analog gain adjustment for the second analog output.
Set the switch numbers 5-8 to the off (down) position.
Use a four-digit volt meter to measure the first analogoutput, and adjust RlO until the meter reads zero (or 4 mA isthe unit contains 4-20mA output).
Also measure the second analog output and adjust R26 until themeter reads zero (or 4 mA is the unit contains 4-20mA output).
Flip switch number 6 on SW2 to the on (up) position.
Measure the first analog output and ajust .R17 until the meter. *reads full scale.
Measure the second analog output and ajust R33 until the meterreads full scale.
B.2.2 RS232 Interface Communications
The serial g-pin male connector used for the RS232 interface- ---2 -1 z-i--, -- rnL,^ ---+conncetion may be attached to any standard serial CXVLGC.
Illt: FULL
is configured to accept widely available cables and peripheralscompatible with the standard IBM PC computer. A g-to-25 pinadapter may be procured from Dasibi for situations ' * ' '- I'-- Tnxrin wnlcn tne 1~~19 pin connection is not available.
. -ISeveral useful cable wiring- .- .diagrams are shown in figures provided at the end of this section.1 I- --2Ll--The serial ribbon cable should be connectea LO rlbboh 1~".eader P2 onthe Advanced Diagnostic Board.
Switch-connector SW1 on the board determines the communicationbaud rate for the'serial port per the following chart (switch #l islocated on the right-hand side of the connector when looking at theboard's front; rroffll is when the switch is in the down position):
B-8

DASIBI ENVIRONMENTAL CORP. TM910415
#3offoffoffoffonononon
Switch SW1#z #1off offoff onon offon onoff offoff onon offon on
Baud Rate (bps)11030060012002400480096009600
When the instrument's serial RS232 port is placed ininteractive command mode, the instrument can be controlled and datareviewed via a remote terminal or printer. Commands are sent tothe instrument from a remote keyboard via the serial interface., Itis only necessary to enter the first two characters of a commandword, terminated by a carriage return. The following commands areavailable:
SAample Places the instrument in the Sample mode.Span Starts a Span calibration.XEro Starts a Zero calibration (re-calculates the zero
offset).Audit Starts a Zero audit calibration (no change to the
zero offset).REstart Re-start the analyzer.MEnu Refreshes the screen.
The receiving terminal must be set to emulate a VT100 terminalin order to properly display the status screen. An example of thestatus screen is presented next:
Dasibi Model 3008 CO Ambient Monitor*********Front Panel****************** ** ---Front Display---- SPAN NO. ** 1 co = 40 PPM I [SOO) ** -I------------------ ** ** ZERO SAMPLE SPAN AUTO DIAG ** I: 3 ix c 3 WI L-01 ** **************************************
co = 40 PPM [P]ZERO OFFSET: 30 mV [P]GAS TEMP: 32 C [P]GAS PRESS: 100 mmHg[P]PT CORR : 1 rp1D:lOOO R:lOOO mV [P]WHEEL TEMP: 32.0 C [P]CH T: 32.0 C [P]
VW(D9) NA
*******COMPUTER TEST********(CT) EPROM test: [PICommand:
(ZEro,SAmple,SPan,AUdit,REstart,MEnu) (CT) RAM test: PI(CT) V/F test: [PI
CPU Diag. Card Terminal Type = VT100DIP switch settings: l------8 1 ------ 8 Baud Rate = 9600(O-open: l-closed) 00110000 00110000 Address = 02
Software: 3008 Rev. 2.1*****DIAGNOSTICS***+****
PO)VWP)uwuw(W(WWI
B-9
DASIBI ENVIRONMENTAL CORP. TM910415
B.2.3 External Relay/Terminal Box
Another option of the Advanced Diagnostic Board is theExternalRelay/Terminal Box. This box provides screw-type terminalconnections for all of the diagnostic signals and analog outputsprovided by the Advanced Diagnostic Board. In addition, alldiagnostic outputs are fully isolated by Reed relays. TheRelay/Terminal Box connects directly to the 25 pin female connectoron the rear panel of the analyzer via ribbon cable, Labeled,removable terminal blocks allow easy connection of the diagnosticoutputs and inputs.
B.3 Special Vystemtt Software
If the iode 3008 is being integrated into a Dasibi Model 1000Ambient Air Monitoring System, then it should contain specialsoftware. The reason for this special software is due to the factthat several components that come standard on the Model 3008 areremoved when it is integrated into the System 1000. These itemsinclude the particulate filter holder assembly (which is located onthe system's Waiving panel") the zero/span valves (which arereplaced by a single valve on the system's valving panel) and theinternal zero air source (which is provided by the system's zeroair unit, Model 5011-B or 5011-A).
Standard operation of the Model 3008 is such that upon initialturn on, the unit automatically goes into the zero mode and samplesoff of its internal zero air source. Since the internal zero airsource and zero/span valves have both been removed for integrationinto the System 1000, the unit is unable to operate this way.Instead, the unit must be periodically calibrated using its sampleport in conjunction with the system's valving panel. How toperform this calibration using the system's calibration equipmentand valving panel is provided in the System 1000's manual.
Certain operational modifications, however, must be made whenusing the 3008 to allow it to easily accommodate with thiscalibration process. First of all, the Model 3008 must be operatedwith the "Auto H thumbwheel on the front panel dialed to r19W at alltimes during its normal operation in the system. This tells the3008's internal computer that all calibration and sample air isflowing through the unit's sample port. Secondly, when performinga 'lformaltt zero calibration, the "Zero" pushbutton on the frontpanel of the 3008 must be pushed as zero air is about to enter theunit. This informs the internal computer that zero air is flowingthrough the 3008. As soon as the zero calibration test is finished(usually about 15 minutes) either the %pantt pushbutton should bepressed (if unit is going to be calibrated using span gas), or theVamplet pushbutton should be pressed (if the unit is going tosample ambient air). Once either of these two pushbuttons ispressed, the internal computer of the 3008 will store the zerooffset into non-volatile battery-backed storage. This zero offsetwill remain in storage until another formal zero calibration isperformed.
B-10

-
DASIBI ENVIRONMENTAL CORP. TM910415
Due to the fact that the unit's CPU Board must contain a RAMinstead of the standard E-Prom in order to store the zero offset,the stock number for the unit's CPU Board is slightly different,The standard unit requires CPU Board assembly stock number A-0505-B, while the system 3008 requires stock number A-0505.BS.
B.4 DasibiNet Interface (Figures B-7, B-8, B-9 & B-10)
Dasibi has introduced a new concept for use in its Ambient AirMonitoring System, Model 1000. It is called VIDasibiNetl' and itessentially allows the end user to obtain valuable diagnosticinformation from each of the system's internally-mounted airmonitoring instruments. Since the Model 3008 is the unit thatprovides CO measurements for the System 1000, it has had thecapability added to its list of available options.
DasibiNet is a multi-drop network in which diagnostic signalsfrom more than one Dasibi instrument may be lllinked~~ togetherutilizing just one telephone line; this line can then be attachedto a modem for remote accessibility of a central computer system(as opposed to having several telephone lines connected to a sitefor such information).
This feature affects the configuration of the Model 3008 intwo ways. First of all, there is an additional P.C. Board attachedto the unit's back panel. This board, the Network Interface Board,allows the 3008 to be linked to the single network line andcontains IrInl' and rrOutU ports for connection of two telephonejacks. Also, the Advanced Diagnostic Board with RS232 capabilitiesis added to the unit's Mother Board. This board attaches to theNetwork Interface Board on the back panel via cable connection.Diagram and schematics for these boards are provided at the end ofthis section.
B.5 IrNewU RS232 Interface Capabilities
Dasibi has added new features to the RS232 interface optionavailable for use in the Model 3008. Basically, there are four newfeatures:
1) Remote zero offset adjustment.2) Remote %panfl setting adjustment.3) Remote l*Autoll setting adjustment.4) Remote "Diag l1 setting adjustment.
Availability of these new features not only required Dasibi tomodify the 3008's software, but also required certain hardwaremodifications to the previous RS232 Board configuration and slightmodification to the RS232 interface use; specifically, the fifthdipswitch of SW1 should remain in the closed position (against theboard) in order to select proper RS232 communications mode. Whenthis switch is open, special communication protocol is required,which is currently outside the scope of this discussion. The otherfour dipswitches are used to determine the serial port's Baud rate.
B-11-
--

DASIBI ENVIRONMENTAL CORP. TM910415
The serial port operates at the Baud rate either determined bythe SW1 dipswitch setting or by the Baud rate stored in the non-volatile memory. The available Baud rates are 1200, 2400, 4800 and9600. If no valid Baud rate exists in the non-volatile memory, therate will default to 9600. If the terminal screen is blank afterpower up, the user should try different Baud rates at the terminalto establish connection. The four dipswitches on SW1 can be usedto set the baud rate by opening (away from the board) the switchesin the following combinations (rrO'l = Open, rrXH = Closed):
Bit 4 Bit 3 Bit 2 Bit 1 BAUD0 0 X X 12000 X 0 0 24000 X 0 X 48000 X X 0 9600
If the operator wants to be able to set the Baud rateremotely, all four dispswitches must be left open. After power up,the serial port will provide a selection menu:
DNET Software Rev. 2.1 Checksum : -21350 OK
Main Menu :1 : Diagnostic Screen2 : Diagnostic Value3 : Remote Control4 : Baud RateSelection :
Diagnostic Screen:
The operator can select one of the four listed entries in theMain Menu by entering a number from 1 to. 4. The selection"Diagnostic Screen" provides information on all diagnostic items
CO Monitor3008
Rev. 2.2ZNRFCA-0488-067co = 1.25 PPM
co = 1.25Z Offset 20Gas Temp 44.0Vacuum 445PT Corr 1.050Diff 6000Ref 4500Wheel 44.0
"Space" for Repeat, WC"
PPMmV AlarmCmmHg AUTO#
DIAG#mV SPAN#mV MODEC CPU SW
Diag SWRange
for Continuous and
00000000
0000
10100000010 l/2/40000000100010000
50.0 PPMIrEv for Exit
B-12

DASIBI ENVIRONMENTAL CORP. TM910415
The operator can hit the space bar to update the screen onceor enter rlC1l to let the screen be updated continuously, accordingto the analyzer's cycle, or enter IIEIf to exit this screen. TheIrESCN key will always abort the current process and bring up theMain Menu.
The "Alarm" setting can be used to indicate alarm situationsfor selected diagnostics. The sequence of these alarms from left-to-right are as follows:
WAV/F Not Within SpecificationsChecksum ErrorRAM Test FailureWheel Temperature FailureSource FailureDifference Signal FailureRAM Test FailureZero Offset Failure
The llModell indicates the current operational mode of theanalyzer by use of an 8-digit binary code. If the right-most digitis II 111 (i.e. the code is 00000001), this will indicate that theunit is in the span mode. If the second right-most digit is Y"(i.e. the code is 00000010), then the unit is in the sample mode.Finally, if the third right-most digit is I,lU (i.e. the code is00000100), then the unit is in the zero mode. To change the mode,simply select one of the numbers listed next to the code. Numberrrl'l will set the unit into the span mode, number lr2U will set theunit into the sample mode and number r14H will set the instrumentinto the zero mode.
Diagnostic Value:
The UDiagnostic Value" selection on the Main Menu providesinformation on individual diagnostic items. Here, the operator canmonitor a single diagnostic item. It works in the same fashion asthe Diagnostic Screen. If the operator is not sure about theitem% number, simply enter the II? 11 key to list all of theavailable items, as shown next:
Item Number = (l-24, ?) ?
01 co020304 Z Offset05 Gas Temp06 Vacuum07 PT Corr08 Diff09 Ref10 Wheel
13141516 Alarms1718 Auto #19 Diag #20 Span #21 Mode22 CPU SW
B-13
DASIBI ENVIRONMENTAL CORP. TM910415
1112
Item Number = (l-24, ?)
23 Diag SW24 Range
An example of selecting a specific item is shown next:
Item Number = (l-24, ?) 4
Zero Offset = 12 mV
*@Space" for Repeat, IfCU for Continuous and trEH for Exit
Remote Control:
The "Remote Control" selection on the Main Menu allows theoperator to change the contents of internal settings. Not all ofthe internal settings are adjustable, though: only the zero offset,span number, auto thumbwheel setting, mode selection and diagnosticthumbwheel setting. If the span number, auto thumbwheel ordiagnosticthumbwheel are changed remotely, a corresponding messagewill be displayed on the analyzer's screen to allow an operatorvisiting the site to adjust the hardware setting on the unitaccordingly. Once the site operator has adjusted the hardwaresetting to match the remote setting, the screen's message willdisappear. Selection of Remote Control will prompt for the itemvalue after the user enters the item number, as shown next:
Item Number = 4Item Value (2 Offset) = 13
Item Number =
Baud Rate:
The "Baud Rate" selection allows the operator to change theBaud rate setting. Once selected, the following will appear:
Enter the Baud Rate =
Simply press the appropriate numbers on the keyboard to selectthe desired Baud rate setting.
B-14
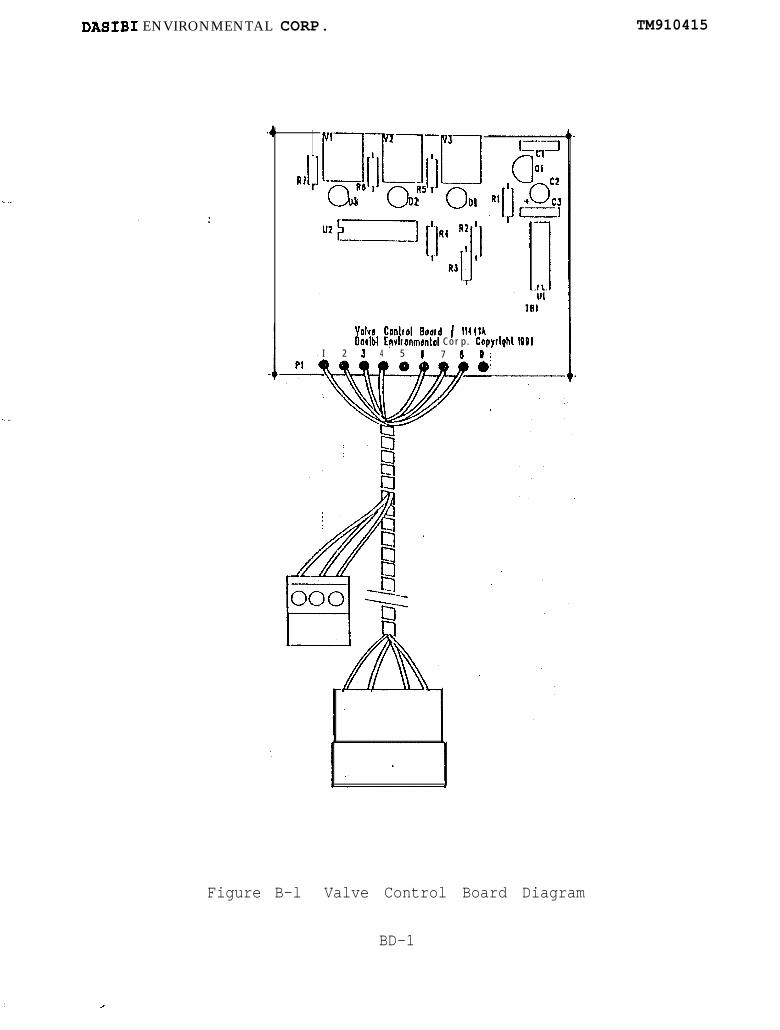
DASIBI ENVIRONMENTAL CORP. TM910415
IIIR’ r p$‘J&l3 92 01
Volvo Canlrel Poord 1 11441Ahlbl E~vlronmsntol C o r p . Copydght 1001
I 2 3 4 5 a 7 8 9;
Figure B-l Valve Control Board Diagram
BD-1
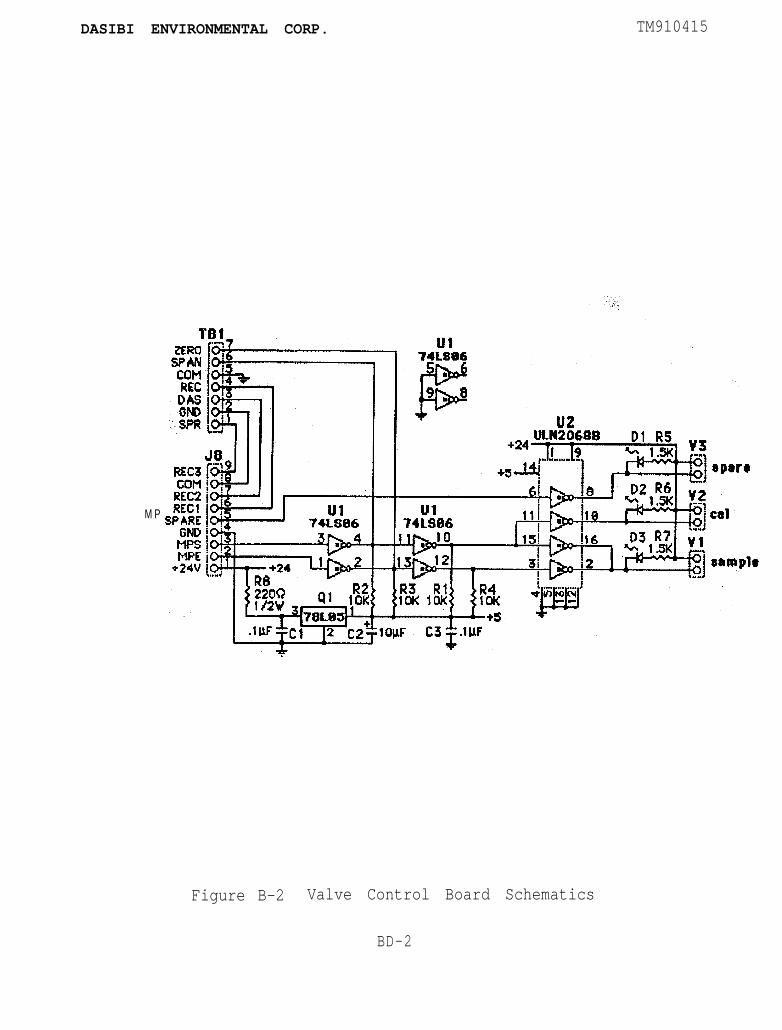
DASIBI ENVIRONMENTAL CORP. TM910415
M P
Figure B-2 Valve Control Board Schematics
BD-2
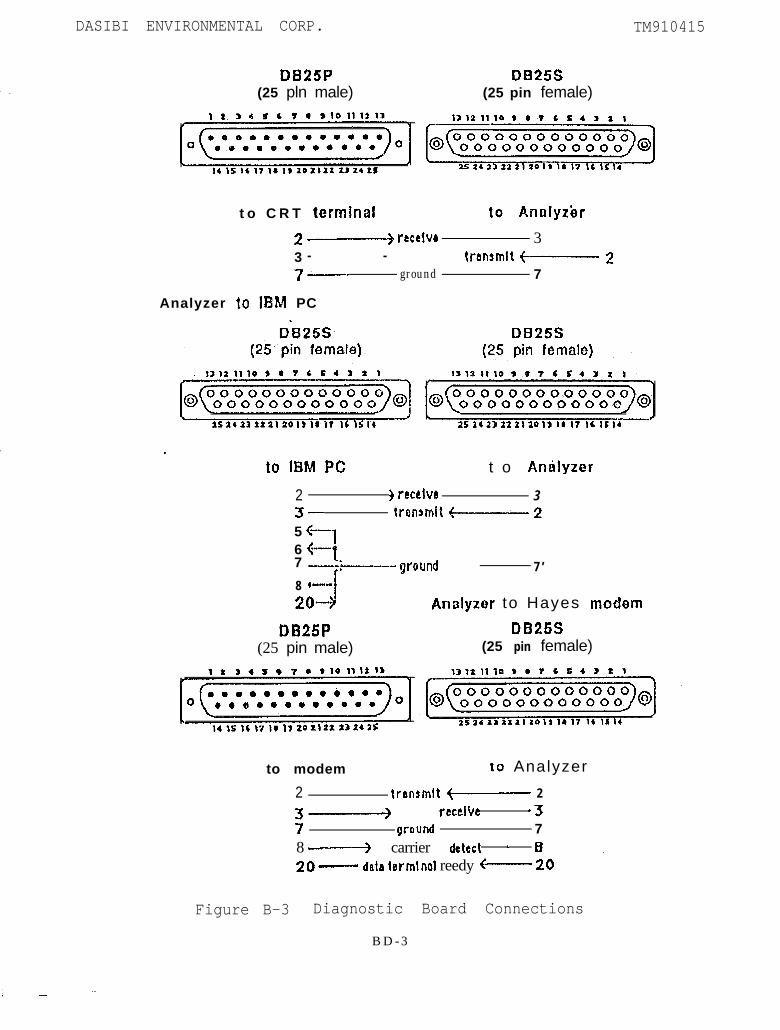
DASIBI ENVIRONMENTAL CORP. TM910415
DB25P(25 pln male)
DB25S(25 pin female)
t o C R T termhal to Analyziw
2 -------+ rtc4vr 33 - - trbn3mIt f----------- 2
7----- ground 7
Analyzer to lglM PC
to IBM PC t o Andyzer
2 ) rccelvd 33--- trawmIt V 2
5 +16 6-t7 --+-.---
J
ground 7 ’8 *m.‘.b.-
20- ArPalyzor to Hayes modem
DE325P DB255(25 pin male) (25 pin female)
to modem tg Analyzer
2 trensmllt +------ 23 ------+ rceeite -37 growld 78d carrier detect - 8 _ao- data termlnol reedy w 20
Figure B-3 Diagnostic Board Connections
BD-3
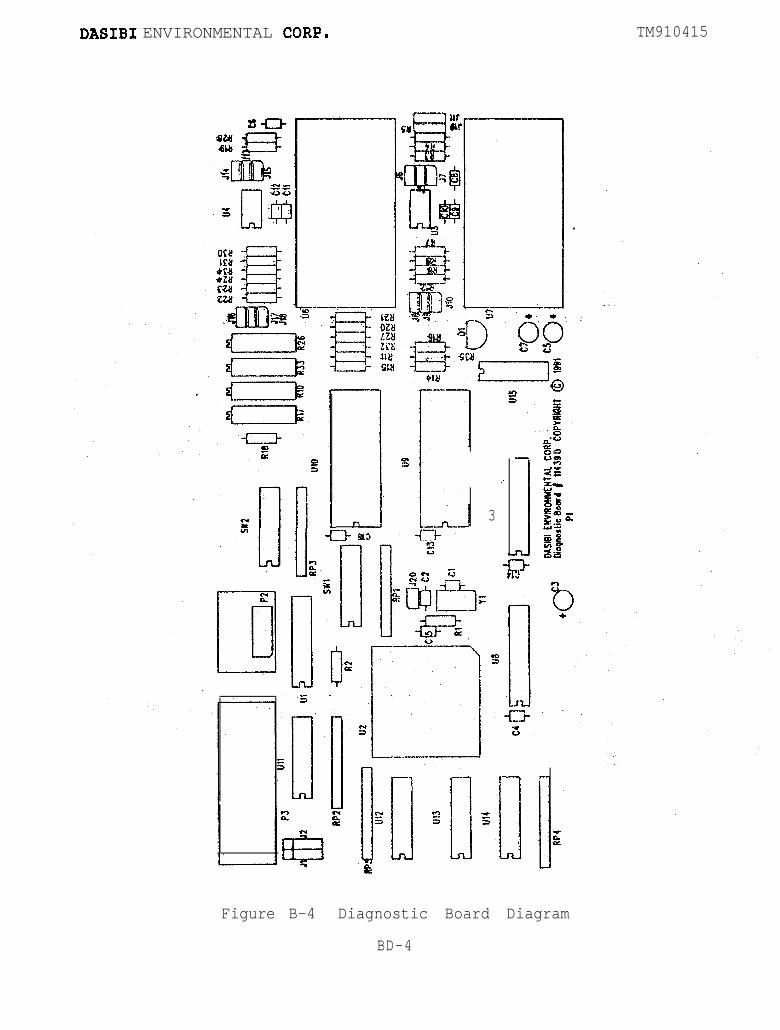
DA8IBI ENVIRONMENTAL CORP. TM910415
LI
3I
:
3
Figure B-4 Diagnostic Board Diagram
BD-4
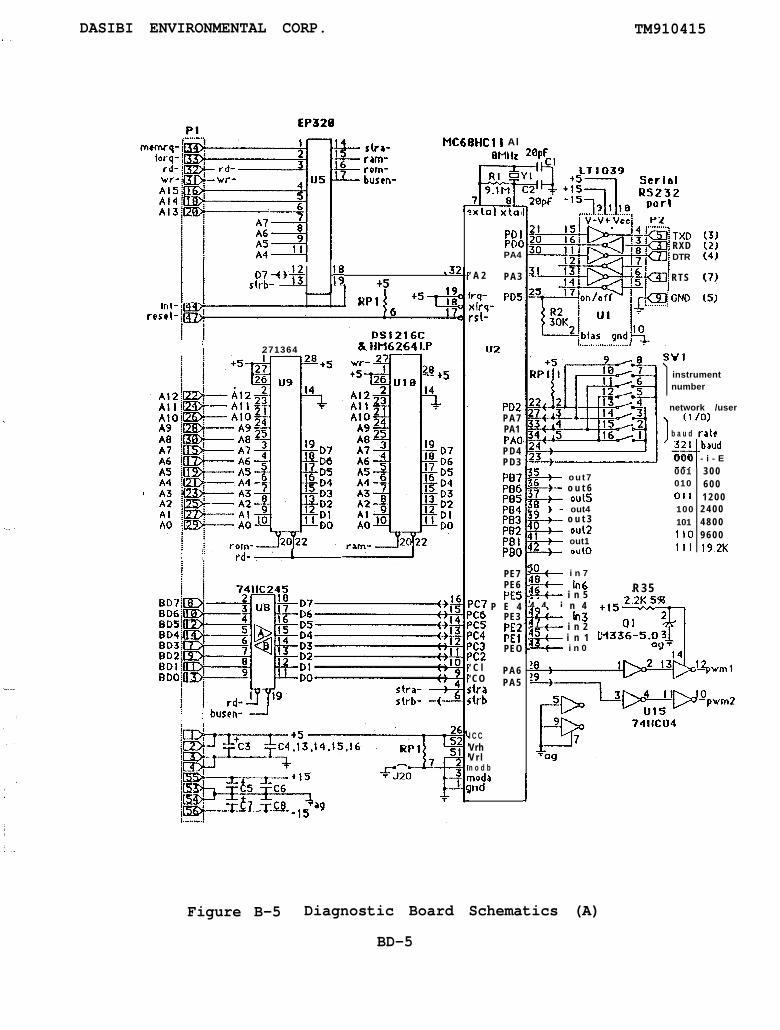
i
. _ -
DASIBI ENVIRONMENTAL CORP. TM910415
EP320
16us f
It
rira-rrm-rom-busen-
MC68HCll Al0Mllr 2w.
07f++ If ,32
strb- +5-
RPl
!f I 271364
! fi : t-d- -
& WI6264 LP
,8-t+5
t 1 busen- 1
axtal xtal
PO1PO0PA4
‘ A 2 PA3
lrq- PD5xir q-rst-
u2
PO2PA7PA1PAOPD4PD3
PB7PB6
I P95P04PB3PB2PB!PBO
PE7PE6PES
r:l P E 4PE3
‘C5 PEZ‘C4 PEI‘C3 PEO‘CZ‘ C l‘CO
PA6
rtra PA5
rtrb
I C CVrhV r ln o d bnodawd
TX0RXDDTR
RTS
f GND
Q+. ou t7+ o u t 6-+ out5=-+- out4@-+-- o u t 310 out2II out112 out0
50. i n 748 in6s-4--- i n 54 4 i n 449 ln347 i n 2Q-- i n 1 1Q-+- i n 0
instrumentnumber
network /user(1 /Ol
b a u d rate321
-t0 0 0001010011100101110111
baud- i - E3 0 06 0 01 2 0 02 4 0 04 8 0 09 6 0 0l9.2K
R 3 5
‘Jpwm 1
I
Figure B-5 Diagnostic Board Schematics (A)
BD-5

DAEIIBI ENVIRONMENTAL CORP. TM910415
(?Yt f i nt nrnmnrlVW.. . . . . y. . . . ...”I
0K
- in7
i n 6
in5
i n 4
in3
in2
in1
in0
out7
out6
OU15
ou14
out3
out2
out 1
auto
f i
IIIi
Rt0
_Ix-tog
trtnqe
out 1 +aott-cam
IMpwml-R12
i1
TLOG2
Figure B-6 Diagnostic Board Schematics (B)
BD-6
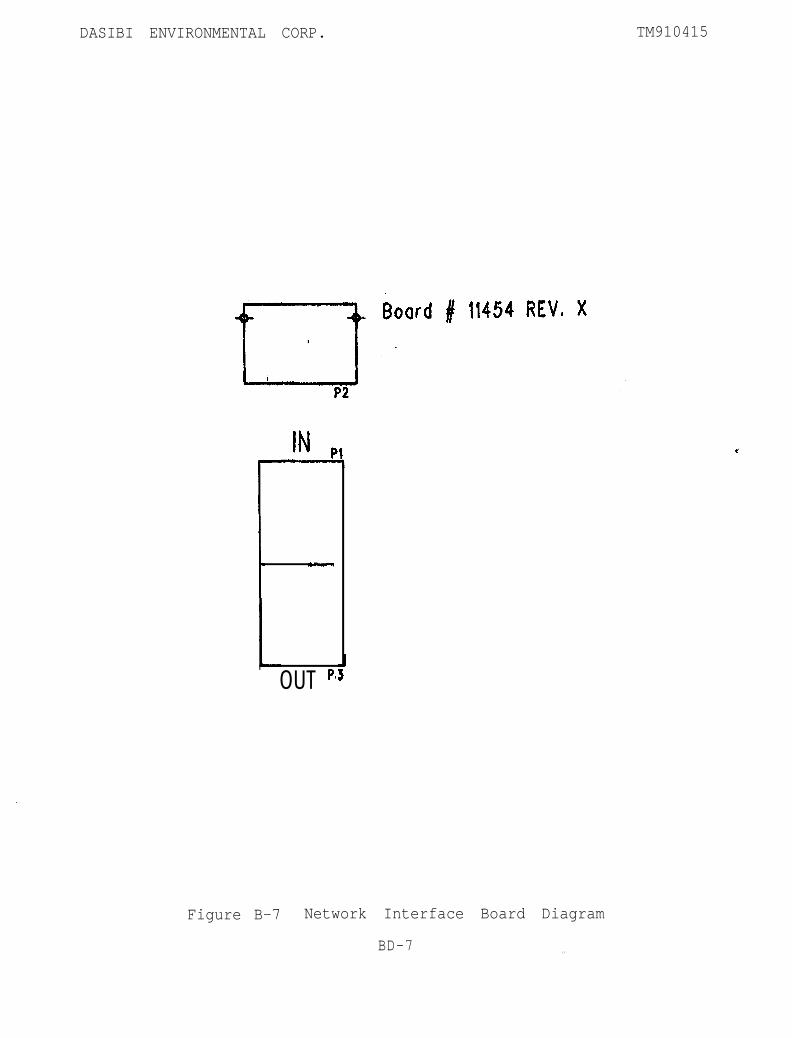
DASIBI ENVIRONMENTAL CORP. TM910415
-
OUT ”
Figure B-7 Network Interface Board Diagram
BD-7 . .
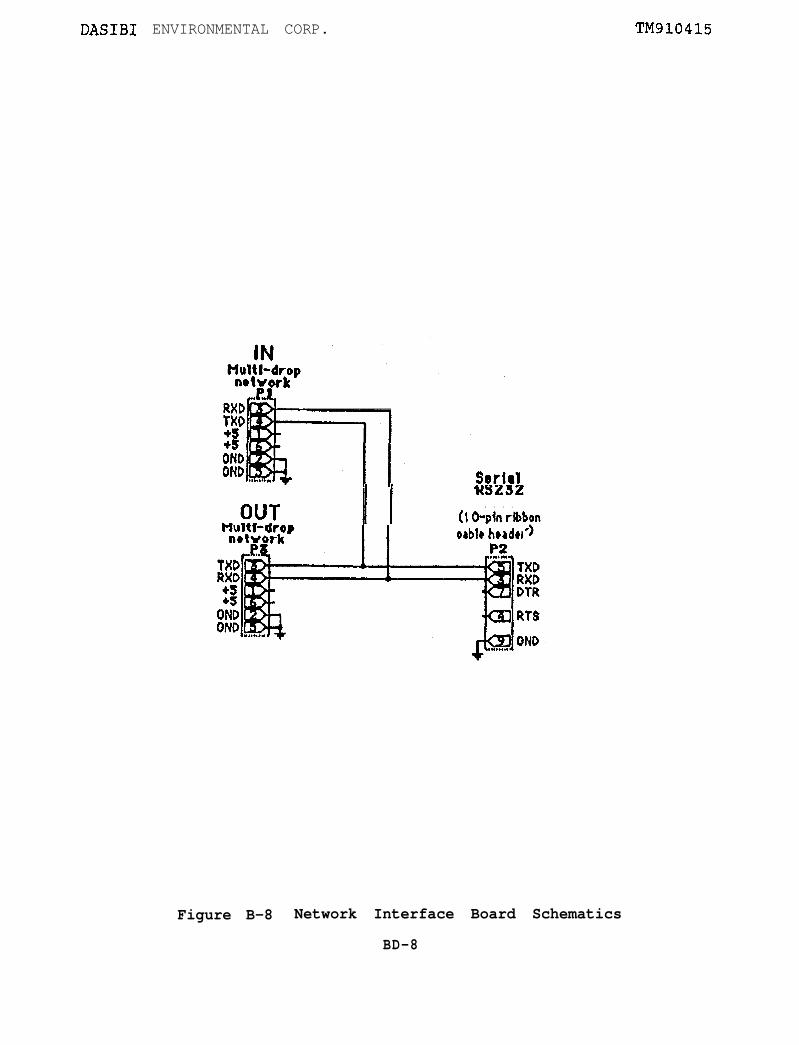
DASIBI ENVIRONMENTAL CORP. TM91b415
I I WYZJZp o r t
(1 Olpln d&bon9
Figure B-8 Network Interface Board Schematics
BD-8

L _ DASIBI ENVIRONMENTAL CORP.
APPENDIX C
REFERENCES
TM910415
.-
DASIBI ENVIRONMENTAL CORP. TM910415
c.1 General
1. "Traceability Protocol for Establishing True Concentrationsof Gases Used for Calibration and Audits of Air PollutionAnalyzers," (protocol No. 2), June 1978. Available from U.S.Environmental Protection Agency, Environmental MonitoringSystems Laboratory (MD-77), Research Triangle Park, NorthCarolina 27711.
2. G. 0. Nelson, Controlled Test Atmospheres, (Ann Arbor SciencePublishers, Inc., Ann Arbor 1971).
3. EPA-600/4-77-027aQuality Assurance HandbookFor Air Pollution Measurement SystemsVolume II - Ambient Air Specific Methods
This document can be obtained from:
U.S. Environmental Protection Agency Office ofResearch and Development E.M.S.L.Research Triangle Park, North Carolina 27711
*-AC*** End of Manual *****
c-2


