Danvers High Street I-1 District Plan High Street I-1 District Plan 5/9/2017 Welcome! Danvers High...
52
Community Meeting May 9 th , 2017 Danvers High Street I-1 District Plan Planning for the Future of Downtown Danvers
Transcript of Danvers High Street I-1 District Plan High Street I-1 District Plan 5/9/2017 Welcome! Danvers High...

Community Meeting
May 9th, 2017
Danvers High Street I-1 District PlanPlanning for the Future of Downtown Danvers

Margaret ZilinskyKaren NelsonSusan Fletcher
Welcome!Town of Danvers
MAPC
Sam Cleaves, AICPJosh Fiala, AICP AIA LEED APChris Kuschel, AICP
Danvers High Street I-1 District Plan 5/9/2017

Meeting Agenda
7:30 PM
7:35 PM
7:40PM
7:50PM
8:20 PM
9:20 PM
Welcome
Study Introduction
Your Experience on High Street
MAPC Presentation
Small Group Exercises
Report Back and Closing
Challenges and Opportunities
Study Area Information, Current District Conditions, Challenges and Opportunities
District Vision, Vision Imagery, District Concept Plan
Danvers High Street I-1 District Plan 5/9/2017

Welcome!
Danvers High Street I-1 District Plan 5/9/2017

The Role of Downtowns in the Region
Danvers High Street I-1 District Plan 5/9/2017

Study Area Boundary
Danvers High Street I-1 District Plan 5/9/2017
Town of Danvers
High Street I-1 District
Maple Street District
PutnamvilleReservoir
Tapleyville District

Study Area Boundary
Danvers High Street I-1 District Plan 5/9/2017

Study Area Boundary
Danvers High Street I-1 District Plan 5/9/2017

Study Area Boundary
Danvers High Street I-1 District Plan 5/9/2017

Study Scope and Schedule
Defining a Vision and Potential Scenarios
Danvers High Street I-1 District Plan 5/9/2017
Phase 1 Phase 2 Phase 3 Phase 4Finalize Existing Conditions
Community Workshop and Scenarios
Illustrative District Plan and Recommendations
Final Report and Presentation
APRIL/MAY MAY/JUNE JULY/AUGUST AUGUST/SEPTEMBER1 2 3 4
• Draft Report• Final Report• Final Presentation
• Illustrative District Plan
• Zoning Recommendations
• Design Guideline Recommendations
• Community Meeting
• Community Vision Statement
• Community Scenarios and Illustrations
• Review Recent Studies
• Analysis of Land Use and Patterns
• 3D Digital Model• Composite Mapping

Your Experience on High Street
Challenges and Opportunities
Danvers High Street I-1 District Plan 5/9/2017

MAPC Presentation
Study Area Information
Current District Conditions
Challenges and Opportunities
Danvers High Street I-1 District Plan 5/9/2017

Study Area Information
Demographic Context
Danvers High Street I-1 District Plan 5/9/2017

24,174 25,21226,493
28,31630,240
20,000
30,000
40,000
1990 2000 2010 2020 2030
Danvers Recent & Projected Population, 1990-2030
Census Stronger Region
Source: U.S. Census, MAPC Population and Housing Demand Projections, 2014
2,5102010 Population
of Focus Area (Aggregated Census
Block Groups)
9%Focus area as % of Danvers
2010 Population (Aggregated Census
Block Groups)
+7%Average projected town
population growth per decade 2010-2030
Demographic Context Population

Demographic Context Population
Source: U.S. Census, MAPC Population and Housing Demand Projections, 2014
0%10%20%30%40%50%60%70%80%90%
100%
2010 2020 2030
Danvers Projected Population by Age
2010-2030
00-14 15-29 30-4445-59 60-74 75+
411
412
532
625
333
197
0 200 400 600
<14
15-29
30-44
45-59
60-74
75+
Focus Area Population by Age(Similar distribution to town as a whole)

Demographic Context Households
8,7919,544
10,61511,731
12,849
5,000
7,000
9,000
11,000
13,000
15,000
1990 2000 2010 2020 2030
Danvers Recent & Projected Total Households 1990-2030
Census Stronger Region
1,116New households in Danvers 2010-2020
1,118New households in Danvers 2020-2030
+10%Average projected town
household growth per decade 2010-2030
Source: U.S. Census, MAPC Population and Housing Demand Projections, 2014

Demographic Context Housing + Income
RenterOwnerEstimated 64% Units
Owner Occupied(Aggregated Census
Block Groups)
$100,000$150,000$200,000$250,000$300,000$350,000$400,000$450,000$500,000
Danvers Median Home Sales Prices, 1995-2015 (Adjusted to 2015 dollars) 2015: $381,000
Source: The Warren Group 2016 (top) and ACS 5-Year Estimates, 2010-2014 (bottom)
1,072Estimated Housing Units for Aggregated Block Groups

Demographic Context Housing + Income
Estimated Cost-burdened households
for Census Tract:
38%of households pay more than 30% of their income
on housing
Estimated Median Household Income Range for Aggregated
Census Block Groups:
$60,000 to
$74,999
Source: ACS 5-Year Estimates, 2010-2014 (bottom)
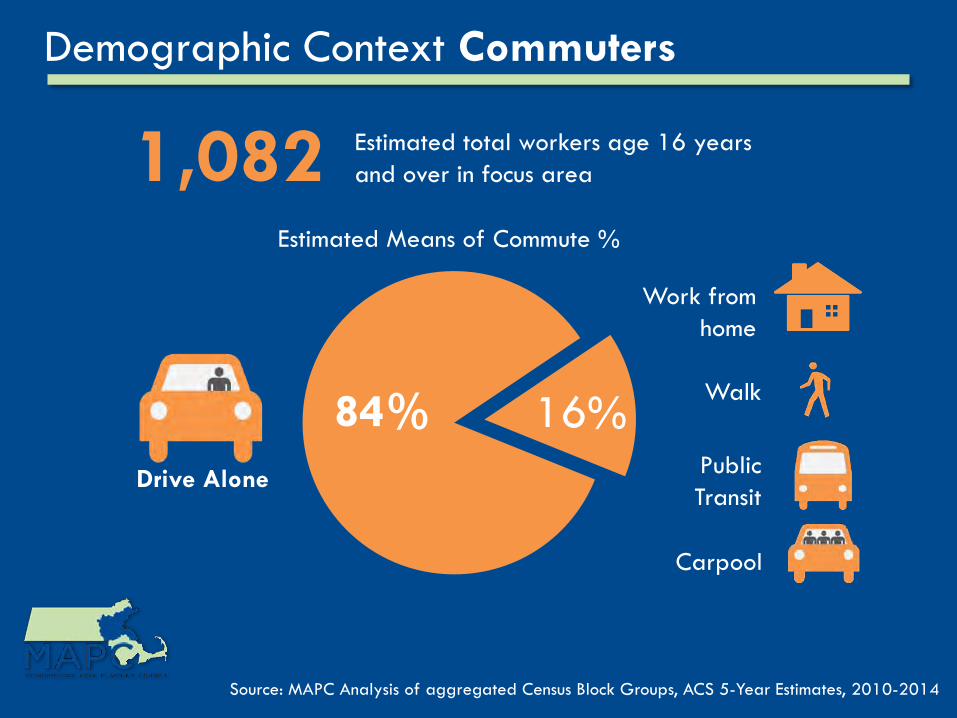
Demographic Context Commuters
1,082 Estimated total workers age 16 years and over in focus area
Source: MAPC Analysis of aggregated Census Block Groups, ACS 5-Year Estimates, 2010-2014
Work from home
Walk
Public Transit
84% 16%
Estimated Means of Commute %
Carpool
Drive Alone

Report Title Date Critical Information
Future Vision Plan – MapleStreet I-1 District
(Brovitz Community Planning & Design with Dodson & Flinker Assoc. completed three most recent Maple Street I-1 District studies/products)
2016 Vision Statement (summarized) – new investment in residential, commercial, mixed use development to accommodate incremental growth, high quality, and sustainable development with viable transportation alternatives and easy civic and recreational access.Guiding Principles include: revitalization and infill development; improving the public streetscape; rationalizing access, circulation and parking; complement other uses in the Downtown area
Design Standards – Maple Street Traditional Development Overlay District
2016 The Design Standards companion to the overlay zoning district for Maple Street, in support of the vision statement
Placemaking Audit Existing Conditions – Maple Street I-1
2015 Analysis of the existing conditions of the Maple Street I-1 District – background, land use, key properties, relevant resources, zoning, challenges and opportunities
Danvers Maple Street I-1 District Action Plan
2015 MAPC Study of zoning, housing, and complete streets recommendations to increase opportunities in Downtown Danvers
Summary Previous Studies/Reports
Danvers High Street I-1 District Plan 5/9/2017
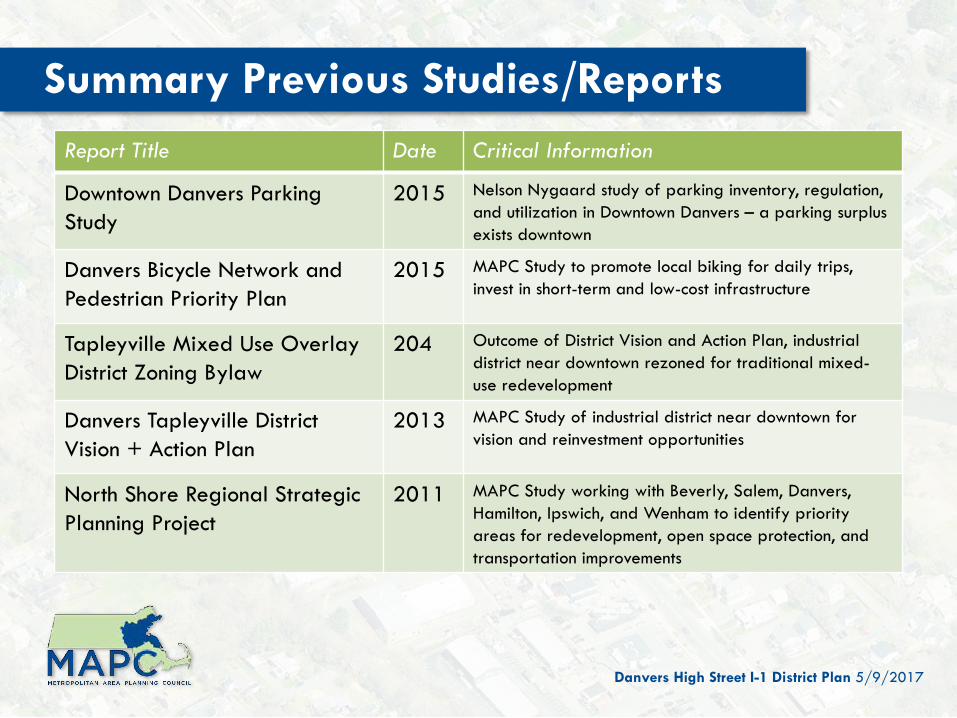
Report Title Date Critical Information
Downtown Danvers Parking Study
2015 Nelson Nygaard study of parking inventory, regulation, and utilization in Downtown Danvers – a parking surplus exists downtown
Danvers Bicycle Network and Pedestrian Priority Plan
2015 MAPC Study to promote local biking for daily trips,invest in short-term and low-cost infrastructure
Tapleyville Mixed Use Overlay District Zoning Bylaw
204 Outcome of District Vision and Action Plan, industrial district near downtown rezoned for traditional mixed-use redevelopment
Danvers Tapleyville District Vision + Action Plan
2013 MAPC Study of industrial district near downtown for vision and reinvestment opportunities
North Shore Regional Strategic Planning Project
2011 MAPC Study working with Beverly, Salem, Danvers, Hamilton, Ipswich, and Wenham to identify priority areas for redevelopment, open space protection, and transportation improvements
Summary Previous Studies/Reports
Danvers High Street I-1 District Plan 5/9/2017

Report Title Date Critical Information
Study on Housing Needs in Downtown Danvers
2010 Prepared under DHCD’s Downtown Initiative, showed that Downtown Danvers provides an excellent opportunity for affordable housing
Danvers Mixed-use Industrial One (I-1) Study
2009 MAPC Study analyzing conversion of industrial zoned districts to commercial and mixed-use districts
Visual Preference Survey Exercise
2007 Community preferences for design for Downtown and Danversport reflected preferences for modestly scaled and traditional mixed-use development
Danvers Zoning Bylaw Report 2006 High Street I-1 is critical gateway to downtown and opportunity for reinvestment
Danvers Community & EconomicDevelopment Plan
2004 Create neighborhood business districts to allow 2-3 story mixed use and expand downtown’s role in Danvers
Summary Previous Studies/Reports
Danvers High Street I-1 District Plan 5/9/2017

Current District Conditions
Danvers High Street I-1 District Plan 5/9/2017

Current District Conditions
Danvers High Street I-1 District Plan 5/9/2017

Current Zoning
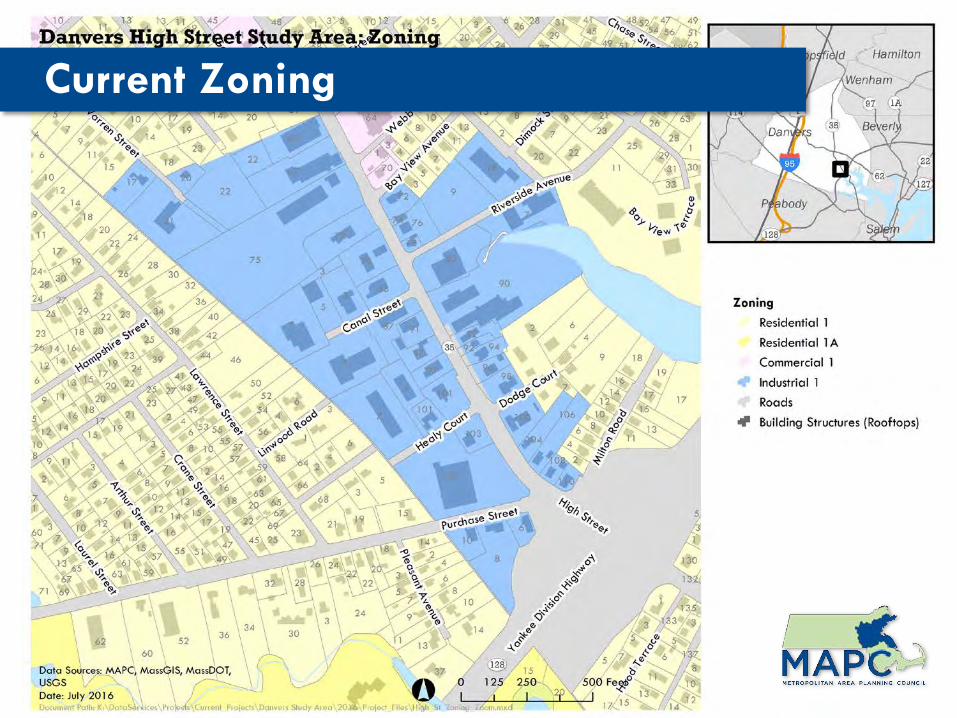
Current Zoning

Current District Conditions
48 parcels with 54 structures
Total area of 1,601,113 square feet (sf) or 36.76 acres
Total District Area is divided among:• Open land – 601,735 sf or 38%• Parking/paved surface – 585,813 sf or 37%• Building footprints – 227,741 sf or 14%• Streets – 140,644 sf or 8%• Sidewalks – 24,823 sf or 2%• Water body – 20,357 sf or 1%
Danvers High Street I-1 District Plan 5/9/2017

Current District Conditions
Open Land and Open Spaces
Danvers High Street I-1 District Plan 5/9/2017
38%
Open land – 601,735 sf or 38%

Current District Conditions
Parking and Paved Surfaces
Danvers High Street I-1 District Plan 5/9/2017
37%
Parking/paved surface – 585,813 sf or 37%

Current District Conditions
Building Footprints
Danvers High Street I-1 District Plan 5/9/2017
14%
Building footprints – 227,741 sf or 14%

Current District Conditions
Streets
Danvers High Street I-1 District Plan 5/9/2017
8%
Streets – 140,644 sf or 8%

Current District Conditions
Sidewalks
Danvers High Street I-1 District Plan 5/9/2017
2%
Sidewalks – 24,823 sf or 2%

Current District Conditions
Water Body
Danvers High Street I-1 District Plan 5/9/2017
1%
Water body – 20,357 sf or 1%

Current Land Use
Danvers High Street I-1 District Plan 5/9/2017
LegendCommercial – RetailCommercial – OfficeLight IndustrialMixed-useResidential – Multi-familyResidential – Single-familyUtilityVacant

Current Building Types
Danvers High Street I-1 District Plan 5/9/2017
LegendSingle-Family HouseMulti-Family HouseSmall Commercial Building(Less than 5,000 Square Feet)Mid-scale Commercial/Industrial Building(5,000-19,999 Square Feet)Moderate-scale Commercial Building (20,000+ Square Feet)

Current Building TypesSingle-Family House
Multi-Family House
Small Commercial (<5,000 sf)
Mid-scale Comm/Ind (5,000-19,999 sf)
Moderate-scale Comm (20,000+ sf)
Danvers High Street I-1 District Plan 5/9/2017

Current Historic Assets
Danvers High Street I-1 District Plan 5/9/2017
Historic (1840 to 1949)Historically Eligible* (1950 to 1969)Older Building (1970 to 1999)Recent Investment (2000 to 2004)No Building
*Structures older than 50 years old are eligible for the National Register of Historic Places
Year of Building

Current Property Utilization
Danvers High Street I-1 District Plan 5/9/2017
High Utilization –Building value exceeds land value*Low Utilization –Land value exceeds building value*Incomplete Data
*Based on Town of Danvers Assessors Data
Legend

Current Density (Floor Area Ratio)
Danvers High Street I-1 District Plan 5/9/2017
Moderate FAR –1.0 or moreLow FAR –0.5 to 0.99Minimal FAR –
0 to 0.49
Legend

Current Owner Location
Danvers High Street I-1 District Plan 5/9/2017
Owner Occupied*
Owner in Town of Danvers*
Owner in MA*
Owner Out-of-State*
*Based on Town of Danvers Assessors Data comparing “Property Address” to “Owner Billing Address”
Legend

Current Street Types
Danvers High Street I-1 District Plan 5/9/2017
B
C
D
D
D
D
A – Arterial (High Street/Route 35)
B – Connector (Purchase Street)
C – Local Street (Riverside Avenue)
D – Local Access Drive (Dead end)
(Canal Street, Dodge Court,
Healy Court, Warren Street)
(4) Street Types in District
A

Current Street Types
Danvers High Street I-1 District Plan 5/9/2017
A Type A – Arterial (High Street/Route 35) B Type B – Connector (Purchase Street)
C Type C – Local Street (Riverside Avenue) D Type D – Local Access Drive (Dead end)(Canal St, Dodge Ct, Healy Ct, Warren St)
+/- 44’
(4) Vehicle Lanes, Lawn Strip, and Sidewalks, About 65’ total width from back of sidewalk
(2) Vehicle Lanes, no other infrastructureAbout 26’ total width of street pavement
(2) Vehicle Lanes, Landscape, and Sidewalks, About 50’ total width from back of sidewalk
(2) Vehicle Lanes, some landscape, some segments of sidewalk, Varies between 18’ and 30’ total width of street pavement
+/- 38’
+/- 26’
+/- 24’ (average)

Challenges and Opportunities
Challenges
Danvers High Street I-1 District Plan 5/9/2017
A – Limited marked pedestrian crossingsB – Parking is dominant visual feature of frontageC – Limited connecting roads/blocksD – Overhead electric utilitiesE – Inconsistent streetscape/street trees
Legend
F
J
CH
C
AB
DE
G
F – Lack of bicycle infrastructureG – Signs sized for vehiclesH – No coordination across property linesI – River setback constraintsJ – Property depth constraints
I

Challenges and Opportunities
Opportunities
Danvers High Street I-1 District Plan 5/9/2017
A – Plant street trees in landscape stripsB – Access to riverC – Opportunity for rail trailD – New development opportunityE – Reduce curb cut width and frequency
Legend
B
D
F – Potential for parcel assembly/larger redevelopmentG – Improve relationships/ efficiency between parcelsH – Add bicycle infrastructureI – Preservation opportunities
GC
AE
H
D
G
FF
F
F
F
I

Challenges and Opportunities
Composite
Danvers High Street I-1 District Plan 5/9/2017
LegendChallenges
Opportunities

Small Group Exercises
#1 District Vision
#2 Vision Imagery
#3 District Concept Plan
Danvers High Street I-1 District Plan 5/9/2017

DevelopmentConnections
Housing
Vision Components
Small Group Exercises
Danvers High Street I-1 District Plan 5/9/2017

#1 Craft a District Vision Statement
Danvers High Street I-1 District Plan 5/9/2017
1. Use a few sentences to
describe a shared group
vision
2. Use a few bullets to
outline goals or
priorities for the vision

#2 Select Vision Imagery
Danvers High Street I-1 District Plan 5/9/2017
With your vision established:
1. Select images that the
group agrees are
consistent with the vision
2. Tape images onto the
board according to
category

#3 Design a District Concept
Danvers High Street I-1 District Plan 5/9/2017
With your vision established:
1. Select investments or
improvements that the
group agrees are
consistent with the vision
2. Tape diagrams where
desired on district map

Report Back and Closing
Thank you for Your Participation!Additional information can be found at:
www.danversma.gov
Danvers High Street I-1 District Plan 5/9/2017

Community Meeting
May 9th, 2017
Danvers High Street I-1 District PlanPlanning for the Future of Downtown Danvers